
Abstract
The monitoring of intracranial pressure (ICP) is an important tool in medicine for its ability to portray the brain’s compliance status. The bedside monitor displays the ICP waveform and intermittent mean values to guide physicians in the management of patients, particularly those having sustained a traumatic brain injury. Researchers in the fields of engineering and physics have investigated various mathematical analysis techniques applicable to the waveform in order to extract additional diagnostic and prognostic information, although they largely remain limited to research applications. The purpose of this review is to present the current techniques used to monitor and interpret ICP and explore the potential of using advanced mathematical techniques to provide information about system perturbations from states of homeostasis. We discuss the limits of each proposed technique and we propose that nonlinear analysis could be a reliable approach to describe ICP signals over time, with the fractal dimension as a potential predictive clinically meaningful biomarker. Our goal is to stimulate translational research that can move modern analysis of ICP using these techniques into widespread practical use, and to investigate to the clinical utility of a tool capable of simplifying multiple variables obtained from various sensors.
Keywords
Introduction
Intracranial pressure (ICP) is the most commonly monitored brain-specific physiologic parameter in the neurocritical care unit (Hemphill and others 2011). ICP arises from the volumetric contributions of uncompressible tissues within the skull, including cerebral blood volume, cerebrospinal fluid volume, and brain matter. When abnormal matter accumulates in the enclosed skull (e.g., hematomas, tumors), the pressure equilibrium within the head is initially maintained by auto-regulatory processes that promote a compensatory shift of cerebral blood volume and cerebrospinal fluid volume outside the head. On system disruption, the processes are ultimately exhausted and breakdown often ensues. The skull is a rigid compartment that does not easily accommodate any additional matter thus when equilibrium is lost, any additional swelling is manifested as a rise in ICP. Uncontrolled elevations in mean ICP are associated with cerebral ischemia, neurological deficit and death; however, in many cases it is unclear whether raised ICP is a primary or secondary manifestation of the pathological process. Most neurological intensive care efforts are aimed at treating patients with intracranial hypertension (Greenberg 2006) in order to optimize patient outcome (Juul and others 2000; Kim 2011; Marmarou and others 1991; Mayer and Chong 2002).
To measure ICP, pressure transducers are inserted within the intracranial spaces, notably the subdural, intraparenchymal, epidural, and lateral ventricular regions.The values are then displayed on a bedside monitor. The normal ICP values fall in an interval of 0 to 15 mm Hg (Cecil and others 2011; Greenberg 2006). Although 15, 20, and 25 mm Hg have been quoted, most centers use ICP values of 20 to 25 mm Hg as the upper limit over which treatment should be initiated (The Brain Trauma Foundation 2007). Variations have been recorded according to age, with young children having a normal range of ICP between 3 and 7 mm Hg and with term infants of 1.5 to 6.0 mm Hg (Greenberg 2006; Welch 1980). ICP values change in relation to several pathologies and physiological states such as the Valsalva maneuver, sneezing, coughing, and certain forced body movements against resistance. Clinicians monitor ICP primarily in patients who are comatose and in need of intensive care for indication of abnormal deviations ascribed to a variety of types of primary and secondary brain damage such as trauma or stroke, as well as worsening neurological status, which is otherwise undetectable by clinical examination.
Although mean ICP has proven to be a useful parameter in defining prognosis (The Brain Trauma Foundation 2007), a major limitation of using the mean value is that it does not incorporate information from the different interacting body systems that are ultimately involved in creating ICP and its variations. Modern bedside intensive care unit monitors can allow clinicians to observe several physiological variables (e.g., body and/or brain temperature, brain oxygenation, electrocardiography, breath cycle) that are related to the clinical state of the patient at any given time (Greenberg 2006). To fully grasp the pathophysiology of patients with brain damage, the emphasis of therapy is placed on monitoring a multitude of parameters in adjunct to ICP (Low and others 2009), rather than on one sole parameter. The clinician who aims to develop a holistic understanding of the patient has to simultaneously process large amounts of data from different physiological measures. Considerable variability in the ability to process these multiple parameters exists between physicians depending on factors such as clinician experience, multitasking ability and fatigue. Systems that assist the clinician in the care of patients should help simplify the ability to interpret multiple simultaneous variables in real time and be able to clearly and accurately identify and alert clinicians to deviations from the normal physiological state.
If the past and present use of ICP has been for analysis of the absolute values and for qualitative analysis of its waveform, ICP has been recently added to the list of physiological signals to be investigated by means of advanced mathematical techniques in order to perform quantitative analyses of the waveform itself. Researchers in the fields of engineering and physics have investigated various mathematical analysis techniques applicable to the waveform in order to extract additional diagnostic and prognostic information, although they largely remain limited to research applications. The purpose of this review is to present the advantages and limitations of current clinical techniques to monitor and interpret ICP time series and explore their potential to provide information about system perturbations from states of homeostasis. Analyses of nonlinear dynamics have been introduced to evaluate the variability within physiological system signals through various mathematical methods and may ascertain to be a reliable approach to describe ICP signals over time (Bravi and others 2011). Our goals are to stimulate translational research that can move the modern analysis of ICP using these techniques into widespread practical use and to investigate whether such systems could automatically collect and fuse qualitative and quantitative data into the smallest number of signals that the clinician has to interpret. Such system would provide a method to deal with multiple parameters obtained from various sensors and convey deviations from normal state conditions. The analysis of pathophysiological parameters should be finally aimed to finding new clinically meaningful biomarkers.
Past and Present State-of-the-Art ICP Analysis
Morphology of ICP Waveform
ICP waveforms are the result of three distinct components: the pulse waveform, the respiratory waveform, and the slow waveform (Cardoso and others 1983). These components are concomitant with the frequency of the wave, and are thus denoted the harmonic components. The pulse waveform is composed of the arterial and venous pressure waves (Andrews and Citerio 2004), which arise from the cardiac cycle. The former consists of three distinct peaks that repeat themselves over time: the percussion peak, the tidal peak, and the dicrotic peak (Fig. 1). Changes in the peak amplitudes may be directly related to changes in systemic arterial pressure, brain tissue compliance, or the closure of the aortic valve. For example, in systemic hypertension, the second peak component may be slightly increased, indicating a lack of cerebral compliance (Kirkness and others 2000) along with the baseline pressure of the whole signal (Fig. 1).
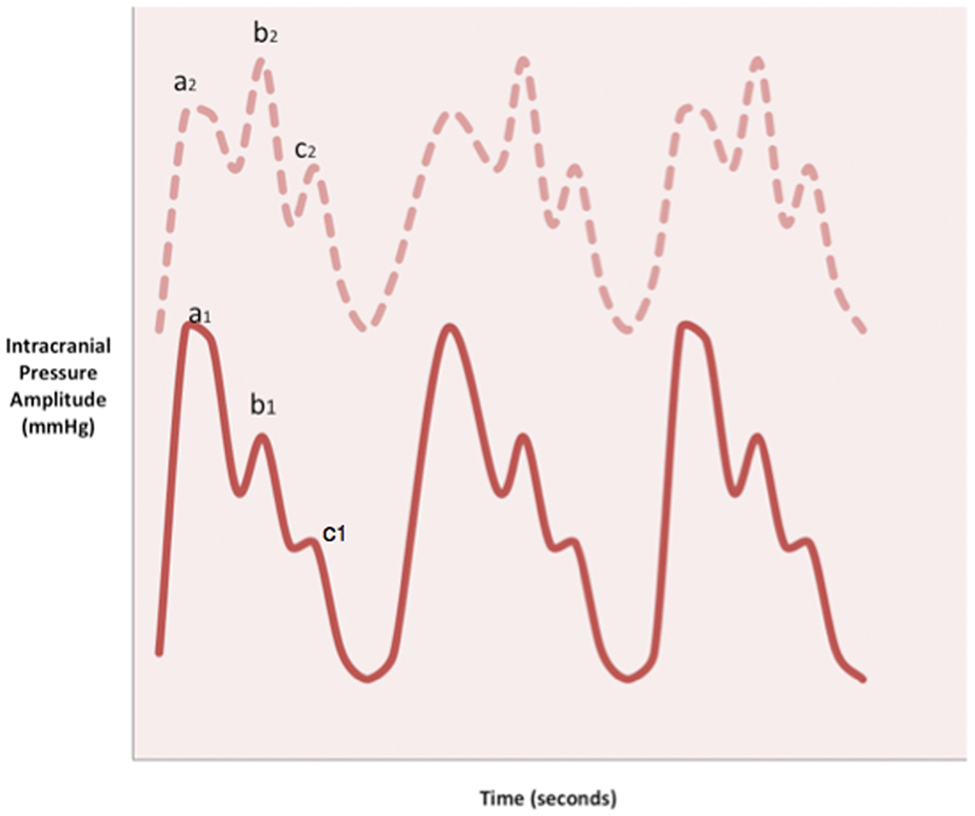
Morphology of the pulse waveform in healthy state (lower solid line) and in disease (upper dashed line). The pulse waveform is closely related to the cardiac rhythm, thus peaks in the waves include the percussion (a1), the tidal (b1), and the dicrotic peak (c1), which correspond to arterial pressure, brain tissue compliance, and closure of the aortic valve, respectively. The marked increase in baseline pressure and rise in the tidal peak (b2) is indicative of a decrease in cerebral compliance, a common phenomenon in brain trauma.
In 1965, Lundberg described and classified a series of ICP waves into A, B, and C wave patterns (Lundberg 1960). A waves or plateau waves are associated with an abrupt rise in ICP and sustenance of ICP over 50 mm Hg for 5 to 20 minutes (Greenberg 2006). These pathological waves are indicative of diminished brain compliance (Castellani and others 2009) and are observed in conditions of inadequate cerebral perfusion pressure and cerebral blood flow (Mayer and Chong 2002). Lundberg also described pressure pulse B waves as slow waves with amplitude of 10 to 20 mm Hg related to respiratory changes and Traube-Hering C waves, resulting from the interaction between cardiac and respiratory signals at a frequency of 4 to 8 oscillations per minute (Andrews and Citerio 2004; Greenberg 2006). Others have since shown that the ICP waveform superimposed on the respiratory variation waves may be useful in identifying changes in brain compliance (Czosnyka and Pickard 2004). Authors have concluded that there are differences in the slope of the systolic waveform during inspiration compared with the waveform during expiration in a study of patients with traumatic brain injury (TBI; Westhout and others 2008). Slow waves fall in the frequency limits of 0.05 to 0.0055 Hz (Czosnyka and Pickard 2004). It is of interest to evaluate them in light of dynamic auto-regulation and and their low content in the overall ICP dynamics since have shown that they are associated with a fatal outcome in patients with TBI (Balestreri and others 2004). Lemaire and others (2002) reviewed in detail the features of the slow waves. The analysis of ICP waveforms may be used in assessing brain tissue compliance to provide insight into the clinical state of the patient, although current interpretation remains highly subjective. New and more objective techniques are required to allow real-time, bedside analyses and interpretation of ICP, especially in relation to other related physiological parameters and/or to the clinical outcome of the patient as well as to drive any potential specific treatments.
Current and Forthcoming Advanced Techniques of ICP Analysis
Biological Signal Processing: Analysis of Waveform Morphology over Time and Frequency Domains
It is known that fluctuations in biomedical signals are reflective of their underlying stochastic and deterministic components (Pincus 2001), and that their dynamic behavior is representative of their constantly changing intrinsic environment. Although the signal may appear chaotic, it is still possible to identify and classify patterns. The ICP waveform arises from a number of interacting distinctive, physiological processes acting in concert over time and essentially represents a “time series” signal. The morphology of the waveform has been analyzed over time by averaging values or by means of a detailed analysis of the frequencies or “harmonics” found in the waveform (Holm and Eide 2008). From a variability analysis perspective, it is possible to exploit the various patterns that might be found within the ICP signal and determine their rate of occurrence, or frequency, by employing various mathematical complexity tools. These measures offer an opportunity to characterize the degree of predictability that patterns of ICP may repeat themselves in the time course of the signal. Detecting trends in the signal of these time series would provide the ability to anticipate adverse events. The persistence of specific patterns or appearance of pathological patterns would provide a greater understanding of a patient’s underlying physiological status (Pincus 2001) to successfully guide therapy.
Time domain
In a study of patients with TBI, O’Phelan and others (2009) concluded that ICP displays distinctive patterns over time. A review article suggests the necessity of defining the patterns of ICP and assigning a predictive value of its time course (Czosnyka and Pickard 2004). Contemporary monitors display the mean values of ICP in units of millimeters of mercury (mm Hg) averaged over short intervals of time. Simple statistics such as the standard deviation and variance could also be computed over the same time intervals (Seely and Macklem 2004). The time course following surgery (Belotti and others 2001) and TBI (Stocchetti and others 2007), measured by simple statistics, often results in dangerously increased ICP. Thus, clinical interventions focus on controlling and reducing mean ICP values in patients with higher ICP (Mayer and Chong 2002). Mean ICP values do not reflect the dynamic characteristics of the constituent waves (Eide 2006) and are also prone to error introduced by environmental perturbations as well as the techniques of measurement (Seely and Macklem 2004). Moreover, ICP mean wave amplitude is referred to as the amplitude of the ICP wave’s single pulse frequency component, which stems from the cardiac cycle. To adhere to the limitations of mean ICP (Santamarta and others 2010), it is suggested that research focused on identifying the pulse wave within the ICP waveform in order to compute the mean wave amplitude would be a more accurate and conclusive method for describing intracranial compliance and predicting outcome (Eide 2006; Eide and others 2012).
Frequency domain
The analysis of the frequency domain of ICP morphology consists of the interpretation of the harmonic components of the ICP waveform (Czosnyka and Pickard 2004). The harmonic components of ICP are obtained by means of a mathematical transformation, first described by Jean Baptiste Joseph Fourier (1768–1830). The fast Fourier transform allows the identification and isolation of single waves from the sum of the whole spectrum, a process called spectral analysis. The Fast Fourier Transform has long been used in the evaluation of the ICP waveform to characterize brain compliance (Robertson and others 1989) by transforming data from the time to the frequency domain. The class of analysis may be more reliable than an analysis of ICP averaged over time (Seely and Macklem 2004). “Wavelet” analysis is another way to decompose the complex complete ICP waveform into isolated components (Heissler and others 2012; Morgalla and others 1999). Wavelet methodologies allow the continuous evaluation of change in variability over time (Seely and Macklem 2004) rather than constricting time-dependent values of ICP into one mean value, as do the presently used methods of evaluating ICP over time. Thus, it is fair to conclude that this type of analysis encompasses the nonstationary features of the signal.
Limitations of morphological analysis of ICP
The analysis, description, and interpretation of ICP are prone to a number of technical factors that introduce error. Present systems have great difficulty in detecting discrete ICP pulse signals or peaks within an irregular waveform. Often, when there is a rise in reference ICP, the distinct subcomponents of the pulse waveform morph together to achieve a more “rounded” appearance (Cardoso and others 1983). Furthermore, present techniques are limited in their ability to differentiate artifacts caused by spontaneous postural changes, patient movement, movement of hardware connections, drift of the monitor, friction between the pressure transducer and the adjacent intracranial tissue, and movements related to volume changes from the signal of interest (Heissler and others 2012). This inability to distinguish noise from the signal of interest introduces unwanted error and ultimately unreliable data for clinical management (Shields and others 1984). Recent research in this area is aimed at applying mathematical algorithms to enhance the quality of the intracranial pressure signal and identify the intracranial pressure peaks that provide the basis for analysis and interpretation (Aboy and others 2001; Hamilton and others 2009; Hu and others 2009; Scalzo and others 2011). By detecting the peak signals, it is possible to analyze alterations in the configurations of the subpeaks and determine not only the amplitude-related features of ICP but the time intervals of the subpeaks as well (Hu and others 2009). The ability to accurately detect such features within a signal offers the basis for interpretation with important implications in medicine.
ICP-Derived Indexes and Auto-Regulatory Capacity
In addition to analyzing the waveform based on the time and the frequency domain, secondary indexes that may estimate the onset of intracranial disturbance have been explored in the research setting. Since the late 1970s, methods of estimating intracranial decompensation and elastance capacity have been suggested. Authors have proposed that changes of slope in mean ICP and standard deviation regression plots (Szewczykowski and others 1976), and in the intersection between the linear slopes of baseline ICP and ICP pulse-amplitude (Szewczykowski and others 1977) are indicative of alterations in intracranial dynamics. More recently, secondary indices have been primarily derived from the mean values and the mean wave amplitudes of ICP. In parallel to the Monro–Kellie doctrine, the pressure–volume curve may be represented by the regression of amplitude and pressure (RAP) coefficient, a measure of correlation between ICP and the amplitude of the pulse waveform, that is, an index of cerebrospinal compensatory reserve (Czosnyka and Pickard 2004) (Fig. 2). Cerebrovascular pressure reactivity, which “reflects the capability of smooth muscle tone in the walls of cerebral arteries and arterioles to react to changes in transmural pressure” may be another measure of neurological compensation (Fan and others 2010; Zweifel and others 2008). Czosnyka and Pickard described the pressure-reactivity index (PRx) to denote the correlation coefficient of arterial blood pressure (ABP) and mean ICP. The PRx is commonly used in research and may be predictive of poor outcome after TBI (Eide and others 2012; Fan and others 2010; Zweifel and others 2008), although such results have not been translational across all populations with neurological deficits. Thus, the authors of a recent preliminary study verified that the pressure-related index of PRx, along with oxygen and flow-related indices, yielded a weak and insignificant correlation to outcome in patients with subarachnoid hemorrhage (Barth and others 2010). The PRx was tested against the ICP–ABP wave amplitude correlation, an index of correlation between ICP pulse pressure and ABP waveform amplitudes (Eide and others 2007; Eide and others 2010), for its relation to earlier clinical state and 12-month outcome in patients with subarachnoid hemorrhage (Eide and others 2012). The authors noted the utility of exploring this index, to be waveform amplitude analysis has been concluded of a more effective method of analyzing ICP time series and reflecting cerebral auto regulatory disruption, compared with static values. The ICP–ABP wave amplitude correlation addressed the limits of the PRx by distinguishing groups based on level of independence among survivors and nonsurvivors in addition to short- and long-term outcomes in this patient population. These indices may provide useful information to clinicians if they can become feasible and validated in forthcoming clinical studies.
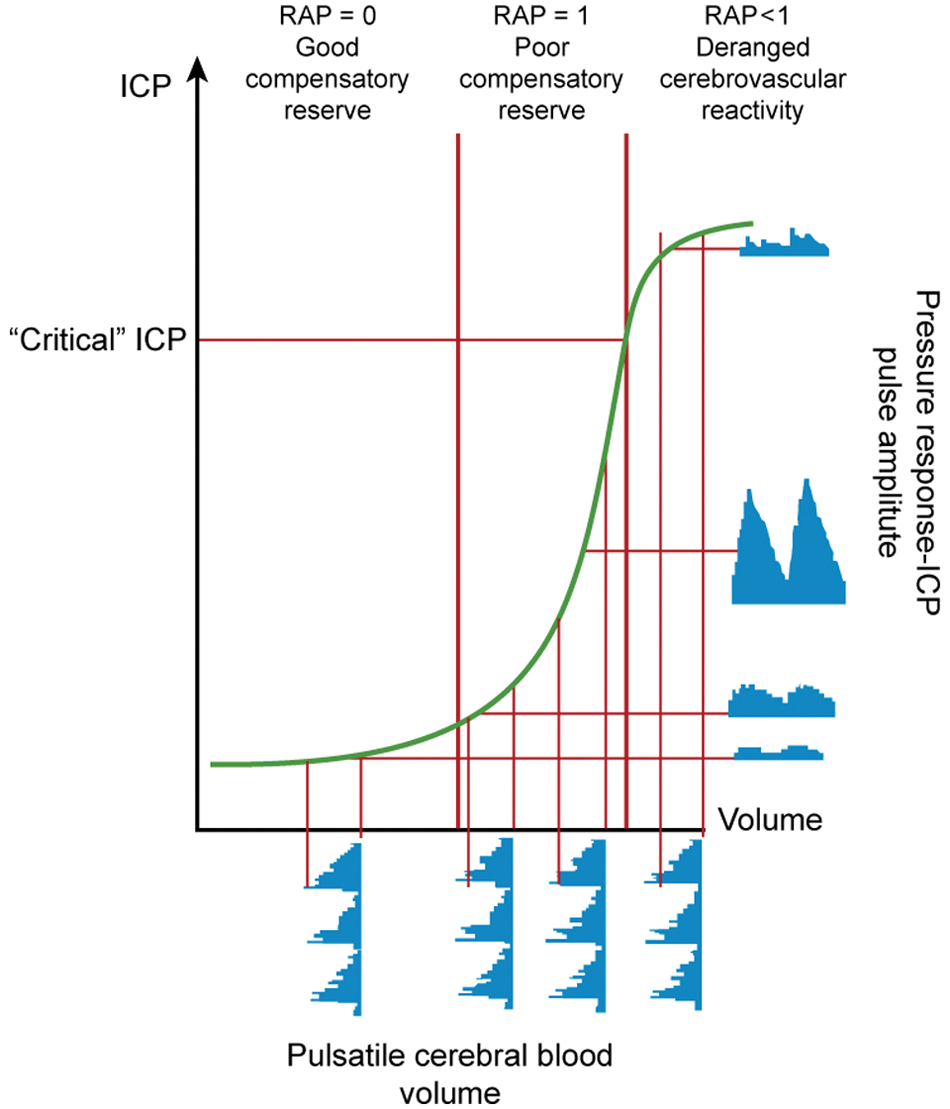
The regression of amplitude and pressure (RAP) index of compensatory reserve, adapted by superimposing the model of brain tissue compensation on the pressure–volume curve. An RAP index of 0 indicates the mobilization of auto-regulatory processes to maintain homeostasis, thus depicting a coordinated relationship between intracranial pressure (ICP) and the pulse amplitude of ICP. A linear relationship (RAP = 1) is seen between the ICP and pulse amplitude during the working moment of the brain’s auto-regulatory capacity. In times of auto-regulatory disruption, the exponential curve depicts an unconstrained limit in intracranial pressure and the RAP index falls below 0. Modified from Czosnyka and others (2004).
Neural Modeling and Neural Dynamics
“An artificial neural network is an information-processing system that has certain performance characteristics in common with biological neural networks” (Fausett 1994). The set of mathematical algorithms, or computer-based instructions, offers the possibility to distinguish and classify patterns. By analyzing data retrieved from various sensors, neural networks can learn the properties of existing signals, and combine new data to forecast and provide an output signal. On this basis, artificial neural networks have been suggested for use in medicine since 1980 to identify medical conditions and determine the most appropriate treatment options (outputs) based on entered signs and symptoms (Fausett 1994).
In more recent studies, artificial neural networks have been recommended as an effective method to assess the behavior of the deterministic components of ICP and have shown satisfactory results in predicting trends of the ICP data for a limited time of 3 minutes (Swiercz and others 2000). Mariak and others (2000) have investigated the usefulness of algorithms in classifying and discriminating changes in the global properties of ICP. In addition, the simple recurrent neural network through time was modeled to provide ICP values as an output, when computing the significant contributing factors of alterations in physical state, measured by noninvasive methods in head-injured patients (Shieh and others 2004). Advancements in this field have presented a neural network algorithm as a more reliable method to predict future mean ICP over previous algorithms for its ability to accurately perceive variations in small ICP time frames that are segmented from the whole time series (Zhang and others 2011). Data recorded from head injured patients were analyzed, with the clinical implications to plan medical treatment much in advance to an adverse elevation of mean ICP.
The authors of a previous review have demonstrated the wide application of neural networks in medicine and have listed various clinical fields where the networks have lead to significant clinical diagnosis and outcome prediction (Baxt 1995). In addition, the same authors have demonstrated greater efficiency than traditional statistical methods of analysis, which have “reached their natural limits, mostly because of difficulties in fitting the appropriate mathematical model to the non-linear, non-stationary process, which generates this signal” (Mariak and others 2000). For the above-listed points, it is possible to hypothesize that this technology may have a valuable role in mapping brain physiology and its fundamental dynamics by incorporating various parameters and features of the body’s systems. Neural networks could be useful in communicating the progression of intracranial hypertension in patients with neurological deficits, however, the technology remains a developing field in the domain of computer science and has not yet been accepted in clinical practice.
Analyzing Trends in ICP with Entropy
All the techniques previously used to analyze the variability of time series have the common element of describing “the degree of irregularity/complexity inherent to the order of the elements in a time series” (Bravi and others 2011). The tool to “quantify the amount of regularity in time-series data” has been termed approximate entropy (ApEn; Pincus and others 1991). ApEn is a form of entropy and statistic that is capable of reflecting signal randomness and pattern generations. In intracranial pressure analysis, ApEn (Pincus 2001), along with the Lempel–Ziv (LZ) compression entropy measure (Lempel and Ziv 1976), has been applied to evaluate the acute changes in the ICP signal in pediatric patients sustaining severe TBI and to determine the correlation with the mean ICP over time (Hornero and others 2005; Hornero and others 2006; Hornero and others 2007). ApEn is defined as “the negative natural logarithm of the conditional probability that a dataset of length N ( . . . ) will repeat itself again” (Bravi and others 2011). In short, ApEn evaluates a series of data for developing new patterns and the rate of their recurrence throughout the sequence (Seely and Macklem 2004). The LZ compression entropy measure is defined as “a nonparametric measure of complexity for one-dimensional signals related to the number of distinct substrings (i.e., patterns) and the rate of their occurrence along a given sequence” (Hornero and others 2007). The LZ similarly detects newly emerging patterns and replaces the sequences with a shorter reference, to compress the whole data set into smaller sets. Because of the ability to re-create the original data set from the compressed data set, we may infer the change as lossless (Hornero and others 2007). The LZ offers the ability to detect, distinguish, and track the prevalence of patterns in a time series. The authors demonstrated that, in fact, the complexity of ICP decreases during periods of intracranial hypertension (ICH). Such periods are recognized by clinicians as the “plateau wave” and are characterized by persistent elevations of ICP and similar peaks that frequently recur. The increase in regularity in the patterns of ICP in periods of ICH is indicative of secondary brain damage, opposed to increased indiscrimination and randomness of the signal. This finding is also supported in a study of patients with hydrocephalus undergoing lumbar infusion tests, where the LZ complexity measure demonstrated less variability in the pulsatile component of the ICP signal during episodes of ICH (Santamarta and others 2010).
With efforts in quantifying the complexity and the degree of predictability of the time course of ICP, entropy measures have been applied extensively to biomedical signals (Hornero and others 2007). Although other measures of entropy may be more sensitive for time series analysis (Bravi and others 2011; Richman and Moorman 2000), ApEn has been recognized for its ability to detect underlying changes left unnoticed by other analysis techniques, such as statistical time domain and spectral frequency domain analysis (Hornero and others 2005). In addition, the LZ has been extensively applied to estimate the complexity of discrete-time physiologic signals (Aboy and others 2006). Santamarta and others (2010) have noted several studies that address the utility of the LZ complexity in physiological time series, which include measuring the depth of anesthesia in electroencephalogram (EEG) studies (Zhang and others 2001) and estimating the occurrence of ventricular tachycardia and fibrillation in electrocardiography studies (Zhang and others 1999). In current clinical practice, the fluctuations of the ICP signals go undetected and attention is brought merely to the intermittent mean ICP values displayed on the bedside monitor. Efforts in measuring the persistence of signal trends in the waveform could identify certain characteristics that are displayed prior to an adverse event. To this extent, the evaluation of randomness within the ICP signal may have clinical significance should it improve the ability to determine equilibrium perturbations before observing any elevation in mean ICP. Implementing such a system, medicine would give much more leverage to clinicians and supplementary time to strategize the critical care that the patient must receive. In addition, such analysis would provide fundamental insight into the physiological conditions of patients with neurological deterioration and the mechanisms responsible for this process.
Methods of Nonlinear Analysis
In recent years, mathematical analyses have moved from applying classical statistical methods to quantify intracranial pressure signals to present more novel nonlinear approaches. Nonlinearity is a characteristic of living systems with various interacting and underlying components in which slight fluctuations of one sole parameter may substantially influence the resulting system’s signal (Goldberger 1996). On this note, it is possible to conclude that the magnitude of ICP is not directly related to the strength of merely one parameter (Goldberger 1996; Stanley and others 1999), but rather that the physiological systems deviate from the expected linear relationship between ICP and the sum of inputs, to display more apparently erratic and dynamic fluctuations. This tendency poses great difficulty for analysts to fully understand the dynamics of a system signal and, notably, describe its components.
Time series such as the heart rate, respiratory rate, and brain wave dynamics, have recently been studied by means of fractal analysis (Bravi and others 2011). Since the term fractal was first expressed by Mandelbrot in 1967, fractal analysis has been recognized for its “ability to describe the irregular or fragmented shape of natural features as well as other complex objects” (Lopes and Betrouni 2009). In addition to the property of nonlinearity, fractals are described as “an object composed of subunits (and sub-subunits) that resemble the larger scale structure, a property known as self-similarity” (Goldberger 1996).Thus, in theory, the object viewed at a greater level of magnification will resemble the object viewed at a smaller level of magnification (Fig. 3). Moreover, fractals possess the characteristic of infinite length and infinite detail where its underlying metric properties may be measured as a function of the scale of measurement (Lopes and Betrouni 2009).
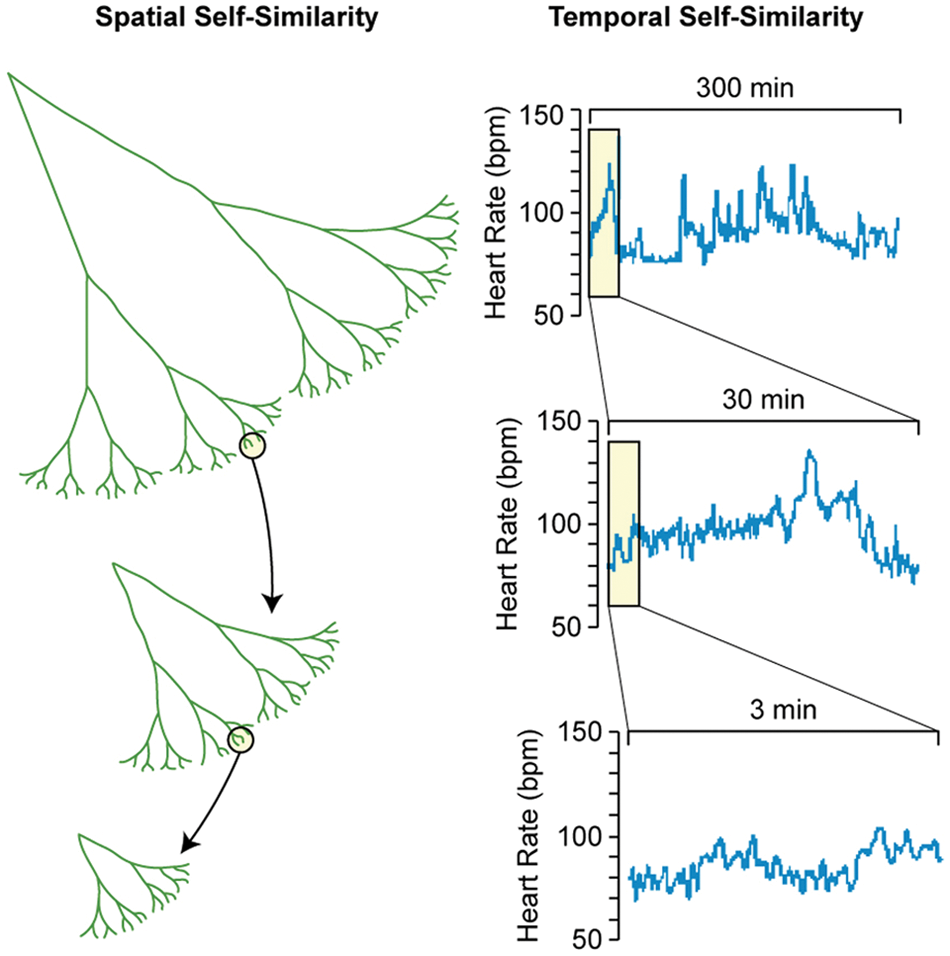
Representation of the property of self-similarity in spatial and in temporal objects. In principle, it is possible to observe the original shape of an object, whether a tree branch (spatial) or a heart rate time series (temporal), when viewing the object at smaller levels of magnification. The property of self-similarity is characteristic of fractals in the biomedical sciences for its ability to describe the variability of an object viewed at all scales of resolution. Modified from Goldberger and others (2002).
Methodology of fractal analysis
The principle of fractal analysis relies mainly on assigning to an object a fractal dimension, or FD. This dimension falls between basic integral dimensions, that is, in between the 0-dimensional (0D) point, the 1D line, the 2D plane, or the cube in the 3D space (Mandelbrot 1982). Additional interchangeable quantitative parameters and parametric characteristics of time series fractal analysis, as recently described in the fractal analysis literature, include the Hurst coefficient H, the power exponent β, the scaling exponent α, and the fractional differencing parameter (Stadnitski 2012). Various mathematical methods and algorithms are used to compute the FD, which differ in a theoretical point of view by the objective of the analysis and the data of interest (Kenkel and Walker 1996; Lopes and Betrouni 2009). The FD is calculated by superimposing a series of cells (e.g., squares, circles, rulers) on the time series to further count the number of cells that intersect with the waveform. The process is repeated by superimposing the same type of cells in a crescendo of sizes ϵ, or of resolutions, on the waveform. In principle, the number of cells the waveform occupies N(ϵ) would vary proportionately with the size of the cells ϵ (Fig. 4). Additionally, this relationship would depend on the shape of waveform. The FD is implemented to describe variability within a shape, or a waveform, and corresponds to the slope of the log N(ϵ) versus log ϵ graph. Many methods have been proposed for the estimation of FD and despite that all maintain satisfactory results with intrinsic pros and cons (Lopes and Betrouni 2009), the box-counting method is the most widely used algorithm in the biomedical sciences. The circle method used to determine the fractal dimension of time series is illustrated in Figure 4. The various methods that have been developed to measure fractality have been summarized and classified in a recent review (Bravi and others 2011). Fractal analysis is deemed a far more descriptive complexity measure of natural phenomenon than the former classical analysis (Kenkel and Walker 1996) and is recognized for its ability to describe irregular objects that traditional Euclidean geometry or “classic” mathematical methods fail to analyze (Lopes and Betrouni 2009).
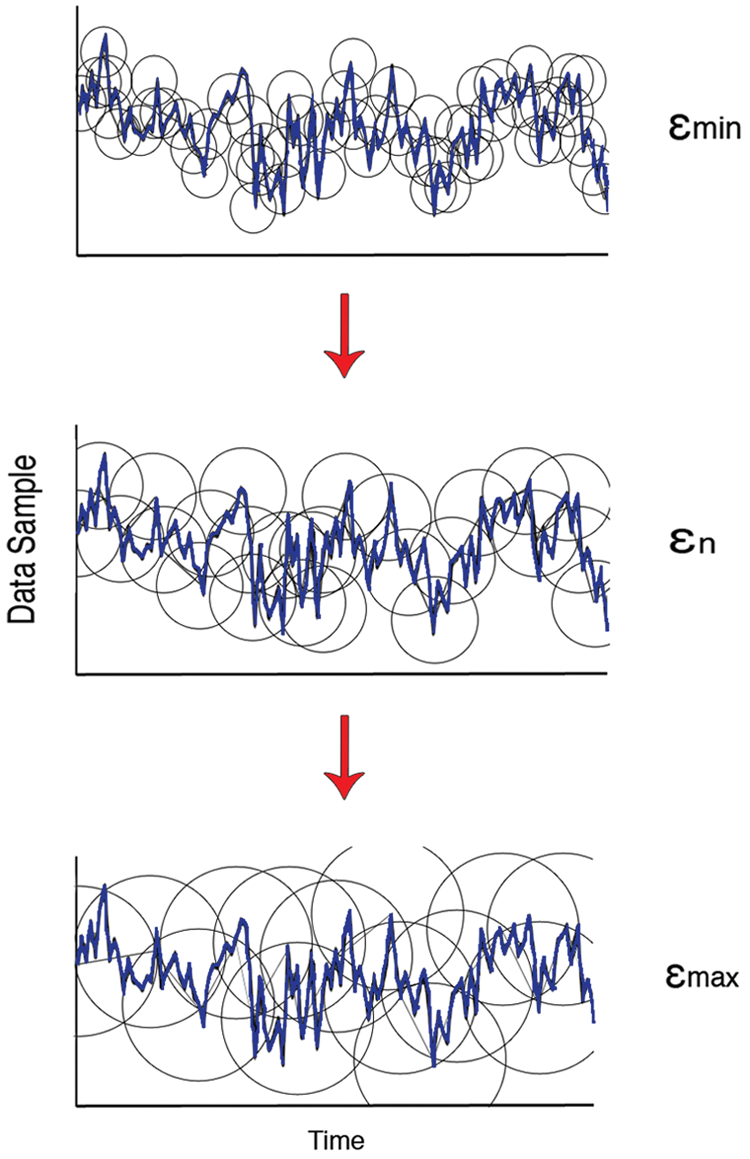
Representation of the circle dimension method to estimate the fractal dimension (FD) of a time series. The method is based on superimposing circle-shaped cells of size ϵ on the time series and counting the number of cells N(ϵ) that intersect with the curve. The relationship between the latter is such as when subdividing the cells into smaller cells, a greater number of cells will intersect with the curve to generate a better estimation of the shape of the curve. The FD is implemented to describe variability within a shape, or a waveform, and corresponds to the slope of the log N(ϵ) versus log ϵ graph. The default of cell range depends on the data of interest in the fractal window of analysis, with ϵmin approaching the lowest resolution and ϵmax approaching the size of the object.
Multifractality
Considering that natural physiologic processes may be far from displaying perfect monofractal behavior (Eke and others 2002), to quantify an entire signal with a single static scaling property derived from fractal analysis would not address the fact that “different parts of the signal have different scaling properties” (Stanley and others 1999). Multifractal analysis encompasses the more complex characteristics of a signal and describes a spectrum of localized fractal dimensions in a running data set (Ivanov and others 1999). Thus, rather than describe an object with one sole parameter, the spectrum is composed of a continuum, or infinity of confined parameters (Kenkel and Walker 1996; Stanley and Meakin 1988). There are many computational methods and approaches to characterize and quantify multifractality (Lopes and Betrouni 2009) and assess the applicability of the technique (Shaw and Piper 2008). There have been few attempts to extend multifractal analysis from biological objects to medical time series. Ivanov and others (1999) investigated heartbeat time series to determine that multifractal analysis could successfully characterize and discriminate between normal and heart failure populations. A review presented several studies addressing monofractal and multifractal features of heartbeat time series and the applicability of this analysis as a diagnostic tool (Havlin and others 1999). Authors have tested the applicability of multifractal analysis in EEG studies (Weiss and others 2009) and applications of the method to successfully distinguish between two states are reported in a recent review (Lopes and Betrouni 2009). Shaw and Piper (2008) extended the analysis to intracranial pressure waves as a study to test whether the mathematical technique of interest could accurately describe the multifractal properties of the signal. The authors tested the monofractal properties and the localized multifractal properties in a research setting to determine that the technique could be applicable, although there were no satisfactory results. Although multifractal analysis is more often seen in cardiac dynamic studies (Havlin and others 1999; Ivanov and others 1999) and EEG studies (Weiss and others 2009), which represent systems too complex or heterogeneous to be described solely by one exponent, future research in this domain would confirm whether intracranial pressure could be added to the list of physiological signals that display multifractal properties. This sort of analysis could lead to a better understanding of the physiological processes within the skull. In addition, by extracting the nonlinear properties from the ICP signal, it would be possible to characterize and distinguish between groups at risk and groups without risk to adverse events and investigate whether the derived parameters could be implemented in the future as a diagnostic and prognostic tool by the bedside.
Fractal analysis and time series
Despite its ability to accurately represent the variability of geometrical forms, fractal analysis has been shown to be a useful tool to quantify time series, as attested in a wide array of disciplines including ecology, cosmology, anatomy, biochemistry, biology and notably, physiology (Caccia and others 1997; Kenkel and Walker 1996; West 2010). There is growing interest in fractality in the field of medicine, thus Losa (2009) suggested denoting such novel and rapidly evolving discipline as “fractalomics.” Temporal fractals are referred to as the relationship between a signal variance and a timescale (Schepers and others 2002). Consequently physiological system signals exhibit distinct scaling structures (Stanley and others 1999). The main objectives of fractal analysis is to accurately and reliably distinguish between two states, determine the correlation between systems, estimate the extent of dependency of a system on another, and characterize irregularity (Stadnitski 2012). In a review of heartbeat time series, authors have found alterations of scaling properties in times of disease and in times of aging populations (Goldberger and others 2002), which could be used to distinguish groups. Additional examples of biomedical system signals (time series) that are known to exhibit fractal behavior with quantifiable complexity are found in studies that address the nonstationary properties of heartbeat time series (Peng and others 1994), the fractal scaling parameters of the electroencephalogram to assess the level of consciousness in anesthetized patients (Jospin and others 2007), the nonlinear properties of the body’s temperature fluctuations relationship with subject age (Varela and others 2003), the fractal organization of cardiac interbeat intervals and variations of the parameters according to age groups (Iyengar and others 1996), and studies of epilepsy, sleeping disorders, and Alzheimer’s disease (Lopes and Betrouni 2009).
Fractal analysis has been applied to this class of signals to quantify the respective nonstationary, nonlinear, and nonequilibrum features of the systems (Stanley and others 1999). Moreover, fractal analysis has the ability to quantify complex signals in a given “time window” and depict changes in the time series prior to a disastrous event (Anderson and others 1997; Mäkikallio and others 2001; Perkiömäki and others 2001; Tapanainen and others 2002). Perkiömäki and others (2005) showed that a reduced short-term fractal scaling exponent was a strong predictor of vulnerability to ventricular tachycardia, ventricular fibrillation, arrhythmic and nonarrhythmic death in certain populations, and a specific risk marker of death among the elderly. Fractal analysis has also been shown to be a reliable method to distinguish a pathologic state from a normal system state and to be of diagnostic value, in neuroradiology as well as in histopathology (Di Ieva and others 2012a; Di Ieva and others 2012b). It can be hypothesized that similar results can be drawn from various signals whose behavior is known to change during times of homeostatic disruption or perturbation (Stanley and others 1999). As authors have previously addressed the complexity of the ICP wave to elucidate brain compliance and cerebral auto regulation processes using measures of entropy (Hornero and others 2007; Santamarta and others 2010), research focused on non-linear fractal based approaches could show that the waveform exhibits significant fractal scaling properties.
Fractal Analysis of ICP
Previous authors have observed that intracranial pressure signals, particularly of patients sustaining TBI, are “anything but static” (Burr and others 2008). In a recent preliminary study of the FD of ICP in 9 head-injured patients, Sourina and others (2010) noted the decrease in the parameter pre- to post-decompressive craniotomy. The authors conducted their work with the well-established box-counting method, as well as the Higuchi method (Bravi and others 2011) to propose that a critical FD value could signal the appropriate timing for surgery (Sourina and others 2010). The inconsistency between intervals of data recording could be used as a basis in future research studies to validate the tool to aid with the decision for decompressive craniotomy. Moreover, Burr and others tested the applicability of detrended fluctuation analysis to the ICP waveform in patients sustaining TBI, and correlated the derived parameters to patient neurological outcome and functioning post-TBI (Burr and others 2008). The authors proposed that the scaling exponent and intercept, based on timescales ranging from 30 seconds to 2 hours, are correlated to patient neurological outcome. The authors warned that the data interpolating methodology to accommodate the missing data points could have potentially given rise to bias within the results (Burr and others 2008). In addition, a recent retrospective study conducted a nonlinear analysis of ICP in a time frame of 30 minutes prior to disproportionate increase in ICP (Fan and others 2010). The authors used a local variability approach to identify a change in the mean ICP trend prior to disproportionate increase in ICP event in patients sustaining TBI. As previously stated, the fractal analysis of time series has the ability to distinguish between two groups and between populations at different risk for adverse events. ICP remains an important tool by the bedside and is monitored regularly in neurotraumatic and neurosurgical patients. Physicians consult the monitor for indication of neurological processes disruptions, and abnormal elevations indicate the necessity for immediate treatment. Although a limited number of studies address the analysis of ICP using fractal or nonlinear approaches, research investigating this sort of analysis could provide an objective parameter to signal the oncoming of disastrous event based on the variability of the signal. Such signal may occur prior to an adverse elevation in mean ICP, and could therefore offer an earlier clinical intervention to prevent patient deterioration and secondary consequences. The FD of ICP could quantify important information regarding the dynamics of the brain in normal and pathological states. Most likely, it will take a long time before such a real-time strategy could be incorporated into bedside monitors; however, to display complex data in a simple way would ultimately have important clinical implications when able to assist physicians in deciding the necessity for immediate treatment and care of the neurotraumatic or neurosurgical patient.
Conclusions and Future Perspectives
ICP is now routinely monitored in patients around the world and is used to direct the management of patients with altered brain compliance. However, most clinicians base treatment decisions on average values and changes in the value of average ICP over time with little or no consideration given to an analysis of the interplay of the complex physiological systems affecting the brain over time. Research has shown that many mathematical approaches applied to physiological and pathological systems data may provide new insights into perturbations of homeostasis and thereby act as useful early biomarker of disease. We have reviewed the potential of nonlinear dynamics to quantify the variability and the complexity of ICP over time and the potential role that such a strategy may have in proposing novel biomarkers. However, to expand our knowledge in the field of ICP analysis, scientists in the discipline of computer science and clinical neuroscience and clinicians need to translate advances in mathematics to better bedside tools to guide treatment and predict outcome.
Footnotes
Declaration of Conflicting Interests
The author(s) declared no potential conflicts of interest with respect to the research, authorship, and/or publication of this article.
Funding
The author(s) received no financial support for the research, authorship, and/or publication of this article.