
Abstract
This preregistered study tests whether a one-item self-categorization question can reproduce Schäfer et al.’s four-segment typology of science communication audiences: “Sciencephiles,” “Critically Interested,” “Passive Supporters,” and “Disengaged.” Using survey data from 3,272 visitors to CERN’s Science Gateway, we compare classifications from the single-item measure with those from the established 10-item instrument. Results show high precision but moderate recall in identifying Sciencephiles, but poor accuracy for other segments. Overall, the one-item measure is not interchangeable with the multi-item instrument in this setting; it may serve as a brief screener for Sciencephiles when brevity is required, and false positives must be minimized.
Keywords
Introduction: Segmentation Analyses and the Challenge of Brevity
In research on science communication and related fields, such as risk (Bartolucci et al., 2023), health (R. A. Smith, 2017), and environmental and climate change communication (Detenber & Rosenthal, 2020; Leiserowitz et al., 2021), segmentation studies have gained momentum (Metag & Schäfer, 2018; Schäfer & Metag, 2021). 1 Usually based on standardized population surveys, segmentation analyses typically use answers to a set of survey questions to classify respondents into groups with high within-group homogeneity and high between-group heterogeneity (Hine et al., 2014) so that subsequently, e.g., “appropriate message design and communication strategies can be developed to influence attitudes and behaviors” (Slater, 1996, p. 272).
Segmentation analyses can be useful in many ways. They can inform the public communication of scientific results (e.g., State Government of Victoria, 2011), track the development of audience groups over time (e.g., Department for Business, Innovation & Skills, 2011), unearth cross-national audience differences (e.g., Liu et al., 2012; Mejlgaard & Stares, 2012), serve as the foundation for message design through additional analysis of communication channels (Metag et al., 2018), or identify relevant sub-populations for further research (e.g., Burns & Medvecky, 2018) or outreach activities (Schäfer & Metag, 2021). Yet they also have limitations. Scholars have pointed to “atheoretical whatever-works approaches” (Hine et al., 2014, p. 447) in terms of the variables used, measurement challenges (Liu et al., 2012), and overly subjective interpretations and resulting problems in cross-study and cross-national comparability (Klinger et al., 2022), among other problems.
We tackle another challenge in this study: Survey time and available resources to collect data are often limited. Costs for telephone and face-to-face surveys, which are the method of choice for some of the most important science attitudes surveys (Wellcome Trust, 2021) and continue to be considered the “gold standard” (B. K. Smith & Jensen, 2016), are on the rise (Olson et al., 2021). Online surveys, on the contrary, are subject to declining attentiveness of respondents after a few minutes (Savage & Waldman, 2008). Therefore, it is imperative for researchers to minimize survey length while maintaining measurement validity, that is, being both concise and informative (R. A. Smith, 2017; Swim & Geiger, 2017).
At the same time, segmentation analyses aim to provide novel insights using multivariate analyses to combine a larger number of different constructs and often extensive sets of variables. The Global Warming’s Six Americas studies, as a prominent example, typically employ 36 items (Leiserowitz et al., 2009, 2021); some studies even more than twice that (Castell et al., 2014). To address this issue, scholars have developed shorter instruments, often abbreviating survey scales while trying to still capture their essence. This effort is also motivated by the fact that segmentation measures are often embedded in larger surveys that link audience segments to additional constructs, leaving limited space for segmentation items. Consequently, shorter versions of segmentation instruments have been developed in several fields (e.g., Chryst et al., 2018; Füchslin et al., 2018; Neumann et al., 2022).
Scholars in fields other than science communication have explored the most extreme form of scale reduction: one-item measures for audience segmentations (cf. Castro et al., 2023). Swim and Geiger (2017) maintained that a “single-item self-categorization measure . . . is a valid and concise measure for researchers to assess participants’ opinions about climate change” (p. 568). In their study, they provided both group labels and short descriptions to respondents and in doing so, were able to reliably place respondents in the respective segments of the established “Global Warming’s Six Americas” (for an overview, see Leiserowitz et al., 2021), showing “strong correlations between self-categorization and categorization via the Six Americas screening instrument,” “strong test–retest reliability,” and an association of the single-item measure with behaviors and knowledge about climate science (Swim & Geiger 2017, p. 582). More broadly, single-item measures – albeit critically discussed sometimes – have proven useful in certain contexts (Allen et al., 2022). If well designed and working, a one-item measure may be a shortcut to audience segmentation, a parsimonious indicator in correlational and causal analyses, and a practical screening tool to identify subgroups for follow-up analyses, even if they do not fully replicate multi-item classifications (Swim & Geiger, 2017).
We adopt previous work on single-item self-categorization for the field of science communication and test whether it can replicate the multi-item segmentation of science communication audiences established by Schäfer et al. (2018) for the Swiss population. To this end, we implemented a single-item measure modeled after Swim and Geiger’s (2017) approach in a preregistered study of visitors at CERN’s new Science Gateway center. When registering for the visit or arriving on site, visitors were asked to indicate which description of the four audience segments identified by Schäfer et al. (2018; Sciencephiles, Critically Interested, Passive Supporters, and Disengaged) fits them best. This self-categorization was then compared to the segmentation based on its validated 10-item scale (Füchslin et al., 2018). Thus, our research question is:
Data and Methods
We preregistered the research question, methods, and analyses at the Open Science Framework (OSF) under https://osf.io/7vuq5/overview?view_only=080ce0f23cd44588aaf2c0ccb702f2fb. The data stem from a standardized survey of visitors of the Science Gateway center at CERN, the European laboratory for particle physics in Switzerland. Opened in 2023, Science Gateway is CERN’s “new education and outreach center” aiming to let visitors engage with “CERN and science through authentic, innovative and inspirational experiences” (European Organization for Nuclear Research [CERN], 2025). As part of a general evaluation of Science Gateway’s communicative impacts, audience segmentation based on visitors’ attitudes toward science was required. For this purpose, the evaluation survey included the established 10-item segmentation instrument, and we added a newly developed one-item measure for this study.
This setting represents a useful case for our analysis: Respondents can be expected to be more aware of their attitudes to science than usual, which increases measurement validity and reduces the risk of measuring “non-attitudes” (Krosnick et al., 2002). Moreover, we expected enough attitude diversity among respondents, as CERN invites a broad audience with different perceptions of scientists, degrees of science capital, and levels of academic socialization. We therefore assumed that the sample would have sufficient variance in terms of audience segments.
Data were collected between August 2024 and September 2025. The target population consisted of visitors aged 15 and above. The survey was offered in English and French and took 11 minutes to complete (median). It was accessible via the official visit.cern website before visitors arrived on site and via posters with QR codes in the visitor area of CERN Science Gateway. During data cleaning, incomplete responses, duplicate data records, and inattentive respondents (the fastest 2.5% participants) were excluded.
The final sample was N = 3,272 respondents. It consists of 51% women and 48% men, while 1% identify as non-binary. Respondents are highly educated (75% have at least a university degree) and, on average, 43 years old. They came from 102 different countries, the most common ones being Switzerland (17%), France (10%), Italy (10%), the United States (9%), and Germany (9%), reflecting the international character of CERN’s visitor base. Respondents average high levels of interest and trust in science, both having a mean of 4.6 on a five-point Likert-type scale. In total, 88% of respondents had never visited CERN before, and their main motifs for visiting were “to learn something new” (M = 4.8) and “broaden their horizon” (M = 4.6).
The survey included the validated 10-item instrument developed by Füchslin et al. (2018), which categorizes audiences of science communication into four segments based on respondents’ interest in, perceived importance of, and attitudes toward science: (a) “Sciencephiles” (highly knowledgeable, interested and trusting in science), (b) “Critically Interested” (knowledgeable and interested, but more skeptical about certain scientific fields), (c) “Passive Supporters” (generally supportive and trusting but only moderately interested), and (d) “Disengaged” (low in both interest and trust, with some clear critics among them; Koch et al., 2020; Schäfer et al., 2018). It also included a new single-item measure modeled after Swim and Geiger (2017), with four response options reflecting the abovementioned segments and a fifth option:
“Which of the following descriptions represents you best?
I have a strong interest in science. My trust in science is very high, and I think there is a scientific answer to most questions. I would say I know a lot about science. (aims to capture the Sciencephiles)
I have a strong interest in science. While I trust science in general, I see problems in some fields or applications. I don’t think science can answer all questions. I would say I know a lot about science. (aims to capture the Critically Interested)
I don’t have a strong interest in science. But I have high trust in it and think that science is important for society. I would say I know a fair amount about science. (aims to capture Passive Supporters)
I am not too interested in science. While I trust science in some respects, I don’t think it should be trusted too much. I don’t think it is important to know too much about science. I feel that society sometimes relies too much on science. (aims to capture the Disengaged)
I don’t think any of these descriptions describes me well.”
To answer the research question, we sorted each respondent into one of the four segments based on the 10-item classification provided by Füchslin et al. (2018) and used the resulting classification as the reference, comparing it with the one-item segmentation in a contingency table. Based on this table, we calculated two established metrics (cf. Hase, 2023) to assess the performance of the one-item measure relative to the 10-item reference version: precision indicates the proportion of correctly identified cases among all cases classified into a segment, while recall indicates the proportion of correctly identified cases among all true cases in that segment. All analyses were conducted in R (R Core Team, 2024) using basic functionalities and the dplyr package (Wickham et al., 2025).
Results
According to the 10-item segmentation, 82.9% of the 3,272 respondents are Sciencephiles, 13.8% are Passive Supporters, 2.8% are Critically Interested, and 0.5% are Disengaged. These proportions differ markedly from the Swiss population overall (Schäfer et al., 2018; Schäfer & Metag, 2026), reflecting the fact that the survey was conducted among visitors to a particle physics-focused science center located at CERN. Although the sample is skewed toward the Sciencephiles segment, the sizes of all segments were sufficient for analysis except for Disengaged respondents, who are too few (n = 15) for a meaningful comparison with the results of the one-item segmentation.
The one-item segmentation works best for the Sciencephiles segment (see Table 1 and Table 2). Using it to identify Sciencephile respondents yields very high precision (0.94 = 1,521/1,615) with moderate recall (0.56 = 1,521/2,714). The high level of precision is partly due to the high baseline prevalence of Sciencephiles in the sample. Nonetheless, when the one-item instrument classifies a respondent as a Sciencephile, this categorization is highly accurate, even though it would likely overlook nearly half of the actual Sciencephiles in larger populations. The most common misclassification for Sciencephiles is respondents who classified themselves as Critically Interested (0.27 = 736/2,741).
Comparison of Classification Based on One-Item Segmentation in Comparison to Results of 10-Item Segmentation.
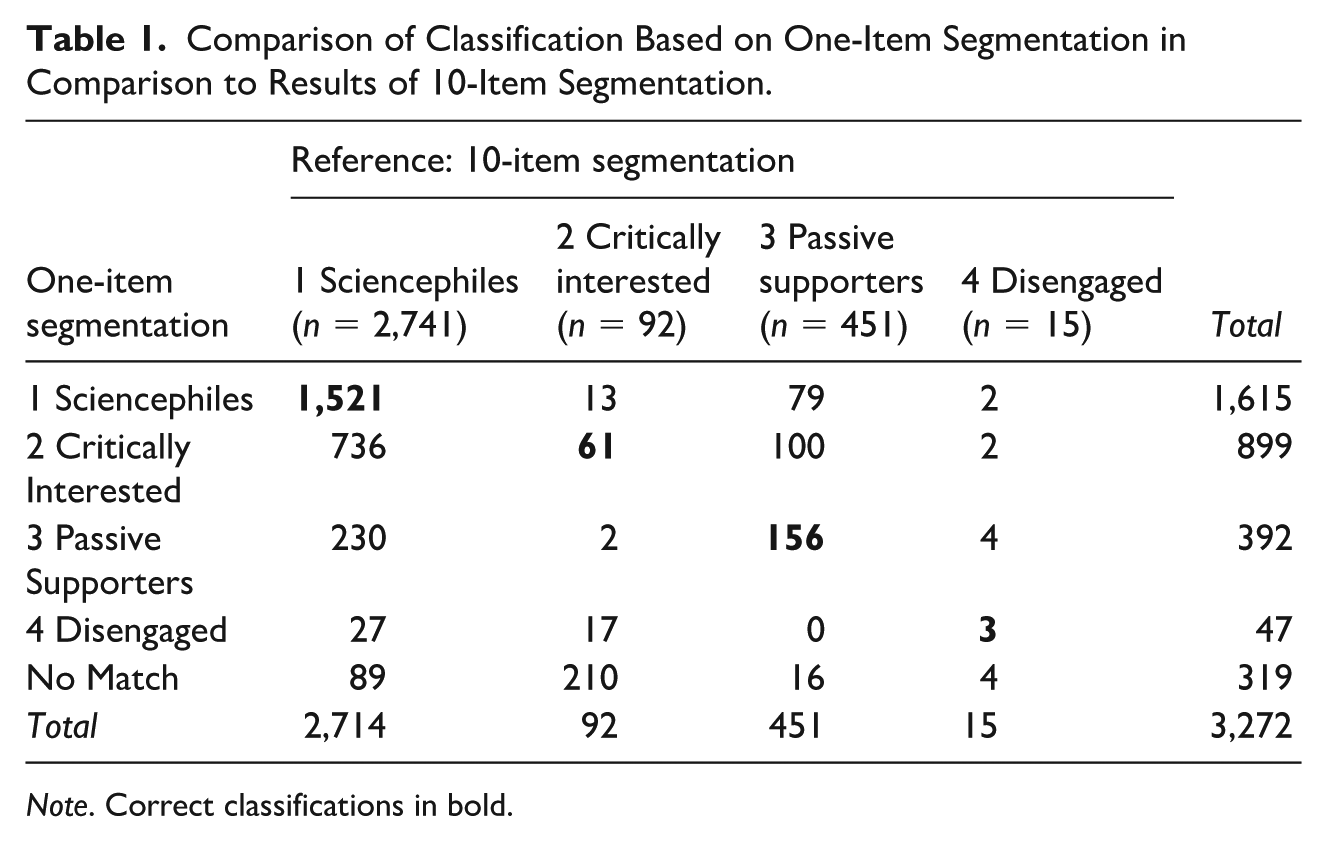
Note. Correct classifications in bold.
Precision and Recall of Classification Based on One-Item Segmentation, Using the 10-Item Segmentation as the Reference.
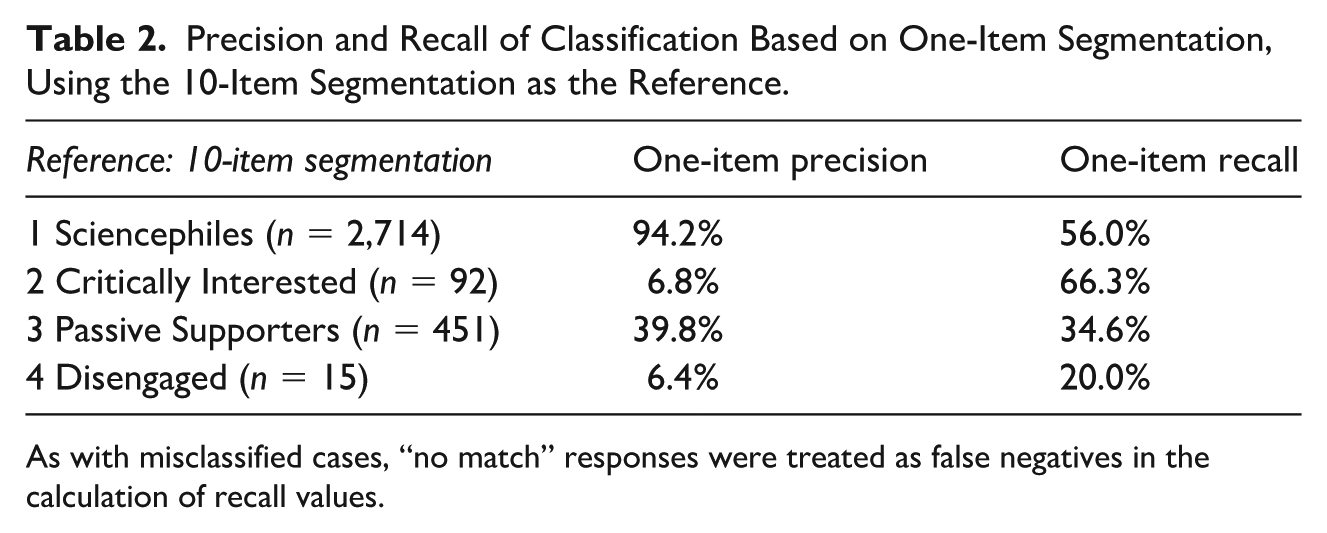
As with misclassified cases, “no match” responses were treated as false negatives in the calculation of recall values.
For the Critically Interested, the one-item measure achieves high recall (0.66 = 61/92) but very low precision (0.07 = 61/899): it captures most true cases but also includes many who are not Critically Interested. The most common misclassifications for this segment stem from respondents who selected “no match” (0.17 = 16/92) or who classified themselves as Sciencephiles (0.14 = 13/92).
For the Passive Supporters segment, the one-item measure performs poorly (precision 0.40 = 156/392; recall 0.35 = 156/451), and even worse for the Disengaged segment (precision 0.06 = 3/47; recall 0.20 = 3/15). For both segments, the one-item measure neither identifies many true cases nor classifies them accurately when it does.
Conclusion: Limited Replacement, Potentially Useful Screening
Against the backdrop of widely used segmentation analyses in science communication and adjacent fields, this preregistered research note examined whether a novel one-item self-categorization measure can replicate an established 10-item segmentation of science communication audiences (Schäfer et al., 2018). Using data from a large visitor survey at CERN Science Gateway, we compared classifications from both instruments.
Results suggest that the one-item segmentation is not interchangeable with the validated 10-item instrument in this setting: it produces markedly different segment proportions and yields high error rates for three of the four segments. For example, most people from the Passive Supporter segment are misclassified as members of other segments. This disagreement may result not only from limitations of the one-item format but also, in part, from the specificity of visitor responses, which might have been influenced by social desirability bias (avoiding self-descriptions that signal low interest or low trust), the place where visitors completed the survey (often on site, i.e., in a setting that increased the cognitive and affective proximity to science), and heightened willingness to conform with majority views (as several respondents might have completed the survey while talking about it with fellow visitors). More generally, because the one-item prompt relies on self-categorization, respondents may also interpret its categories in context-dependent ways – for instance, as signals of identity, social belonging, or normative expectations about how one should relate to science in a science-centered environment. This could contribute to mismatches even if the underlying attitudinal profiles of respondents are relatively stable.
However, while our one-item measure seems to have limited replacement value compared to the larger survey instruments, it may still have some, albeit limited, utility. It performs well as a “precise yet incomplete” screener for the Sciencephiles segment, which makes it useful for cases where Sciencephiles are a primary target group, false positives should be minimized, and missing cases would be acceptable. A secondary tentative use of the one-item measure might be a “messy catch” tool for the Passive Supporters segment in situations where additional manual screening is feasible. For example, the one-item measure could be used for recruitment of respondents for in-depth interviews or focus groups with typical target groups of museums or science cafes, that is, science communication formats which practitioners may want to tailor to Sciencephiles and Passive Supporters.
Although the results do not support broader use of the one-item segmentation, they offer insights beyond the quality of the instrument. When prompted with the one-item measure, respondents tend to see themselves as more critical toward science than the 10-item instrument suggests, with many Sciencephiles self-identifying as Critically Interested. This blurring reflects both conceptual overlap between the groups and reluctance to self-identify as unconditionally trusting of science. It may also reflect that labels such as “science” and “trust in science” can carry different connotations across publics and situations, which may shape self-descriptions even when more specific multi-item indicators classify respondents differently.
The study’s limitations include the overrepresentation of Sciencephiles due to the setting of the survey. A self-selection bias of people highly interested in science is to be expected among CERN visitors. Another limitation is the international composition of visitors, with only a minority from Switzerland, whereas the reference study by Schäfer et al. (2018) focused exclusively on the Swiss population. 2
Within these constraints, this study demonstrates both the shortcomings of the one-item measure and its selective value for rapid respondent screening. Future research could examine conditions under which such a measure may perform better: This could be, for example, in samples with greater attitude variance. It could be in segmentation models with fewer and more distinct audience types. It could be in domains with more clearly defined constructs such as climate attitudes, science media use, or conspiracy beliefs. Or it could be in situations with reduced contextual evaluation pressure (e.g., via increased privacy assurances, off-site administration, or more indirect wording). In addition, exploring two- or three-item variants could offer a promising compromise between brevity and accuracy.
Footnotes
Acknowledgements
The authors thank the many members of the CERN team helping with setting up the survey.
Funding
The authors disclosed receipt of the following financial support for the research, authorship, and/or publication of this article: Part of the data collection was funded by CERN as part of a project evlauating CERN’s “Science Gateway”.
Declaration of Conflicting Interests
The authors declared no potential conflicts of interest with respect to the research, authorship, and/or publication of this article.