
Abstract
Objective
Clot waveform analysis (CWA)-activated partial thromboplastin time (APTT) has been used for the diagnosis of bleeding disorders. In addition to previous parameters such as Min 1, Min 2, and Max 2, we analyzed the area under the curve (AUC) of CWA (CWA-AUC) to examine its usefulness in the diagnosis of thrombosis.
Materials and Methods
Hypercoagulability in patients with acute myocardial infarction (AMI), acute cerebral infarction (ACI), chronic liver disease (CLD), and cancer and in healthy volunteers (HVs) was examined using CWA-APTT.
Results
Min 1 and Min 2 times were significantly shorter in patients with CLD, cancer, ACI, and AMI than in HVs. Min 1, Min 2, Max 2 and CWA-AUC were significantly higher in patients with cancer, ACI, and AMI than in HVs and patients with CLD and were significantly higher in individuals with thrombotic diseases (AMI and ACI) than in non-thrombotic individuals. ROC analyses for thrombosis vs. HVs or non-thrombotic individuals, Min 1, Min 2, Max 2, and CWA-AUC were useful for the diagnosis of thrombosis.
In conclusion
CWA-APTT was suggested to be potentially useful in diagnosing the risk of thrombosis, including AMI and ACI. Min1, Min2, and CWA-AUC are useful for diagnosing thrombosis, with CWA-AUC being the most effective.
Keywords
Introduction
Acute coronary syndrome, including acute myocardial infarction (AMI), can sometimes be fatal, and it occurs due to atherothrombotic coronary artery disease caused by the rupture or erosion of atherosclerotic plaques, accompanied by either non-occlusive or occlusive thrombosis.1,2 On presentation, AMI, including ST-segment elevation myocardial infarction (STEMI),3,4 is generally associated with clinical symptoms such as chest pain. It is strongly suspected based on abnormalities in electrocardiograms and biomarkers such as troponin 5 and creatine kinase-MB (CKMB), 6 and is ultimately diagnosed based on coronary angiography. 7 After percutaneous coronary intervention (PCI) and stent insertion, 7 AMI patients are usually treated with several antiplatelet therapies, particularly receiving dual antiplatelet therapy (DPT) immediately after PCI.8,9 AMI patients except for those with cancer-associated thrombosis (CAT), 10 are not treated with anticoagulant therapy, suggesting that AMI patients are not in a hypercoagulable state.
Acute cerebral infarction (ACI)11,12 includes atherosclerotic ACI caused by arterial thrombosis 13 and cardioembolic cerebral infarction, which differ in the mechanisms underlying the onset of thrombosis and treatment methods. 14 In general hospitals, ACI is diagnosed using computed tomography, magnetic resonance imaging, and angiography, but differentiating between cardiogenic ACI and atherosclerotic or lacunar infarction ACI can sometimes be difficult. 15 In Japan, patients with atherosclerotic ACI are usually treated with antiplatelet drugs11,16 after treatment with argatroban, 17 suggesting that platelet activation plays an important role in the progression, which causes ACI. 18 In contrast, cardioembolic ACI patients are treated with anticoagulants, such as warfarin or direct oral anticoagulants (DOACs),19,20 because of the underlying hypercoagulable state. 21
Biomarkers that are sensitive to AMI include troponin T 22 and CKMB 6 ; however, these biomarkers indicate myocardial damage and are not associated with arterial thrombosis. Fibrin-related marker levels such as D-dimer23-25 are significantly elevated in patients with venous thromboembolism (VTE) and disseminated intravascular coagulation (DIC); however, they do not show a significant increase in patients with AMI or ACI. In contrast, platelet activation biomarkers may be useful for diagnosing arterial thrombosis (e.g., AMI and ACI), and reports on arterial thrombosis exist for soluble C-type lectin receptor-2, 15 platelet factor 4, 26 β-thromboglobulin 27, and P-selectin 28. Recently, clot waveform analysis (CWA)- activated partial thromboplastin time (CWA-APTT) or CWA-small amount of tissue factor (TF) induced FIX activation assay (CWA-sTF/FIXa) have been developed, and increased peak height of CWA-APTT or CWA-sTF/FIXa has been reported to detect hypercoagulability in ACI patients. 21
In this study, peak time, peak height, and the area under the curve (CWA-AUC) of waveform in CWA-APTT we measured in patients with AMI and ACI to assess hypercoagulability, and their diagnostic utility was examined using an ROC analysis.
Materials and Methods
This study included patients who were hospitalized at Mie Prefectural General Medical Center between September 1, 2020, and April 30, 2024, including those with thrombotic diseases such as AMI and ACI, chronic liver disease (CLD), and cancer. The subjects were patients with AMI (n=87; mean age ± standard deviation [SD], 68.4±12.1 years; female, n=18; male, n=69), ACI (n=55; mean age, 72.9±10.9 years; female, n=16; male, n=39), CLD (n=81; mean age, 63.9±12.4 years; female, n=44; male, n=37), and cancer (n=76; mean age, 73.3±10.9 years; female, n=27; male, n=49). Among cancer patients, there were 16 cases of pancreatic cancer, 10 cases of colon cancer, 9 cases of biliary tract cancer, 7 cases of lung cancer, 7 cases of stomach cancer, 7 cases of urinary system cancer, 6 cases of hematologic tumors, 6 cases of liver cancer, and 7 cases of other cancers. Patients with cancer who had thrombotic complications or were undergoing anticoagulant therapy were excluded. Coagulation abnormalities in the patients were examined using CWA-APTT and compared with the CWA-APTT measurements of healthy volunteers (HVs) (n=50; mean age, 45.1±18.0 years; female, n=33; male, n=17].
Blood sampling was performed in the morning of the day of admission, before anticoagulant therapy or antiplatelet therapy. Cases in which anticoagulant therapy had been administered before admission were excluded. Regarding antiplatelet therapy, biaspirin was administered to 12 AMI cases and 7 ACI cases; however, since it has been reported that antiplatelet agents do not affect CWA-APTT, 21 these cases were included in this study. The diagnosis of AMI was based on clinical symptoms, physical examination, medical history, electrocardiography, biomarkers such as troponin T and creatine kinase-MB, and coronary angiography. ACI was diagnosed based on clinical symptoms, physical examination, medical history, and findings from computed tomography (CT) or magnetic resonance imaging (MRI). Cirrhosis and liver cancer were excluded from CLD. The definition of CLD is a condition in which liver dysfunction persists for more than six months and hepatocytes are chronically inflamed, with a Child score of 2 or less and no complications of thrombosis.
The study protocol (O-140) was approved by the Ethics Committee of Mie Prefectural General Medical Center, and informed consent was obtained from each participant. This study was conducted in accordance with the principles of the Declaration of Helsinki.
The APTT was measured using RevohemTM APTT SLA (Sysmex, Kobe, Japan) reagents on an Automated Coagulation Analyzer CS-5100 (Sysmex, Kobe, Japan). In CWA-APTT, the peak height of the first derivative curve is referred to as Min 1, the positive peak height of the second derivative curve as Min 2, and the negative peak height of the second derivative curve as Max 2. The peak time of Min 1, Min 2 and Max 2 are denoted as Min 1 time, Min 2 time and Max 2 time, respectively.29-31 The M1 start time was defined the start time of coagulation (STC), and the M1 area under curve defined the CWA-AUC (Figure 1). These CWA-APTT parameters were calculated using a specialized software program (Sysmex). Transmitted light waveform (A), first-derivative waveform (B) and second-derivative waveform. STC, start time of coagulation; AUC, area under the curve; dT/dt, first derivative of transmittance/first derivative of time; dT2/dt2, second derivative of transmittance. ①, coagulation start time; ②, minimum coagulation rate; ③, minimum coagulation acceleration rate; ④, maximum deceleration rate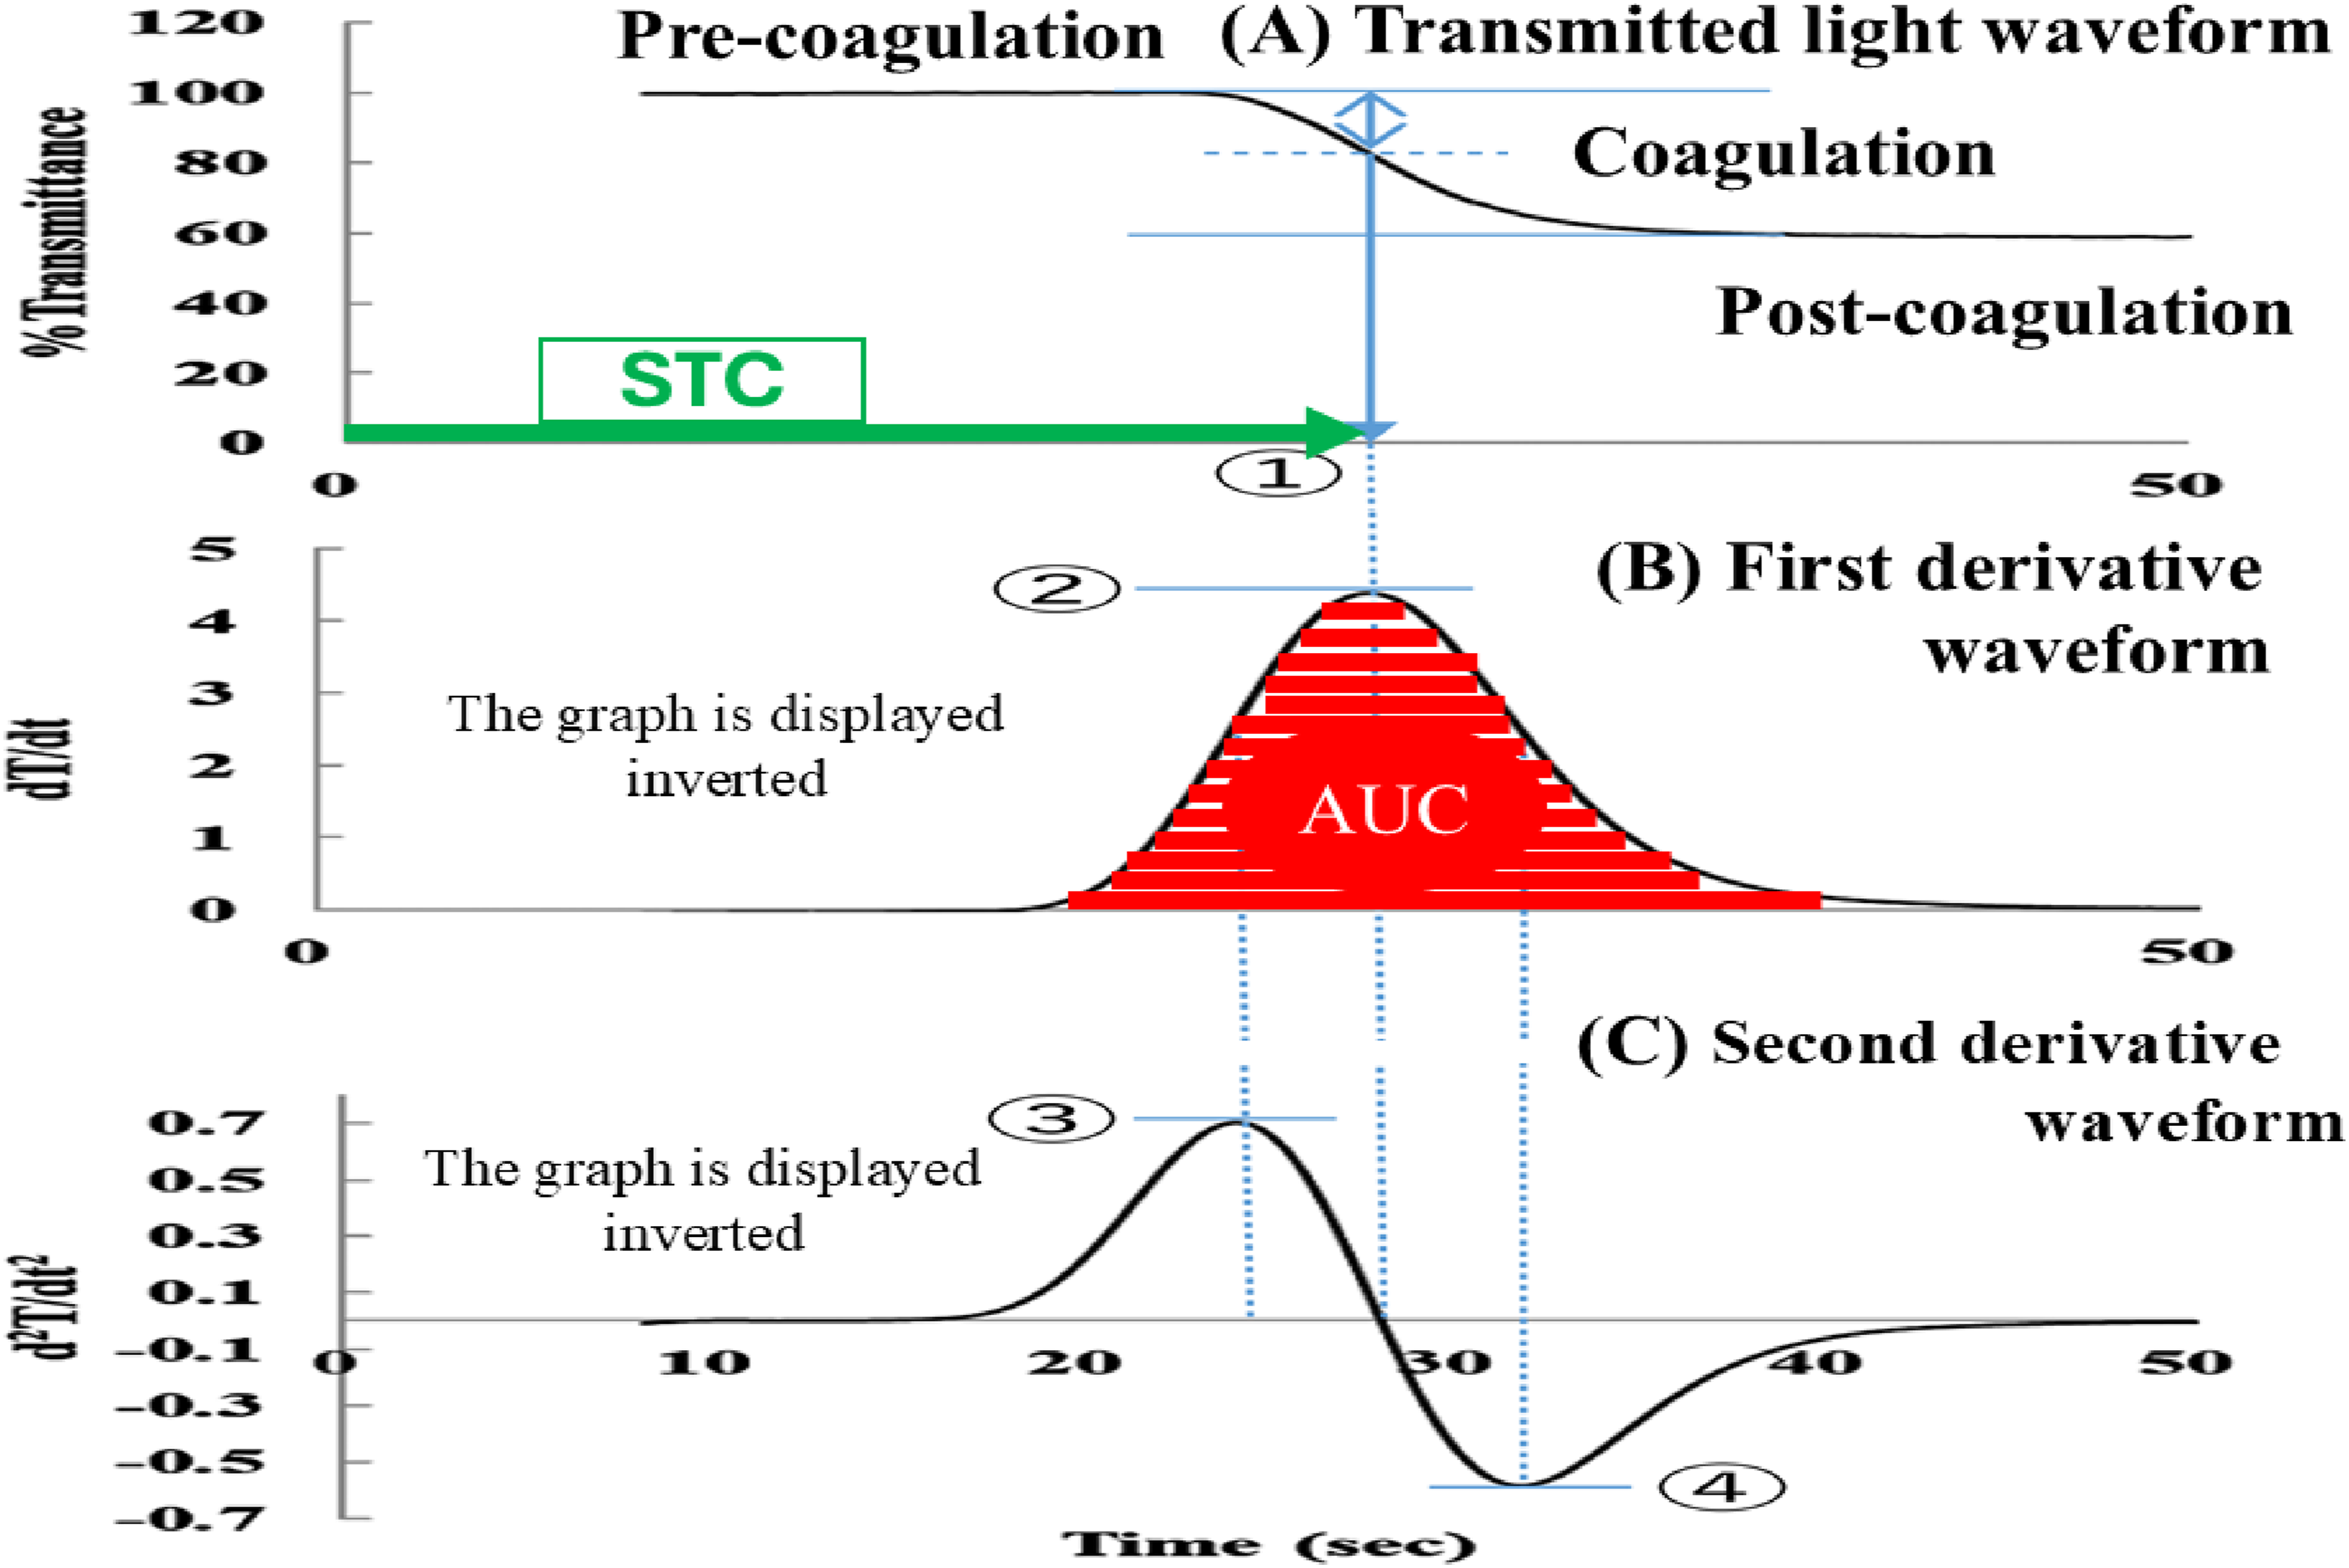
Statistical Analyses
The data are expressed as the median (25-75th percentile). 32 The significance of differences between groups was examined using the Mann-Whitney U-test. A receiver operating characteristic (ROC) was used to determine cutoff values. The cutoff value was set at the point where the sensitivity curve and the 1-specificity curve intersect. P values of <0.05 were considered to indicate a statistically significant difference. All of the statistical analyses were performed using the Stat-Flex software program (version 7; Artec Co Ltd, Osaka, Japan).
Results
I. Parameters for CWA-APTT
Clot Waveform Analysis Parameters; Activated Partial Thromboplastin Time in Patients With CLD, Cancer, ACI and AMI
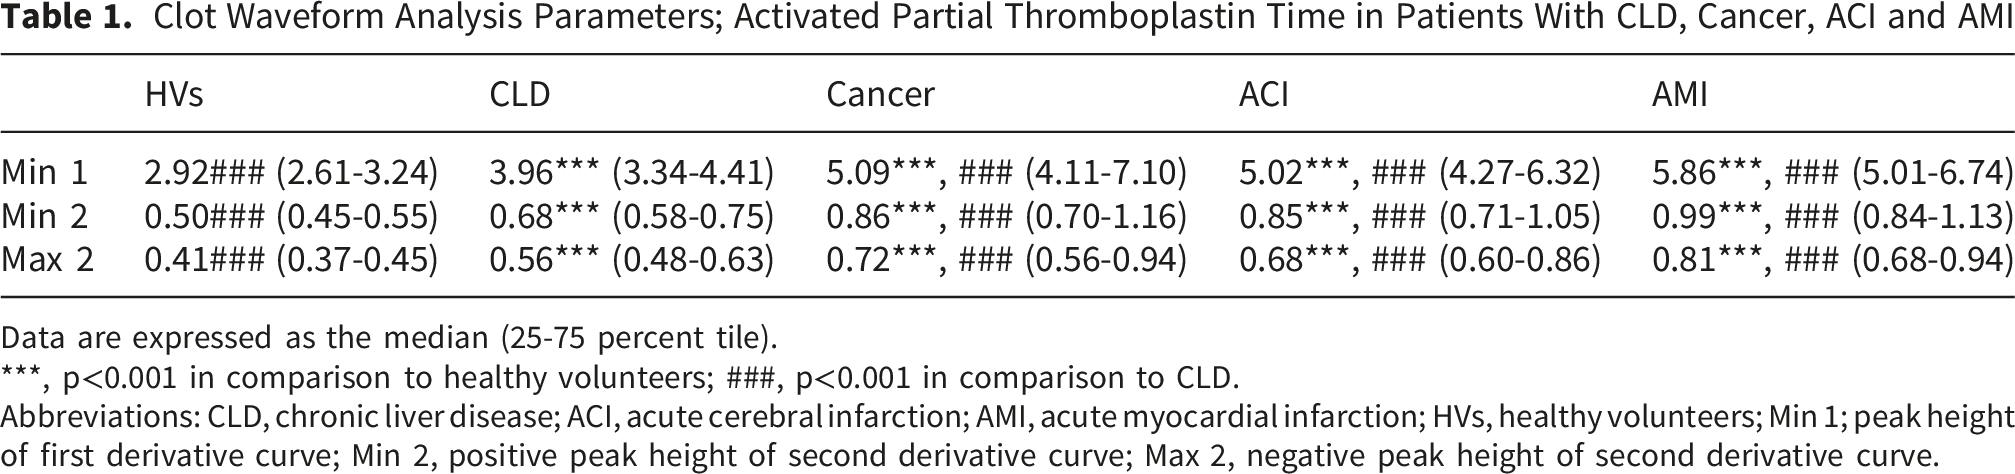
Data are expressed as the median (25-75 percent tile).
***, p<0.001 in comparison to healthy volunteers; ###, p<0.001 in comparison to CLD.
Abbreviations: CLD, chronic liver disease; ACI, acute cerebral infarction; AMI, acute myocardial infarction; HVs, healthy volunteers; Min 1; peak height of first derivative curve; Min 2, positive peak height of second derivative curve; Max 2, negative peak height of second derivative curve.
CWA-AUC, STC, and CWA-AUC/STC in HVs and Patients With CLD, Cancer, ACI and AMI
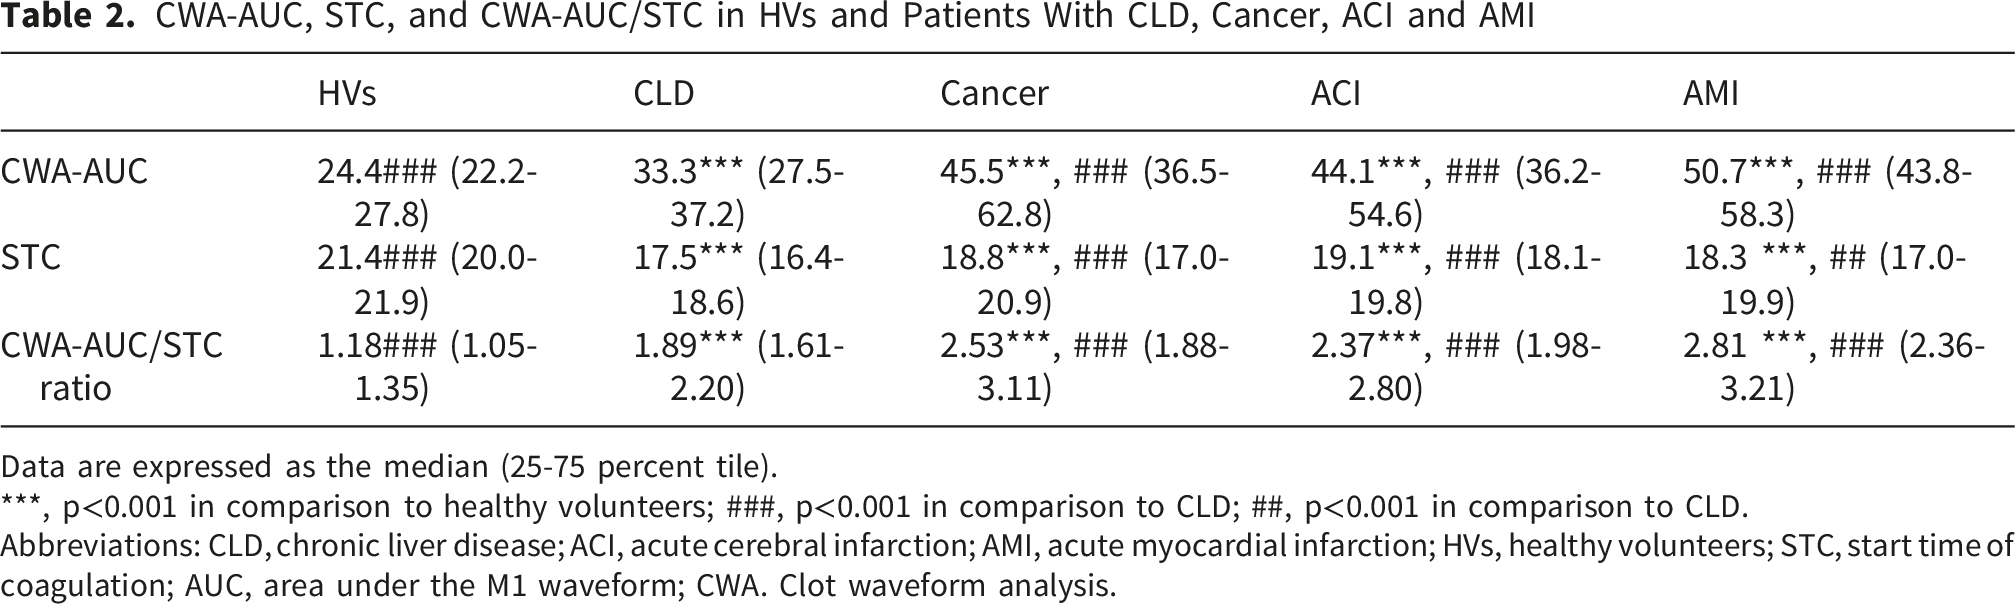
Data are expressed as the median (25-75 percent tile).
***, p<0.001 in comparison to healthy volunteers; ###, p<0.001 in comparison to CLD; ##, p<0.001 in comparison to CLD.
Abbreviations: CLD, chronic liver disease; ACI, acute cerebral infarction; AMI, acute myocardial infarction; HVs, healthy volunteers; STC, start time of coagulation; AUC, area under the M1 waveform; CWA. Clot waveform analysis.
Min 1, Min 2. Max 2, CWA-AUC and CWA-AUC/CST of CWA-APTT in Patients With AMI and ACI, and Those With CLD and HVs, and Those With Cancer, CLD and HVs

Data are expressed as the median (25-75 percent tile). Abbreviations: CLD, chronic liver disease; ACI, acute cerebral infarction; AMI, acute myocardial infarction; HVs, healthy volunteers; Min 1, peak height of the first derivative curve; Min 2, positive peak height of the second derivative curve; Max 2, negative peak height of the second derivative curve; STC, start time of coagulation; AUC, area under the M1 waveform; CWA. clot waveform analysis.
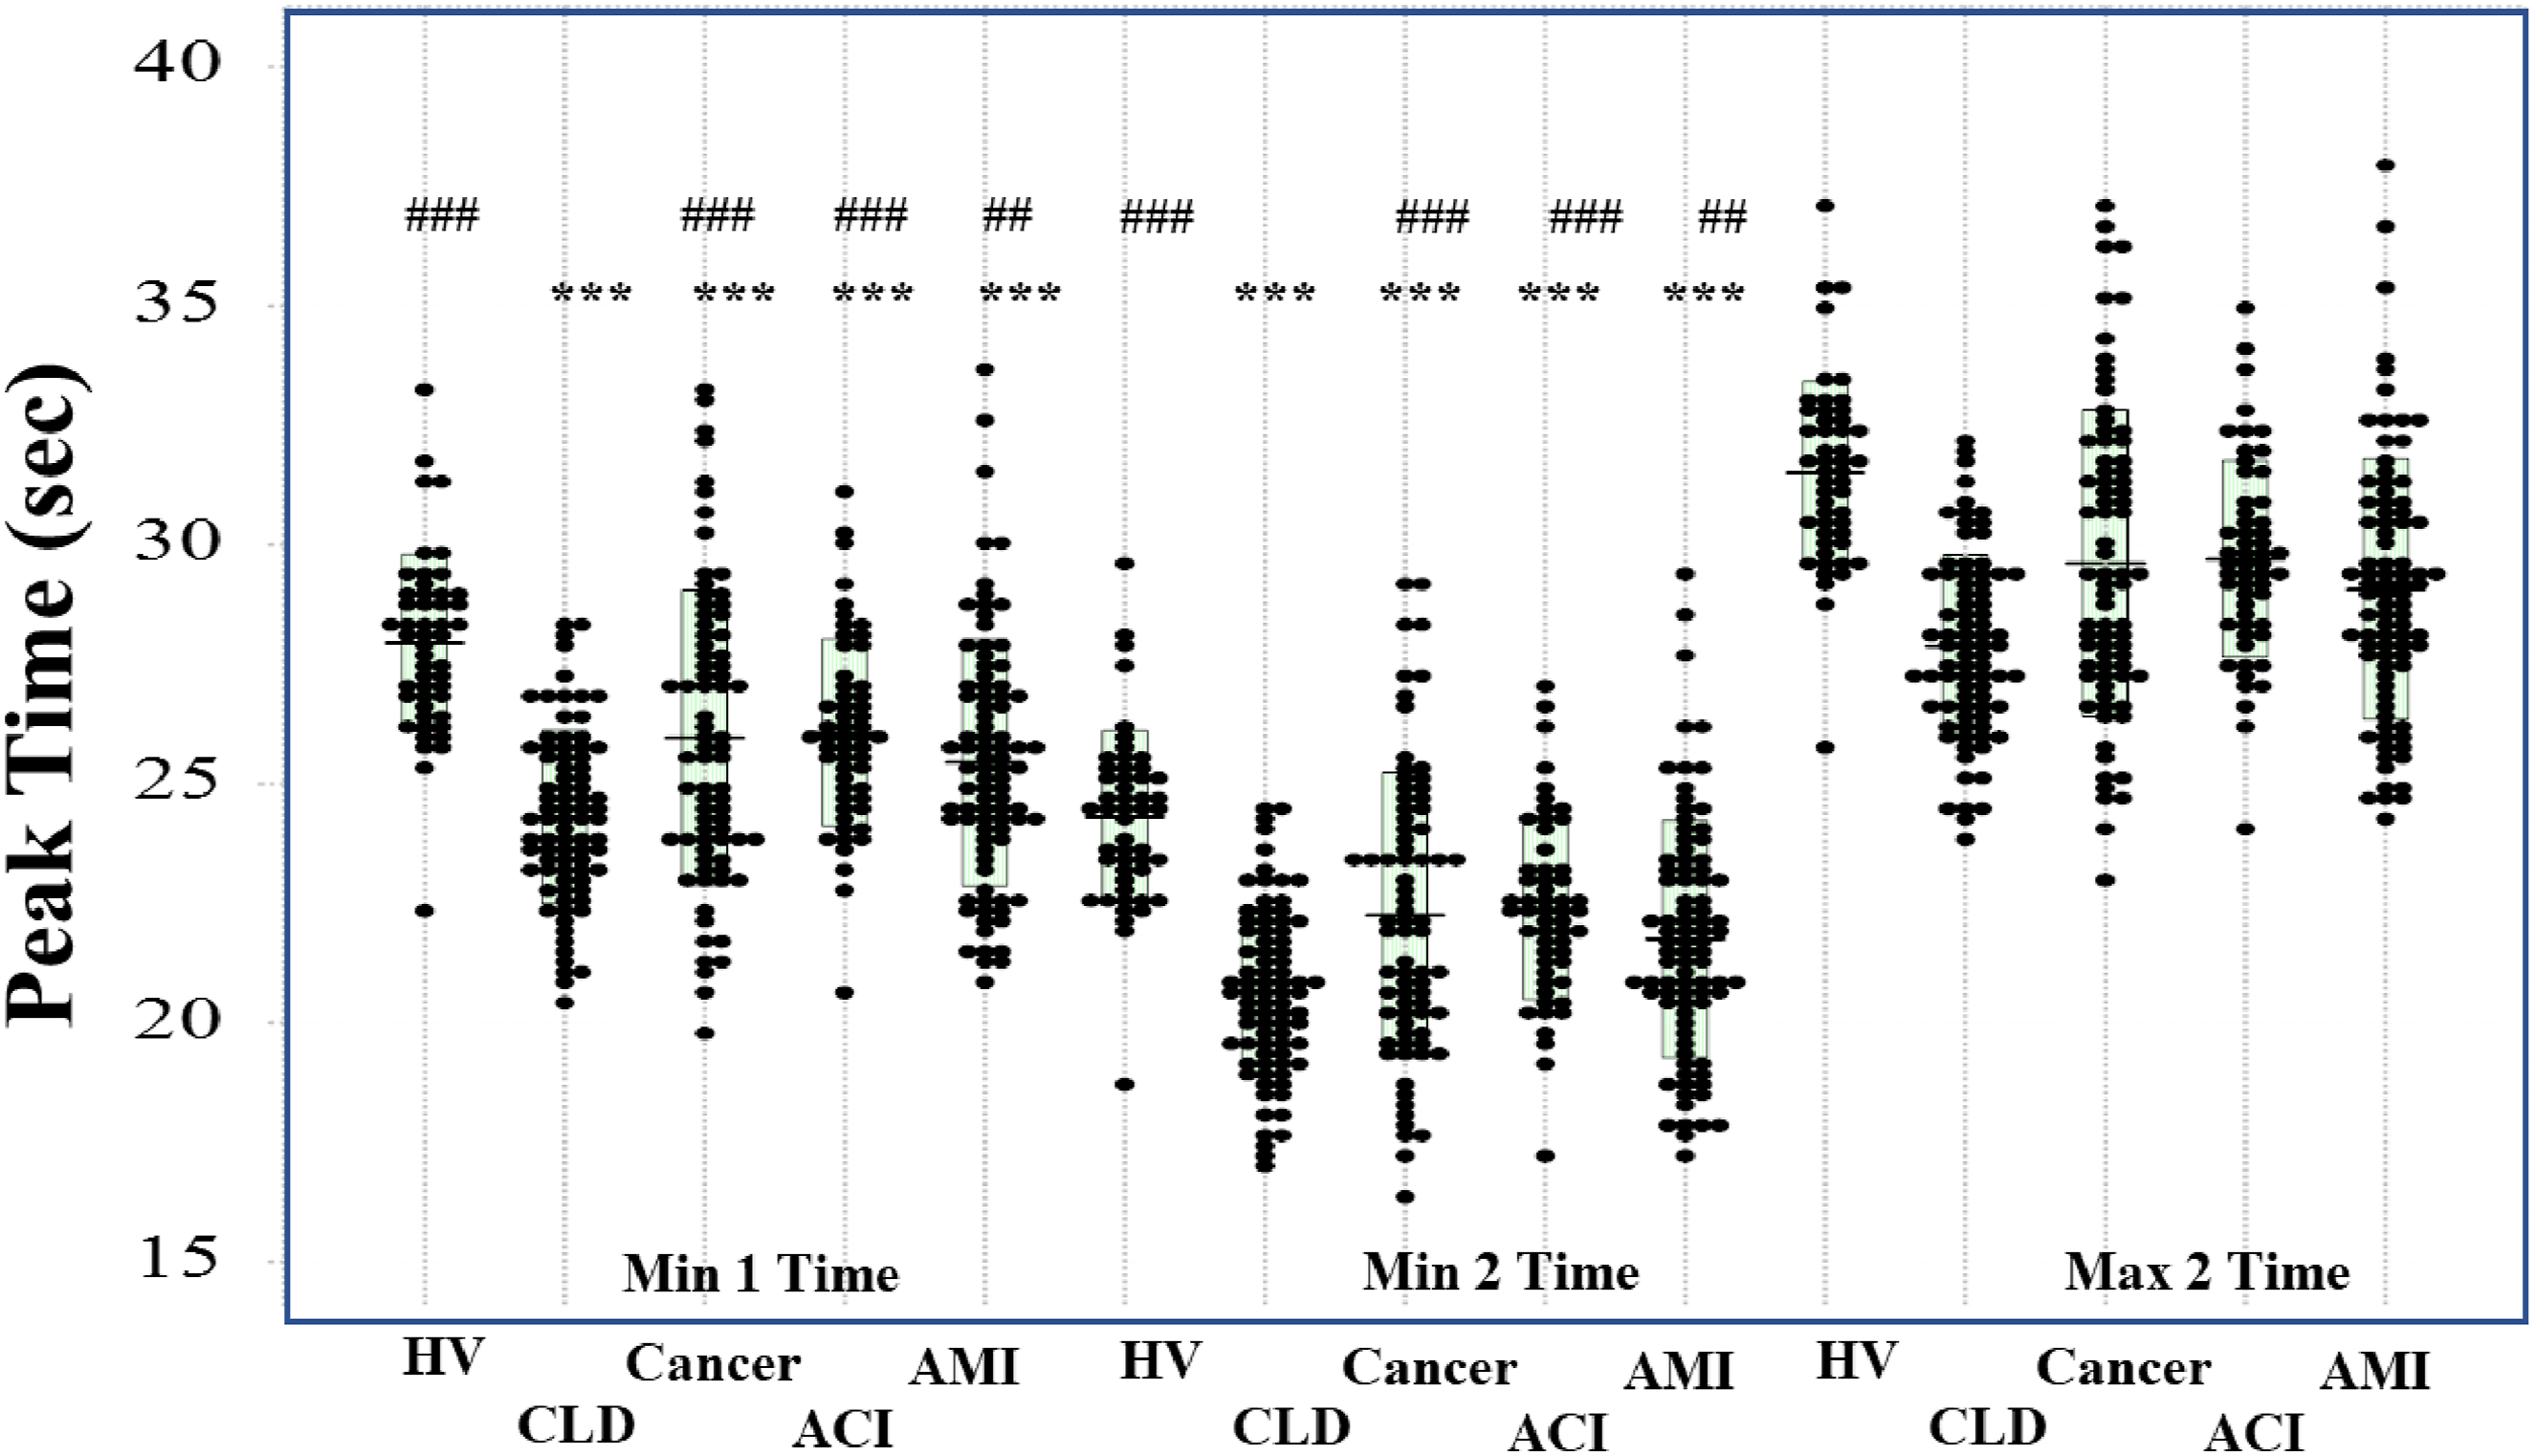
Peak times of Min 1, Min 2 and Max 2 in HV, patients with CLD, cancer, ACI, and AMI. HV, healthy volunteer; CLD, chronic liver disease; ACI, acute cerebral infarction; AMI, acute myocardial infarction. ***; p<0.001 in comparison to HV; ###, p<0.001 in comparison to patients with CLD; ##, p<0.01 in comparison to patients with CLD
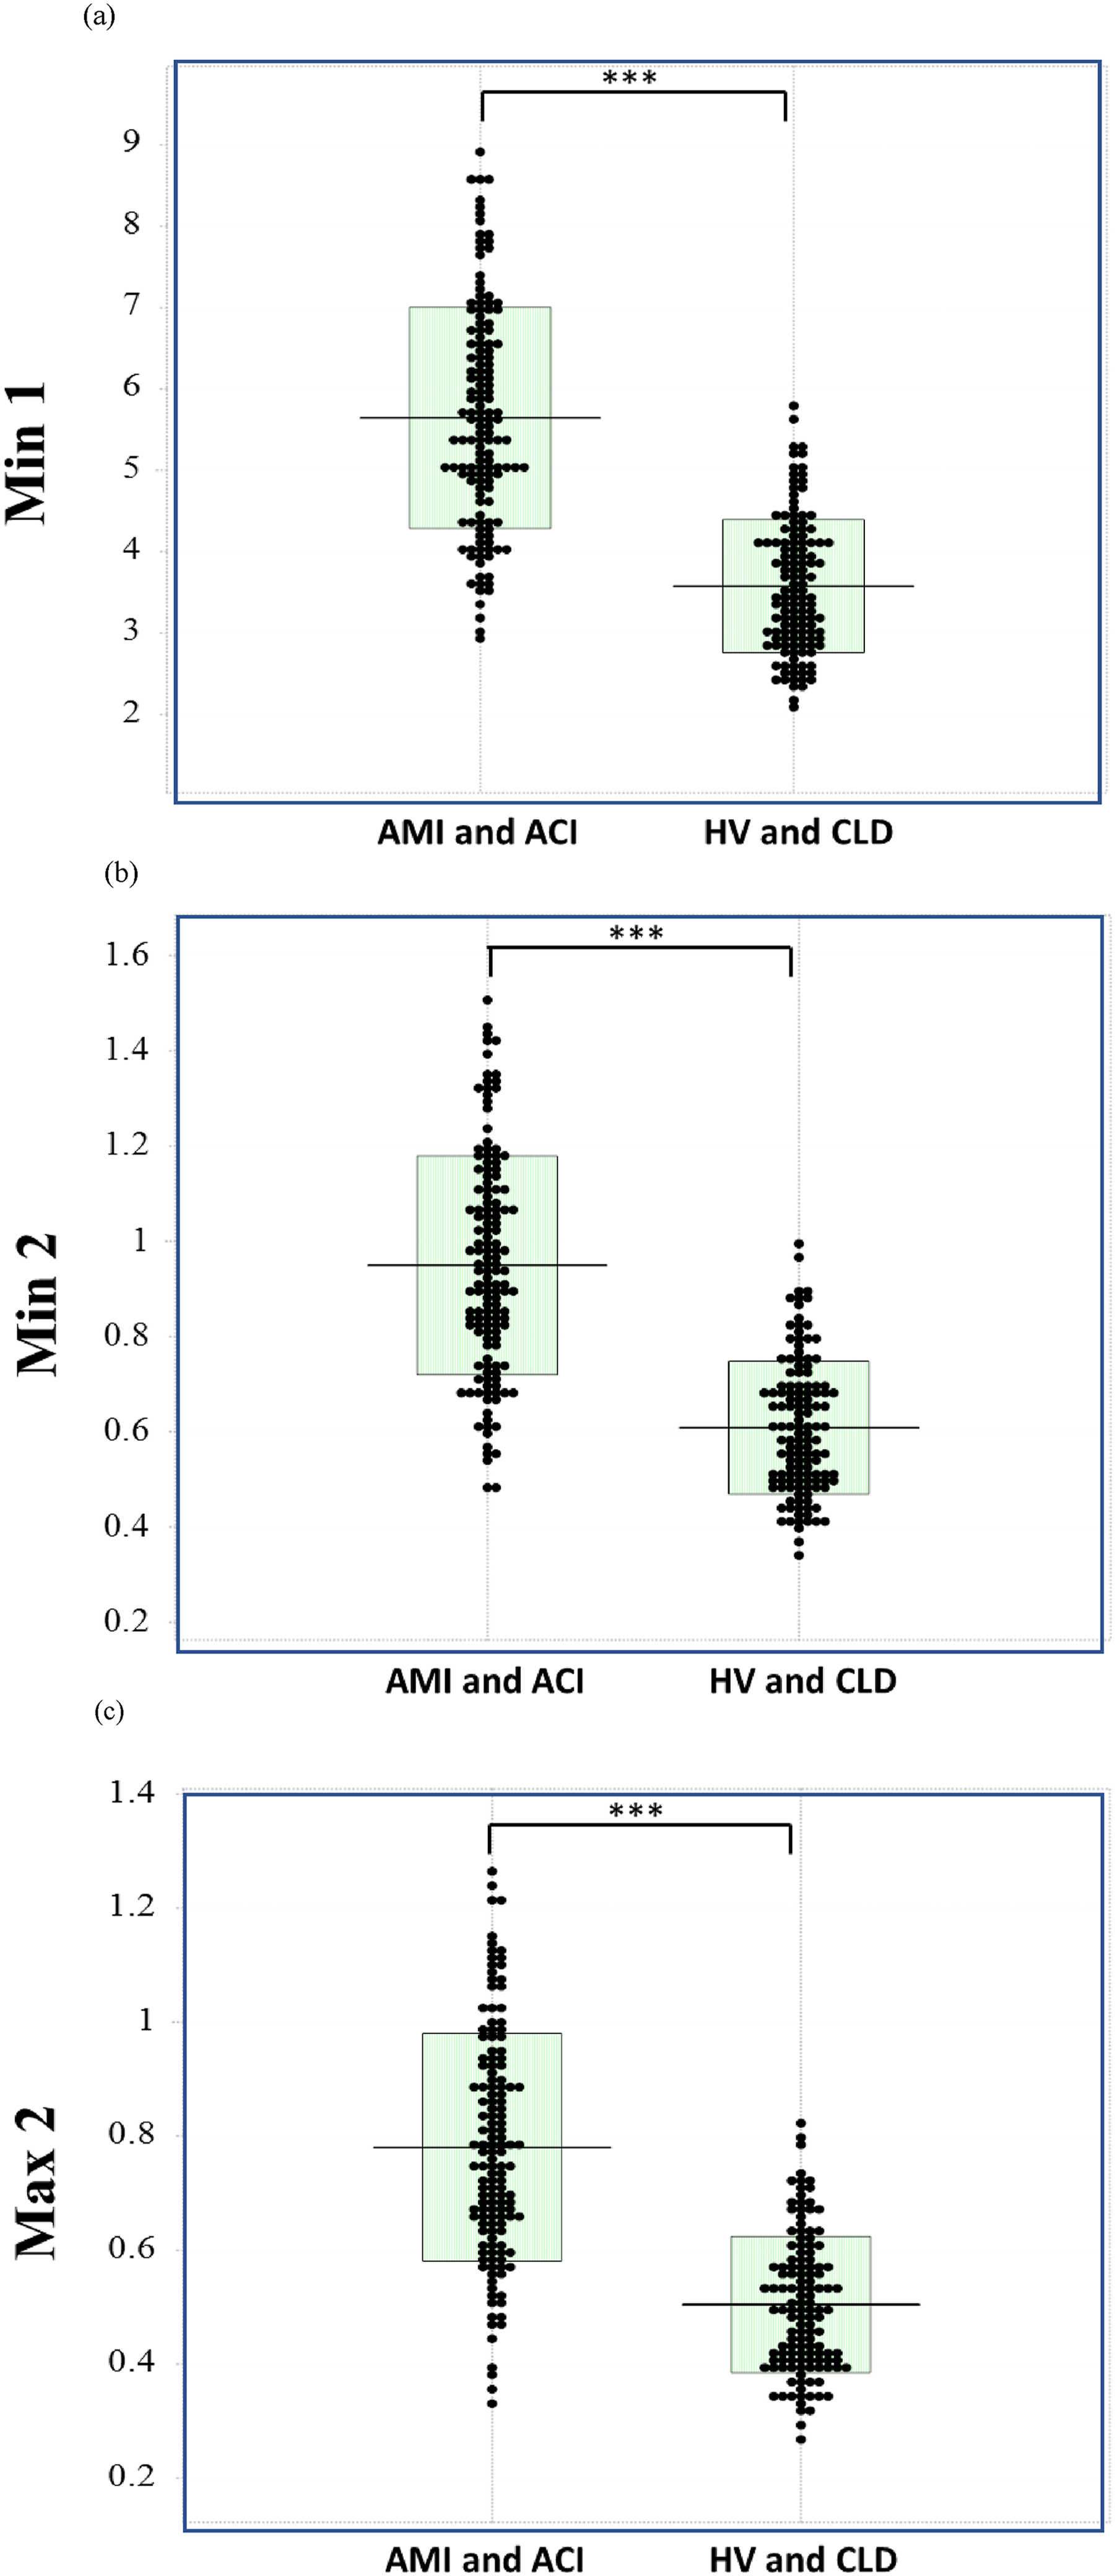
Mine 1 (A), Min 2 (B), and Max 2 (C) in thrombotic patients (ACI and AMI) and in patients without thrombosis (CLD and HV). HV, healthy volunteer; CLD, chronic hepatic disease; ACI, acute cerebral infarction; AMI, acute myocardial infarction. ***, p<0.001
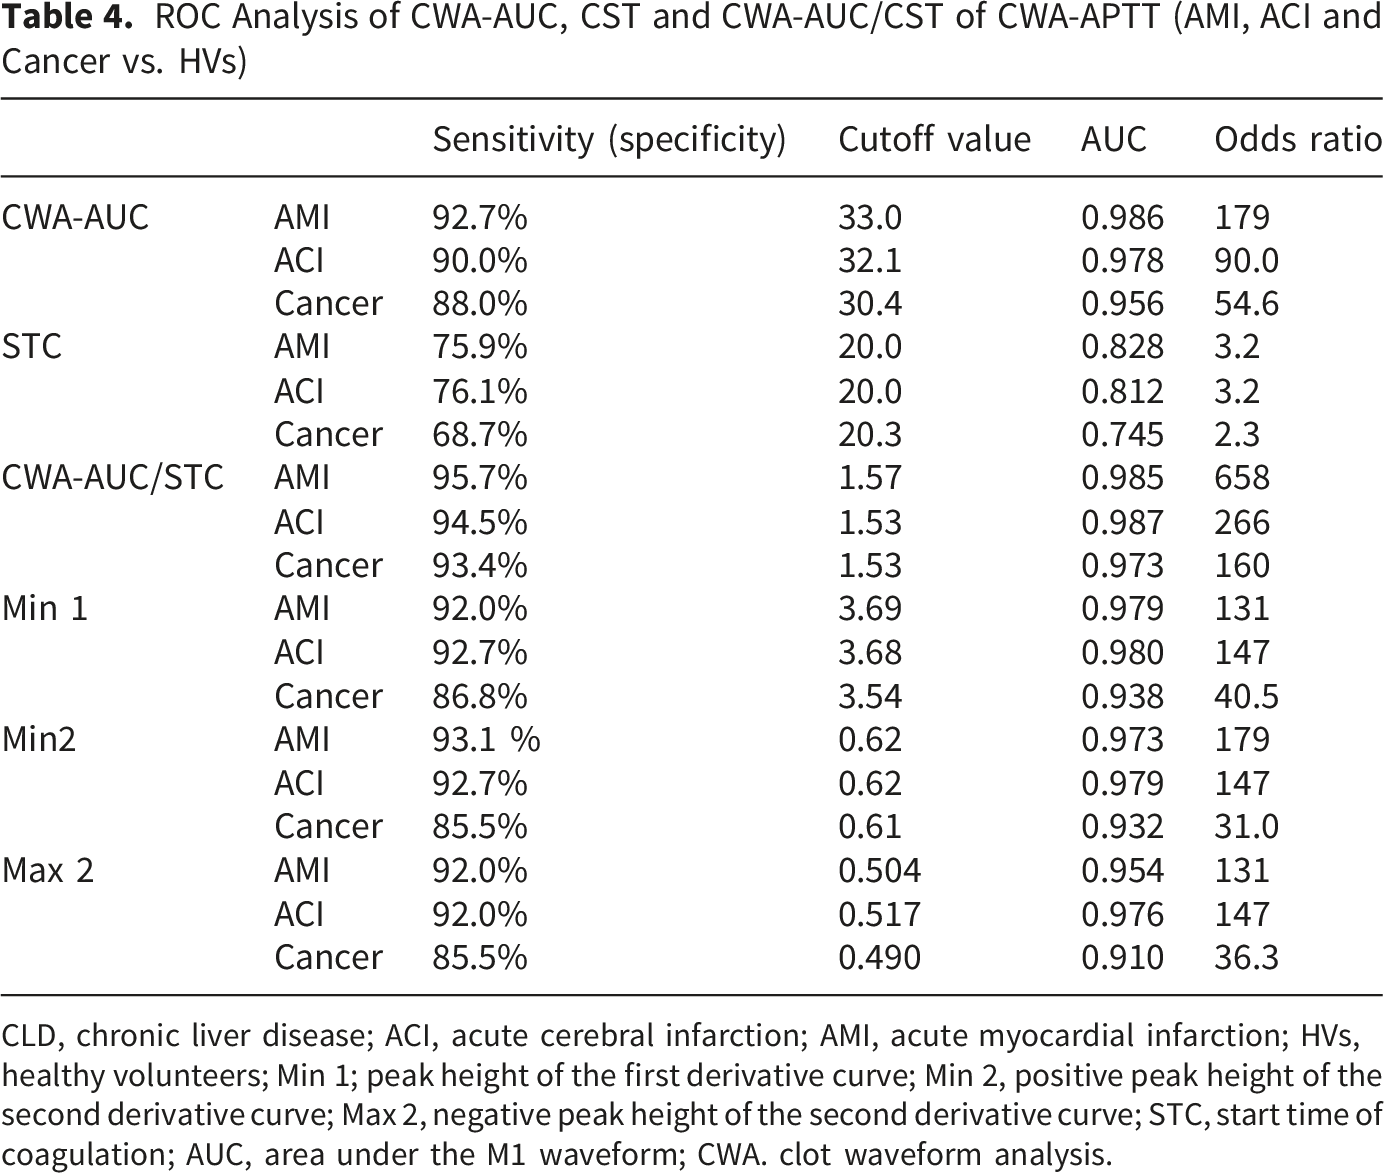
II. ROC Analyses for Thrombosis (AMI or ACI)
Regarding ROC analyses for thrombosis (AMI or ACI) vs. HVs, the sensitivity, AUC and odds ratio values were significantly higher for Min 1, Min 2, Max 2, CWA-AUC, and the CWA-AUC/STC ratio, with the highest values observed for CWA-AUC and the CWA-AUS/STC ratio (Figure 4). These values were also high in the analyses of cancer vs. HVs (Table 4). CWA-AUC (A) and CWA-AUC/CST (B) in thrombotic patients (ACI and AMI) and in patients without thrombosis (CLD and HV). HV, healthy volunteer; CLD, chronic hepatic disease; ACI, acute cerebral infarction; AMI, acute myocardial infarction; CWA-AUC, clot waveform analysis; AUC, area under the curve; ***, p<0.001 ROC Analysis of CWA-AUC, CST and CWA-AUC/CST of CWA-APTT (AMI, ACI and Cancer vs. HVs) CLD, chronic liver disease; ACI, acute cerebral infarction; AMI, acute myocardial infarction; HVs, healthy volunteers; Min 1; peak height of the first derivative curve; Min 2, positive peak height of the second derivative curve; Max 2, negative peak height of the second derivative curve; STC, start time of coagulation; AUC, area under the M1 waveform; CWA. clot waveform analysis.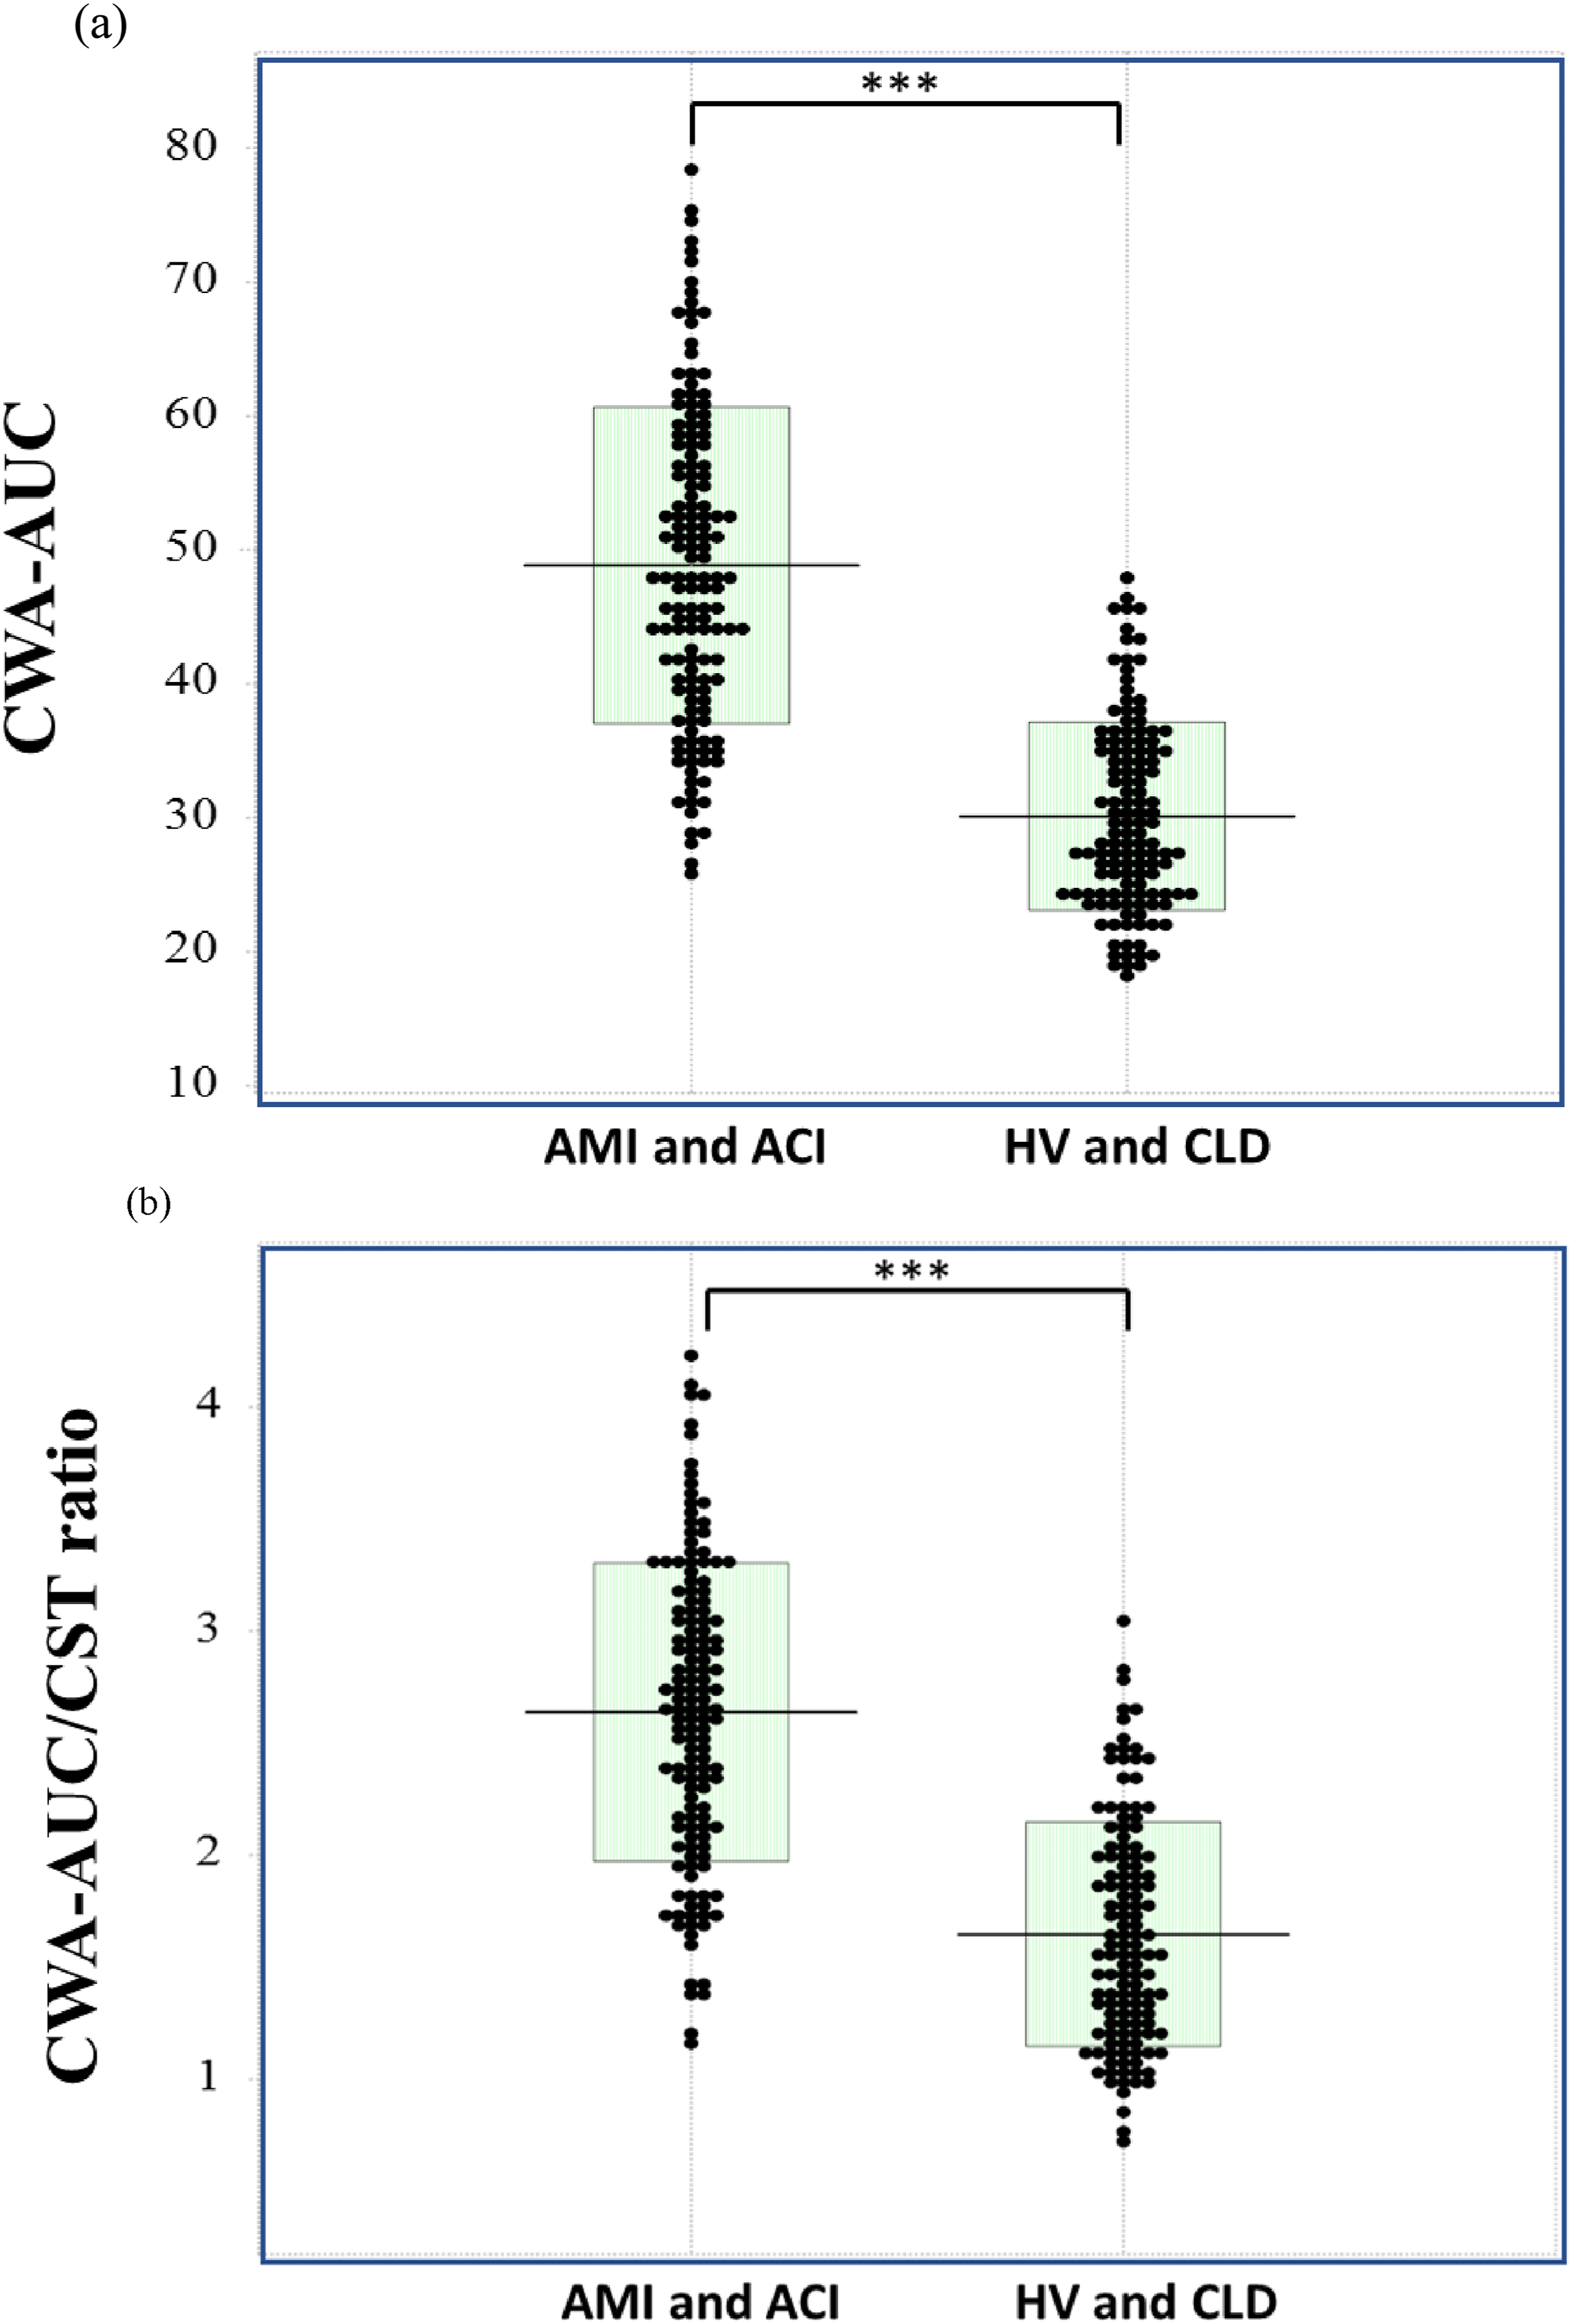
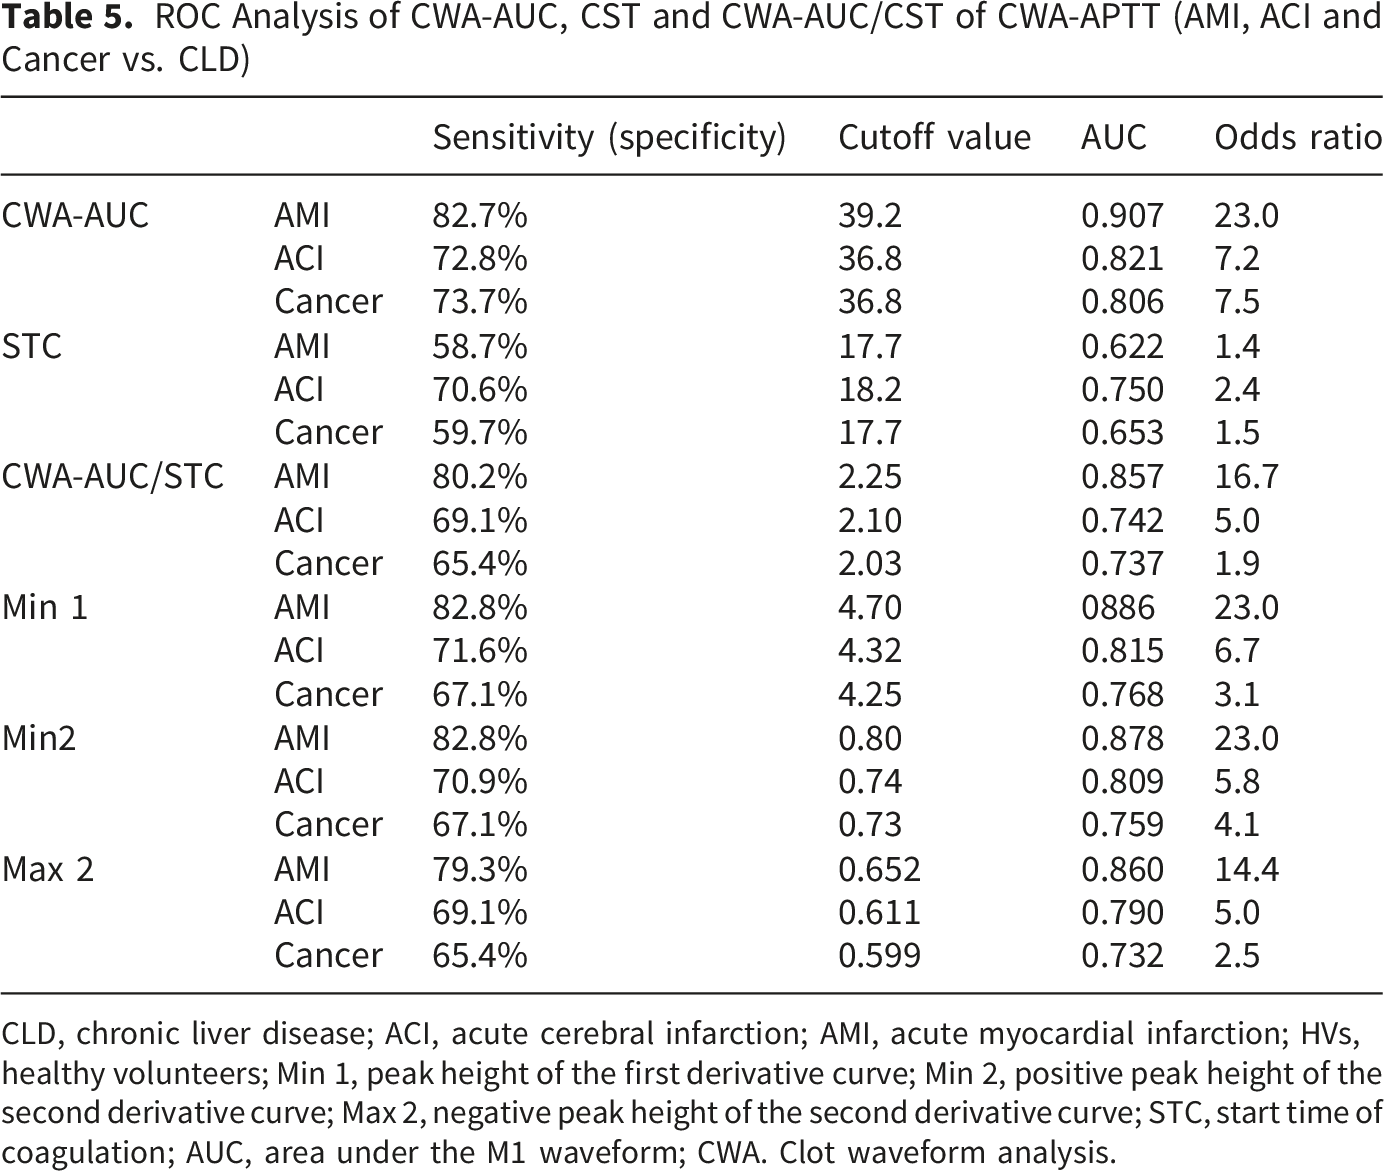
ROC Analysis of CWA-AUC, CST and CWA-AUC/CST of CWA-APTT (AMI, ACI and Cancer vs. CLD)
CLD, chronic liver disease; ACI, acute cerebral infarction; AMI, acute myocardial infarction; HVs, healthy volunteers; Min 1, peak height of the first derivative curve; Min 2, positive peak height of the second derivative curve; Max 2, negative peak height of the second derivative curve; STC, start time of coagulation; AUC, area under the M1 waveform; CWA. Clot waveform analysis.
ROC Analysis of Min 1, Min 2. Max 2, CWA-AUC and CWA-AUC/CST of CWA-APTT (AMI and ACI vs. CLD and HVs)
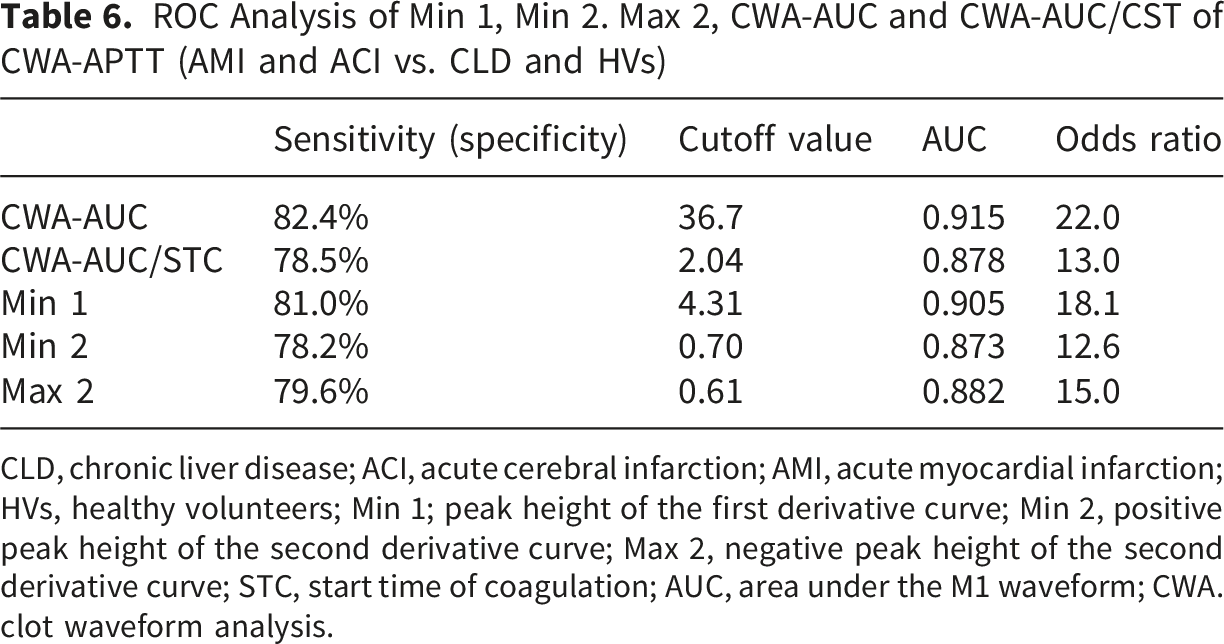
CLD, chronic liver disease; ACI, acute cerebral infarction; AMI, acute myocardial infarction; HVs, healthy volunteers; Min 1; peak height of the first derivative curve; Min 2, positive peak height of the second derivative curve; Max 2, negative peak height of the second derivative curve; STC, start time of coagulation; AUC, area under the M1 waveform; CWA. clot waveform analysis.
ROC Analysis of Min 1, Min 2, Max 2, CWA-AUC andCWA- AUC/CST of CWA-APTT (AMI and ACI vs. Cancer, CLD and HVs)
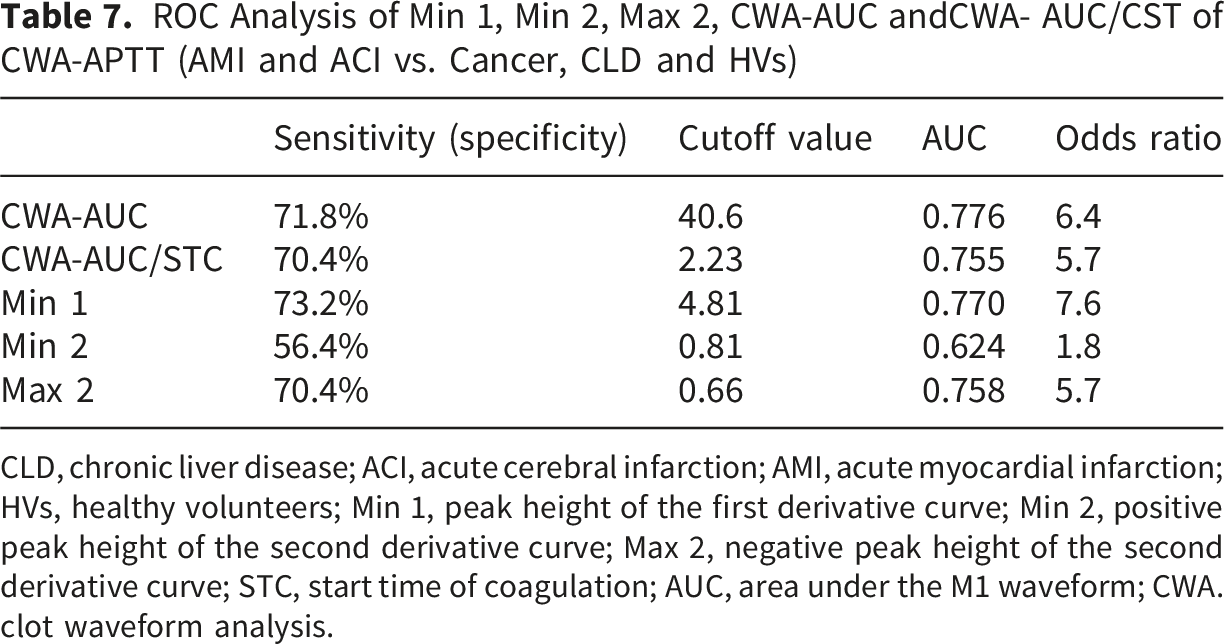
CLD, chronic liver disease; ACI, acute cerebral infarction; AMI, acute myocardial infarction; HVs, healthy volunteers; Min 1, peak height of the first derivative curve; Min 2, positive peak height of the second derivative curve; Max 2, negative peak height of the second derivative curve; STC, start time of coagulation; AUC, area under the M1 waveform; CWA. clot waveform analysis.
Discussion
APTT is generally used to evaluate bleeding tendencies caused by coagulation disorders, 29 such as coagulation factor deficiencies (e.g., hemophilia, inhibitors against coagulation factors, 33 liver dysfunction and disseminated intravascular coagulation [DIC]). 34 APTT is also useful for detecting lupus anticoagulant (LA) 35 and for monitoring anticoagulants such as heparin and warfarin 36-38. Thrombin generation tests 39 and thromboelastography 40 can evaluate hypercoagulability, however, assessment based on APTT has been considered inaccurate. Our findings showed that Min 1 and Min 2 times were significantly shorter in patients with ACI and AMI than in HVs, and that they were even significantly shorter in patients with CLD than in patients with ACI or AMI, suggesting that Min 1 and Min 2 times do not adequately reflect thrombogenicity. Min 1 and Min 2 times are thought to correlate with the amount of coagulation factors, the activation of coagulation factors, and inhibitors. Therefore, due to technical issues such as narrow blood vessels or a large blood draw volume, if the mixing of blood and sodium citrate is delayed, these times are shortened. Patients with CLD are thought to be in a hypercoagulable state 41 relative to HVs, but it is unlikely that they are in a hypercoagulable state relative to patients with AMI or ACI. 42 CWA is composed of peak time, peak height, and peak width; therefore, evaluating coagulation ability based on peak time alone is dangerous.
In contrast, Min 1, Min 2, and Max 2 were significantly higher in patients with ACI or AMI than in HVs and patients with CLD, and the increase in these parameters suggests a hypercoagulable state. The detection of a hypercoagulable state using peak heights of CWA-APTT and CWA-sTF/FIXa has been reported in patients with malignant tumors, 43 ACI 21 and AMI. 42 Patients with AMI and ACI are considered to have a hypercoagulable state due to thrombin bursts mediated by activated platelets, 44 and CWA, which reflects thrombin bursts, can be used to diagnose thrombogenicity. When Min 1 and Min 2 were analyzed using an ROC analysis with HVs as controls, the ROC-AUCs were showed significantly higher values, but decreased when CLD was used as the control, and declined further when cancer was used as the control. Peak height is very useful for distinguishing between HVs and thrombosis, but it is not sufficient to differentiate between thrombosis and non-thrombosis in patients with underlying diseases such as CLD or cancer. Therefore, the peak height × 1/2 peak width of CWA-APTT or CWA-sTF/FIXa, which is considered to be similar to the AUC, has been used to investigate thrombogenicity more sensitively.21,42 In TGT, AUC is a more useful parameter than peak time for evaluating thrombogenicity. 45
In this study, we analyzed real CWA-AUC using a specialized software program from Sysmex to detect thrombogenicity in AMI and ACI patients. The ROC-AUC of CWA-AUC and CWA-AUC/STC was the highest among all parameters of the CWA-APTT for AMI or ACI vs. HVs. In comparisons of AMI or ACI with CLD, the CWA-AUS showed the highest ROC-AUS among all CWA-APTT parameters. These differences were due to the shortening of the STC in CLD. Although ROC analyses showed similar results between the thrombotic and non-thrombotic groups without cancer, none of the CWA-APTT parameters showed significant differences in ROC-AUC, sensitivity, or odds ratio between the thrombotic and non-thrombotic groups with cancer. There are few papers comparing TEG and CWA, but it has been reported that in mild cases of COVID-19, neither reflects a hypercoagulable state, while in severe cases, both reflect it. 46 There is a report 47 that CWA and TEG have been used to evaluate replacement therapy for hemophilia A and B.
In conclusion, CWA-APTT is suggested to be potentially useful in diagnosing thrombosis risk, including AMI and ACI. Min1, Min2, and CWA-AUC are useful for diagnosing the risk of thrombosis, with CWA-AUC being the most effective.
Limitations: Regarding antiplatelet therapy and platelet activation, biaspirin was administered to 12 AMI cases and 7 ACI cases; however, since it has been reported that antiplatelet agents do not affect CWA-APTT, 21 these cases were included in this study. When conditions such as cancer were added to the comparison group, the diagnostic performance for thrombosis significantly decreased, which was considered a limitation of CWA-APTT. The application of modified CWA (e.g., CWA-sTF/FIXa and CWA-sTT)48,49 may help improve the diagnostic performance for thrombosis in patients with cancer. Due to differences in samples and the complicated operation of TEG, a comparison between CWA-APTT and TEG could not be conducted. However, I believe that it was possible to show that there was a sufficiently hypercoagulable state with CWA-APTT.
Footnotes
Acknowledgments
CWA-APTT was supported by Sysmex Corp. Sysmex Corp. was excluded from the statistical analysis.
Funding
The authors disclosed receipt of the following financial support for the research, authorship, and/or publication of this article: This research was supported by a Grant-in-Aid from the Ministry of Health, Labor and Welfare of Japan (grant number 21FC1008) and was supported by Sysmex Corp.
Declaration of Conflicting Interests
The authors declared the following potential conflicts of interest with respect to the research, authorship, and/or publication of this article: N.A. and M.K. are employees of Sysmex Corp. In all other points, the authors declare no conflicts of interest.