
Abstract
Background
Mixing test plasma with prolonged Prothrombin Time (PT) and activated partial thromboplastin time (aPTT) with normal plasma in a 1:1 ratio, helps distinguish between clotting factor deficiency and inhibitors. In our clinical laboratory, the upper reference interval (URI) is routinely used to determine correction (or no correction) in mixing studies.
Aims and objectives
We aimed to use the International Council for Standardization in Haematology. (ICSH) 2024 recommendations for interpreting PT/aPTT mixing studies following validation of the defined cutoffs.
Materials and Methods
From December 2022 to December 2024, plasma samples with prolonged PT/aPTT were tested by mixing them with normal pooled plasma at a 1:1 ratio. A cut-off of ≥70% correction or ≤15% Rosner Index was used to identify clotting factor deficiency per ICSH, and this was compared with URI.
Results
After validating the cutoffs, the analysis of mixing results and factor assays was performed on 243 patients with prolonged PT (n=54), aPTT (n=56), and PT/aPTT (n=133). All patients exhibited either single or multiple clotting factor deficiencies. Inhibitor detection varied depending on the interpretive criteria: the upper reference interval method identified 12/243 cases (4.9%), the 70% correction criterion identified 20/243 cases (8.2%) overall, and the Rosner Index identified 7/189 cases (3.7%) among samples with prolonged aPTT, highlighting method-dependent discordance. Agreement between the various methods was 90.0% or higher.
Conclusion
The ICSH recommendations accurately identified clotting factor deficiencies after local validation of the cut-offs. Clinical correlation and appropriate laboratory testing are essential for detecting concurrent inhibitors in clotting factor deficiency.
Introduction
Routine coagulation screening tests, such as Prothrombin Time (PT) and activated partial thromboplastin time (aPTT), are generally used in the evaluation of inherited bleeding disorders, preoperative bleeding risk assessment, and the monitoring of anticoagulation therapy.1-3 Results of the PT/aPTT guide treating physicians to correlate the patient’s clinical details and order the next level of laboratory tests as required for further management. Frequent causes of prolonged PT/aPTT include an intake of anticoagulant drugs, vitamin K deficiency, liver dysfunction, or inherited disorders like hemophilia A or B 4 but it may be an incidental finding during pre-operative workup of an otherwise asymptomatic patient.3,5,6 Many clinical laboratories receive samples without a proper or complete clinical history for the patients. Samples with initially prolonged PT/aPTT are further tested through mixing with normal pooled plasma (NPP) in a 1:1 ratio for differentiating clotting factor deficiency from inhibitors. 7 Correction of clotting time in the test/NPP mixture is interpreted as ‘factor deficiency’ while failure to do so implies the presence of an ‘inhibitor’. This is an oversimplified statement regarding correction (or lack thereof), as multiple clotting factor deficiencies may show little or no correction. 2 At the same time, a weak lupus anticoagulant (LA) may not be detected due to the correction in mixing. 8 Additionally, low-potency antibodies, a less sensitive reagent, and a range of clinical conditions can all result in false-negative mixing test results.6,9 The presence of exogenous anticoagulants (heparin, direct thrombin inhibitors, Xa inhibitors), some antibiotics, C-reactive proteins, fibrin split products, or paraproteins in the test plasma can act as inhibitors in the mixing study; therefore, the results of mixing tests should be interpreted in conjunction with patient clinical details. 10 Additionally, suppose a PT/aPTT sample is incorrectly collected in an EDTA tube instead of a sodium citrate tube. In that case, laboratories may erroneously identify a factor V/VIII inhibitor due to the presence of EDTA. 11
The mixing study is a simple test used by many coagulation laboratories as a reflex test for prolonged PT/aPTT. However, there is no standard method or interpretation. Several methods with predefined cut-offs have been described, including correction within the reference interval, the ratio or difference of a 1:1 mix with normal pooled plasma (NPP), the Rosner Index, and percent correction. 12 All these approaches aim to distinguish factor deficiency from inhibitors,2,10,12 but there is no agreement on what constitutes a corrected versus an uncorrected state. 12 Additionally, none provides a definitive distinction between factor deficiency and an inhibitor; therefore, coagulation laboratories need to establish their own cut-off values.1,2,12,13 Moreover, inhibitors may be missed if only a clotting factor assay is performed for patients with prolonged PT/aPTT. 12 In such cases, the laboratory may incorrectly report a clotting factor deficiency, which can represent an in vitro coagulopathy without vivo pathophysiology, leading to unnecessary replacement therapy, delays in surgery, or withholding anticoagulation in patients. Several studies have reported various approaches for interpreting correction and non-correction in samples with known inhibitors.2,14-16 However, there is no consensus among the different methods of interpretation. The 2024 recommendations of the International Council for Standardization in Haematology (ICSH) 17 aimed to standardize methodology and interpretation of PT/aPTT mixing studies. In these guidelines, ICSH emphasizes the importance of appropriate patient history, control of pre-analytic variables for correct test performance, and a standardized approach to distinguish factor deficiency from inhibitor presence. Results should be interpreted using both immediate and incubated mixing studies, with correction assessed against laboratory-defined cut-offs. In this study, we aimed to apply recent recommendations from ICSH to interpret mixing studies in samples with prolonged PT and aPTT.
Materials & Methods
Setting
Consecutive plasma samples sent for clotting factor assays from December 2022 to December 2024 were included in the study. The tests were conducted at the Clinical Laboratories, Aga Khan University Hospital, Pakistan, which was accredited by the College of American Pathologists in 2016 and maintains strict internal and external quality assurance processes. Our laboratory routinely performs mixing studies for prolonged PT/aPTT during the investigation of a bleeding disorder.
Data Collection
Patients’ demographics and results for prolonged PT/aPTT, mixing studies, and clotting factor levels were obtained from the computerized laboratory information system.
Mixing Test Studies’ Performance and Interpretation
Coagulation tests were performed on citrated plasma using the automated coagulation analyzer CN 3000 (Sysmex, Kobe, Japan), following the manufacturer’s instructions. Before factor assays, PT/aPTT were conducted using commercially prepared recombinant thromboplastin (Dade Innovin, Siemens, Marburg, Germany), which is LA-sensitive and a LA-insensitive reagent (Dade Actin FS, Siemens). Standard human plasma (SHP, Siemens) was used as normal pooled plasma (NPP). We used a phospholipid-rich aPTT reagent for routine aPTT and mixing studies, aiming to identify clotting factor deficiencies and evaluate bleeding risk without interference from weak lupus anticoagulants. A prolonged PT/aPTT was reflexed to PT/aPTT mixing, where these tests were repeated in a 1:1 mixture of patient plasma and NPP before and 2 hours after incubation at 37°C (Figure 1).
18
In our laboratory, the PT/aPTT result of a 1:1 mix below the upper reference interval (URI) was interpreted as ‘corrected’. For infants under 6 months of age, the reference interval was adapted from literature.
19
The reference range for 6 mo was used for the age group >6 mo and <1 yr. For individuals aged ≥1 year, locally verified adult reference intervals were used. However, formal validation of reference intervals for the intermediate pediatric age group (1–18 years) has not yet been performed. This represents a recognized gap, and an interim interpretation is performed with clinical correlation. Establishment or verification of age-specific pediatric reference intervals is planned as part of future laboratory validation activities. Table S1 states the reference intervals used in our clinical laboratory. For each patient, age-specific URIs were used as cutoffs, and the mixing test was performed only for samples with prolonged PT and/or aPTT. Methodology for the mixing aPTT test used in this study
Specific Clotting Factor Assays
These were performed using dilutions of test/SHP and factor-deficient plasma. Routine dilutions of test plasma were 1:1, 1:2, and 1:4 based on the manufacturer’s multi-dilutional assay (MDA) settings. Results for the test and reference curves were visually checked for outliers, parallelism, and linearity, in accordance with established standards. 20 Additionally, as per the manufacturer, a slope ratio or SR (calibration slope/test plasma slope of 1.0 with an interval of 0.9 to 1.1) was required to establish parallelism between test and reference curves. 21 Therefore, non-parallelism was defined as an SR of <0.9 or >1.1. In addition to SR, CV between serial dilutions was used in this study to assess parallelism in the factor assay. A CV threshold of 15% was applied for factor levels, with an acceptance criterion of ≤20% CV for low factor. 16
Extended dilutions (1:8, 1:16, 1:32, 1:64, 1:128,1:256 and 1:320) were used if test results did not fall within the readable interval of the reference curve or if they were non-parallel to the reference curve. However, factor assays were not performed at low MDA settings or with a low curve, and the clotting factor activity % was reported as < the lower limit of linearity. In the case of a suspected inhibitor, the results of the highest dilution of the clotting factor were reported if the test curve was not parallel to the reference curve.
Every sample with prolonged PT and aPTT was tested for clotting factor deficiency. Assays for factor VII and VIII/IX/XI/XII were performed, respectively, for isolated prolonged PT and aPTT. Factors II, V, X, and fibrinogen were tested in samples with combined prolonged PT and aPTT. Patients with factor V deficiency were also routinely checked for FVIII. LA was done only when requested by the clinician. A specific clotting factor inhibitor assay was not performed in any patient due to a lack of testing facilities.
Application of ICSH Recommendations
URI was considered Method A.
Method B.
The percentage correction in ICSH was considered as method B in this study.
In this study, we used retrospective data from our laboratory to apply ICSH recommendations
17
for the interpretation of ‘corrections’ in mixing studies. For the PT/aPTT mixing test, the percentage correction was calculated as.

A cut-off of ≥70% correction in clotting time (CT) was defined as correction. 8
Method C.
In this study, we labelled the Rosner Index as Method C.
The Rosner Index
22
was initially designed to identify LA and used a cutoff of ≤15% for the circulating anticoagulant index (ICA). This index was used in the aPTT mixing test and calculated as follows:

To identify the aPTT inhibitor (≤70% correction or ≥15% ICA), the subtraction method was used as follows:

An inhibitor was present if this ‘X’ was greater than 0. If the subtraction was ≤ 0, the results from the incubated aPTT mix were analyzed for the presence of a time and temperature-dependent inhibitor using a percentage correction or Rosner Index, followed by the subtraction method according to ICSH recommendations. 17
Validation of Mixing Studies
PT and aPTT were mainly performed in our laboratory to detect clotting factor deficiencies and identify any concurrent clotting factor inhibitors. We used a lupus-insensitive aPTT reagent, so we did not expect interference from mild LA. The Rosner Index was validated in 10 patients (ages 0 to 21 years) with inherited clotting factor deficiencies and in 10 adult patients (ages 40 to 79 years) with various inhibitor types. We also analyzed results from patients with acquired hemophilia A (AHA), lupus-associated hypoprothrombinaemia syndrome (LAHPS), and LA. Validation samples were obtained from patients with confirmed diagnoses of the respective bleeding or autoimmune disorders who were being treated with factor concentrates and or immunosuppressives at our institution. Patients with AHA were diagnosed clinically, and due to the presence of time and temperature-dependent inhibitors in laboratory screening. Except for three cases (patient #5 in Table 3B and patients #9 and #10 in Table 3C), the validation samples were obtained from patients not included in the study cohort. Please see supplementary Tables S2 and S3 for validation studies.
Clinical and Laboratory Correlation
Patients identified as having inhibitors in mixing studies were evaluated for clinical details, focusing on bleeding history, anticoagulant use, and LA workup when available.
Statistical Analysis
Three distinct datasets were analyzed: patients with prolonged PT (n=54), patients with prolonged aPTT (n=56), and a combined PT–aPTT dataset (n=133). Patients were included only once in each dataset. Using the URI as the reference method and % correction or RI as the new methods, Kappa agreement was calculated (IBM SPSS for Windows, Version 19.0) to compare mixing corrections. Kappa agreement was classified as weak (<0.40), moderate (0.41-0.60), substantial (0.61-0.79), or perfect (0.80-1.0), based on the values in parentheses.
Ethical Clearance
The study was approved by the institutional ethical review committee [ERC#2023-8531-24238], and the data were anonymized for subsequent statistical analysis.
Results
Validation of Cutoffs
In patients with known clotting factor deficiency, we observed a correction of 90% or more in samples with prolonged PT and nearly 80% in those with prolonged aPTT during mixing studies (Supplementary Table 1s). A Rosner Index of <10% was seen in patients with prolonged aPTT due to clotting factor deficiency. Prolonged PT secondary to prothrombin inhibitor showed correction, but correction was variable in the presence of LA (Table 2S). In four of five patients with acquired hemophilia A (AHA), correction was <70%, and the Rosner Index was >15%, while one patient (#5) showed correction on immediate aPTT but not on incubated aPTT. Subtraction was >0 in all cases. Both % correction and the Rosner Index failed to identify LA in patients with antiphospholipid syndrome because we were using an LA-insensitive aPTT reagent.
Demographics
Summary of Demographics and Initial Coagulation Test Results in 243 Patients

Fibrinogen=Fl.
Detection of Inhibitors
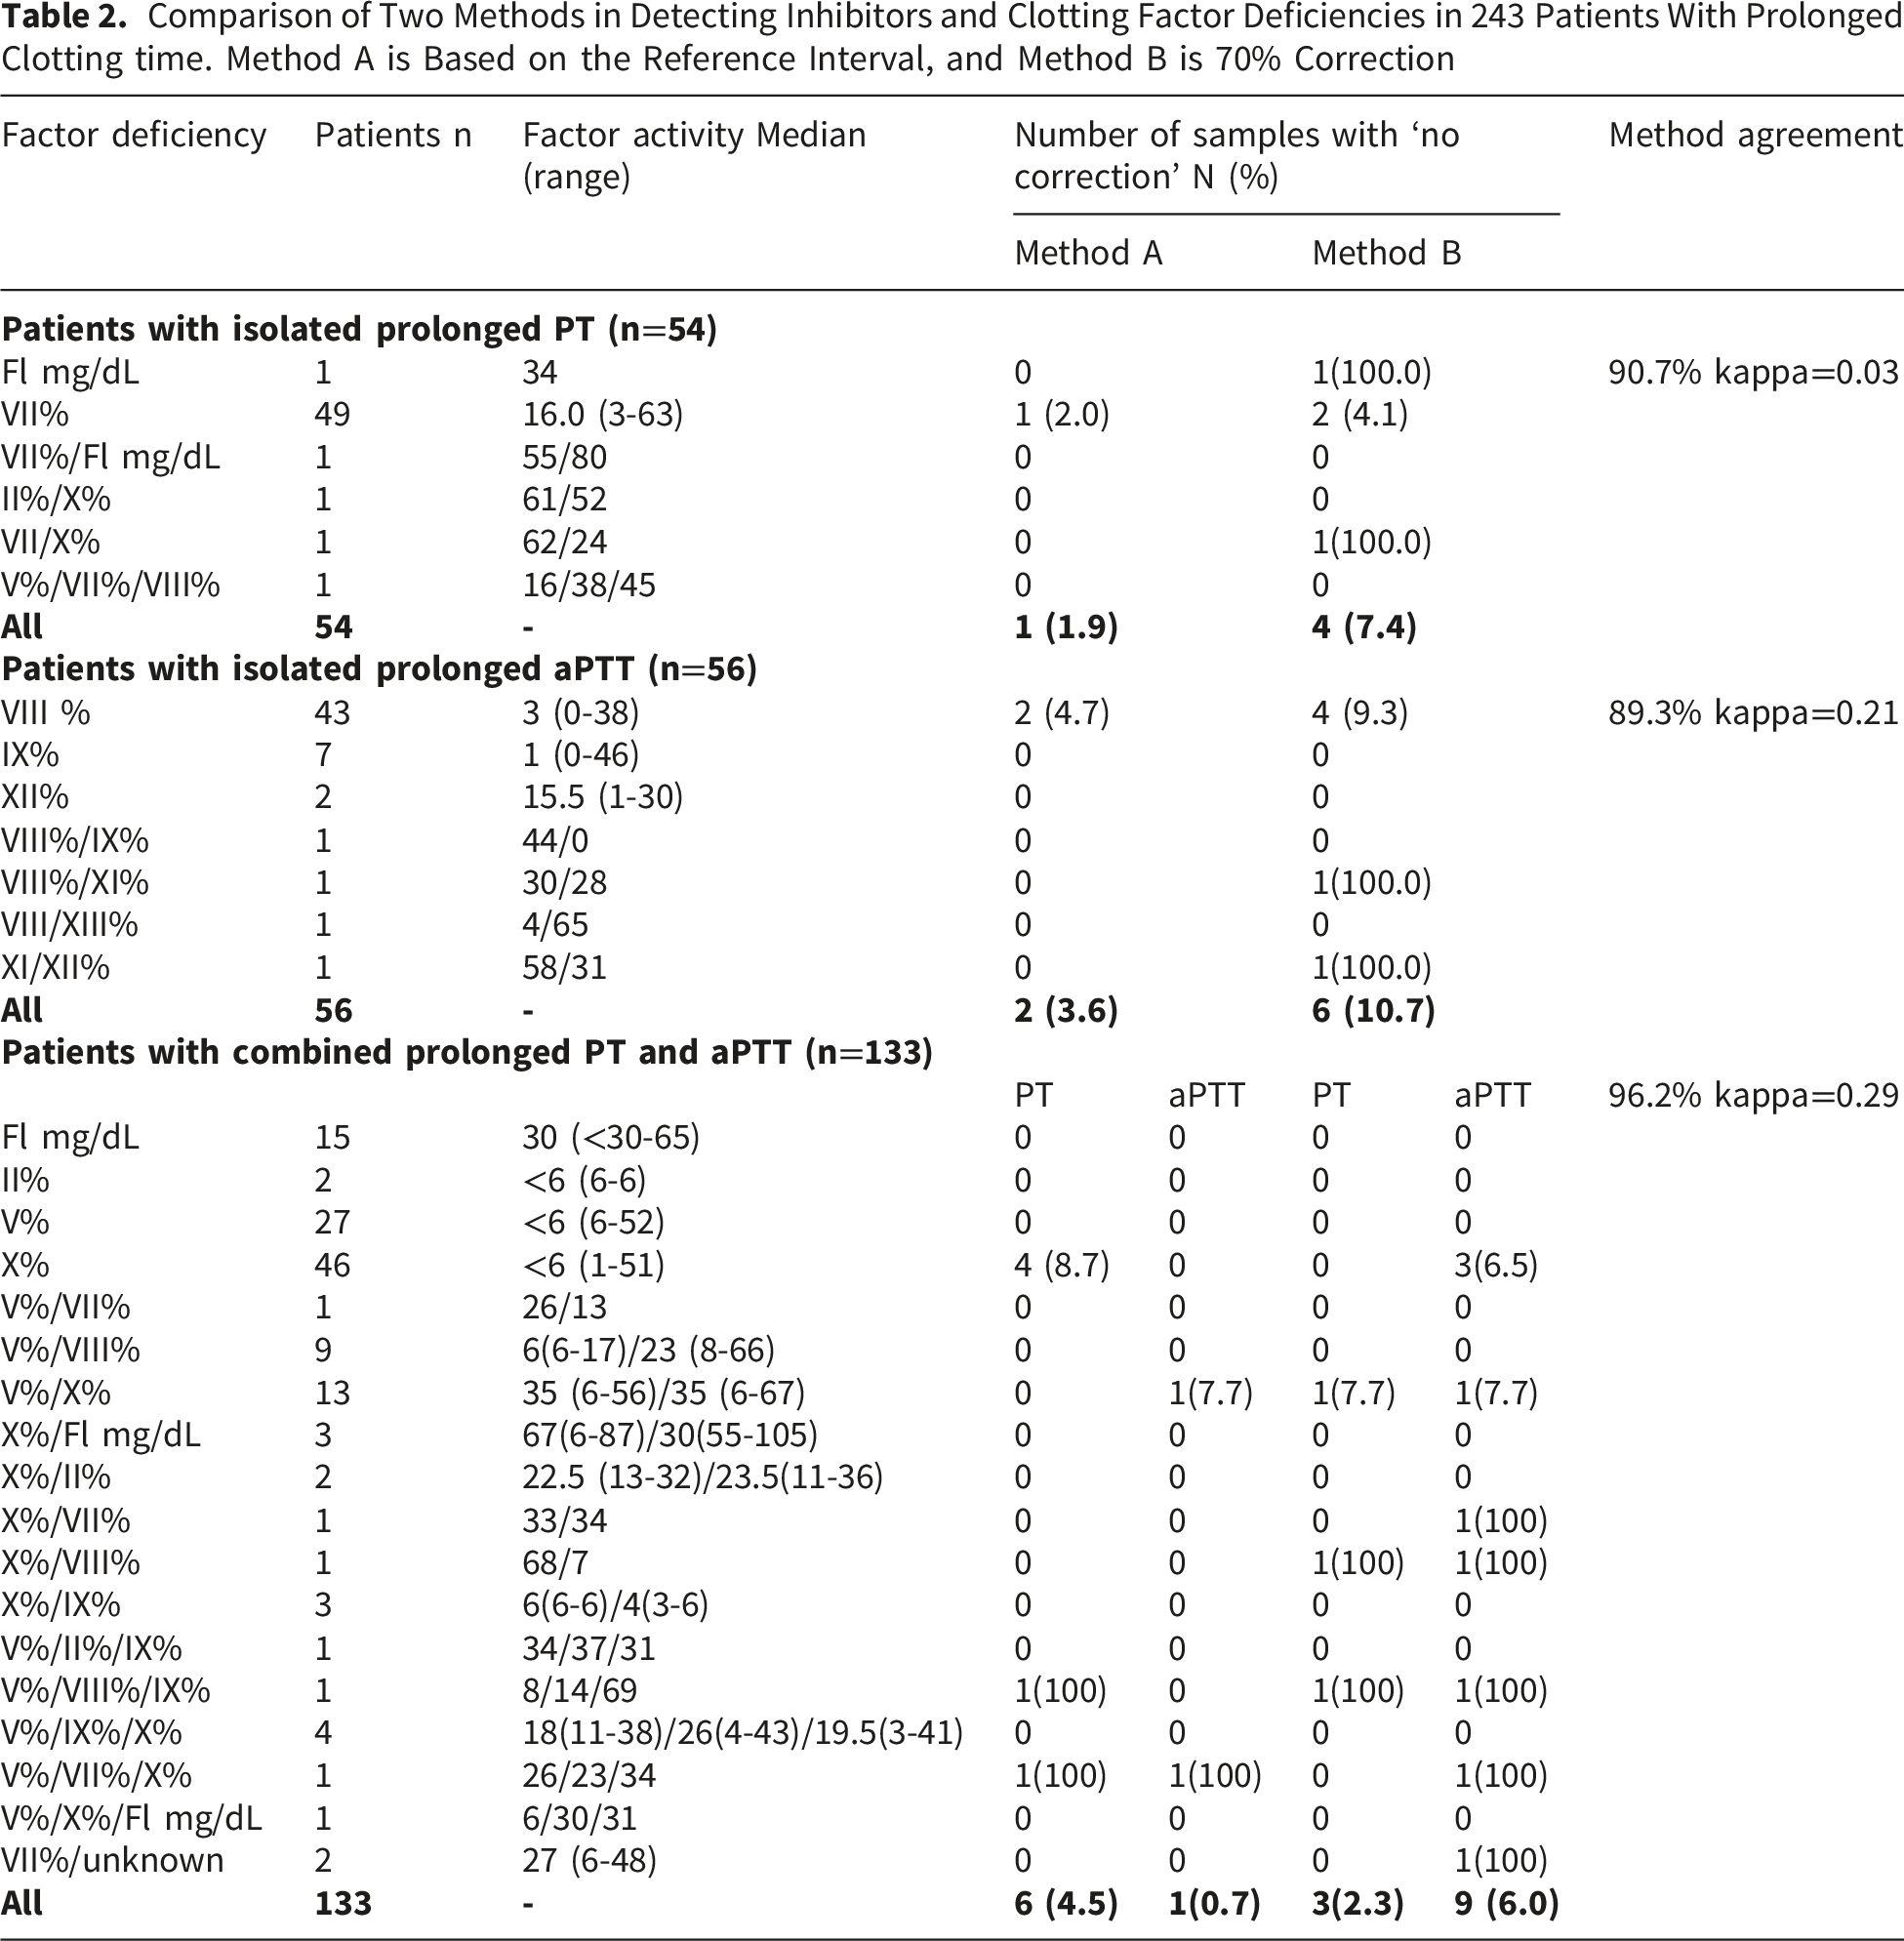
Inhibitor detection varied based on interpretive criteria: the upper reference interval method (Method A) identified 12/243 cases (4.9%), the 70% correction criterion identified 20/243 cases (8.2%) overall, and the Rosner Index identified 7/189 cases (3.7%) among samples with prolonged aPTT, demonstrating method-dependent discordance.
Comparison of Two Methods
Figure 2 shows that, according to percentage correction (Method B), inhibitors were detected in 4 of 54 (7.4%) PT-, 6 of 56 (10.7%) aPTT-, and 10 of 133 (7.5%) PT/aPTT samples. Table 2 summarizes the results of mixing tests in patients with prolonged PT (n=54), aPTT (n=56), and both PT/aPTT (n=133), along with clotting factor assays, and compares correction versus no correction using both methods. This demonstrates high agreement between Method A (<URI) and Method B (>70% correction) for PT and aPTT correction across all samples. It indicates that Method A and Method B were concordant in 49 of 54 samples (90.7%) with prolonged PT. Despite this high overall agreement, Cohen’s kappa was −0.03, indicating a significant category imbalance, with very few non-corrected samples. Among the 56 samples with prolonged aPTT, Methods A and B agreed in 50 cases, yielding an agreement rate of 89.3%. Cohen’s kappa indicated only weak agreement between the two methods (κ = 0.21), due to the low prevalence of non-correcting results. Across the total cohort of 133 samples, Method A and Method B produced concordant results for both PT and aPTT in 128 cases, corresponding to a crude agreement rate of 96.2%. Cohen’s kappa showed weak agreement for PT and aPTT (κ = 0.29), reflecting the low occurrence of non-correcting samples. Flow diagram showing the application of the ISTH algorithm for PT and aPTT mixing results. The insert showed that the upper reference interval identified 12 patients (of 243) with inhibitors, whereas the application of percentage correction and the Rosner Index detected inhibitors in 20/243 and 7/189 patients, respectively Comparison of Two Methods in Detecting Inhibitors and Clotting Factor Deficiencies in 243 Patients With Prolonged Clotting time. Method A is Based on the Reference Interval, and Method B is 70% Correction
Rosner Index (Method C)
A Rosner Index>15% was observed in 3 of 56 samples (5.4%) with prolonged aPTT, and 4 of 133 samples (3.0%) with both prolonged PT/aPTT (Figure 2). Subtraction > 0 was observed in all 7 patients. In 56 paired aPTT samples, methods B (>70% correction) and C (<15% Rosner Index) were concordant for correction in 53 cases, yielding 94.6% agreement. Cohen’s kappa indicated moderate agreement between the methods (κ = 0.64). Similarly, in the aPTT analysis of the 133-cohort, Methods B and C showed concordant results in 128 cases, yielding a crude percentage agreement of 96.2%. Cohen’s kappa demonstrated moderate agreement between the two methods (κ = 0.59).
Clinical Implications
Summary of Clinical and Laboratory Workup in Patients With Non-correction in Mixing Studies According to ICSH Recommendations
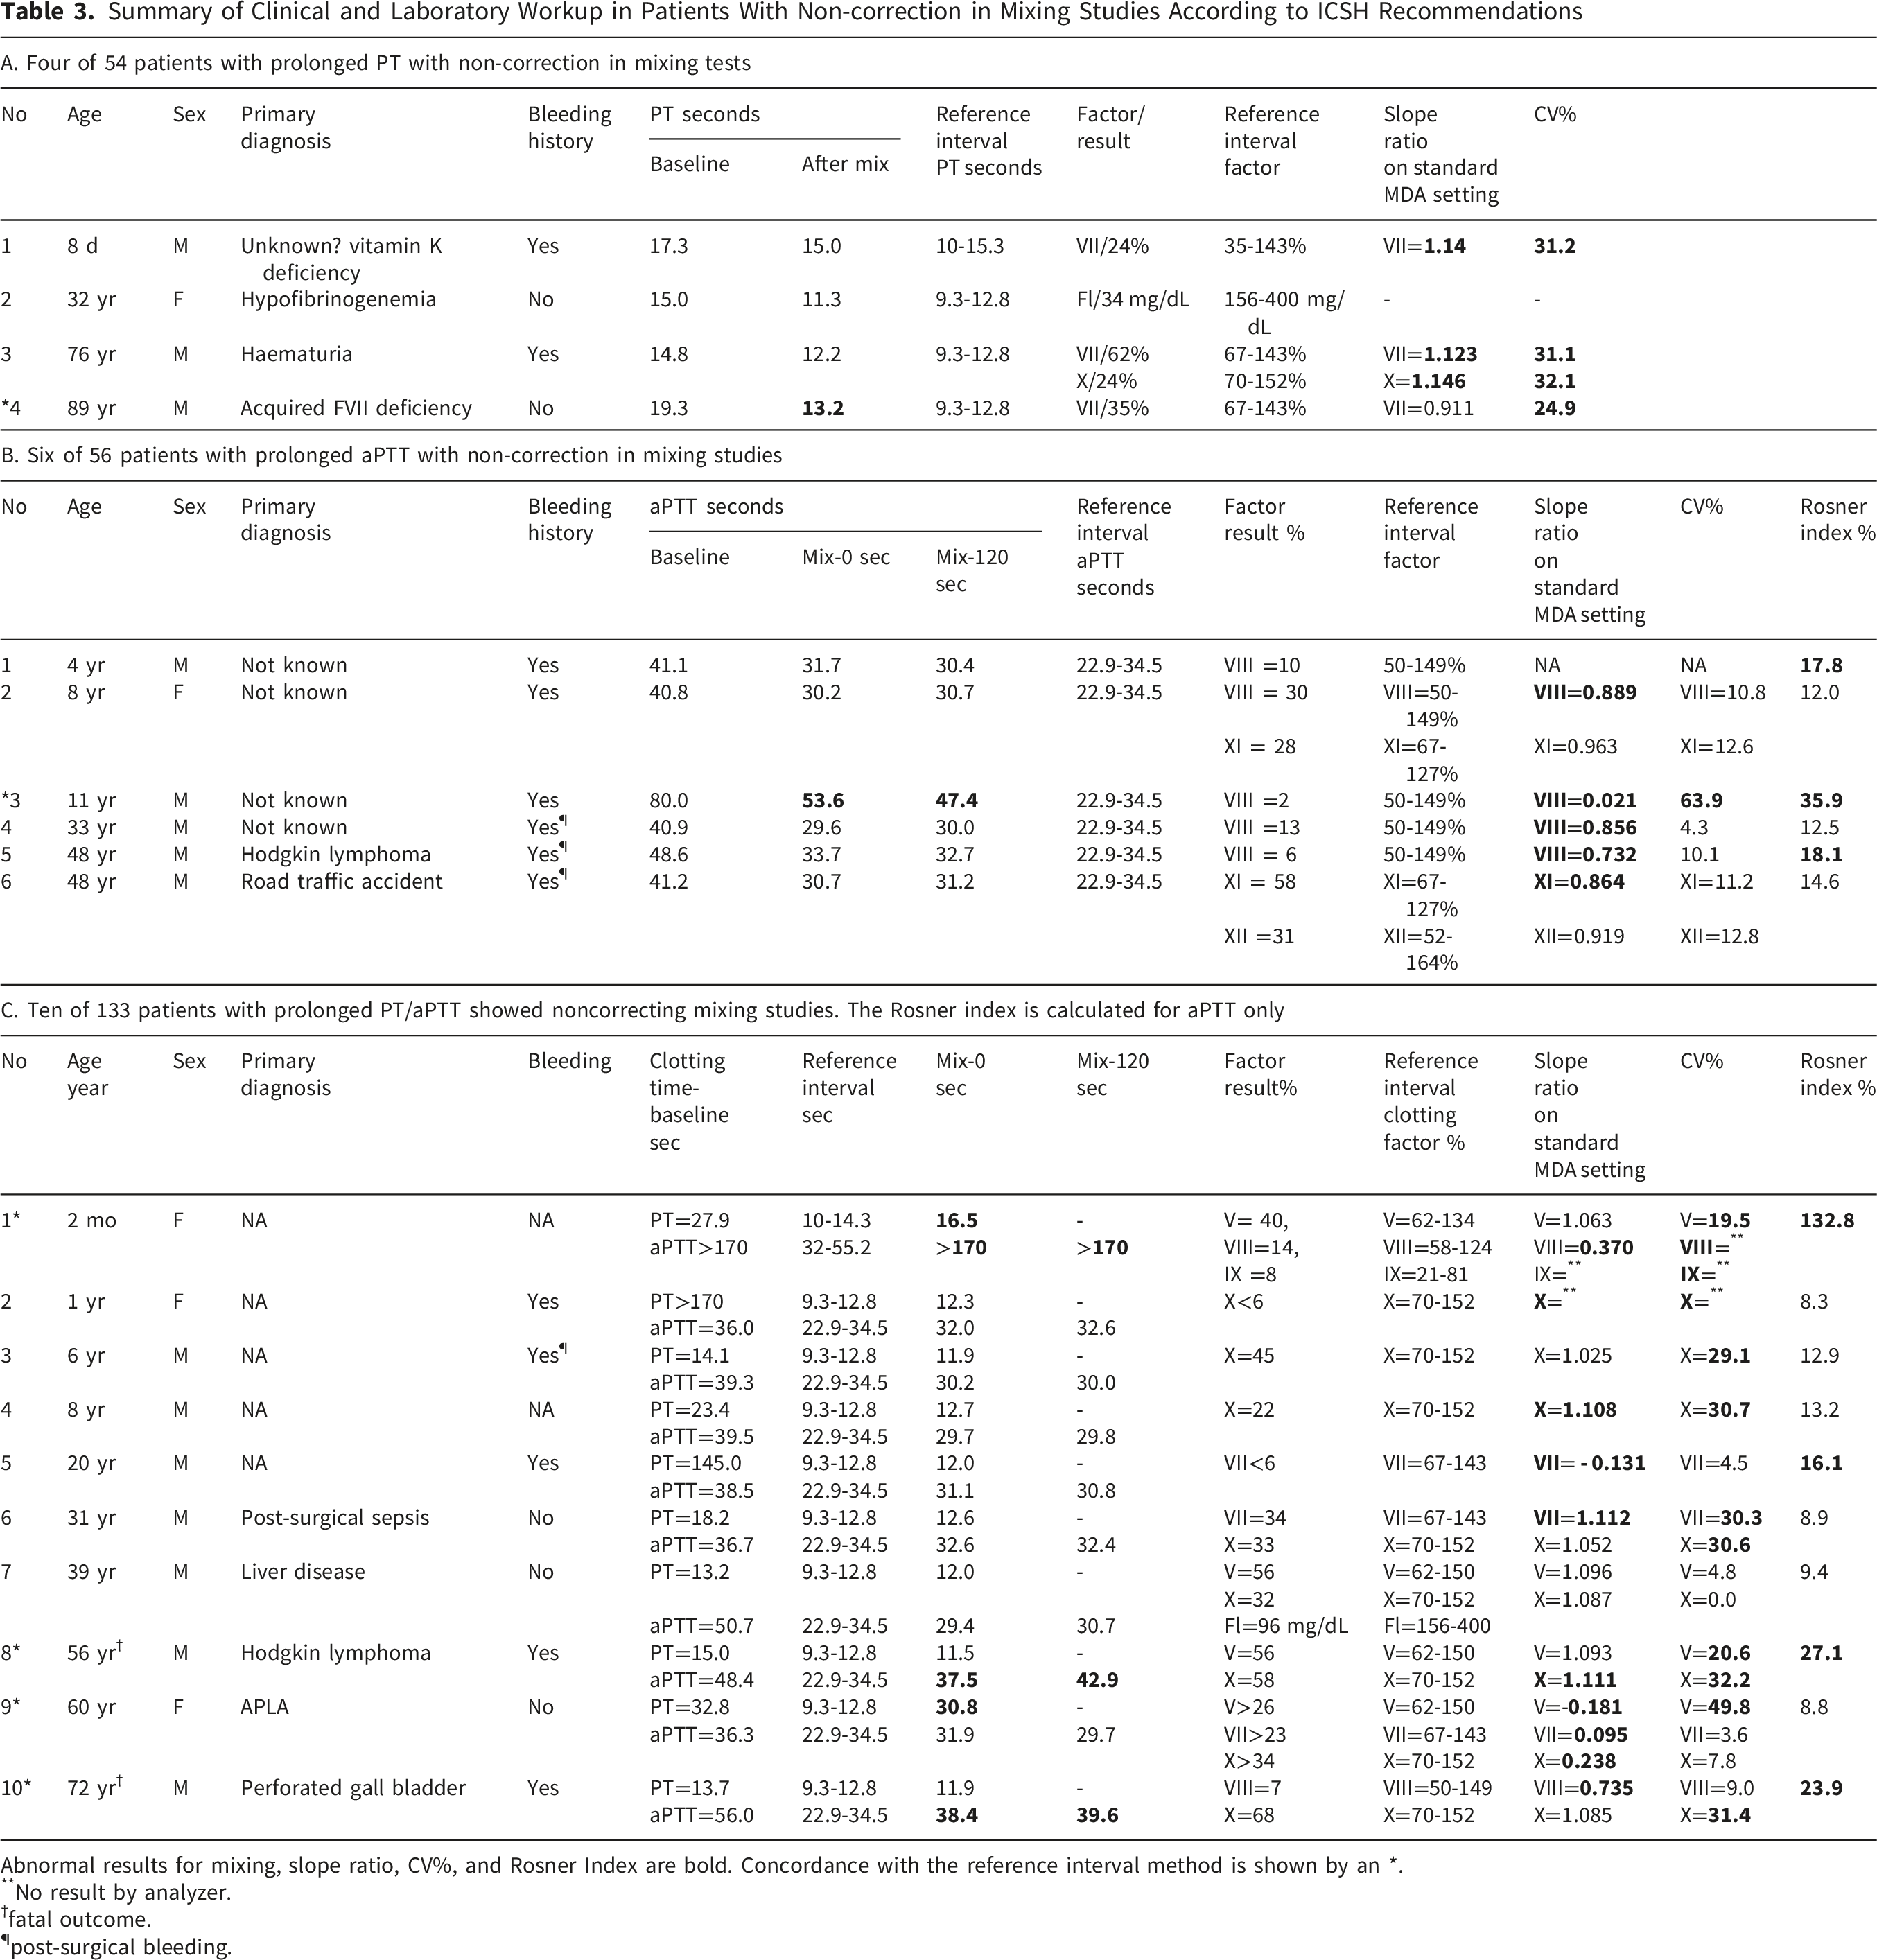
Abnormal results for mixing, slope ratio, CV%, and Rosner Index are bold. Concordance with the reference interval method is shown by an *.
**No result by analyzer.
†fatal outcome.
¶post-surgical bleeding.
Among 56 patients with prolonged aPTT (Table 3B), the percentage correction indicated an inhibitor pattern in six cases. All these patients had decreased factor levels. Inter-dilution CVs were < 15% in five patients and > 15% in one patient (#3). Impaired parallelism, defined as a slope ratio < 0.9, was observed in five of the six cases. However, the Rosner Index exceeded the inhibitor cut-off of 15% in only 3 patients, indicating discordance among interpretive parameters.
Among 133 patients with both PT and aPTT prolongation (Table 3C), inhibitors were identified in ten cases using percentage correction. All ten had decreased levels of clotting factors. Inter-dilution CVs were >15% in 8 patients and <15% in 2 patients. A Rosner Index >15% was observed in 4 patients, and impaired parallelism (SR <0.9 or>1.1) was present in 7 patients. Patient #8 (Table 3C) had antiphospholipid syndrome with a prolonged PT and mildly prolonged aPTT, along with multiple clotting factor deficiencies. The Rosner Index detected no inhibitor in this patient, and we were unable to dilute out the LA effect at higher MDA settings; thus, the clotting factor activity was reported as greater than the top routine dilution.
Discussion
We applied the ICSH-recommended algorithms 17 to patients’ samples to assess their ability to identify clotting factor deficiencies in a clinical laboratory where clinical details are not always readily available. Overall, both methods demonstrated excellent agreement for PT and aPTT, with consistently high percentage agreement exceeding 89% across all analyses. The URI-based interpretation identified fewer inhibitors than the 70% correction method. Specifically, for aPTT, the URI approach detected inhibitors in two cases, whereas the 70% correction criterion identified six cases, indicating greater sensitivity with the latter. Given the skewed distribution toward correction results, percentage agreement proved to be a more informative performance metric than Cohen’s kappa, especially for PT.
Inhibitor detection varied based on interpretive criteria: URI method identified 12/243 cases (4.9%), the 70% correction criterion identified 20/243 cases (8.2%) overall, and the Rosner Index identified 7/189 cases (3.7%) among samples with prolonged aPTT, demonstrating method-dependent discordance. This was also observed in a recent study involving 20 clinical laboratories worldwide, using different reagents, instruments, and interpretation techniques, which concluded that no single method could reliably distinguish between clotting factor deficiencies and inhibitors. 15 This variability emphasizes the complexity of interpreting mixing studies and highlights the need for new, standardized guidelines, as recently proposed by ICSH. 17
Our validation studies showed that correction rates above 70% and Rosner Index below 15% effectively identify single or multiple clotting factor deficiencies in samples with prolonged PT and aPTT. However, interpreting mixing studies using these methods was complex when concurrent clotting factor inhibitors or LA were present. 11 Correction was observed in samples with prolonged PT due to prothrombin deficiency caused by prothrombin inhibitors. This was expected because non-neutralizing prothrombin inhibitors do not bind to the prothrombin active site, leading to correction in mixing. As these immune complexes are cleared more rapidly, pharmacokinetic studies and ELISA are needed for proper evaluation. 23 During validation of results in six known patients with AHA, we observed no correction in the immediate-phase aPTT in four patients and in the incubated-phase aPTT in the remaining two. Therefore, even if immediate aPTT correction occurs in suspected AHA, the incubated-phase aPTT should also be checked for non-correction. Samples with LA showed more variable responses, with low FX (and/or FV and FVII) levels. Since an LA-insensitive aPTT reagent was used in this study, correction was seen in three of the four samples with initially prolonged aPTT in the immediate phase. We observed an increase of more than 3 seconds in incubated aPTT compared with immediate aPTT in 4 of 6 patients with FVIII inhibitors and in 1 of 3 patients with LA. In general, FVIII inhibitors are time- and temperature-dependent,24,25 whereas LA are not. However, to further complicate matters, 15-20% of LA exhibited time- and temperature-dependent behavior. 26
In our clinical laboratories, we use URI to define correction. Its main limitations are its dependence on a well-established normal range 27 and sensitivity to reagent variability. However, the method provides a quick, straightforward assessment but often fails to accurately interpret samples with very low or multiple clotting factor deficiencies. For example, we found that slightly prolonged mixing (1 or 2 seconds) could fall outside a narrow range, potentially leading to a false-positive inhibitor result even when the correction was significant. In our study, 7 of 133 patients in the cohort had no correction using URI; they had either <6% clotting factor activity (n=4) or multiple clotting factor deficiencies (n=3) on PT. Six of these patients’ samples showed 70% or more correction in mixing studies, which we considered more reliable than URI. A similar observation was made by Favaloro EJ (2019), who reported that mixing studies work best with single rather than multiple clotting factor deficiencies. 2
A retrospective study of 361 samples, including 75 LA-positive and 286 LA-negative samples, evaluated the significance of various methods for LA identification. 26 It was observed that the < 70% correction formula applied to aPTT mixing test results has a high sensitivity of 95% in detecting LA. However, this high sensitivity reduces its specificity to 60%. The Rosner Index, long regarded as a gold standard for detecting lupus anticoagulants (LA), showed higher specificity (82%) with comparable sensitivity (93%) in this study. 14 Among the 243 patients examined in this study, only one (# 8) had laboratory-confirmed LA, and, as expected, the aPTT was corrected in the immediate phase because we used an LA-insensitive aPTT reagent. The same patient showed no correction in mixing during the initial prolonged PT, suggesting that the PT reagent (Innovin) was sensitive to LA inhibition. 28
Lessons Learnt
The clinical details (history of bleeding, anticoagulant intake, etc.) are essential, along with the relevant diagnostic laboratory workup (RVVT, Bethesda assay, ELISA), because clotting factor deficiency, as identified by factor estimation, does not rule out the presence of concomitant specific or nonspecific clotting factor inhibitors. The ICSH 2024 guidelines, which recommend a structured, multi-step algorithm that combines elements of both immediate correction and incubated testing, aim to leverage the sensitivity of one method and the specificity of the other. Our experience supports this approach. The clinical significance of these findings is vital. For the treating doctor, a laboratory report of an “inhibitor” can lead to very different diagnostic and treatment pathways.
Strengths and Limitations
This study identified clotting factor deficiencies using ICSH algorithms. Limitations included data from a single center, reliance on specific reagents and equipment, and unknown clinical details, including drug history. The inhibitor titer was not measured in patients with AHA because the Bethesda assay was unavailable. RVVT was not performed in all patients suspected of having aPTT inhibitors. As a result, the sensitivity and specificity of the mixing study cutoffs for detecting inhibitors cannot be formally evaluated. In other words, because there is no confirmatory evidence of an inhibitor, the study cannot assess the reliability of the cutoffs for accurately distinguishing coagulation factor deficiency from inhibitor activity. However, the objective of our study was not to determine the diagnostic sensitivity or specificity for true inhibitors, but rather to evaluate the interpretation of mixing studies using the newly proposed ICSH recommendations and to compare their performance with commonly used interpretative approaches (such as upper reference interval methods).
Conclusions
The ICSH recommends mixing studies as screening tools to distinguish factor deficiency from inhibitor effects. Although confirmatory inhibitor assays (e.g., Bethesda assay) were unavailable and diagnostic sensitivity or specificity for true inhibitors could not be determined in this study, the application of the ICSH-recommended interpretative criteria provided a consistent and standardized framework for interpreting mixing study results. These findings therefore support the role of ICSH guidance in reducing interpretative variability at the screening stage, while recognizing that definitive inhibitor confirmation requires specific assays.
Supplemental Material
Supplemental material - Interpretation of Prothrombin Time and Activated Partial Thromboplastin Time Mixing Studies Using Predefined Algorithms
Supplemental material for Interpretation of Prothrombin Time and Activated Partial Thromboplastin Time Mixing Studies Using Predefined Algorithms by Fatima Farhan, Bushra Afaq Rizvi, Bushra Moiz in Clinical and Applied Thrombosis/Hemostasis
Footnotes
Funding
The authors received no financial support for the research, authorship, and/or publication of this article.
Declaration of Conflicting Interests
The authors declared no potential conflicts of interest with respect to the research, authorship, and/or publication of this article.
Supplemental Material
Supplemental material for this article is available online.
References
Supplementary Material
Please find the following supplemental material available below.
For Open Access articles published under a Creative Commons License, all supplemental material carries the same license as the article it is associated with.
For non-Open Access articles published, all supplemental material carries a non-exclusive license, and permission requests for re-use of supplemental material or any part of supplemental material shall be sent directly to the copyright owner as specified in the copyright notice associated with the article.