






Abstract
Micro-milling is inherently unstable and chattering with aberrational tool vibrations. While the time response is bounded, however, micro-milling can become unstably broadband and chaotic in the frequency domain, inadvertently rendering poor tolerance and frequent tool damage. A novel simultaneous time-frequency control theory is applied to negate the various nonlinear dynamic instabilities including tool chatter and tool resonance displayed by a multi-dimensional, time-delayed micro-milling model. The time and frequency responses of the force and vibration of the model agree well with the experimental results published by Jun et al. A multi-variable control scheme is realized by implementing two independent controllers in parallel to follow a target signal representing the desired micro-milling state of stability. The control of unstable cutting at high spindle speeds ranging from 63,000 to 180,000 rpm and different axial depth-of-cuts are investigated using phase portrait, Poincaré section, and instantaneous frequency (IF). The time-frequency control scheme effectively restores dynamic instabilities, including repelling manifold and chaotic response, back to an attracting limit cycle or periodic motion of reduced vibration amplitude and frequency response. The force magnitude of the dynamically unstable cutting process is also reduced to the range of stable cutting.
1. Introduction
Essential to producing complex three-dimensional products from a wide range of materials, micro-milling is critical to the advancement of technology for many industries as components are continuously being reduced in size and require increased functionality. However, micro-milling is subject to unpredictable tool life and premature tool failure which can ruin a workpiece and instigate costly and inefficient product inspection and resetting (Tansel et al., 1998; Gandarias et al., 2006). Thus it would be of direct impact to improve the efficiency of the process. Chip clogging, fatigue, and excessive stress related failure are identified as the three common micro-mill breakage mechanisms (Tansel et al., 1998). When the stress is below the endurance limit but above the normal operation level the tool will not fail immediately (Tansel et al., 1998). However, the stress on the shaft will change repeatedly while the tool is rotating causing the strain distribution to change repeatedly at the tool shaft, thus inducing fatigue. Vibrations with high or multiple frequency components increase the speed at which the strain distribution changes, inevitably resulting in fatigue failure occurring at an accelerated rate. The excessive stress related breakage occurs when there is a sudden increase in the cutting forces indicative of dynamically unstable cutting due to excessive vibration magnitudes. Also, excessive machining vibrations (chatter) affect the workpiece surface finish and tolerances, and result in larger cutting forces which are key indicators of tool performance (Byrne et al., 2003). Thus, micro-milling performance and failure are directly affected by the dynamic response of the tool, rendering controlling dynamic instability fundamental to improving micro-milling efficiency.
Physical models are important for the characterization of dynamic instability, development and testing of control algorithms, and providing the insight needed for designing empirical research. Micro-milling cannot directly adopt the methods used for modeling macro-milling due to different cutting force mechanisms at work, such as the increased impact of material plowing. When the chip thickness is too small a chip will not form and the material will be plowed under the tool (Basuray et al., 1977). This phenomenon is more prominent in micro-milling due to the increased feed-rate to tool nose radius ratio. Micro-milling is a highly nonlinear process due to these additional nonlinear characteristics and the high spindle speeds which are commonly employed. To address the issue of micro-milling chatter an uncut chip thickness model is coupled with a finite element orthogonal cutting model in Afazov et al. (2012). Stability lobes are generated using statistical variances and chatter is defined as a statistical variance larger than 1 µm. However, the uncut chip thickness model reported by Afazov et al. (2012) fails to consider the elastic recovery of the material due to the plowing mechanism, thus hindering its veracity. Micro-milling stability lobes are produced by Park and Rahnama (2010) and Shi et al. (2012) but the stability lobes have limited accuracy when compared with the experimental data, and it is shown that the dynamic properties of the system have a substantial impact on the resulting stability. These stability lobes are generated through linearization which obscures the nonlinear characteristics of the process that are prominent in micro-milling. The experimental data in Park and Rahnama (2010) and Shi et al. (2012) show high frequency components and multiple chatter frequencies that are characteristics of a nonlinear process. The modeling and control analysis of the process should retain the inherent nonlinearities to effectively address dynamic instability. An effective method for modeling the nonlinear forcing mechanism of the micro-milling process is through slip-line field models. It is shown by Jin and Altintas (2012) that the comprehensive slip-line field model developed in Jin and Altintas (2011) outperforms the finite element model when predicting the magnitude of the cutting forces. A comprehensive slip-line model is developed by Fang (2003) for modeling the cutting process near the tool edge. Earlier slip-line models in Kim and Kim (1995) and Waldorf et al. (1998) predicted the shearing and plowing forces, and the force mechanism equations were improved upon by Jun et al. (2006a). The research reviewed above focuses on the development of force mechanisms for predicting cutting forces and does not investigate dynamic instability. Halfmann and Suh (2012) adopt the slip-line field force mechanism presented by Jun et al. (2006b) and account for material elastic recovery in the chip thickness calculation, the effective rake angle, and the helical angle of the tool for numerically studying the dynamic response. This model captures all the prominent nonlinear characteristics of micro-milling and will be adopted in this investigation to explore nonlinear micro-milling control.
There are several challenges in controlling micro-machining. In addition to the distinct cutting dynamics which differentiate micro-machining from macro-machining, the performance of miniaturized end-mill is greatly affected by the vibrations and excessive force. The influence of noise and the inadequate bandwidth of force sensors due to high rotational speeds make it difficult to measure cutting forces (Jin and Altintas, 2012). Unlike macro-machining, impulse hammer tests for investigating tool tip dynamics are not practical in microstructure due to the fatigue nature of miniature tools, and the accelerometers cannot be effectively attached due to their size and weight, which influence the overall dynamics (Chae et al., 2006). To estimate the microstructure tool dynamics, receptance coupling (RC) was implemented to mathematically couple the tool tip and the remainder of the tool using non-contact sensors (Rahnama et al., 2009). However, the development of micro-machining controllers still suffers from the challenges of miniature micro-structure. There are only a few research papers related to the control of micro-machining. The command shaping method was followed to reduce the tracking error of the micro-mills in Fortgang et al. (2005). It properly chose the acceleration profile of the DC motors on the precision linear stage to counteract the vibration caused by the internal force from the high speed motion of the tool. The contour error was reduced by cross-coupling, which established the real-time contour error model and returned the error correction signal to the motor of each axis (Liu et al., 2008). Piezoelectric stack actuators were mounted to directly control the relative motion between the tool-spindle and the workpiece of a micro-milling machine, and active vibration control (AVC) was used to suppress the vibration of the tool tip point (Aggogeri et al., 2011). As the response time of piezoelectric actuators cannot catch up with the high rotating speed of the spindle, the method can only apply to low-speed micro-machining.
From the literature review, it is concluded that there are no effective solutions for controlling chatter in micro-machining. One crucial factor is to regulate the highly nonlinear cutting forces. The cutting forces cannot exceed the critical limit of the tool in which sudden tool failure would occur. This limits the chip load and thus the material removal rate that can be achieved. Higher spindle speeds are then desired to increase the material removal rates of the process without increasing the chip load. However, the nonlinearities of the force mechanism become more prominent at higher spindle speeds, causing the increased excitation frequencies to result in dynamic instability. Another factor is that the control method has to adapt to the uncertainties of the cutting process as well as the changing dynamics. However, cutting instability in fact consists of the deterioration in both time and frequency domains due to the highly nonlinear nature of micro-milling process. A simultaneous time-frequency control scheme was developed to restrain the deterioration of time and frequency responses in the instability states of bifurcation and chaos (Liu and Suh, 2012a). It has been demonstrated to effectively deny milling chatter at high speed and restore milling stability as a limit cycle of extremely low tool vibrations (Liu and Suh, 2012b). The following sections together present a nonlinear micro-milling model that captures the intrinsic characteristics of the cutting process. Deriving from the simultaneous time-frequency controller design in Liu and Suh (2012a), a multi-variable nonlinear control scheme is then developed to facilitate the proper mitigation of micro-milling instability.
2. Nonlinear micro-milling model
The micro-milling model to be controlled is the one presented in Halfmann and Suh (2012) that accounts for the prominent nonlinear characteristics of the process. The forcing mechanism for the model adopts the slip-line force model developed by Jun et al. (2006a) which expanded upon the model in Waldorf et al. (1998) by accounting for the dead metal cap and adding an additional slip-line on the clearance face of the tool. The model in Halfmann and Suh (2012) neglects this additional slip-line assuming that, since the material takes time to recover and the feed rates used are larger than the tool nose radius, this additional slip-line will have a negligible effect on the cutting forces. When the chip thickness is greater than the critical chip thickness, it is assumed that both shearing and plowing forces are present. The shearing and plowing forces in the cutting and thrust directions as given in Waldorf et al. (1998), Jun et al. (2006a) and Halfmann and Suh (2012) are provided in equations (1) to (4),
The two-dimensional lumped mass, spring, damper model of the micro-tool.




These three cases indicate that accurately determining



The model also accounts for the effective rake angle and the helical angle. The derivation for the helical angle results in the following equations of force components,



To account for the helical angle, it is also assumed that the tool can be broken up into axial elements. Thus, the immersion angle

It is assumed that the tool can be modeled as the lumped mass-spring-damper system seen in Figure 1. It is also assumed that because of the very high stiffness in the Z-direction, tool vibrations along the spindle axis are negligible. This results in two coupled equations of motion governing the x- and y-direction motions of the tool as follows


3. Simultaneous time-frequency control
The novel nonlinear control law presented by Liu and Suh (2012a) was formulated to address the fundamental characteristics inherent of dynamic instability including bifurcation and chaos. Unlike modern control theories which focus on eliminating time domain errors, the control law restrains the deterioration of the time and frequency responses concurrently. The system response to be controlled is adjusted by least mean square (LMS) adaptive filters to force the system to follow a target signal, which is the response of a stable state before dynamic deterioration. Because neither linearization nor closed-form solution is required, all the genuine features of the nonlinear response are retained. The control scheme manipulates the corresponding discrete wavelet transform (DWT) coefficients of the system response to realize control in the joint time-frequency domain. The control scheme has been demonstrated to successfully negate the rich set of bifurcated and chaotic responses of a time-delayed milling model in Liu and Suh (2012b). The control theory is applied to the multi-dimensional micro-milling model described in equations (12) to (13). By following the multi-variable control architecture shown in Figure 2, x- and y-direction motions are determined using the force components that are defined by the feed and the instantaneous chip thickness in equations (5) to (7). To achieve multi-variable control, two independent nonlinear controllers are placed in front of the micro-milling model of each direction to mitigate the excitation force components. These two controllers operate in parallel and use different parameters.
Configuration of multi-variable micro-milling control.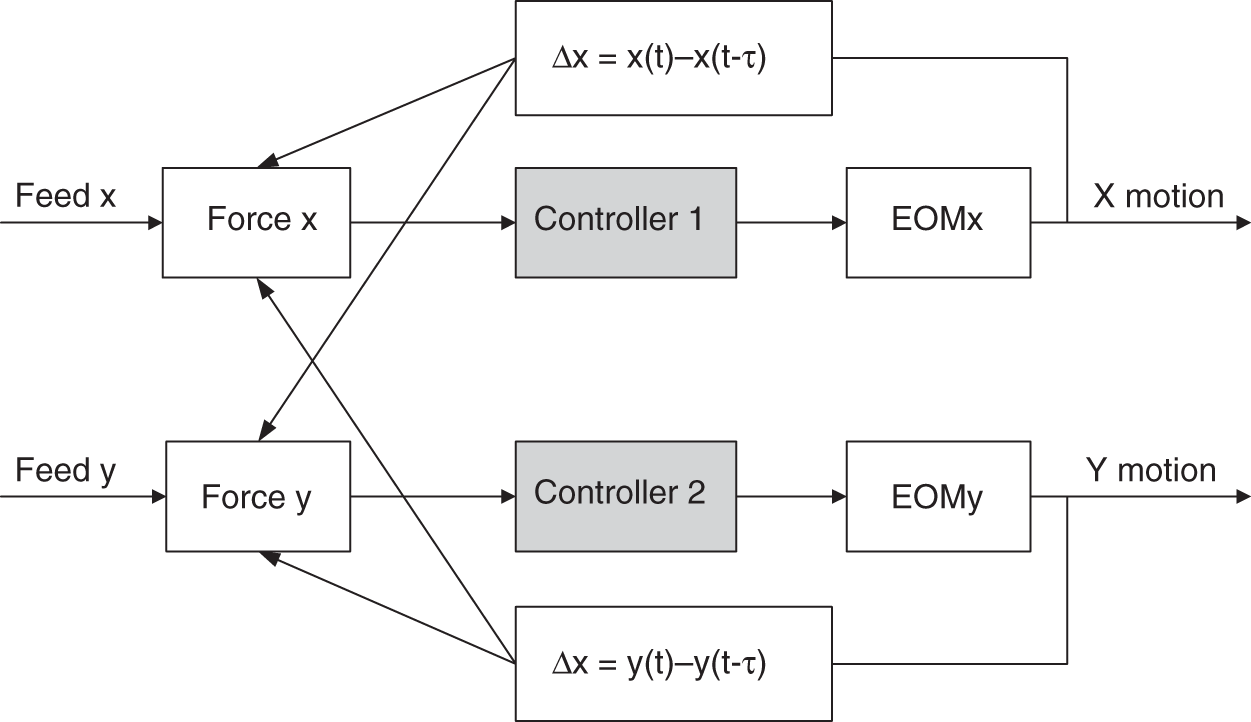
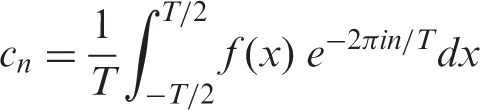
The target signal is formulated using the truncated Fourier series of a desired micro-milling state of response. The desired state is defined by a stable vibration amplitude and a bounded frequency response containing the elementary modes that differentiate themselves from the instability states of bifurcation and chaos. When the controller is turned on, the system will be restored back to the desired stable state defined by the target signal. The construction of the target signal is briefly reviewed in the following, with an illustrative example in the next section. The Fourier series provides an alternate way of representing a time signal by using harmonic functions of different frequencies. Suppose f is a T-periodic function defined within

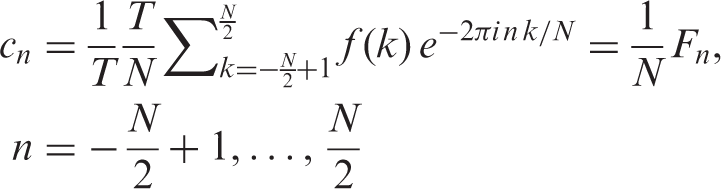
Assume that f(k) is the discrete form of f(x) having N points within
4. Control procedure
Simulation parameters utilized
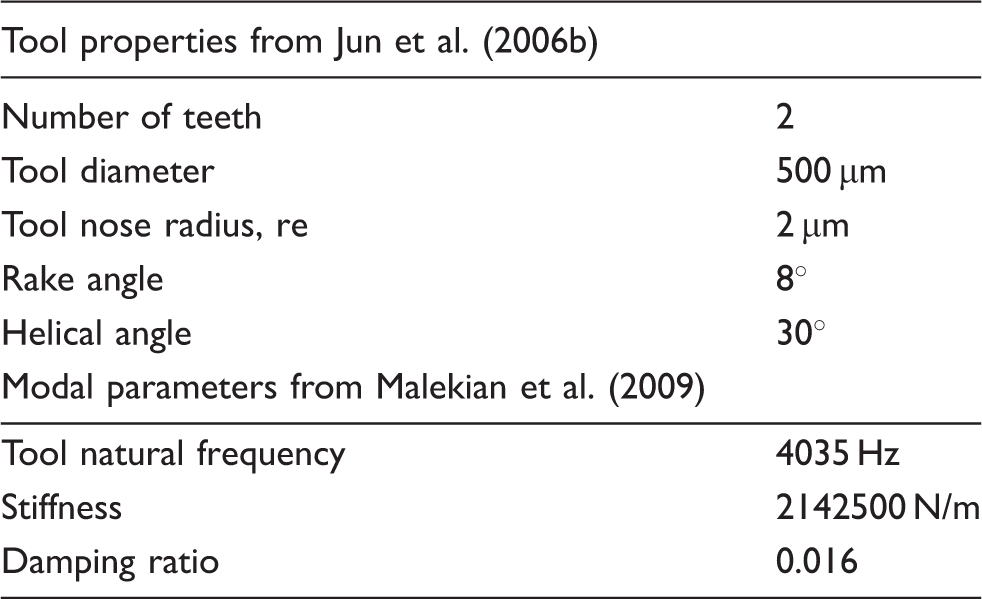
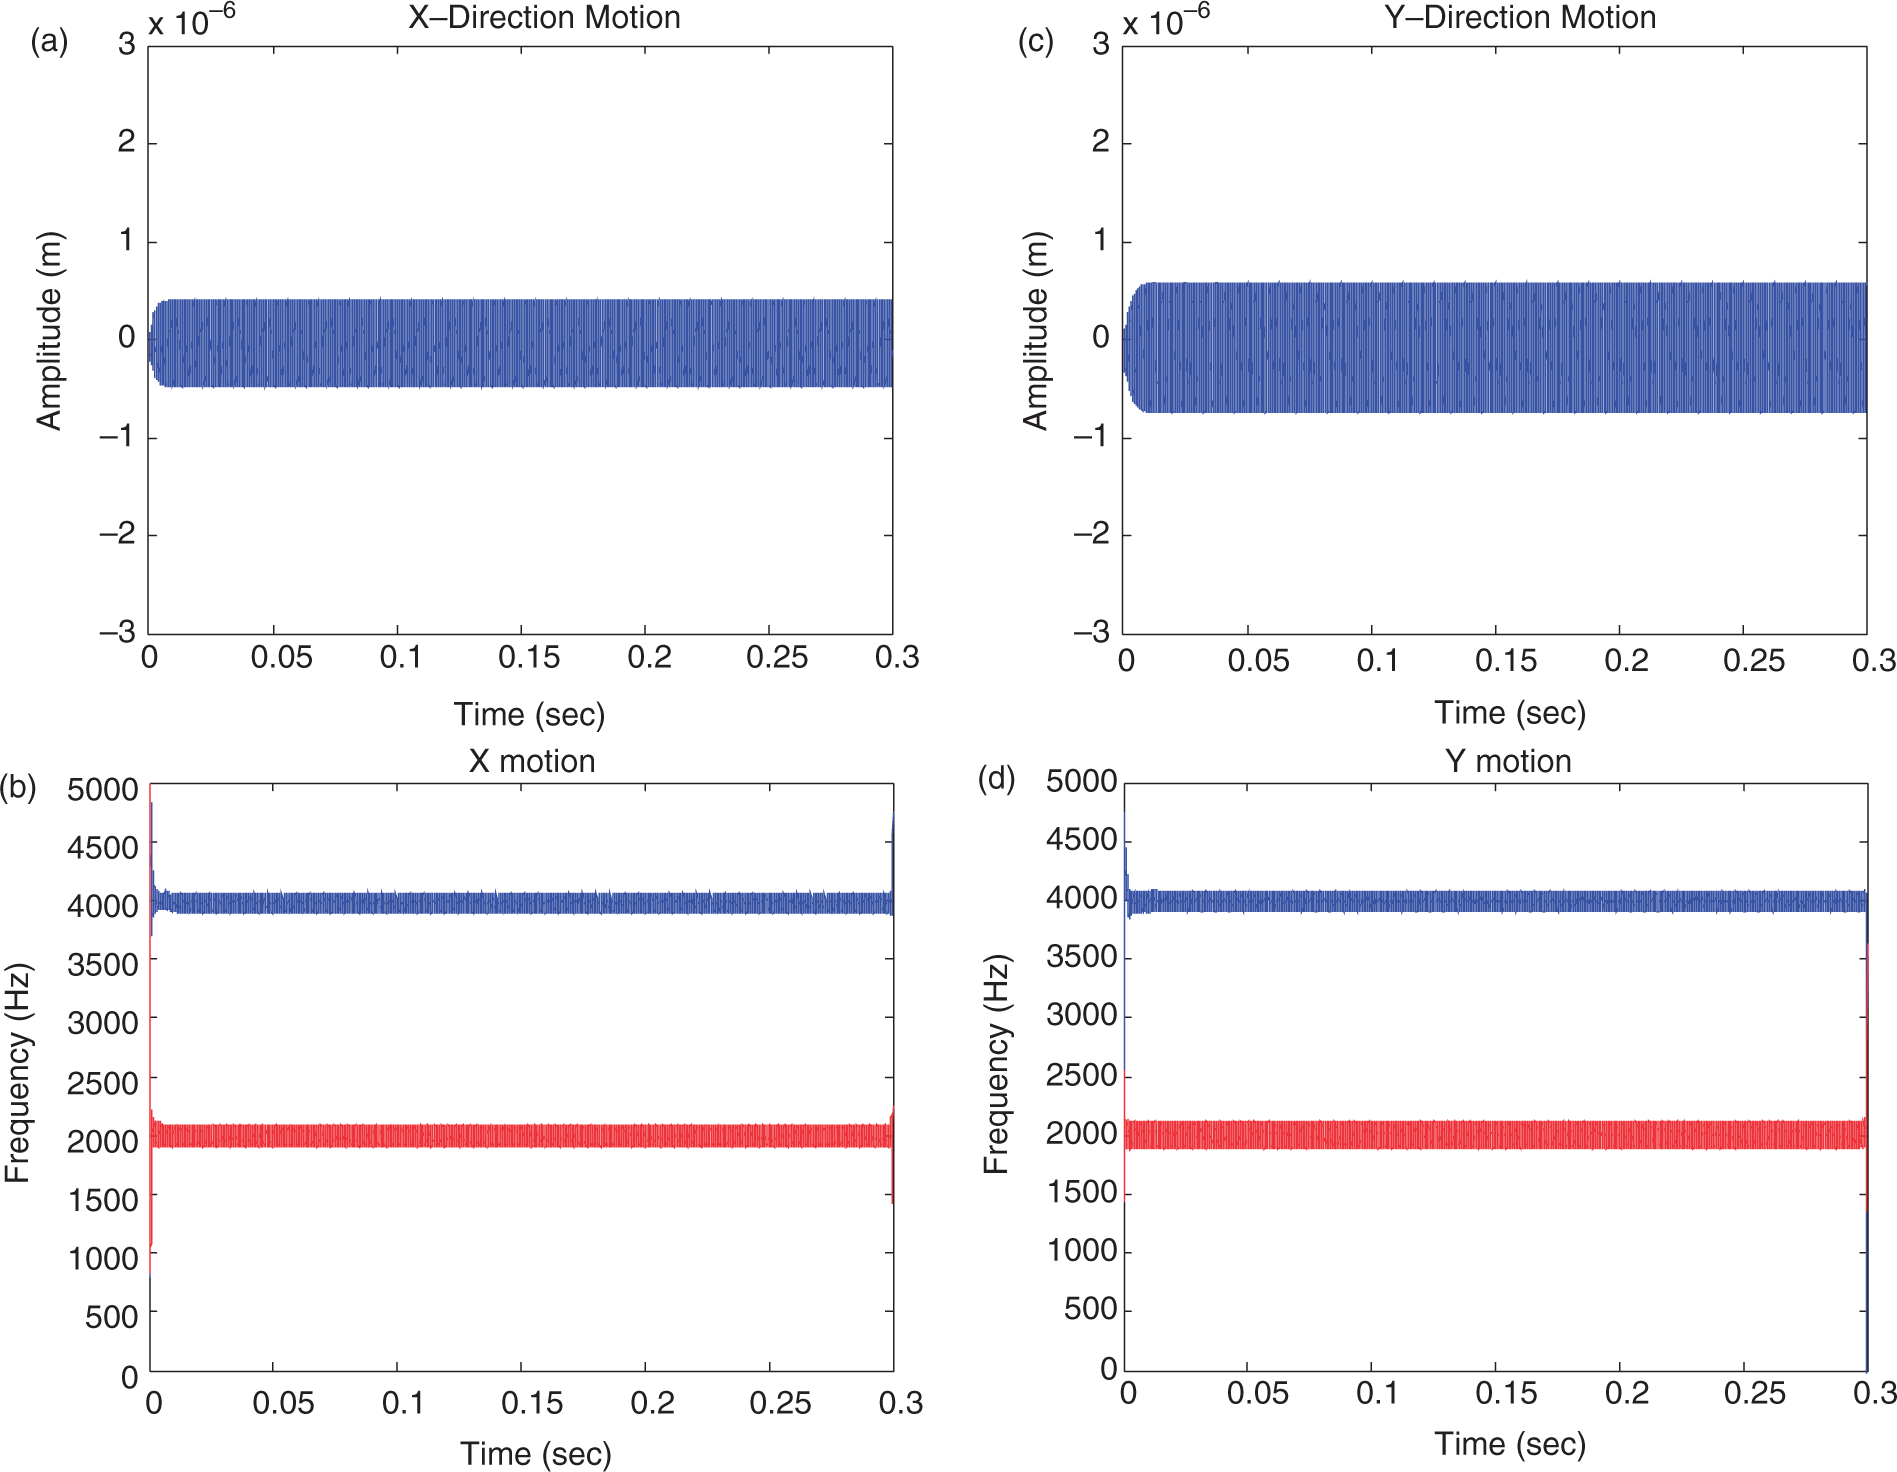
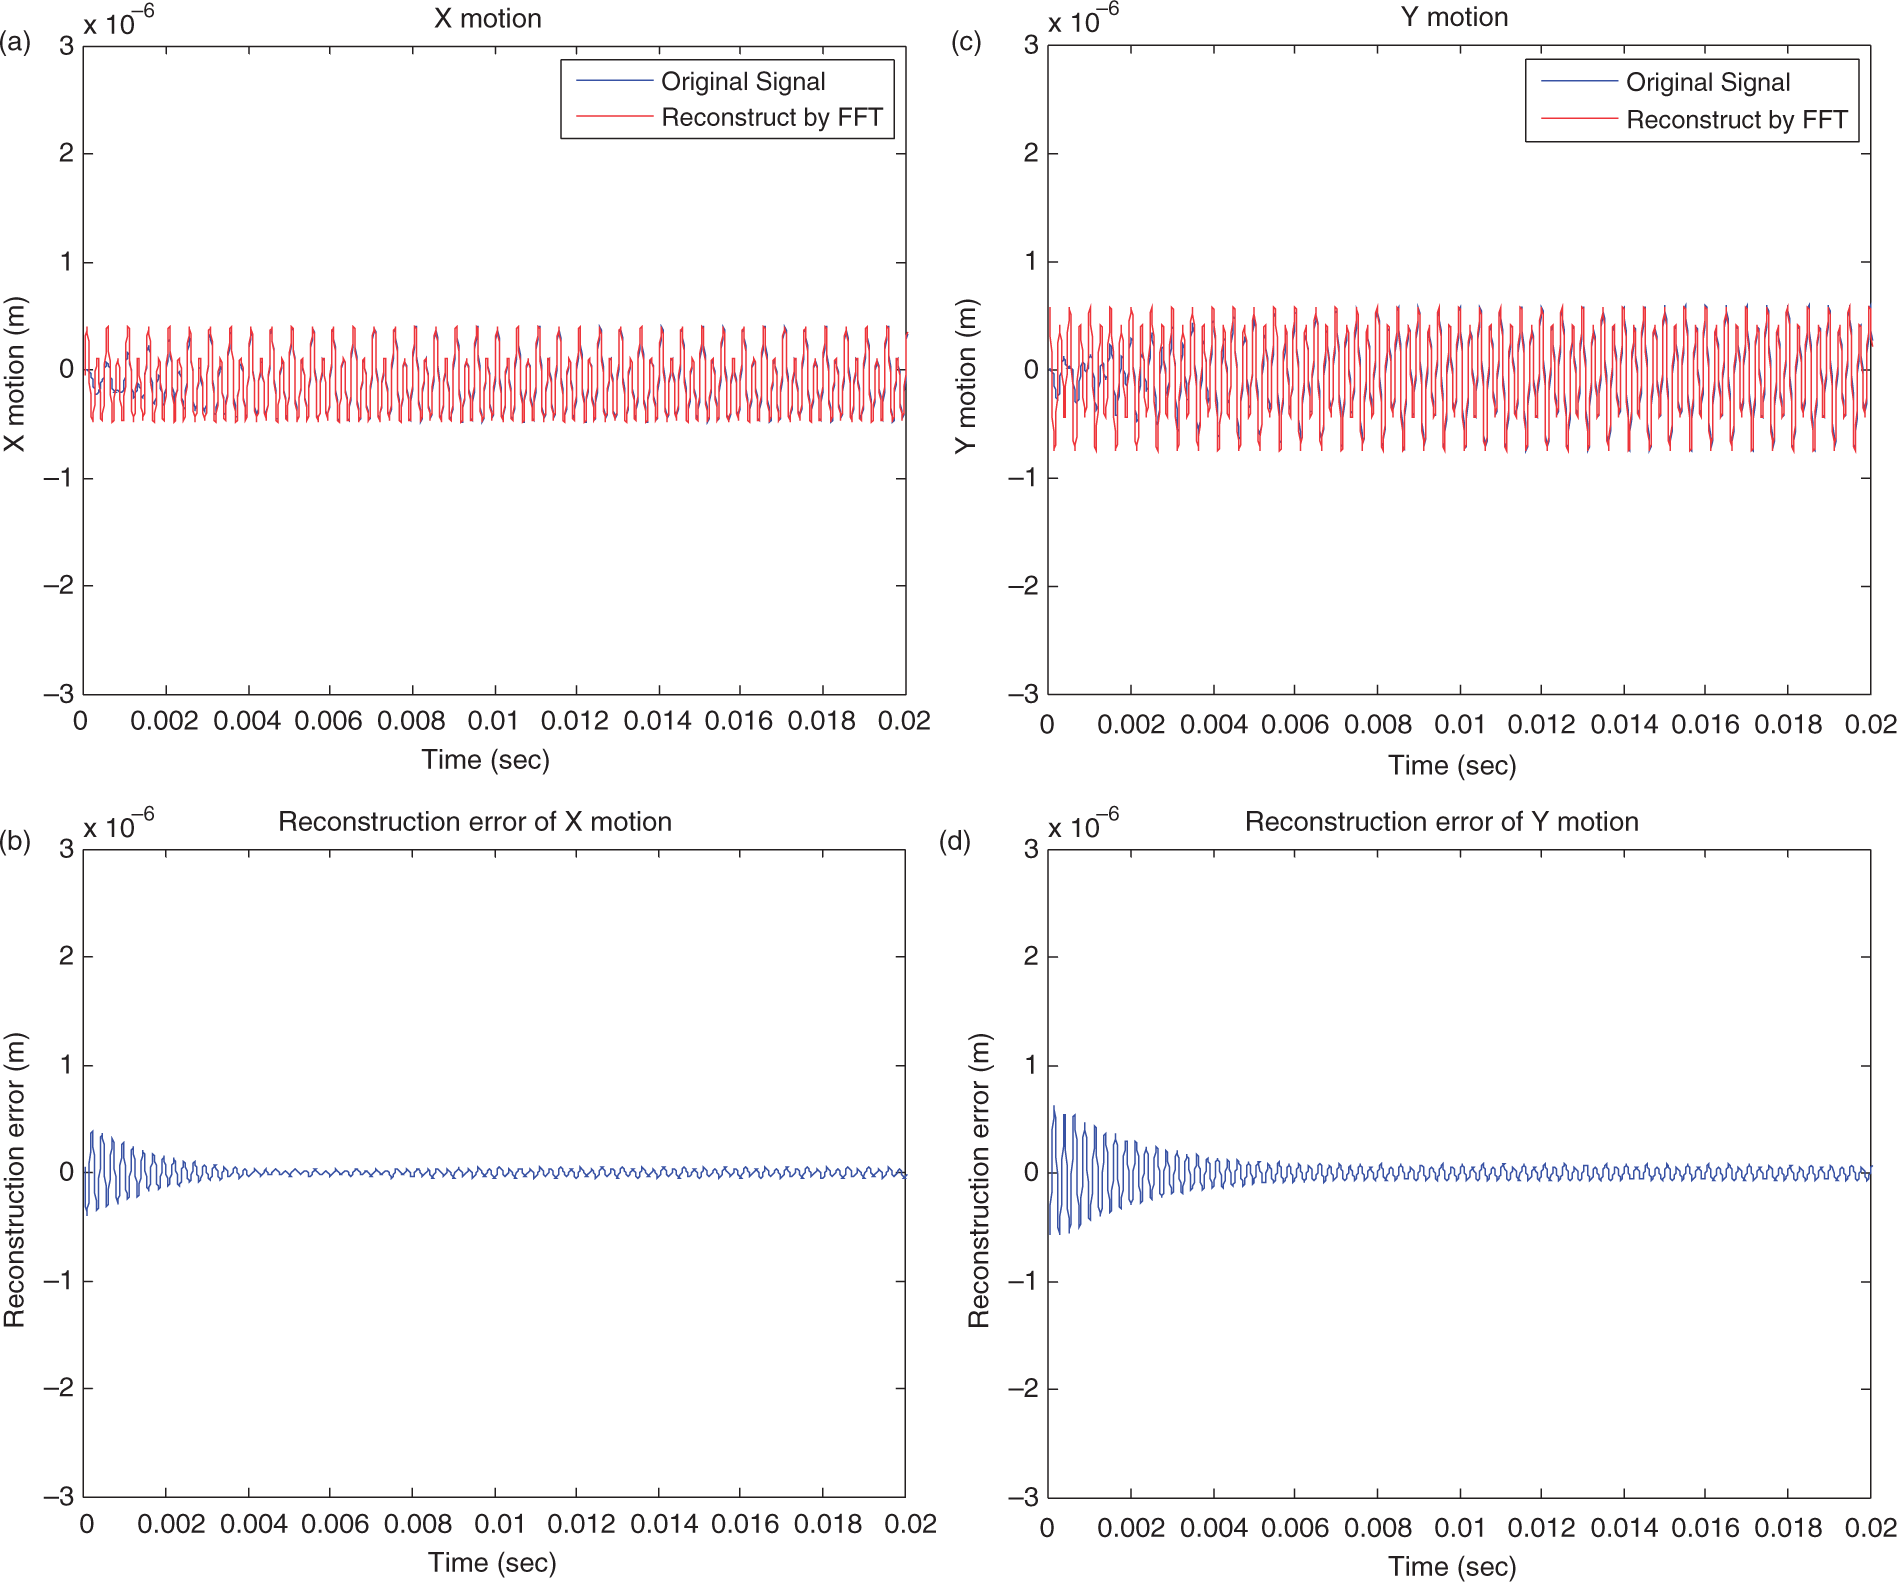
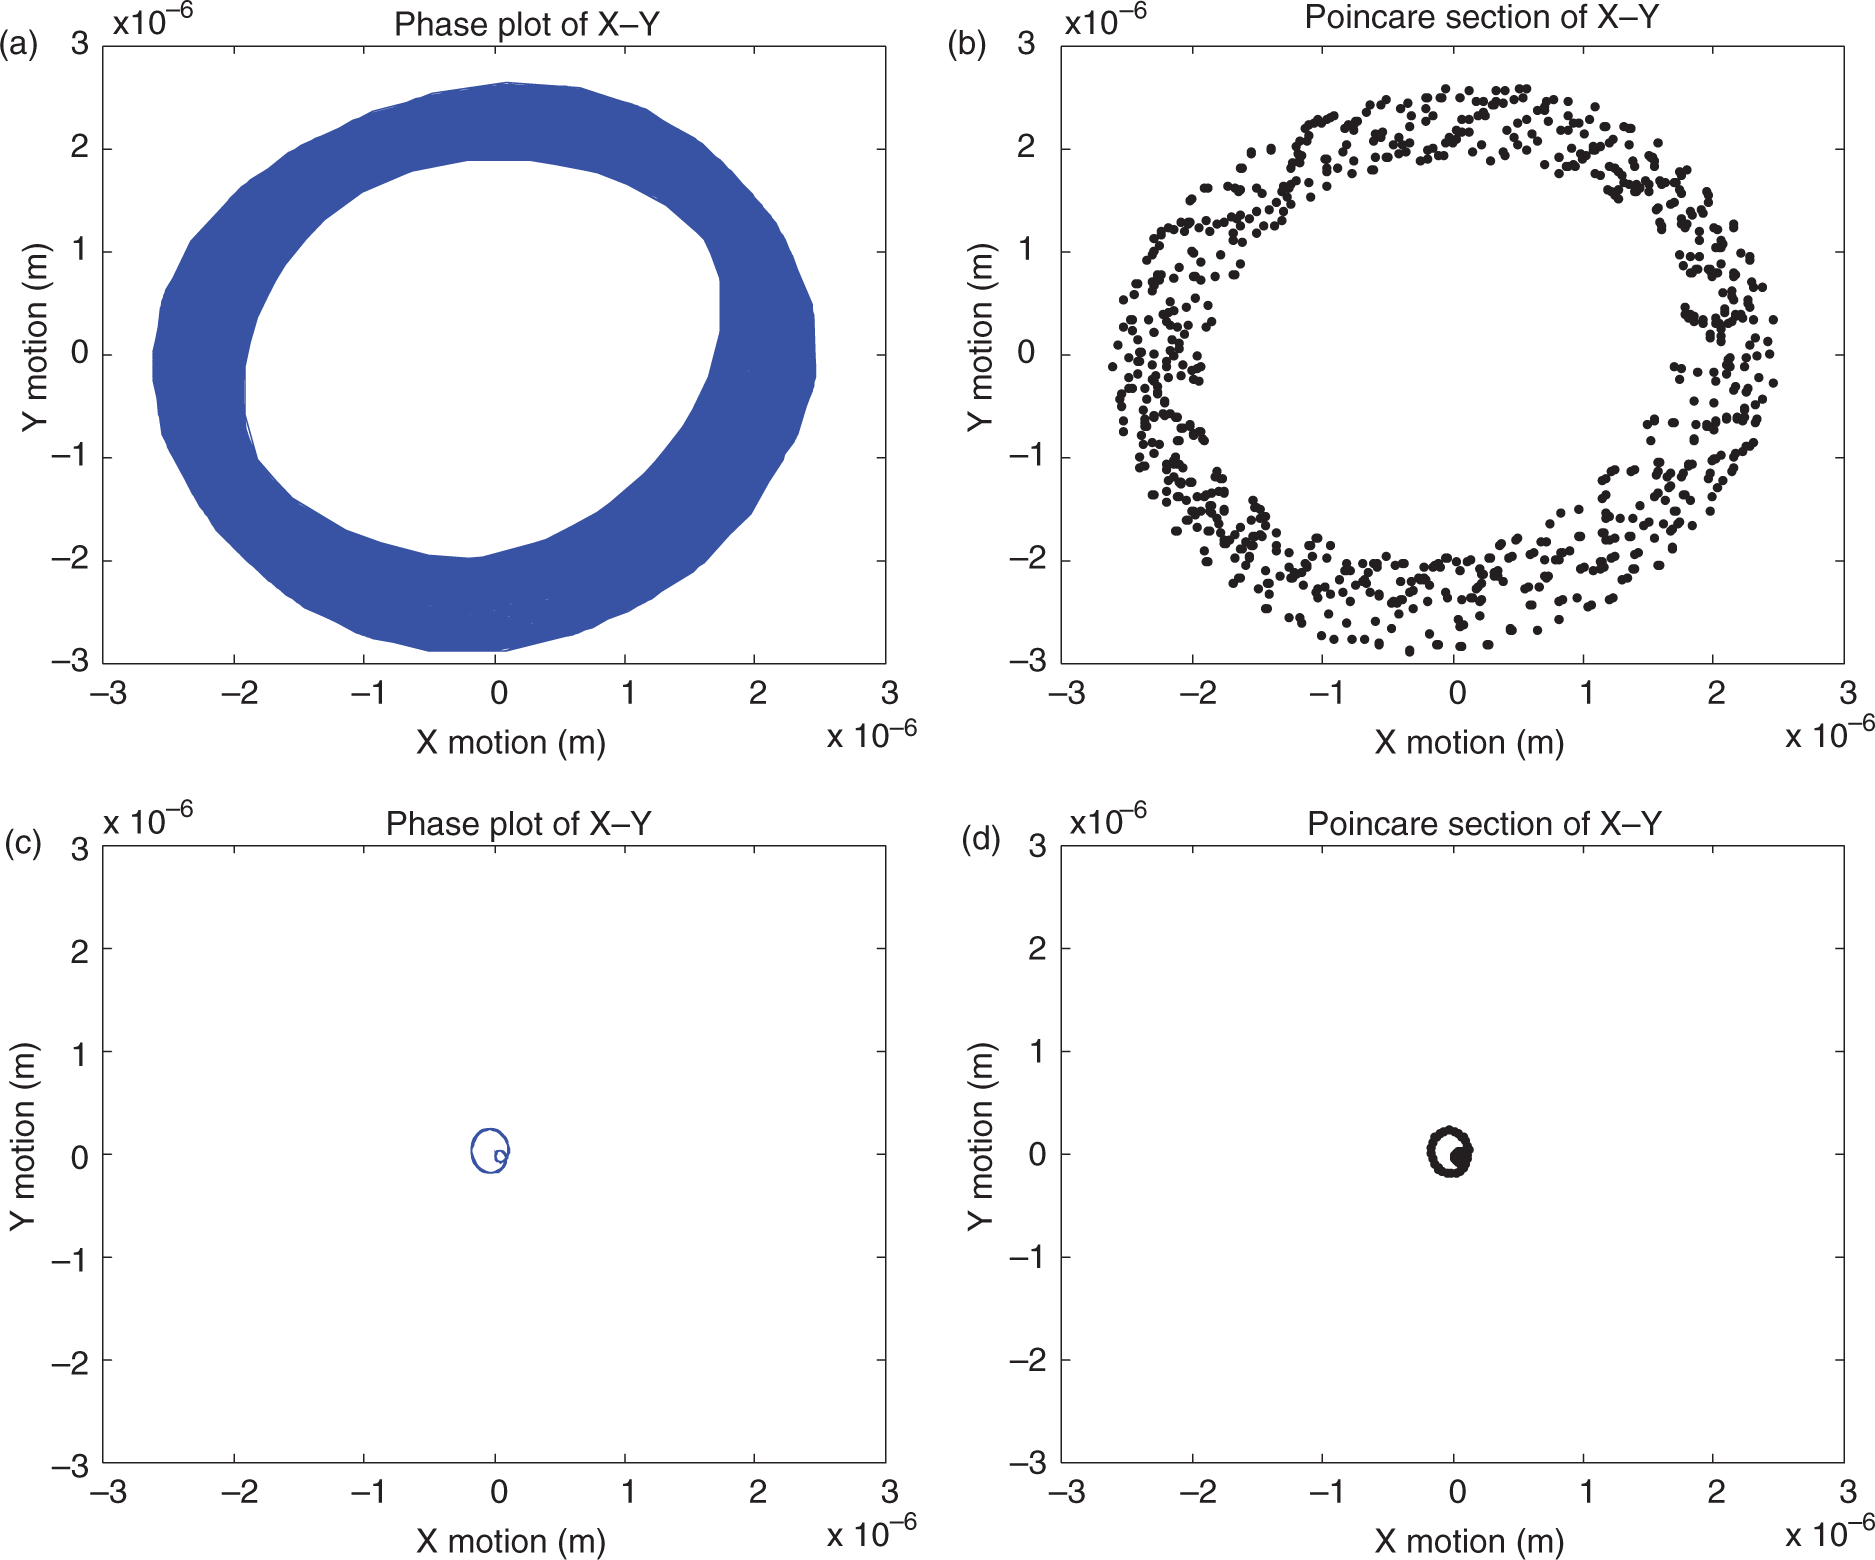
An unstable response is observed for a spindle speed of 63,000 rpm and 100 µm ADOC. Under these cutting conditions, irregularity is observed in both the time and frequency responses using instantaneous frequency (IF) (Huang et al., 2009). The time response and IF of the x- and y-motion are shown in Figure 3. A tool natural frequency at 4,035 Hz and tooth passing frequency at 2,100 Hz are observed. The tooth passing frequency is highly bifurcated as seen in the IF plots of Figure 3 which contain multiple frequency modes below the tooth passing frequency. When the spindle speed is reduced to 60,000 rpm and the ADOC is maintained at 100 µm, the tool response is one of stability (Figure 4). The vibration response has improved with lower vibration amplitude and the IF plot now shows a stable dynamic response containing the 4,035 Hz tool natural frequency and the 2,000 Hz tooth passing frequency. The goal of the research is to improve the dynamic stability of the process. Thus, it is desirable for the unstable response at 63,000 rpm and 100 µm ADOC (Figure 3) to better compare to the stable response at 60,000 rpm and 100 µm ADOC (Figure 4). The target signal for the controller is then developed based on the characteristics of the particular stable cutting. The target signal must contain the physically meaningful modes of the process as well as have acceptable vibration amplitudes. Then, the physically meaningful frequencies are retained while the undesirable frequency components are discarded. For the 63,000 rpm case, the target signal contains vibration amplitudes similar to the 60,000 rpm stable response and consists of only the tool natural frequency and tooth passing frequency modes. The reconstructed signal and the reconstruction error of the signal can be seen in Figure 5. The reconstructed signal is fed into the controller as a reference signal. Figure 6 shows that unstable cutting at 63,000 rpm now has a controlled vibration and frequency response when the controller is turned on at 0.2 seconds. The vibration amplitude is reduced to a level similar to that of the stable cutting which will significantly improve the workpiece tolerance and surface quality. The IF plot in Figure 6 also demonstrates an improved frequency response in which the individual modes are now bounded and range over a narrow bandwidth. The phase diagrams and Poincaré sections in Figure 7 indicate that the dynamic state of motion has improved once the controller is initiated. The uncontrolled phase plot and Poincaré section indicate a fractal-like limit cycle while the controlled phase plot and Poincaré section demonstrate quasi-periodic motion with reduced amplitudes and a finite number of well-behaved frequency components.
(a) Time response and (b) instantaneous frequency of x motion, and (c) time response and (b) instantaneous frequency of y motion when spindle speed = 63,000 rpm and axial depth-of-cuts = 100 µm. (a) Time response and (b) instantaneous frequency of x motion, and (c) time response and (b) instantaneous frequency of y motion when spindle speed = 60,000 rpm and axial depth-of-cuts = 100 µm. (a) Reconstructed target of x motion and (b) reconstruction error of x motion, and (c) reconstructed target of y motion and (d) reconstruction error of y motion. (a) Time response and (b) instantaneous frequency of x motion, and (c) time response and (b) instantaneous frequency of y motion when spindle speed = 63,000 rpm and axial depth-of-cuts = 100 µm. The controller is turned on at 0.2 second. (a) Phase plot of x-y and (b) Poincaré section of x-y before controlled, and (c) phase plot of x-y and (b) Poincaré section of x-y after controlled when spindle speed = 63,000 rpm and axial depth-of-cuts = 100 µm.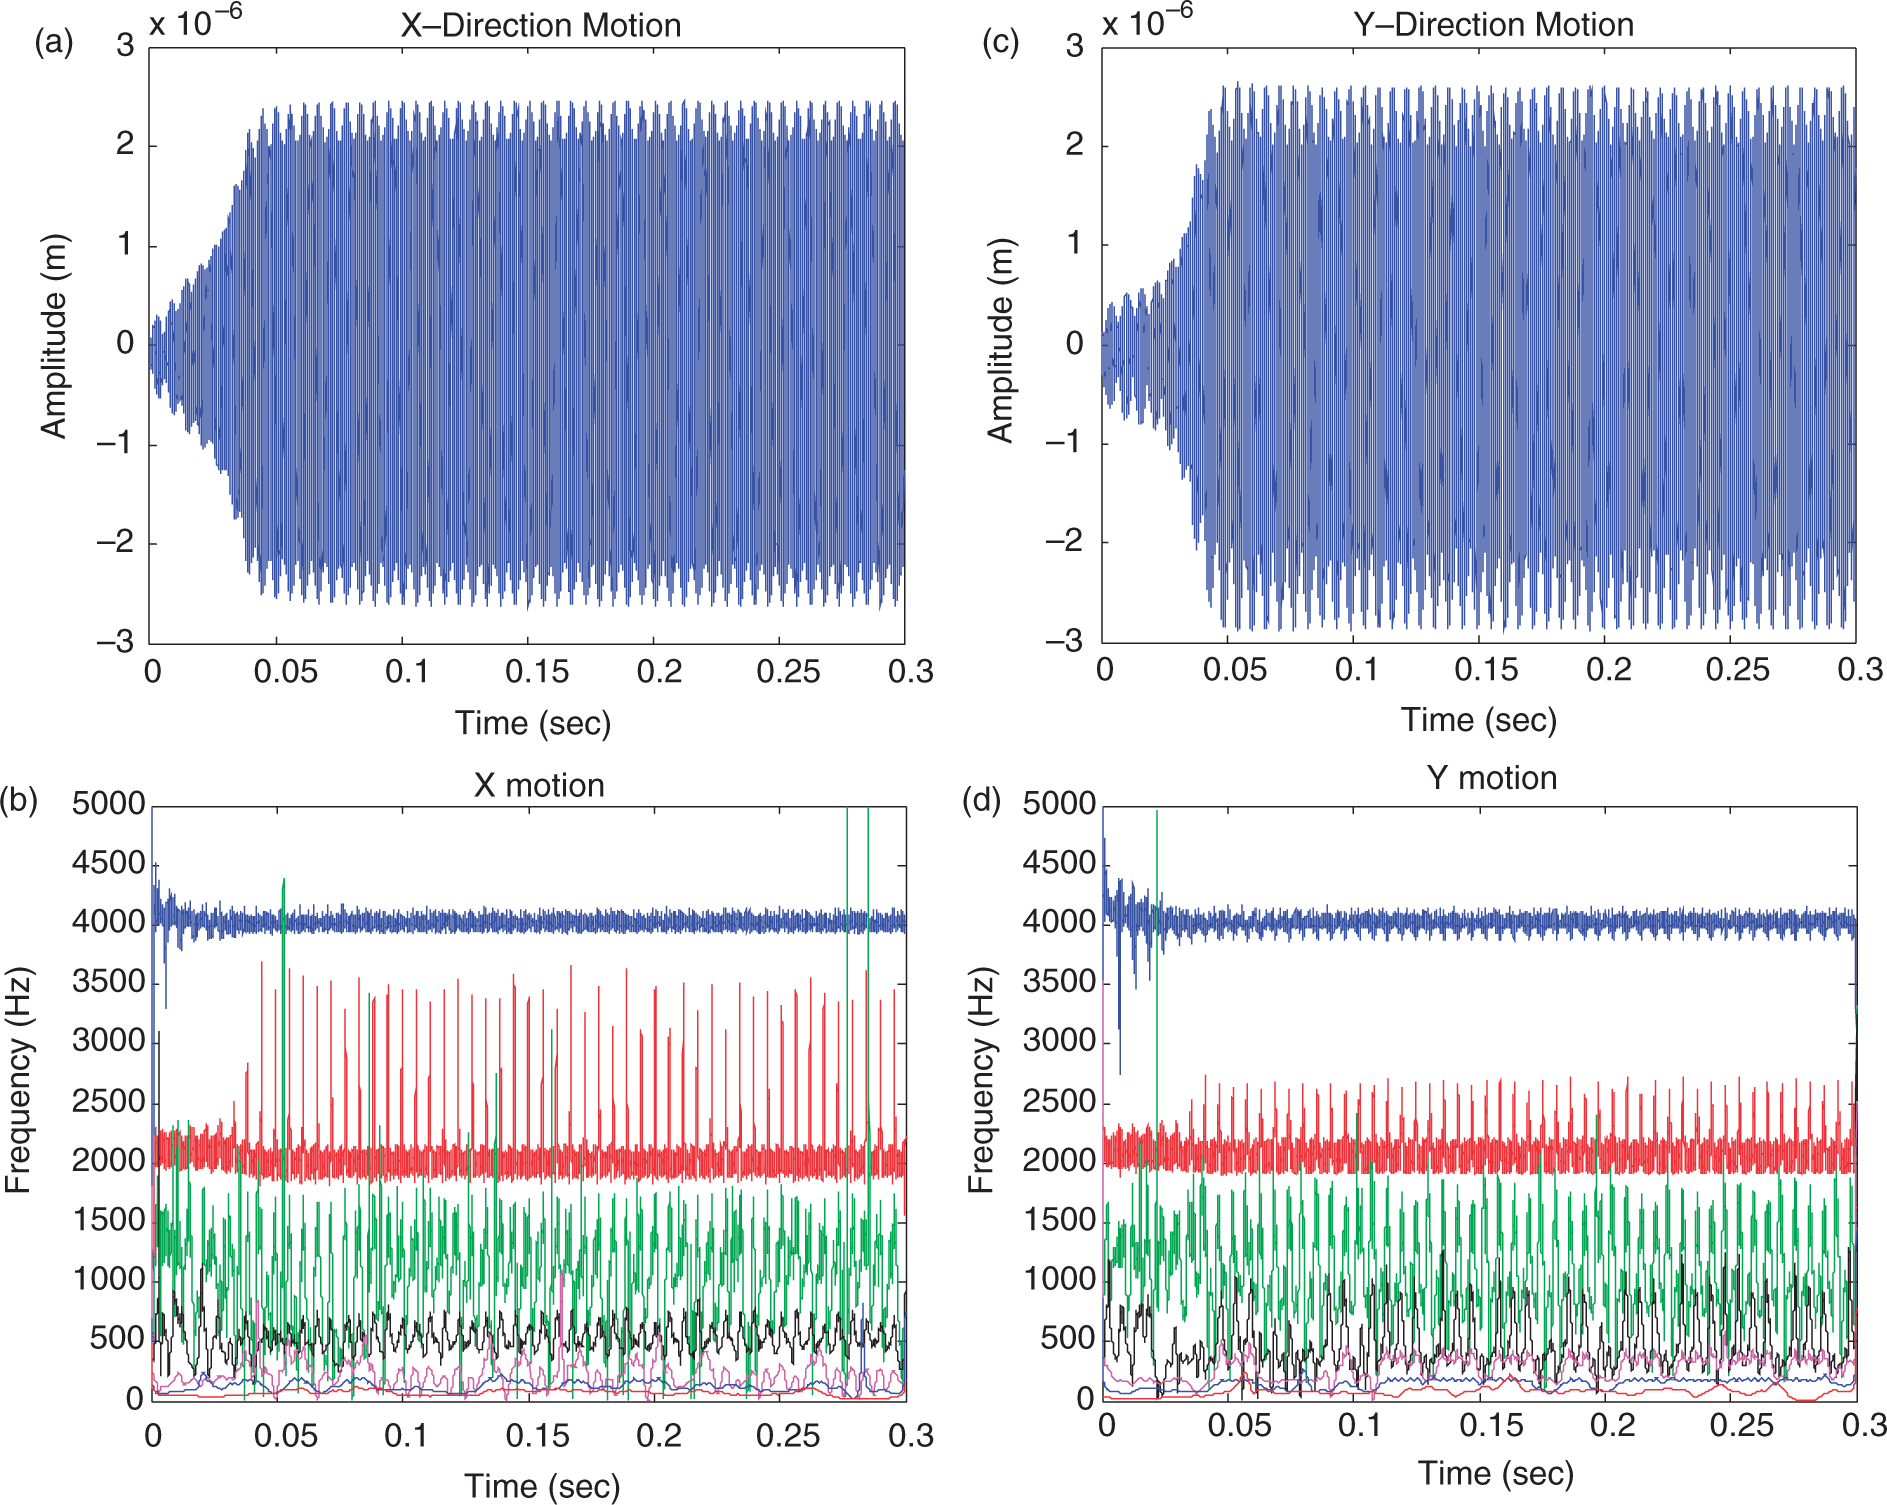

5. Numerical results
Control of the micro-milling model for different spindle speed and ADOC are investigated with the assistance of phase portrait, Poincaré section, time response, IF, and cutting forces. Figure 8 shows the phase diagram and Poincaré section when the spindle speed is at 75,000 rpm with an ADOC of 40 µm. Before the controller is activated, scattering on the Poincaré section in Figure 8(b) suggests that it is a broadband, chaotic response even though the time response is bounded. After being controlled, the phase plot in Figure 8(c) becomes a limited cycle with an amplitude that is four times smaller and the Poincaré section in Figure 8(d) shows a periodic motion of a finite number of commensurate frequencies. Figure 9 shows the time response and IF for controlling the milling process. The controller is turned on at 0.1 second and the target signal is designed using the response under the same spindle speed but a smaller ADOC of 30 µm. Before 0.1 seconds, the uncontrolled response has an irregular time response amplitude and broadband unstable frequency in both the x- and y-direction. After the controller is on line at 0.1 seconds, the time response amplitude is reduced and the IF is restrained to a narrowband spectrum with a finite number of spectral components. The amplitude of the cutting force in both directions is slightly reduced after being controlled as shown in Figure 10. The controller maintains the force amplitude around the stable cutting force limited for this particular chip load, effectively offsetting the negative impact of the increased cutting forces due to dynamic instability.
(a) Phase plot of x-y and (b) Poincaré section of x-y before controlled, and (c) phase plot of x-y and (b) Poincaré section of x-y after controlled when spindle speed = 75,000 rpm and axial depth-of-cuts = 40 µm. (a) Time response and (b) IF of x motion, and (c) time response and (b) instantaneous frequency of y motion when spindle speed = 75,000 rpm and axial depth-of-cuts = 40 µm. The controller is turned on at 0.2 second. (a) Force in x-direction (b) force in y-direction when spindle speed = 75,000 rpm and axial depth-of-cuts = 40 µm. The controller is turned on at 0.1 second.


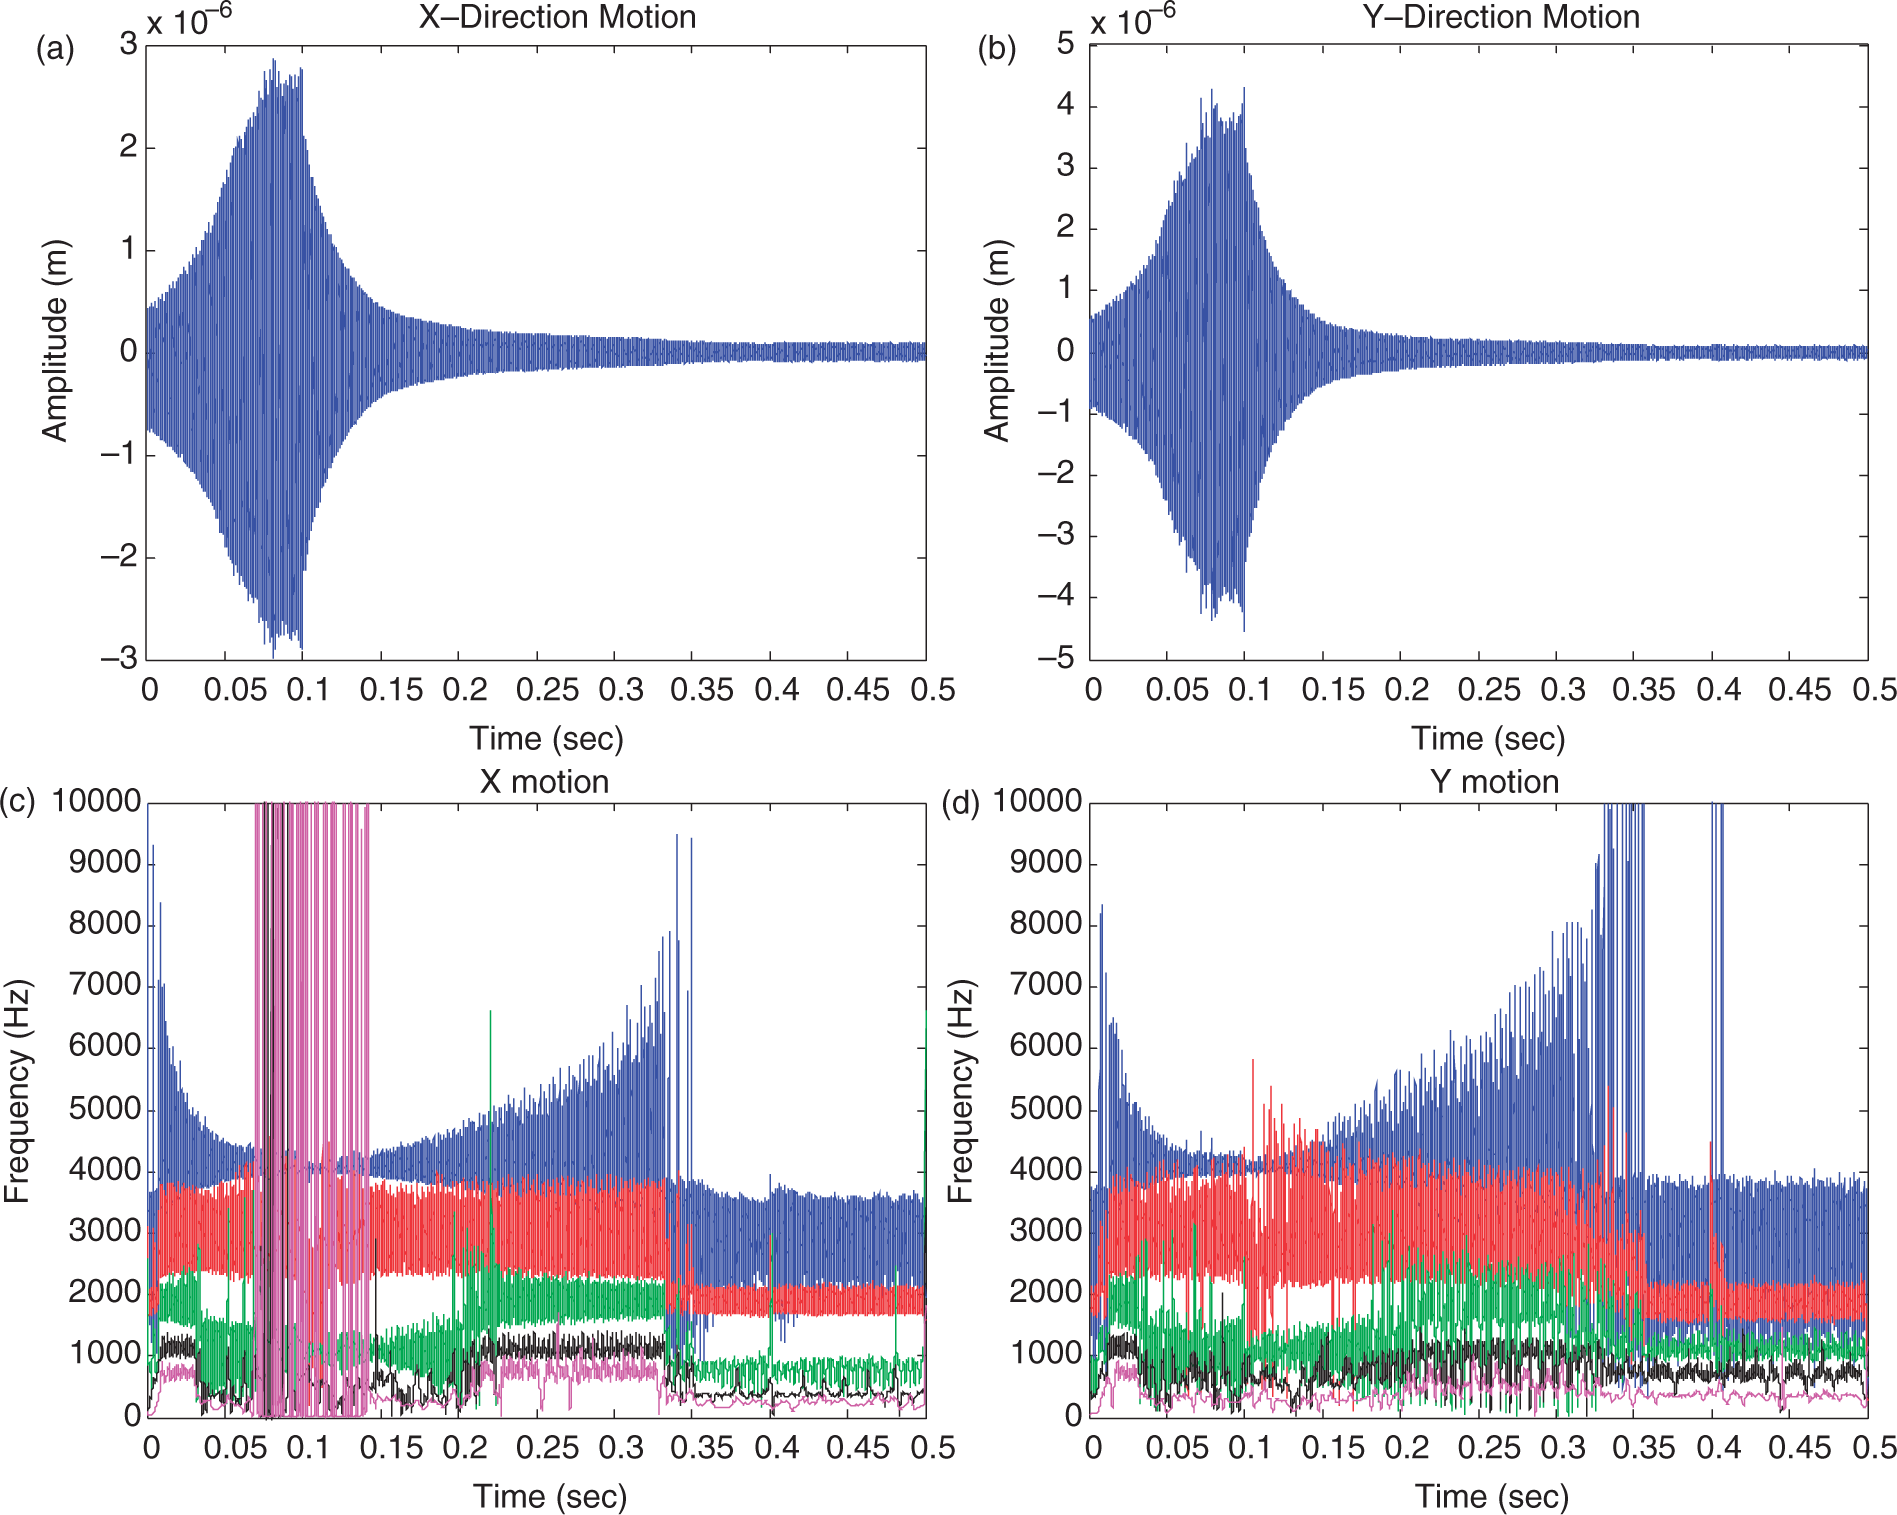
When the spindle speed is increased to 90,000 rpm with 85 µm ADOC, its phase plot represents an unstable limit cycle in Figure 11(a) and the corresponding Poincaré section in Figure 11(b) shows a fractal structure. While not chaotic, it is of a broadband, varying spectrum and thus difficult to control. The target signal is composed from the same spindle speed with a 50 µm ADOC. When the controller is on, the response on the phase plot becomes one order-of-magnitude smaller and the Poincaré section becomes localized as shown in Figures 11(c) and (d), which means that the motion is now an attracting manifold having a frequency response, the bandwidth of which is significantly reduced. The time response and IF for controlling the milling process are shown in Figure 12. After the controller is applied at 0.1 second, the time response amplitude in both the x- and y-direction is quickly decreased, thus helping to improve workpiece tolerance. The aberrational temporal oscillation of the IF is regularized and becomes a steady oscillation with a limited bandwidth, as shown in Figures 12(c) and (d). The cutting force on both directions is effectively mitigated and restrained after being controlled (Figure 13), thus improving the tool life of the process under these cutting conditions.
(a) Phase plot of x-y and (b) Poincaré section of x-y before controlled, and (c) phase plot of x-y and (b) Poincaré section of x-y after controlled when spindle speed = 90,000 rpm and axial depth-of-cuts = 85 µm. (a) Time response and (b) instantaneous frequency of x-motion, and (c) time response and (b) instantaneous frequency of y-motion when spindle speed = 90,000 rpm and axial depth-of-cuts = 85 µm. The controller is turned on at 0.1 second. (a) Force in x-direction (b) force in y-direction when spindle speed = 90,000 rpm and axial depth-of-cuts = 85 µm. The controller is turned on at 0.1 second.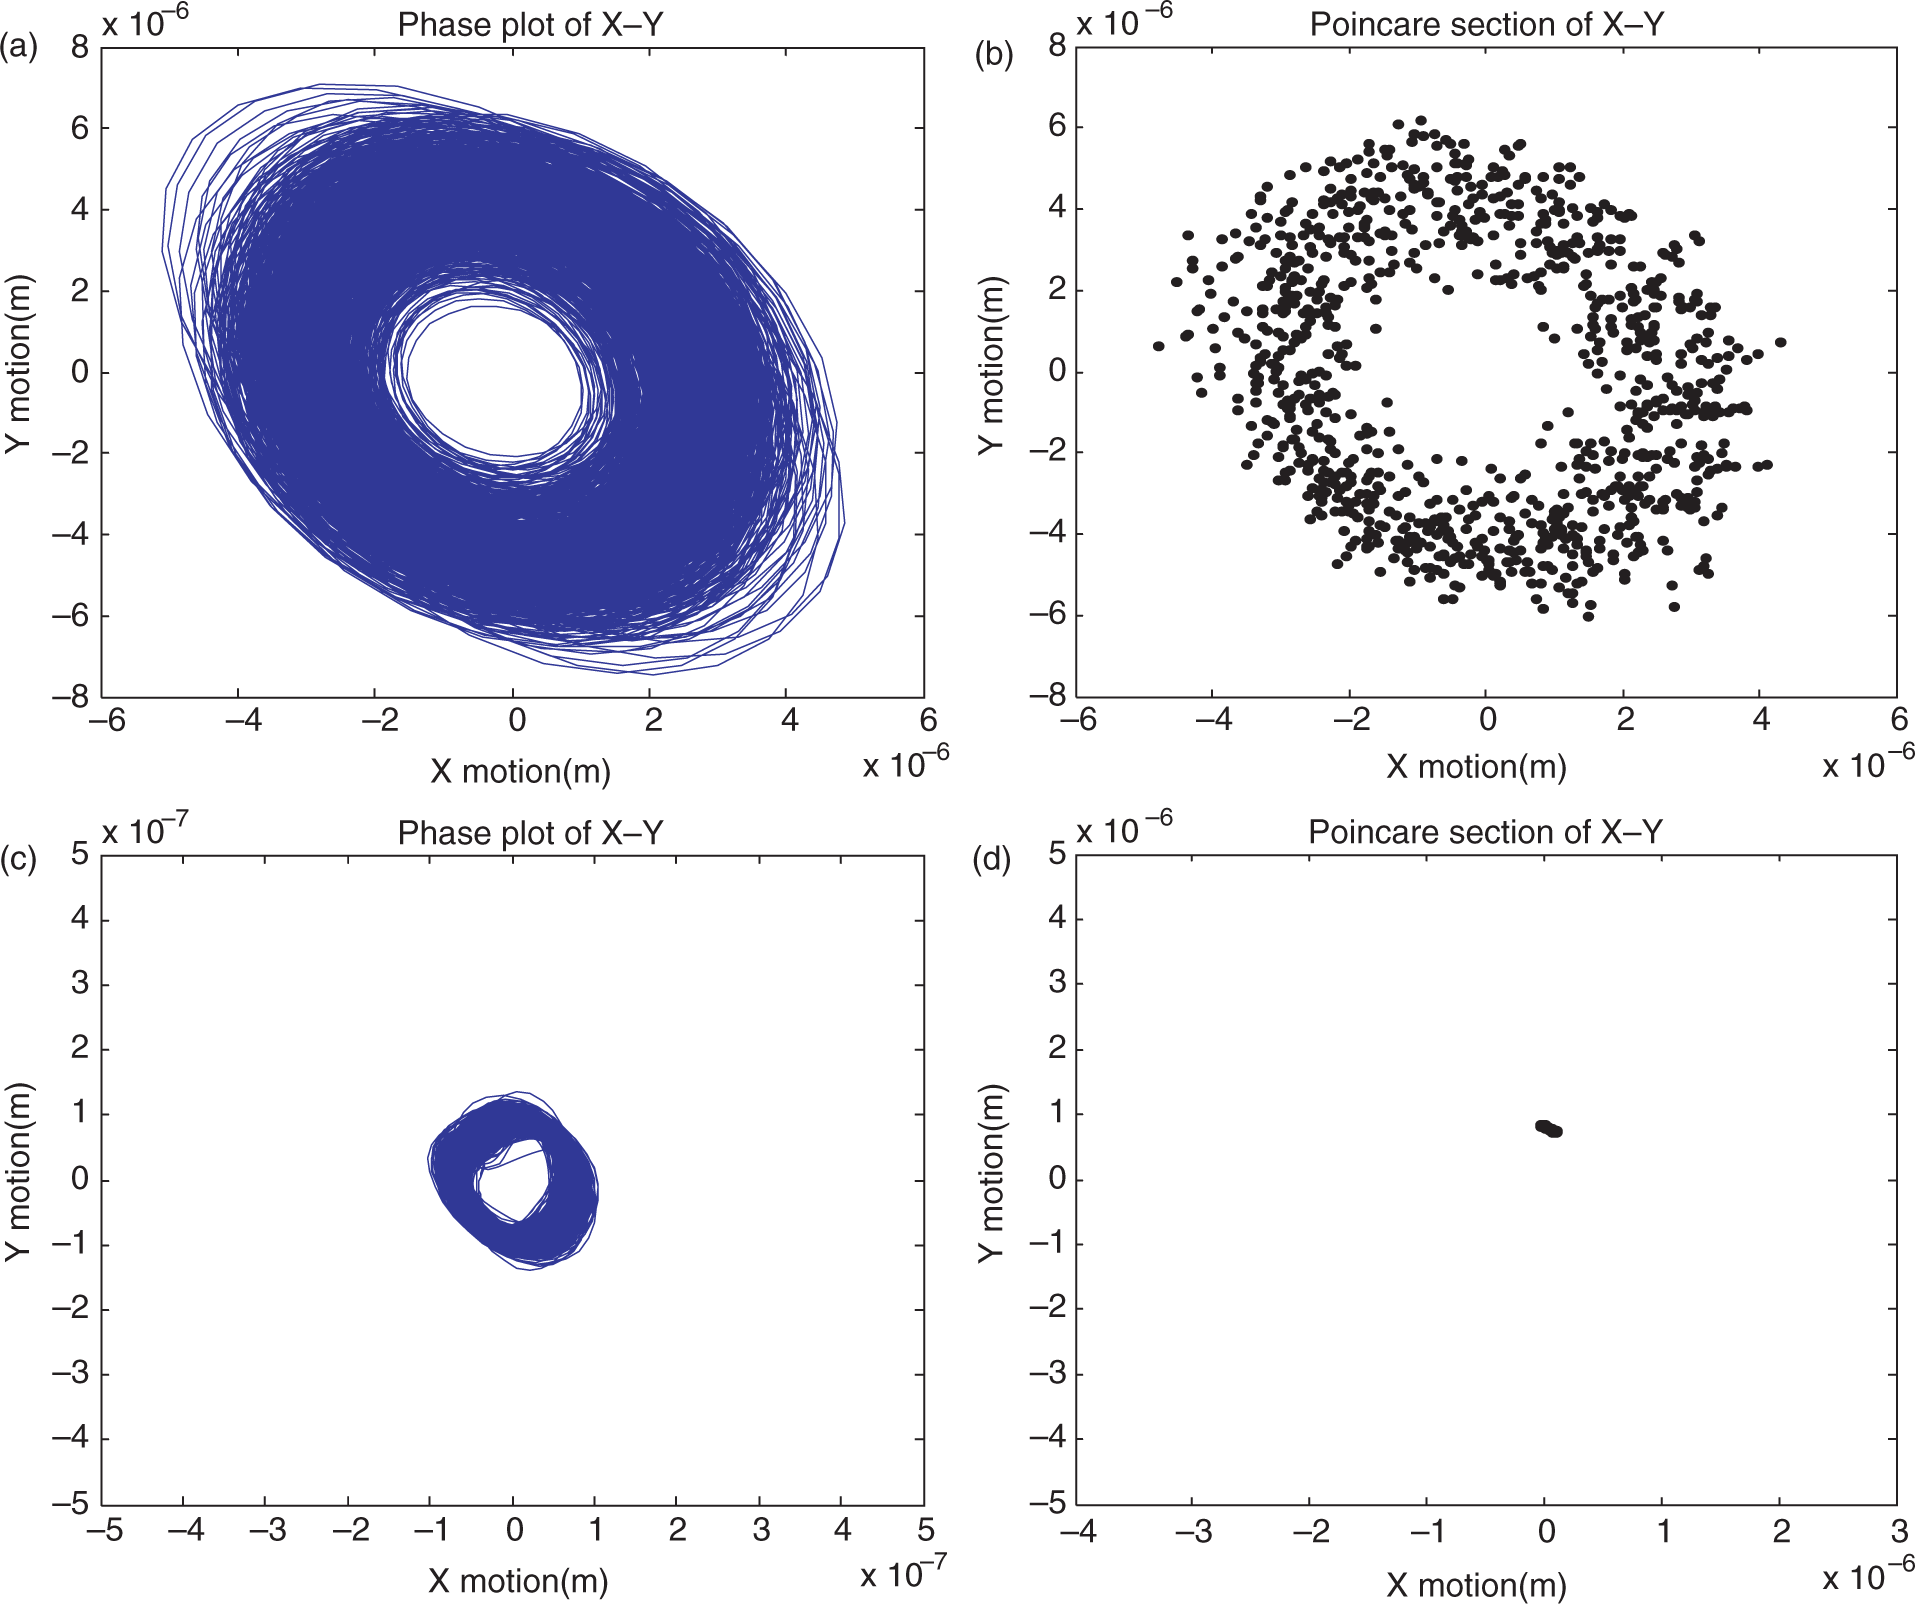

At a spindle speed of 180,000 rpm with ADOC of 50 µm, the time response amplitude is increased and becomes extremely irregular. For this case, the target signal is designed from the same spindle speed with a 30 µm ADOC. As all trajectories are seen being repelled from the manifold, the phase diagram and Poincaré section in Figure 14 show an unstable limit cycle with multiple frequencies before controlled. After controlled, the response is reduced to a (quasi) periodic motion with incommensurate frequencies demonstrating an improved dynamic state of motion. Both time response and IF are stabilized in Figure 15 after 0.1 seconds when the controller is brought online. Time response amplitude is reduced and aberrational oscillations in IF are erased when the controller is applied resulting in narrowband frequency components. The cutting force is also reduced as shown in Figure 16 and maintains the stable cutting force limit.
(a) Phase plot of x-y and (b) Poincaré section of x-y before controlled, and (c) phase plot of x-y and (b) Poincaré section of x-y after controlled when spindle speed = 180,000 rpm and axial depth-of-cuts = 50 µm. (a) Time response and (b) instantaneous frequency of x motion, and (c) time response and (b) instantaneous frequency of y motion when spindle speed = 180,000 rpm and axial depth-of-cuts = 50 µm. The controller is turned on at 0.1 second. (a) Force in x direction (b) force in y direction when spindle speed = 180,000 rpm and axial depth-of-cuts = 50 µm. The controller is turned on at 0.1 second.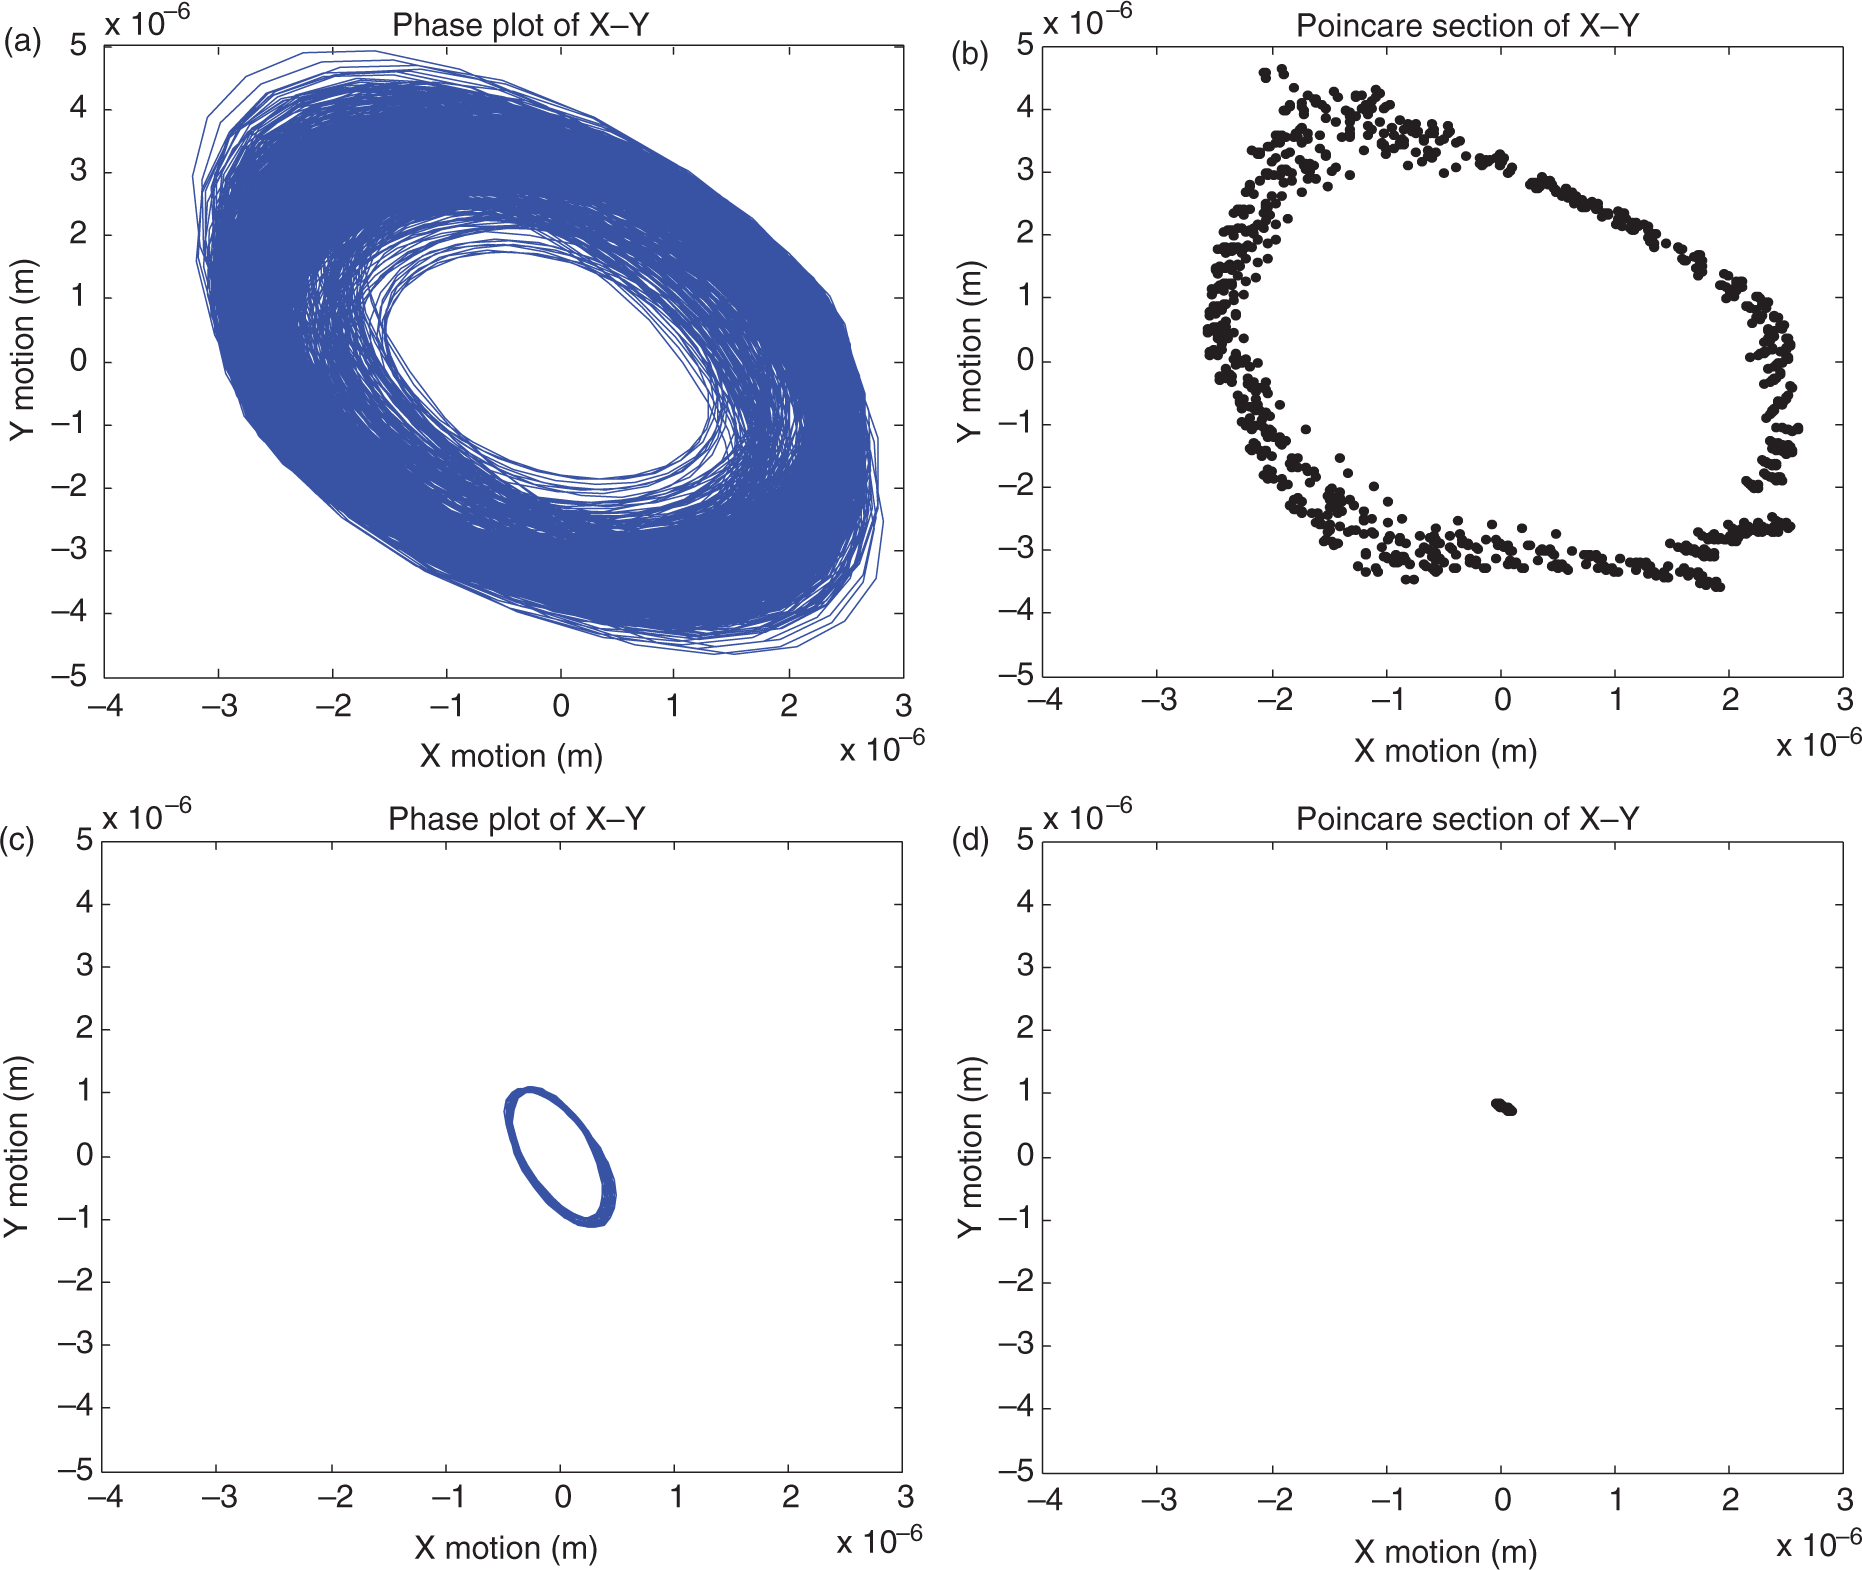
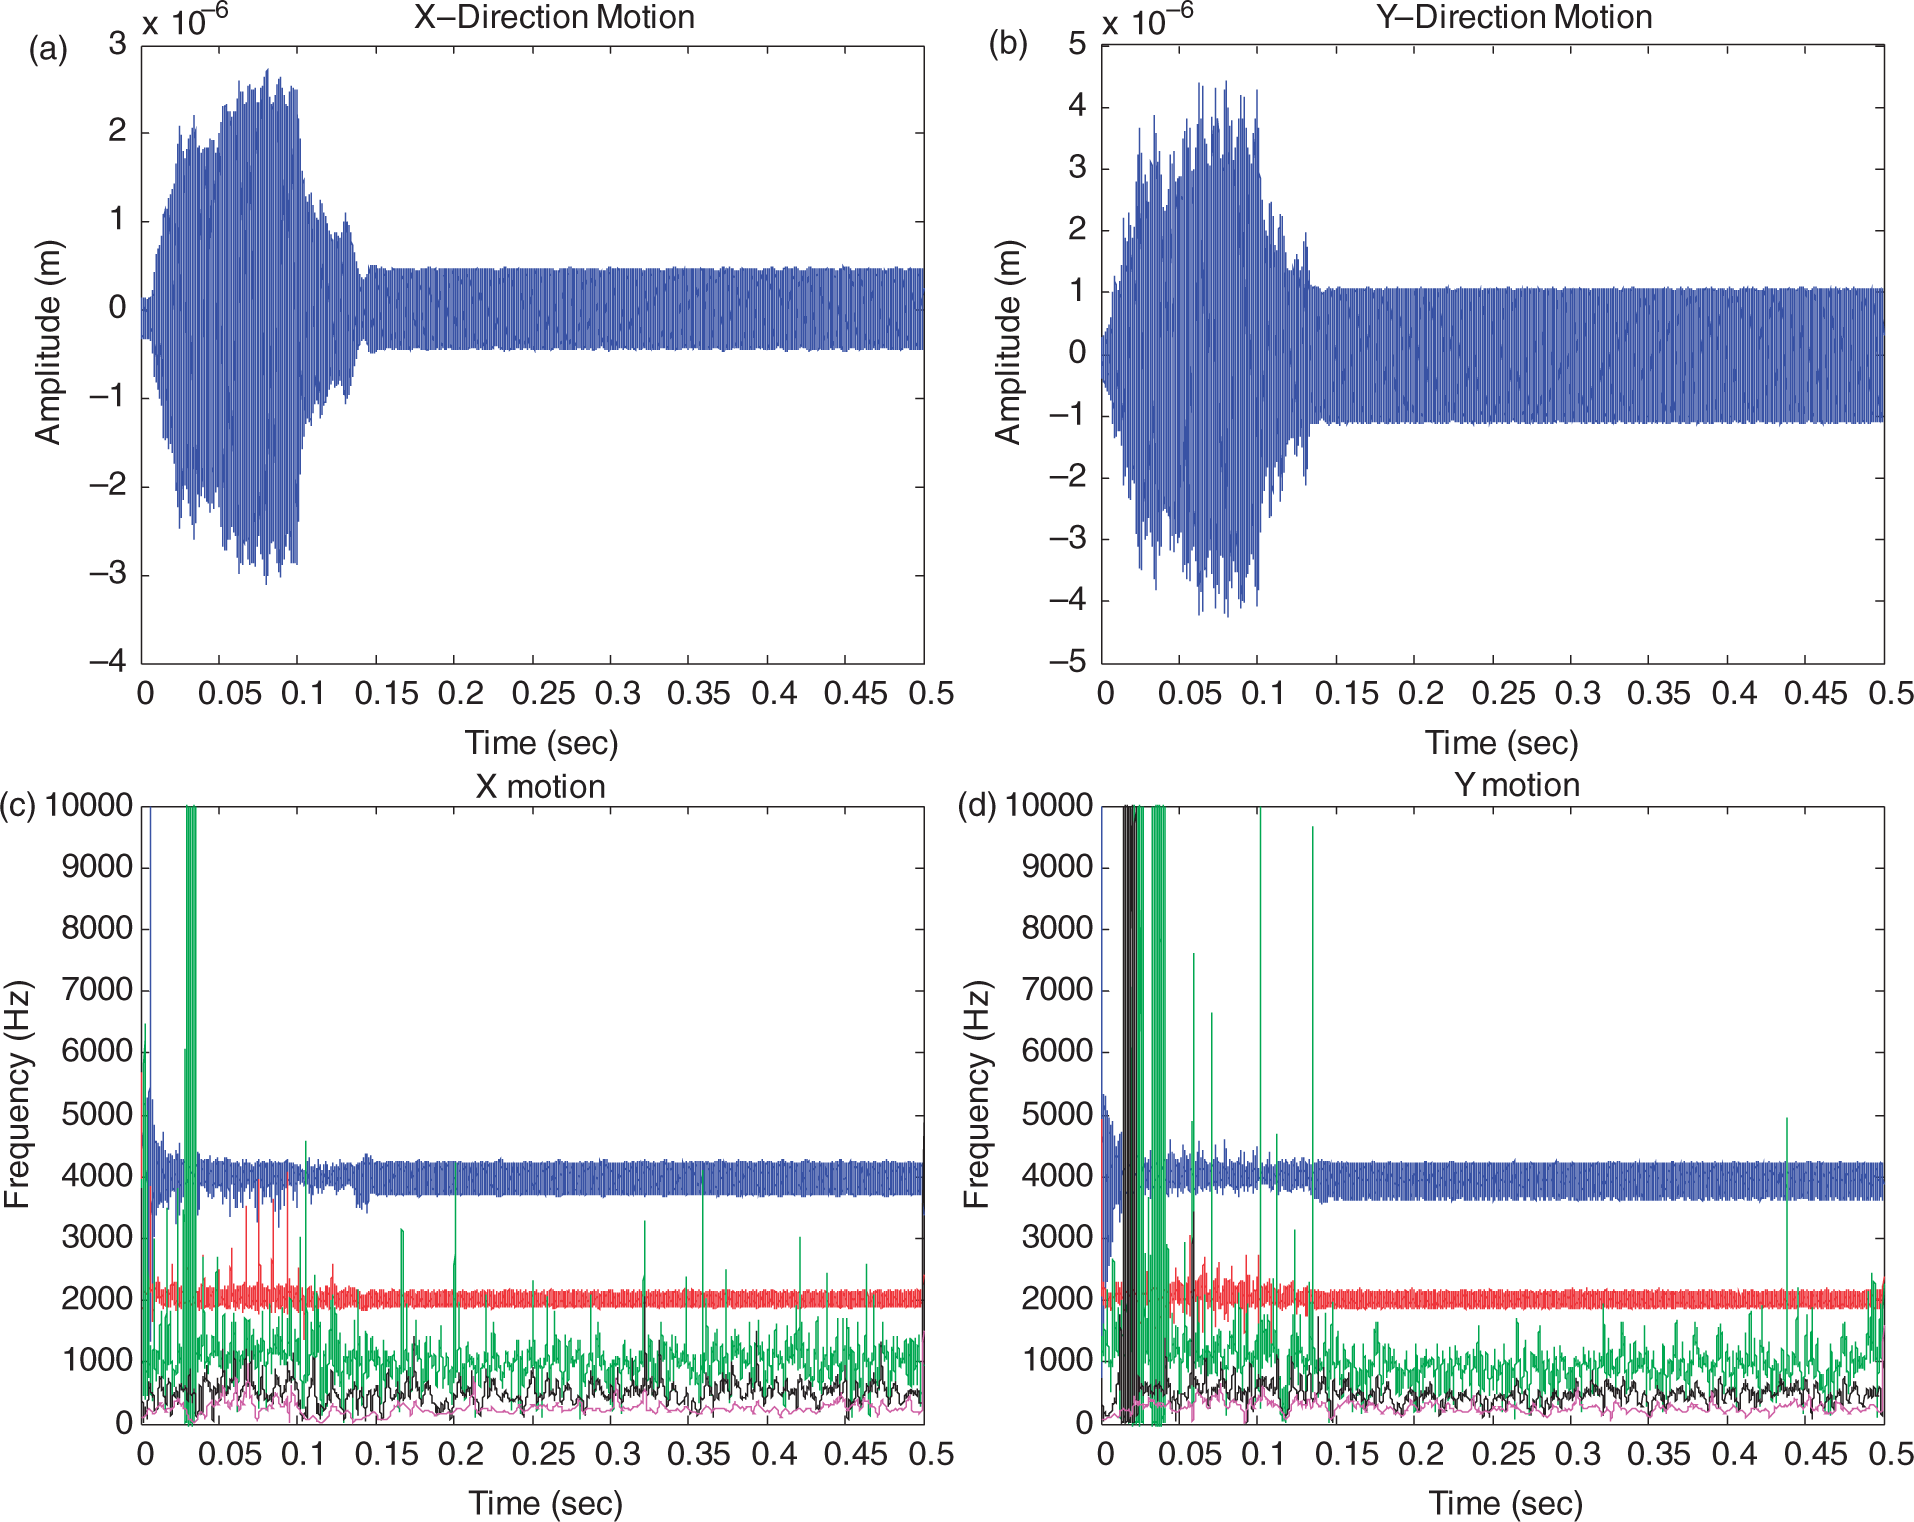

When the spindle speed is 120,000 rpm with a 50 µm ADOC, resonance response is generated at the tooth passing frequency which is now coincident with the tool natural frequency. The phase plot and Poincaré section in Figures 17(a) and (b) show a periodic motion with a single frequency. After the controller is turned on, it indicates a reduction of amplitude in Figure 17(c). The time response and IF in Figure 18 show resonance amplitude and a signal frequency at 4,000 Hz. The target signal is designed from the same spindle speed with 30 µm ADOC. The time response amplitude is reduced and its frequency response remains the same after the controller is applied. The amplitude of the cutting force on both directions remains the same after being controlled (Figure 19). The reduction of the vibration amplitude is significant for improving product quality for high speed cutting.
(a) Phase plot of x-y and (b) Poincaré section of x-y before controlled, and (c) phase plot of x-y and (b) Poincaré section of x-y after controlled when spindle speed = 120,000 rpm and axial depth-of-cuts = 50 µm. (a) Time response and (b) instantaneous frequency of x motion, and (c) time response and (b) instantaneous frequency of y motion when spindle speed = 120,000 rpm and axial depth-of-cuts = 50 µm. The controller is turned on at 0.1 second. (a) Force in x direction (b) force in y direction when spindle speed = 120,000 rpm and axial depth-of-cuts = 50 µm. The controller is turned on at 0.1 second.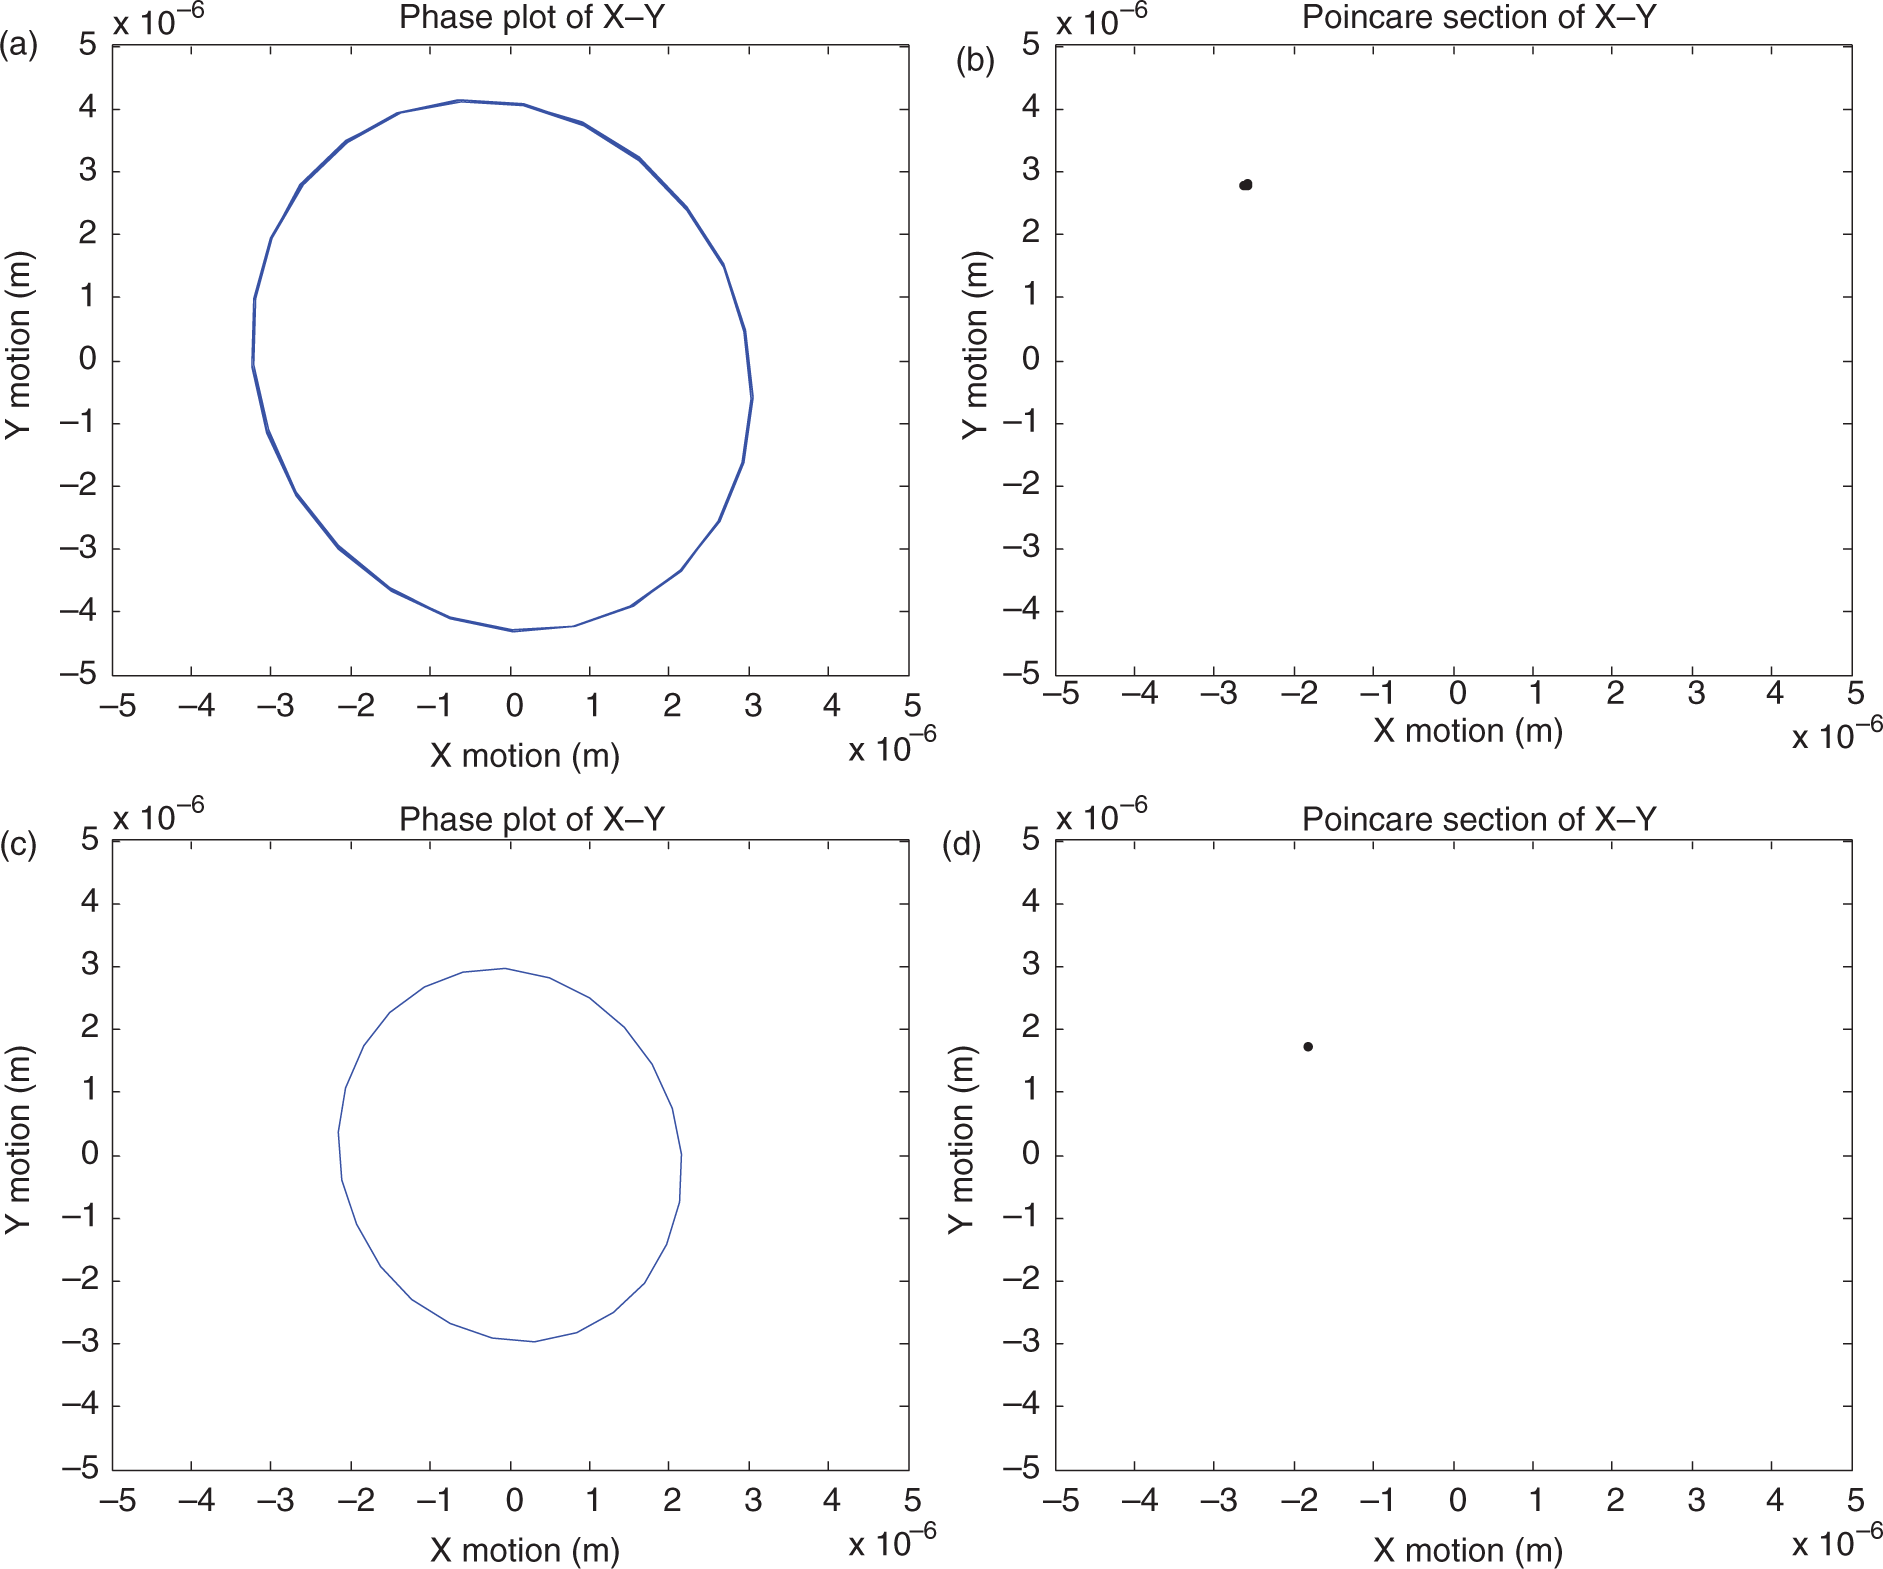


6. Summary
The micro-milling process is highly sensitive to dynamic instability which can result in premature tool breakage, increased wear rates, and poor workpiece quality. To achieve reasonable material removal rates while keeping the chip load at a minimum, high spindle speeds are desired in micro-milling. This high frequency excitation of the system increases the effect of nonlinearity on the dynamic response, negatively impacting cutting performance by introducing increasingly broad frequency spectra as instability develops. This suggests that both the time and frequency domains should be considered to effectively control micro-milling, and a micro-milling model capable of capturing the high frequency signature of the process is required for testing a control algorithm. A simultaneous time-frequency controller was applied to a nonlinear multi-dimensional micro-milling model in order to control and improve the dynamic response under various spindle speeds and ADOC conditions which resulted in an unstable dynamic state of motion. To control the process, two independent nonlinear controllers were placed in front of the model to regulate the cutting force excitation, and a target signal having all the physically meaningful frequency modes and acceptable amplitudes was utilized. The controller was applied to unstable cutting for spindle speed excitations ranging from 63,000 rpm to 180,000 rpm. For each case, the controller demonstrated the ability to reduce the vibration amplitude of the system, which is important for improving process efficiency and achieving and maintaining high precision cutting at a wide range of spindle speeds. The cutting forces were also observed to be properly mitigated and controlled to the stable cutting force values for that particular feed rate and ADOC. The controller prevented the negative effect of increasing cutting forces due to dynamic instability, thus simultaneously improving the life of the tool and negating immediate tool failure for unstable high speed excitation. The IF plots, phase portraits, and Poincaré plots illustrated the improved dynamic state of motion in the time-frequency domain after the controller was applied. This was observed by a reduction in the bandwidth of the frequency response, ultimately improving tool life and the wear rate. The application of the simultaneous time-frequency controller to the highly nonlinear micro-milling process at high speed excitation demonstrated the capability of mitigating the process in both the time and frequency domains with significantly improved tool performance and workpiece quality.
Footnotes
Funding
This research received no specific grant from any funding agency in the public, commercial, or not-for-profit sectors.