






Abstract
In general, the tensile forces on hanger cables of a suspension bridge play an important role in evaluating the bridge condition. Two tensile force estimation methods, which are based on a string or cable equation, have been widely applied to estimate the tensile forces by using the measured frequencies on hanger cables. However, both methods are not applicable to short hanger cables because the frequencies of short cables are severely sensitive to flexural rigidity. Thus, in this study the tensile forces of hanger cables, shorter than 10 meters, were estimated by back analysis of the cable frequencies measured from the Gwangan suspension bridge in Korea. To verify the feasibility of back analysis, the results from back analysis and existing methods are compared with the average measured tensile forces after completion. From the comparison, it can be inferred that back analysis results reasonably agree with the average measured tension of the short hanger cable after completion. Therefore, it is concluded that back analysis applied in this study can be an appropriate tool for estimating tensile forces of short hanger cables.
Keywords
1. Introduction
Recently, long span bridges have been commonly designed and constructed as a result of the development of cable materials that can endure high tensile force, advanced design, construction techniques, and maintenance based on sensing techniques. A critical member of long span suspension bridges is the suspended and hung cable which can resist dead and live loads. Thus, it is very important to verify the safety and stability of bridges not only for introducing tensile forces on the cables during construction, but also for estimating tensile forces after completion.
As a non-destructive method, tensile forces on hanger cables would be estimated based on theoretical equations. In a few cases, the static method (Ahn et al., 2003) using the relationship between statically measured loads and displacements, has been used for estimating tensile force. The tensile force estimation methods based on string or cable equation have been widely applied to estimate the tensile forces by using the measured frequencies on hanger cables. The tensile force estimation methods based on a string or cable equation can normally be classified as the method based on a single mode (Zui et al., 1996) or the method based on multi modes (Shimada, 1995). While both methods were established based on the cable equation of motion (Irvine, 1981) considering the flexural rigidity of cable, they could not accurately estimate tensile forces on cables with large flexural rigidity (Ni et al., 2002). Therefore, the methods are not applicable to estimate tensile forces on short hanger cables. Recently, many methods based on the system identification technique (Park and Kim, 2005; Amabili et al., 2009) have been used for estimating tensile forces on hanger cables.
However, in a process of system identification, if there were many parameters to consider, it could take a long time to estimate tensile force.
In this study, the hanger cables of the Gwangan suspension bridge located in South Korea were used as a field example of estimating tensile forces. Shimada’s method has been frequently applied to comparatively long hanger cables (Shimada, 1995). However, the back analysis technique proposed in this study can be applied to hanger cables shorter than 10 meters which are dominantly affected by flexural stiffness.
In the back analysis technique (Jeon and Yang, 2004; Kim and Jeong, 2005), forward analysis can be performed by using Midas Civil as a commercial structural analysis program with the function of a common mathematical algorithm through simple modeling and modification. A difference between the calculated frequency from the numerical model and the measured frequency from the existing hanger cable is defined as an error function, and the error function is minimized by using an optimization algorithm and a compensation factor. For unconstrained optimization, the univariate search method (Rao, 1996) employed in this study is one of the one-dimensional search methods in which one variable is varied at one time and the other variables are fixed for improvement of approximate value (Gioda and Maier, 1980).
From the measured frequencies on the hanger cables, the flexural stiffness effect was discussed with the comparison between the results of the back analysis and existing methods.
As a result, it can be confirmed that the back analysis technique is more reliable than vibration methods for estimating tensile force on relatively short hanger cables.
2. Existing methods
2.1. Tensile force estimation method using single mode
The flexural stiffness effect on cables can be decreased according to the increase of ξ, which is a dimensionless parameter presenting the flexural stiffness effect of cables. The vibration motion of cables with a large value of ξ is nearly similar to one of the strings. In the case of

2.2. Tensile force estimation method using multi modes
In general, an equation of motion for cable structures considers the flexural rigidity, tensile force and mass distribution of cables. Thus, the tensile force of existing cables could be estimated by the measured natural frequencies corresponding to cable vibration modes. In a cable model, as shown in Figure 1, the equation of motion could be constituted similarly to equation (2) by dynamic displacement of gravity direction Simply supported cable model.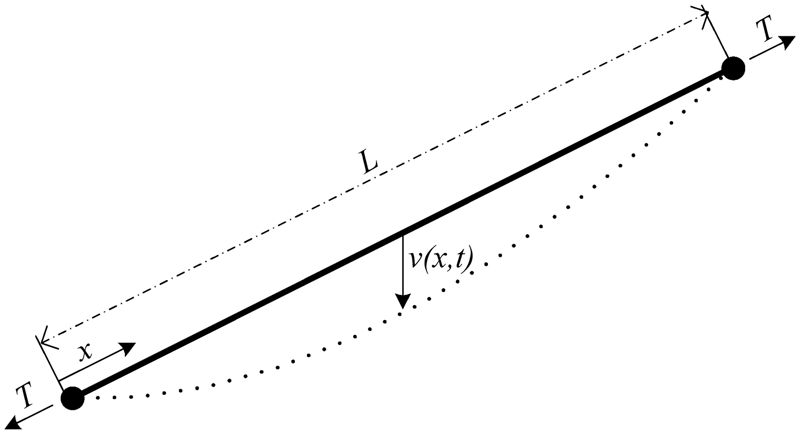


If constant b in equation (3) can be obtained from linear regression using the measured natural frequencies and the corresponding orders of vibration mode, the tensile force of cable could be estimated by using equation (4).

3. Back analysis technique
As one of the unconstrained optimization techniques, the univariate search method employed in this study is one-dimensional, in which one variable is varied at one time and the other variables are fixed for improvement of the approximate value (Rao, 1996). This method is an ordinal application of a one-dimensional search, as shown in Figure 2. The unknown variable X could be estimated by optimizing the error function
The optimizing error function can be presented as follows:

For minimizing the error function, the parameters can be used in equation (6):
Optimal point searching process of one-dimensional search.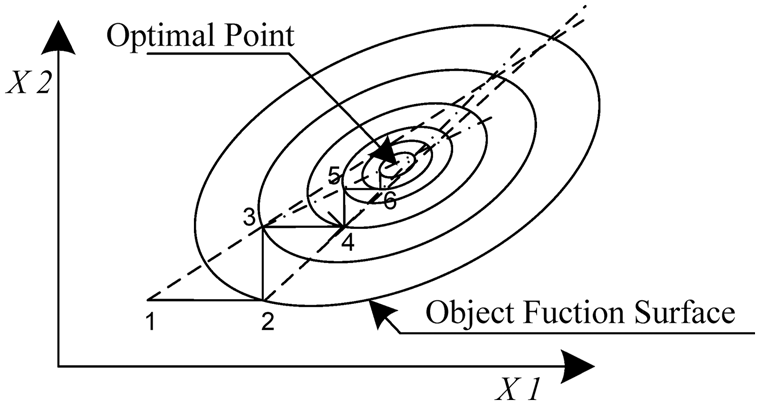

Figure 3 shows a flow chart of the back analysis algorithm employed in this study.
Step length Optimization procedure of univariate search method.

As a compensation factor,
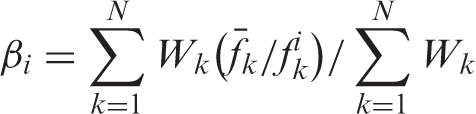
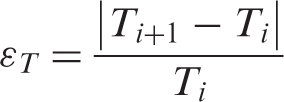
According to Figure 3, back analysis could be performed by comparing the predicted frequencies (
4. Estimation of cable tensile forces
4.1. Vibration measurement and analysis
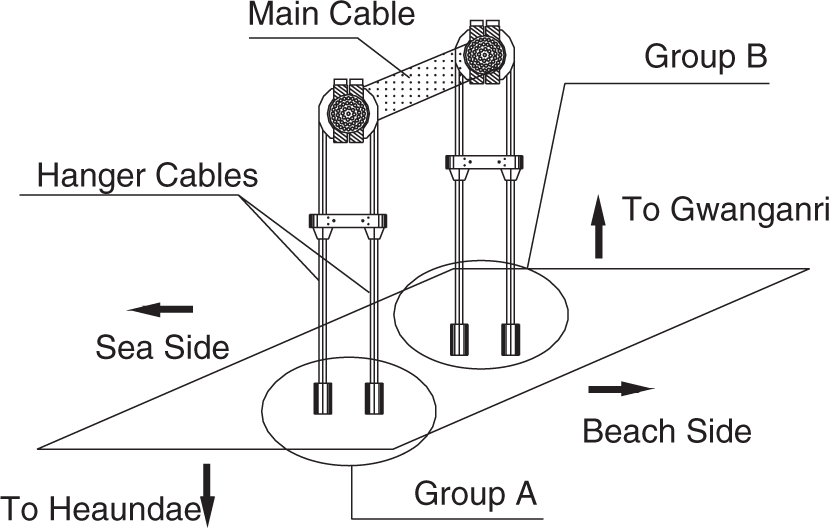
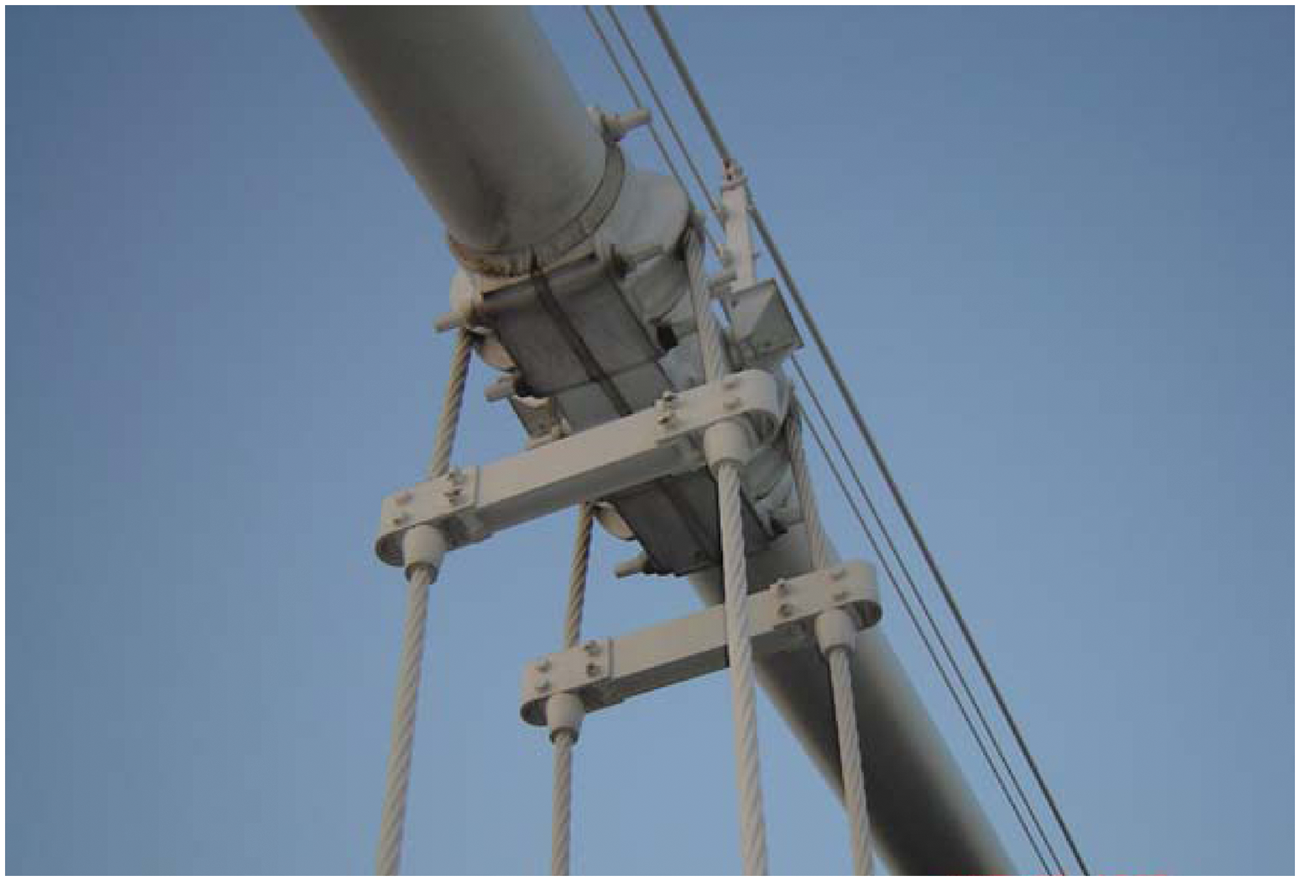
Gwangan Bridge, a suspension bridge located in Busan, Korea, was selected as an example in this study and its main properties are summarized in Table 1. Long hanger cables are located near the main tower and short hanger cables are located around the center of the main span. In this study, not only long cables but also medium and short cables are chosen, as shown in Figure 4. This is to verify the tensile force estimation method which can be applied to most hanger cables not depending on cable length. Nine cables (nos. 22, 29, 36–42) placed on the beach side were selected as a target for cable tensile force estimation. Each cable band is connected to two cable groups; one group consists of two hanger cables, as shown in Figures 5 and 6. One group of cables on each of the nine cables, designated as group A, was used for application of back analysis and the methods based on a string or cable equation. The properties of the selected hanger cables are shown in Table 2 (Gwangan Bridge Construction Authority, 2003).
Hanger cables selected for tensile force estimation. Hanger cables for measurement. Two groups of hanger cables. Properties of Gwangan Bridge Properties of selected hanger cables
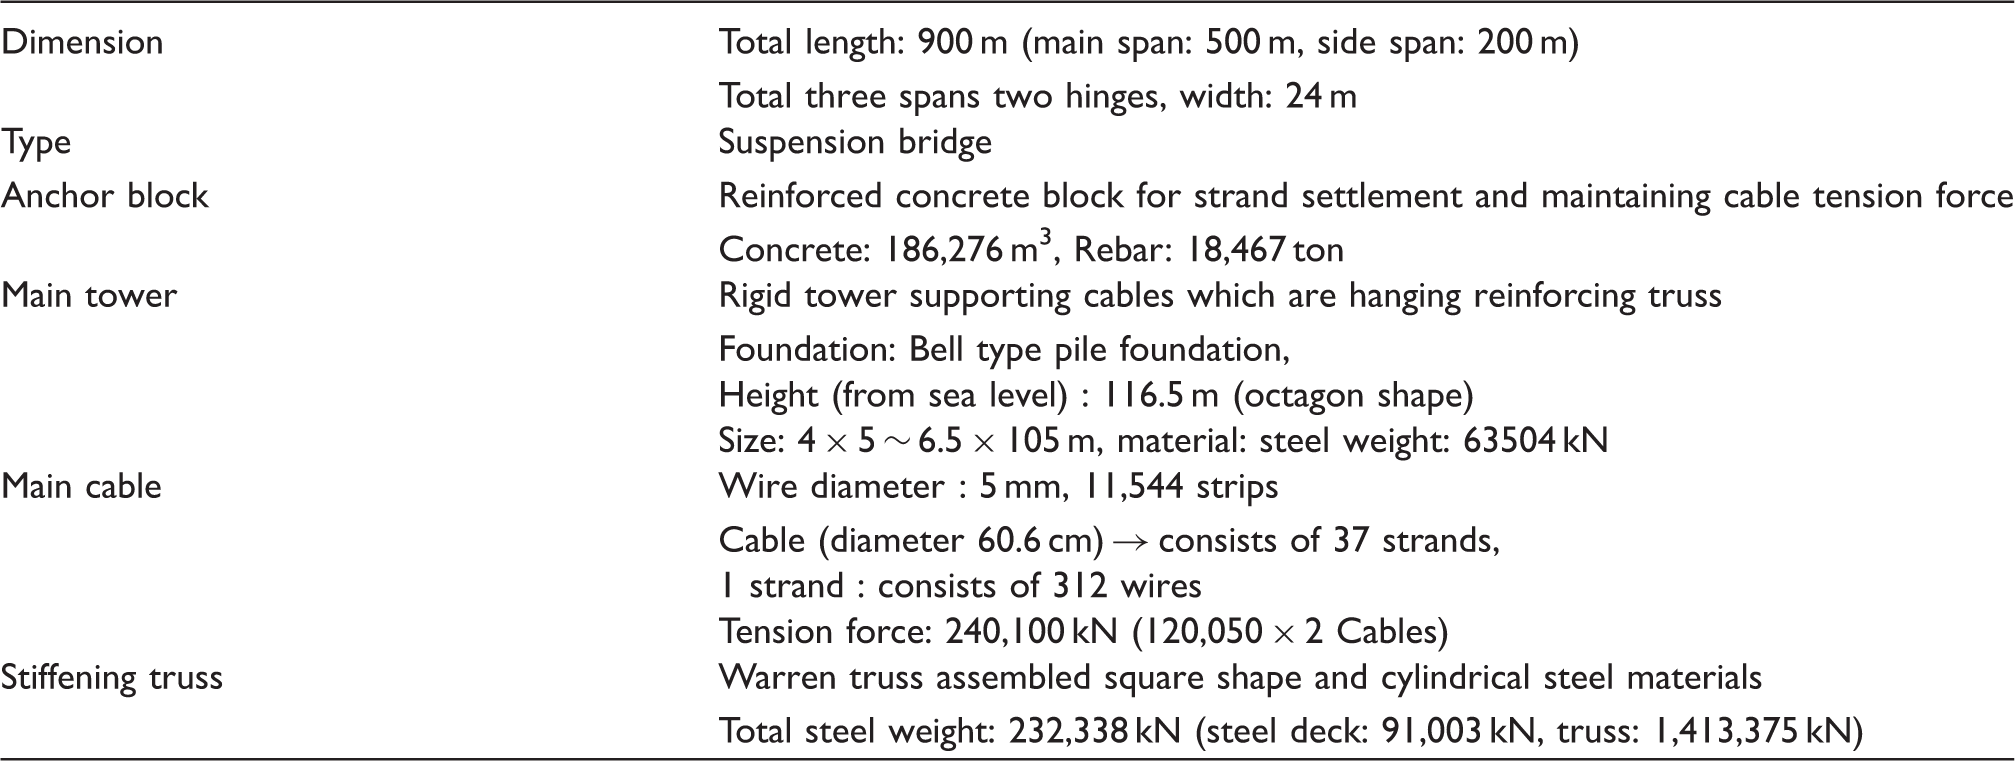

The length of each hanger cable is presented in Table 2 and the diameter of the hanger cables is a representative of the area of the hanger cable twisted by wires.
Under an ambient vibration condition, cable responses were measured by using acceleration sensors which were attached in the transverse direction on the hanger cable, as shown in Figure 7. The measuring conditions for short cables are as follows: sampling rate is 400 Hz, time interval is 0.0025 second, minimum measurement duration is 100 seconds, number of data per channel exceeds 40,000 and frequency resolution (Δf) is about 0.012 Hz.
The measuring conditions for long cables are as follows: sampling rate is 100 Hz, time interval is 0.01 second, minimum measurement duration is 200 seconds, number of data per channel exceeds 20,000 and frequency resolution (Δf) is about 0.003 Hz.
Accelerometers attached on hanger cables.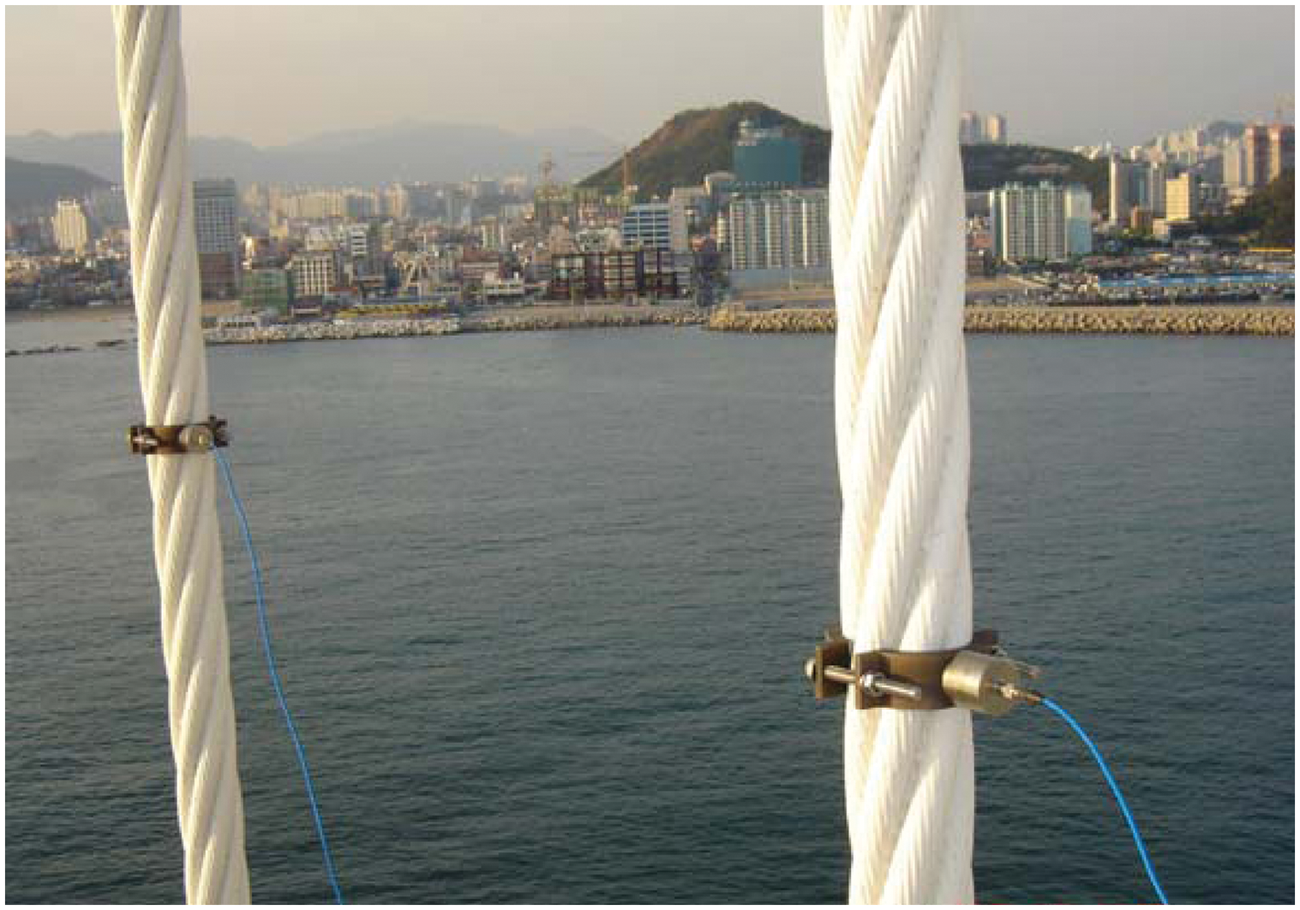
To obtain multi vibration modes of hanger cables easily, acceleration responses were acquired under an ambient vibration condition. However, in searching all of the signals measured under the ambient vibration condition, there were several cases that did not satisfy the vibration mode range. In some cases it was difficult to define the order of each vibration mode exactly. Moreover, because the acceleration sensors were attached near a cable support in the field condition, the higher modes mainly affected by flexural stiffness were very painstakingly measured. Therefore, in order to distinguish exactly the order of vibration modes, an eigenvalue analysis was carried out by using the transverse responses measured from two cables connected by a hanger band under ambient vibration and impulse loading conditions. As a result, estimation of tensile forces could be performed with only the transverse response of the two cables because the effect of the hanger clamp had to be considered.
It is well known that the measured first modal frequency from the field is usually higher than that calculated from the numerical model because of the difference between the effective and designed lengths. Therefore, in this study, the first modal frequencies of each cable are excluded while calculating tensile force in both the tensile force estimation method using multi mode and back analysis.
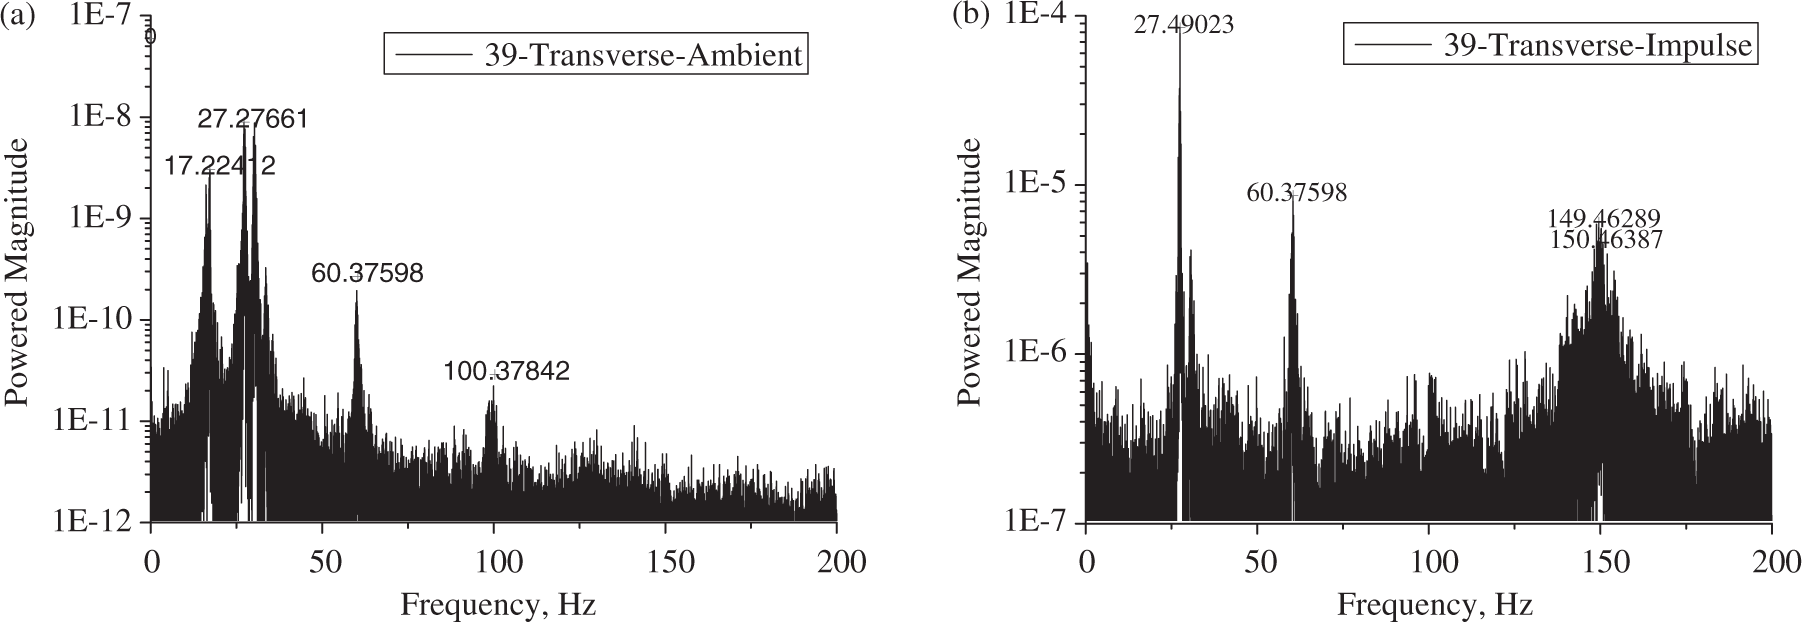
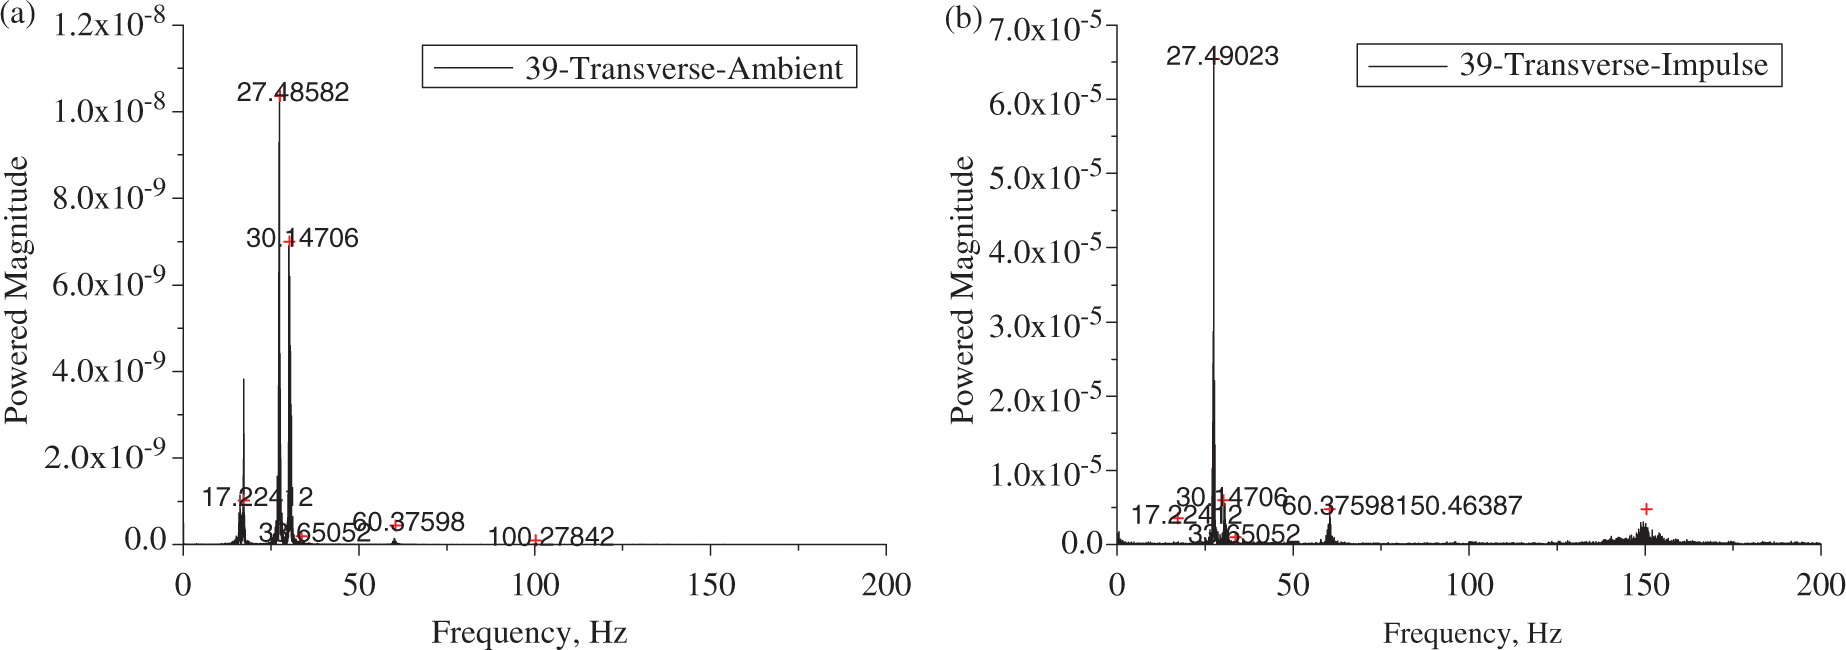
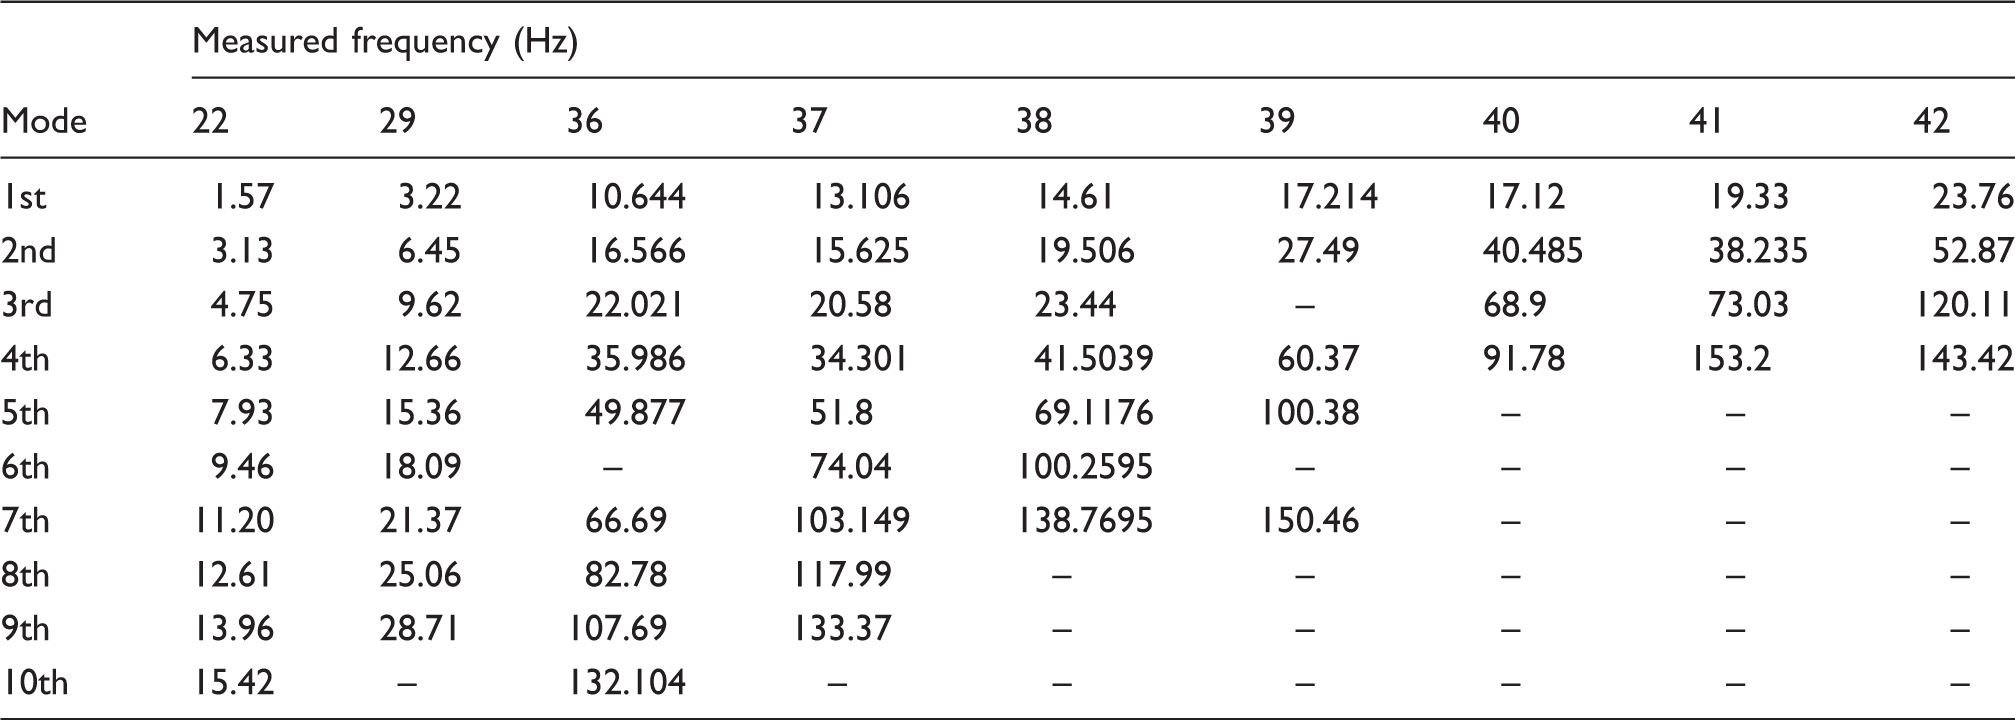
Figure 8 shows the transverse acceleration responses of cable no. 39 under ambient vibration and impulse loading conditions, while their power spectrums are presented in log scale in Figure 9. The ensemble average of power spectral density functions from acceleration responses measured on cable no. 39 are in Figure 10. The average of measured natural frequencies on hanger cables under ambient vibration and impulse loading condition are summarized in Table 3. The values in Table 3 are the average value of peaks from power spectral density functions of ambient vibration and impulse vibration respectively.
Acceleration response of cable no. 39; (a) Under ambient vibration condition, (b) Under impulse loading condition. Power spectrum of Figure 8; (a) Under ambient vibration condition, (b) Under impulse loading condition. Ensemble average of power spectrum measured on cable no. 39. Average of measured natural frequencies on hanger cables under ambient vibration condition and impulse loading test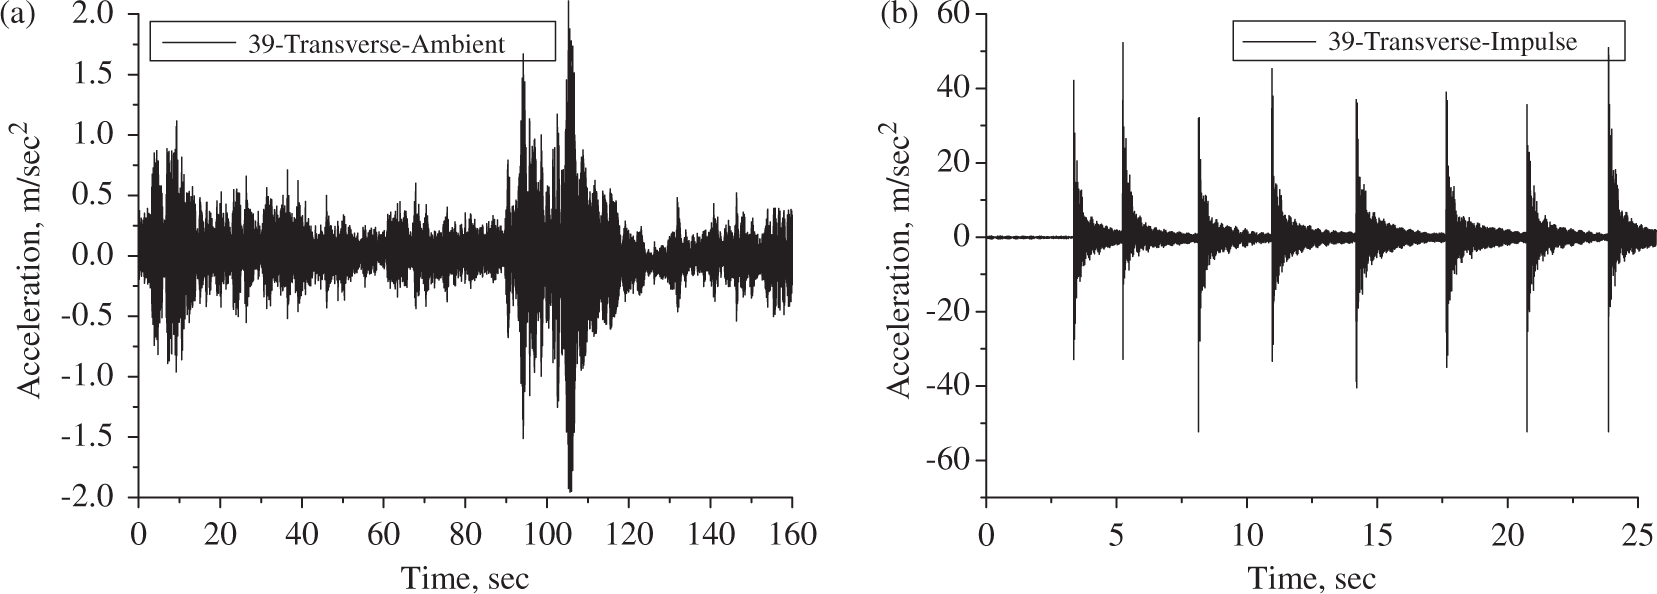
4.2. Numerical model and result of back analysis
In this study, the hanger cables are modeled in two different element types as beam and truss elements for comparing element types considering the flexural stiffness effect with cable lengths. The modeling was limited in the X-Z plane and both ends of the hanger cables were assumed to be hinge supported for idealization of back analysis modeling. The nodes of the hanger clamp are rigidly linked to the left top node of the hanger clamp. The upper part of the hanger cable has been modeled with a slope to reflect realness as shown in Figure 6. And the design tensile force is defined as an initial tensile force of hanger cables for back analysis. A typical sketch and a typical numerical model which was used in this study have been shown in Figure 11.
Numerical model for back analysis.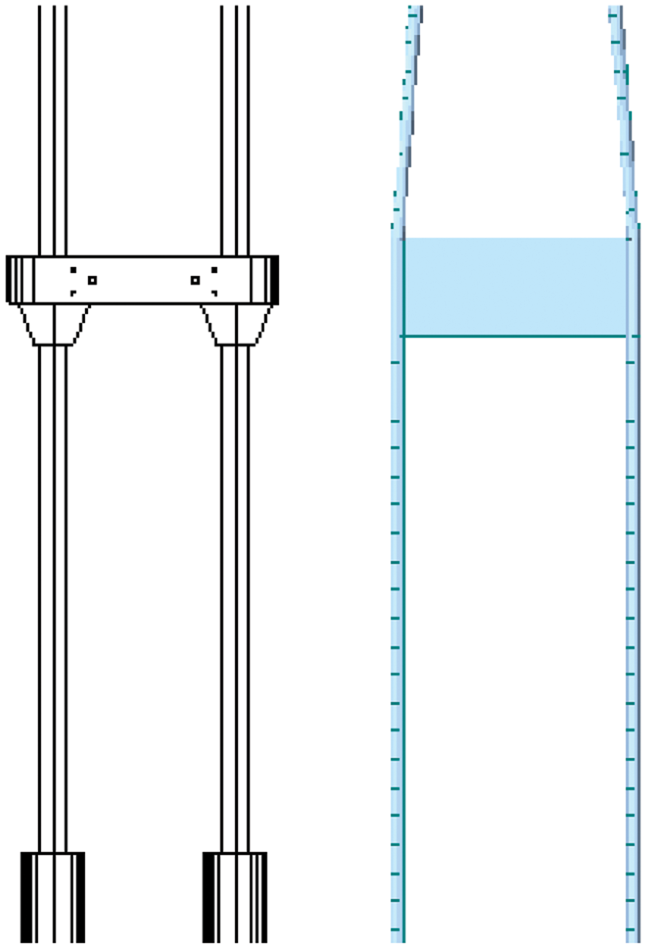
Figure 12 shows convergence processes of tensile force on hanger cables by repetitive execution of back analysis. A difference between the calculated frequency from the numerical model and the measured frequency from the existing hanger cable is defined as an error function, and the error function is minimized by using the optimization algorithm and compensation factor. Even if there is no numerical error of cable tensile force at the convergence of back analysis as shown in Figure 12, it is not clearly proved that the converged tensile values are feasible. Thus, in Figure 13, the calculated frequencies on the hanger cables are compared with the measured frequencies.
Convergence processes of tensile force on hanger cables; (a) Long cables modeled in truss Comparison of the calculated and measured frequencies; (a) Cable no. 22, (b) Cable no. 29, (c) Cable no. 36, (d) Cable no. 37, (e) Cable no. 38, (f) Cable no. 39, (g) Cable no. 40, (h) Cable no. 41, (i) Cable no. 42.
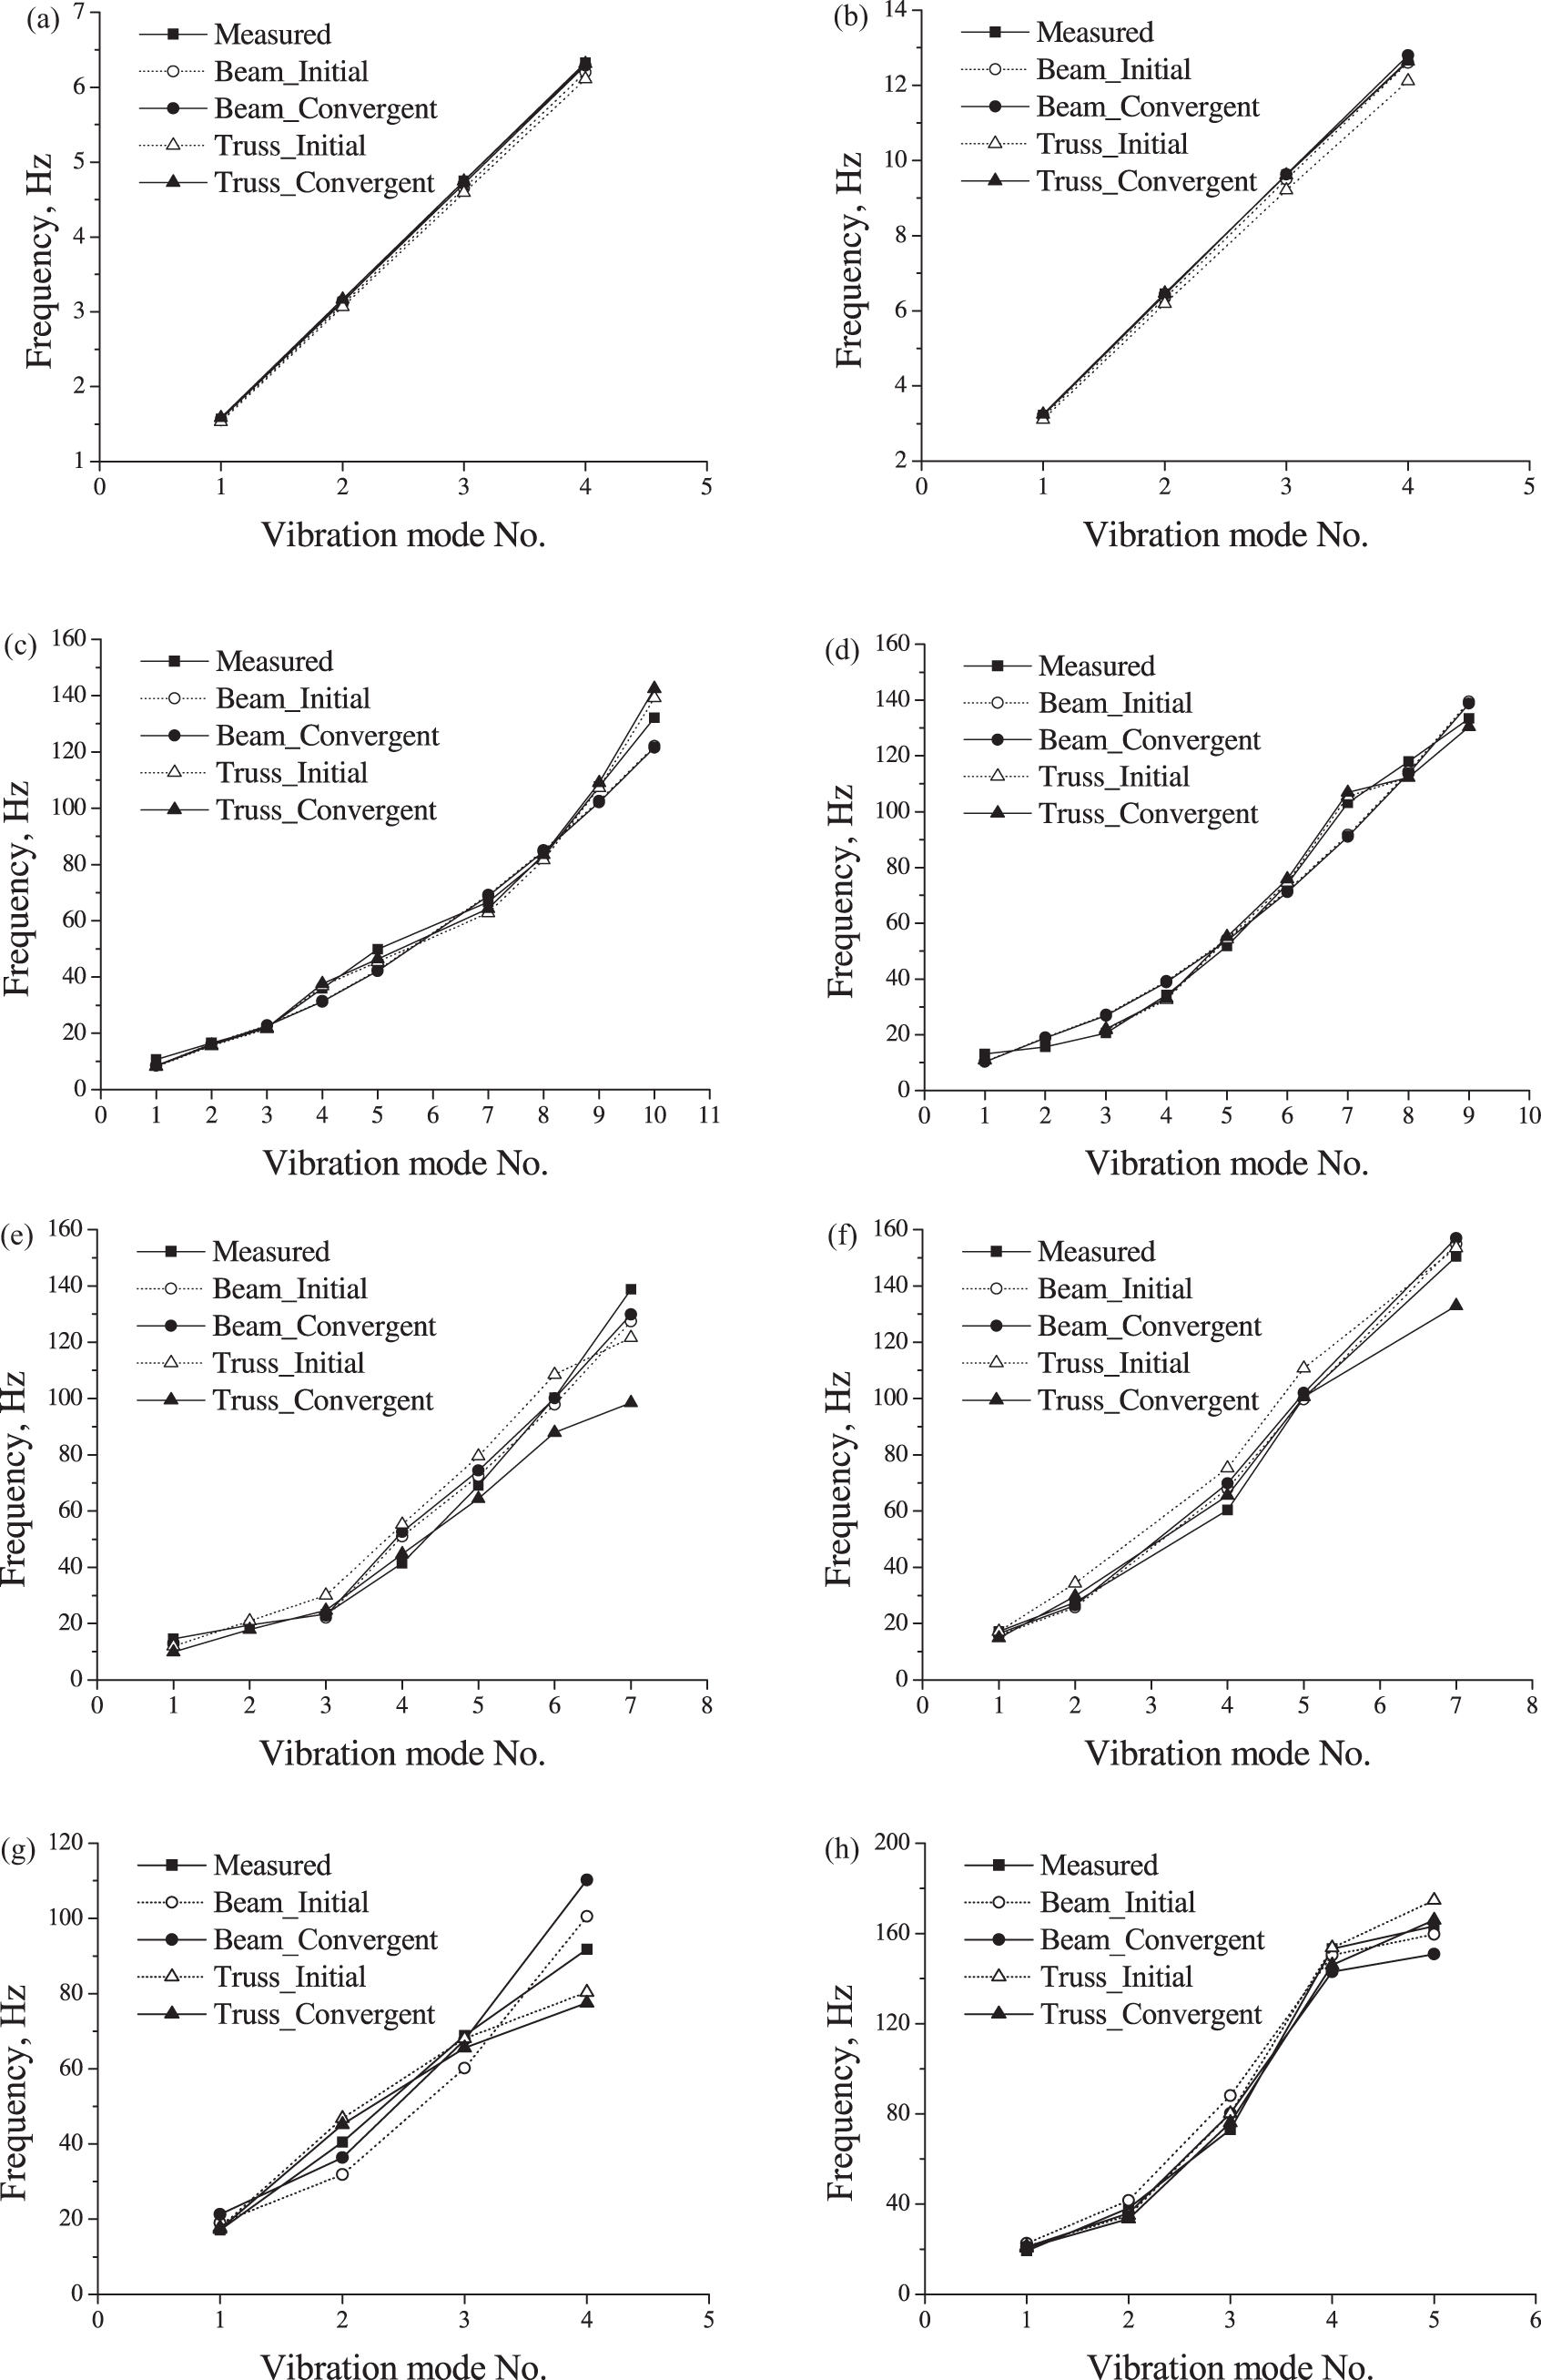
Figure 13 shows that the calculated natural frequencies are close to the measured natural frequencies through the convergence of back analysis. In some cases, the calculated frequencies resulted from initial analysis are a little closer to the measured frequencies than the calculated frequencies at the convergence of tensile force. However, it may be reasoned that in the first natural frequency having a dominant vibration mode, the calculated frequencies are nearly concurrent with the measured frequencies. Considering the modal participation factor in most cases of back analysis, the frequencies at the convergence of tensile force by back analysis conform well to the measured frequencies.
4.3. Comparison of results
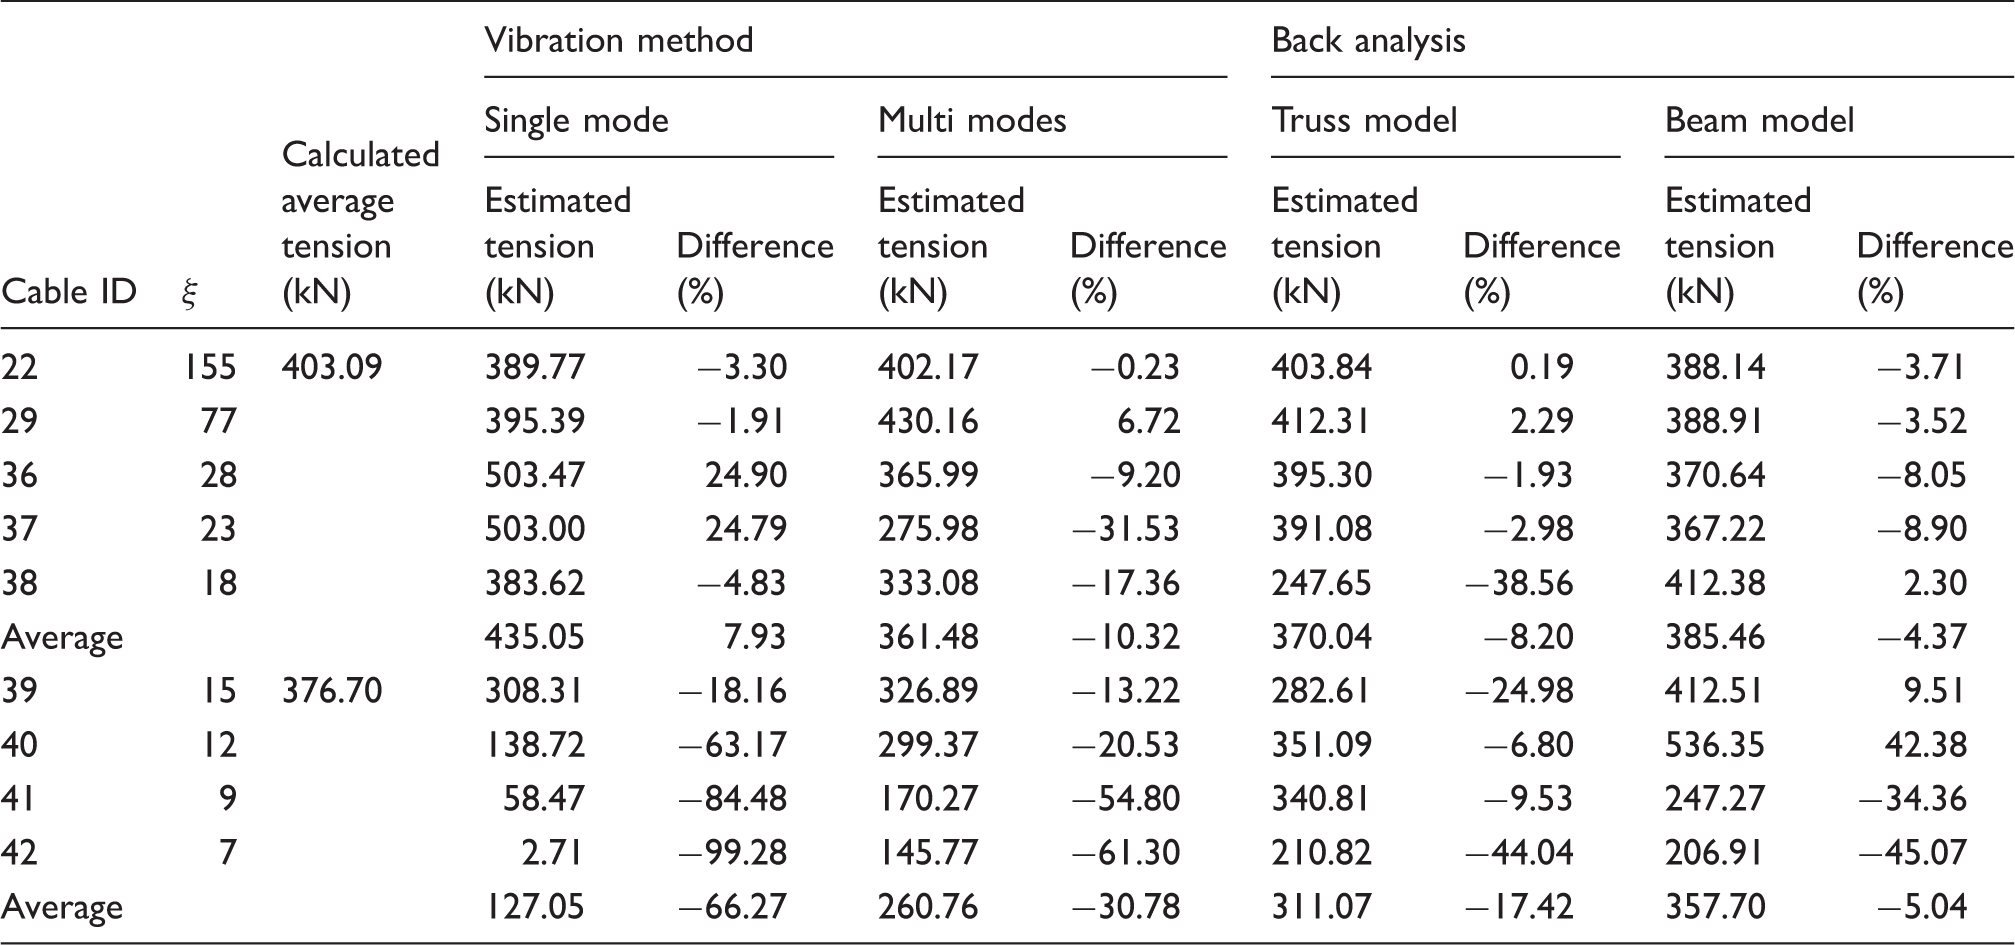
Table 4 and Figure 14 show the estimated tensile forces and differences between estimated tensile values and averaged tensile values from past reports (Kim et al., 2009). The averaged tensile values from past reports were calculated with data of safety evaluation reports by some design companies in South Korea. According to reports in the past, truss weight and deck weight per meter on the main span of Gwangan Bridge have been measured as 142.4 kN and 178.5 kN respectively after completion. The averages of tensile forces after construction of long and short cables could be calculated as 403.094 kN and 376.696 kN respectively.
Generally, maximum difference and standard deviation are two of the most important criteria for reasonability of average value in a study considering average. However, in this study, the averages of tensile forces calculated from dead load have been used for a criterion of reliabilities without maximum difference or standard deviation. Because the given weights of bridge deck and stiffening were the only values measured in the past.
Comparison of estimated tensile forces by back analysis and methods based on string or cable equation. Estimated tensile forces and difference from back analysis and methods based on string or cable equation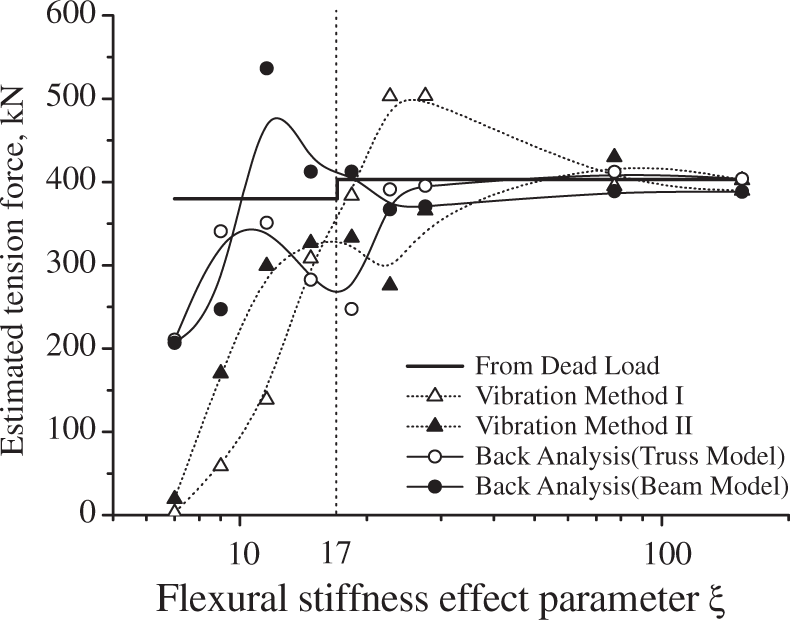
The averaged tensile forces from each method are obtained near the average measured tension after completion when the flexural stiffness effect of hanger cables could be ignored (
5. Concluding remarks
In this study, cable tensile force estimation methods, based on a string or cable equation and the back analysis technique proposed in this paper, were used for estimating the tensile force on hanger cables. Concluding remarks can be drawn as follows.
In the case of comparatively long cables (
However, in the case of comparatively short cables, as for cables nos. 39–42, the resultant curves of methods based on a string or cable equation started to slip because the flexural stiffness effect was not considered. On the other hand, the back analysis results are efficient enough to be applicable to comparatively shorter cables than the methods based on string or cable equation. There is about 5% difference between the average of estimated tensile force by back analysis with a beam model and the calculated average of tension in Table 4. Especially, the calculated frequencies of back analysis using the beam model were well matched with the measured frequencies, as shown in Figure 13. Moreover, there is much room for improvement of accuracy in back analysis and this depends on updating the numerical models and measurement techniques.
It can be concluded that the back analysis technique using beam models is more applicable for estimating the tensile force of hanger cables than the other method in this paper; such as methods based on a string or cable equation and back analysis technique using truss models. In estimating tensile force on short cables, the back analysis technique using the beam model can be an especially effective method because the frequencies of short cables are severely sensitive to flexural rigidity.
Footnotes
Funding
This work was supported by Pusan National University Research Grant.
Acknowledgements
The authors gratefully acknowledge the support of their funding body.