
Abstract
One of the characteristics that may influence customers in vehicle purchasing is the level of comfort of the vehicle’s sound vibration in the vehicle cabin. The basic principle suggests that the sound vibration discomfort level is affected by a few factors which are mainly based on magnitudes, frequencies, directions and also the exposed periods. Normally, the phenomenon of sound vibration disrupts the performance of the driver by affecting the driver’s vision and also inducing a certain degree of stress due to the sound and vibration to which the driver and his or her passengers are exposed. The sound vibration is generally contributed by a few sources originated from the transmission of the vehicle’s engine, tire interactions with the road surface and also the exposure of vehicle’s body vibration during the movement. The objective of this study is to propose an approach that clusters the level of sound and vibration into a few categories and classifies them into those categories without implementing the subjective test that normally involves human assessment. The study has observed the changes of the sound quality and the level of vibration at particular points in the vehicle cabin over the changes of engine speeds. In reference to the results, the study has successfully provided a technical procedure in order to cluster, and also to classify, the level of sound vibration by taking into account the correlation between experienced noise and exposed vibration in the vehicle cabin.
1. Introduction
Normally, the phenomenon of sound vibration persistent in the vehicle system will affect the emotion of the driver or passenger and at the same time will influence the focus of the driver. The exposure of vibration may contribute to relative movements between the object and retina and further causing blurred images while driving. This condition will bother the visual’s performance, and at the same time will alter the driving focus and subsequently lead to a road accident. In this study, both trends of sound quality parameters and levels of vibration against the engine speeds will be observed in order to identify the correlation between generated sound and exposed vibration in the vehicle cabin. Since the evaluation towards noise and vibration will involve subjective judgment and bias during the evaluation, the study uses K-means and neural network algorithms for the purposes of clustering and classifying the level of sound vibration into a few categories in the vehicle cabin. This approach is able to evaluate the level of sound vibration level in the cabin without using the commonly used jury test as compared to previous studies.
1.1. Sound vibration in the vehicle cabin
The phenomenon of sound vibration is the vibration that is contributed by a moving, vibrating object while the vibration in the waveform is brought from the original location into the air and then transferred through the air until it is audible enough to the listener. Thus, this scenario will cause the listener to hear the event or incident that happens together with the accompanying vibration. Theoretically, the sound is produced while the objects are moving or vibrating, allowing the molecules of air around that object to vibrate or move and at the same time to be transferred to the direction of the ear. This phenomenon enables the listener to hear that produced sound after being interpreted by the listener’s brain. Here, the pitching of the sound plays a primary role to represent the level of the sound, while the sound is very much dependent on the frequency of the vibration by the object. In other words, the amount of sound corresponds to the force that is used to move or vibrate that object.
There are multifarious effects of high-level sounds to health. Generally, noises can contribute to hearing impairment, hypertension and also to sleep disturbance if they happen for long periods. Besides, the high level of sound is also a definite source of annoyance and at the same time can dampen the listener’s emotions. Thus, these stressful effects can reduce the driving focus and at the same time can be a probable reason for increased rates of road accidents. The consideration on the level of annoyance contributed by sound vibration is important, since stressful effects correspond to the magnitude, and also the quality, of the exposed sound and vibration. Generally, the acoustical requirement towards the level of sound that is to be experienced in the vehicle cabin is normally perceived as more pleasant and less annoying, compared to the sounds outside the vehicle cabin. A lot of evaluation and interpretation methods have sought to measure the comfort level of sound vibration (Nor et al., 2008; Nahvi et al., 2009; Shin et al., 2009) exposed in the vehicle cabin, since it can affect the health of both the driver and passengers, simultaneously influencing the driving quality as well as inducing a certain degree of stress in the listeners. The main effect of sound as the vehicle is moving is that it will disrupt the communication between passengers where the passenger’s speech is difficult to be heard due to the background noise. Thus, sound vibration is a major element that must be considered, in order to improve the driving performance and at the same attract a customer to purchase a particular vehicle.
1.2. Evaluation of vibration level
Generally, vehicle manufacturers are continuously studying various methods to improve the comfort level of sound vibration in a vehicle cabin. The main reason lies in the fact that the sound vibration phenomenon is one of the contributors of noise and vibration taking place in the vehicle’s interior, further contributing to the driver’s stressful state. Besides, this phenomenon can also cause whole-body vibration (Daruis et al., 2008) experienced by the driver who sits on a vibrating location or who holds or touches vibrating parts of the car such as the steering, gear or door handle. Normally, sound vibration that is exposed in the vehicle’s interior corresponds to the velocities of the vehicle where it is directly related to engine speeds. This condition is actually caused by changes in direct proportion to the transmission of the engine. A vibration which is produced by the engine surface will generate sound in the vehicle’s interior where sources basically originate from the vibration due to the combustion and also vibration due to the mechanical movement of the engine.
The level of sound vibration triggered by the engine’s combustion is dependent on the performance and engine speed where it can be categorized into two types: inner source and external source. The sound from the inner source is the noise produced due to the engine’s combustion, piston striking, the motor control, the driving wheel and etc. Meanwhile the external sources are mainly caused by the suction system, cooling fan, motor surface, exhaust etc. Generally, the main sources of vibration in the vehicle system can be divided into two main sources which are engine’s transmission during acceleration or deceleration, and also the vibration caused by the tire while interacting with the road surface. However, at certain engine speeds, the main contributor for exposed vibration in the vehicle cabin is vibration due to the interaction of tire with road surface (Kindt et al., 2009; O’Boy and Dowling, 2009a,b). Besides the vibration that is generated by rolling tires, the exposed vibration may also be contributed by vibrating structure-borne where it spreads and transfers the vibration to any other areas or parts such as dash box, gear box, door, rim, etc. In this scenario the factors of roughness will affect the generation of vibration where the rougher the surface, the more vibration generated and at the same time more sound will be produced in the cabin’s interior. Since sound vibration basically comes in a package, sometimes it is too difficult to differentiate between both the sound and vibration sources. For example, the source of the sound vibration may sometimes be confused between two sources, which are sound vibration due to the rolling tire and sound vibration due to the vibrating exhaust outside the cabin. Even though the exhaust is one of the minor sources of the interior sound, in this consideration, the exhaust system is excluded because it is believed the sound of exhaust only gives a minor effect towards the vehicle cabin’s acoustics since current vehicles are mostly installed and covered with glass in order to eliminate the outside sound from penetrating the cabin’s interior.
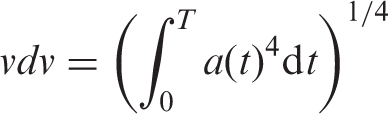
Basically, the evaluation method that has been applied to assess the level of vibration is BS 6841 (British Standards Institution 1997) where the standard uses root mean square acceleration a(t). The reason why this standard is chosen is that the standard is a very familiar tool to assess vibration. Additionally, the standard is also quite simple, consistent internally and at the same time offering less ambiguity in measurement. Since the movement of the vehicle involves changes of shocks or impulsive velocity, the evaluation method for vibration that is considered more suitable is the vibration dose value (VDV). The evaluation method uses the magnitude of acceleration of the time integrated fourth power. Here the value of VDV represents the total amount of exposed vibration which is felt or experienced by the driver or passenger in a certain period of time. Theoretically, it may be assumed that VDV (ms−1.75) is the measurement of total exposure of vibration where it considers a few more elements such as magnitude, frequency and also exposed duration in time. The equation used to represent the formula to obtain VDV is shown in equation (1) below.
1.3. Evaluation of acoustics level
For automotive engineers, especially those in the acoustical field, it is very important to know about the methods or devices that may be used to assess the level of sound vibration This is in order for them to be able to improve the level of sound vibration in the vehicle cabin. In order to reduce the level of sound, it is compulsory for automotive researchers to be able to evaluate the level of certain noise numerically and quantitatively. Normally, only the driver or passenger in the cabin can evaluate the level of sound vibration by expressing the level of comfort or annoyance subjectively. The acceptance towards the definition or expression given by the listeners sometimes varies among the passengers. This is contradictory to science and engineering where these fields require the researchers to enable the process of identifying and recognizing the level of sound vibration quantitatively and also the possibility that it can be read numerically. Thus, the objective test is carried out in order to measure the parameters of the sound quality of the experienced noise. In this case, four parameters of sound quality were observed to be analyzed with regards to their trends towards the changes over engine speeds. Those parameters studied are Zwicker loudness, sharpness, roughness and fluctuation strength. Basically, the most important parameter among those four parameters is Zwicker loudness because the accuracy of this parameter to represent the perception or expression of human is higher compared to other parameters. The details about these four parameters are listed as below.
Loudness: The measurement unit is in [Sone]. Main parameter sound quality to represent the magnitude of sound level. Sharpness: The measurement unit is in [Acum (Z)]. High frequency parameter in signal frequencies spectrum. Roughness: The measurement unit is in [Asper] and having lower modulation frequencies (about 70 Hz). Fluctuation Strength: The measurement unit is in [Vacil]. Low frequency modulation and the amplitude of modulation in time sample.
1.4. Clustering and classification
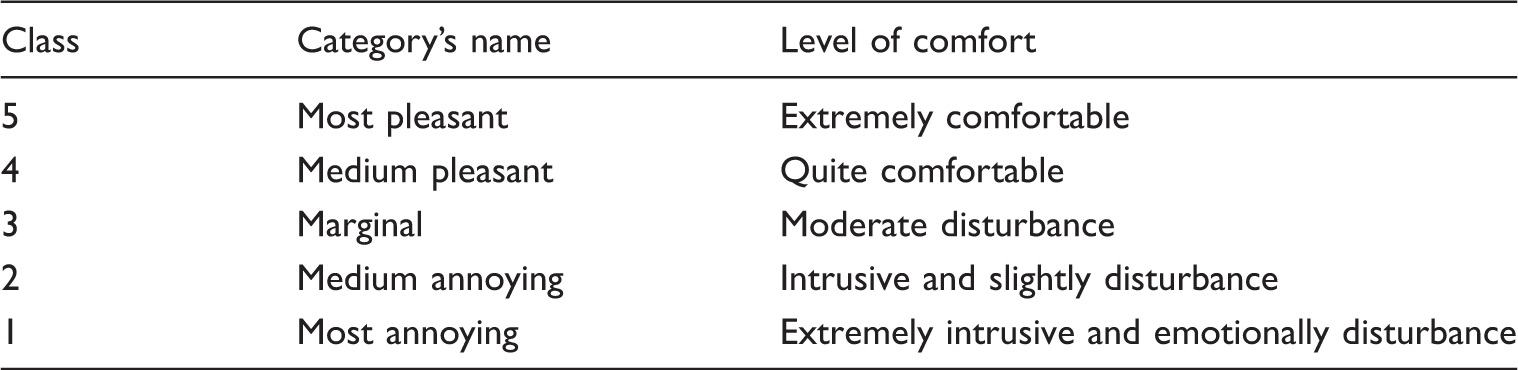
In this study, the authors developed algorithms to cluster and classify the levels of sound vibration into a few categories in order to recognize the level of comfort based on the sound vibration experienced more accurately in the vehicle cabin. Thus, clustering and classification will play a major role to enable the identification of the sound vibration level experienced, and later to improve the current structure or parts in the cabin based on the results provided. Basically in this study, an attempt was made to group the data based on their trends into a few categories following that the number of groups required. This clustering algorithm is also known as an unsupervised procedure to group a data into categories following the measurement of inherent similarity. In this case, the distance between instances is made as vectors in a multidimensional vector space in the computation. Meanwhile, classification is basically a problem of identifying a set of data which category belongs to where those categories are known previously, by training the set of data as one of the algorithms. Here, the individual observations are analyzed and divided into a set of numerical properties considered as multiple explanatory variables or sometimes also known as features. These properties can be categorized into a few classes or clusters, where in this study the authors seek to classify the level of sound vibration into five clusters that are ‘most pleasant’, ‘medium pleasant’, ‘marginal’, ‘medium annoying’ and ‘most annoying’. In this case it is assumed that the algorithm to perform the classifying job serves as classifier where this term refers to the process of mapping the particular data in data sets to certain categories. Thus, in this terminology the process of classification is considered as an instance of supervised learning while particular identified observations are available in the training sets.
1.4.1. K-means algorithm
K-means algorithm is a simple unsupervised algorithm that may be applied in order to solve clustering problems (Kanungo et al., 2002). This iterative algorithm has normally been used to cluster a number of data sets into a number of specific clusters that are normally known as k. Generally, this algorithm is quite simple to carry out and relatively fast and adaptable in practice. Basically, the K-means algorithm involves the method of data analysis or model of data mining process without supervision where the aim is to develop a partitioning system to cluster the data (Flóreza et al., 2009; Yiakopoulos et al., 2011). The way in which the K-means works is via the algorithm cluster feeding data into several required clusters where the data characteristics or values are similar to each other and also demonstrate different characteristics from any other data from other clusters. In another definition, this algorithm seeks to minimize the variation among the existing data in the same cluster and maximize variation between the data with other data from other clusters. This algorithm starts the process by formatting the clusters in the initial prototype until these clustered prototypes are improved by not having significant changes occurring iteratively. Basically, these changes are measured based on the objective function J where it is defined as the average sum of the distance of each data to the center group value. The details about the procedures of this algorithm are explained in the algorithm’s pseudo code below.
Step 1. Make the number of clustered data of the data set as input values.
Step 2. Initialize the first k’s cluster by getting the first k’s instances or randomly getting the sample of k’s elements.
Step 3. Compute the arithmetic means for each cluster formed from the data set.
Step 4. K-means only assigns one of the initial clusters for each record in the data set. Each record is assigned by searching for the nearest cluster based on the distance.
Step 5. K-means repeatedly assigns each record in the set of data to the cluster that has the most similarities and arithmetic means recomputed for all of the clusters in the data set.
1.4.2. Feed forward neural network
One of the algorithms that may be applied for the classification process is the artificial neural network model. This algorithm processes signal or information where it contains many simple processing elements known as artificial neurons that are directly connected with a connector in order to solve the required computational tasks. This algorithm is also widely known as the brain model, consisting of neuron cells linked with other neurons through the networks (Miller et al., 1995; Ou and Murphey, 2007; Anbazhagan and Kumarappan, 2012). The model mainly depends on the structure of the connection and also the weight of signals in its consideration while doing the computation.
Basically the concept of this algorithm is adopted by assuming that a human is able to perform faster and is more adaptive to environmental changes. In order to handle such activities, this human’s neural system is used to imitate human response and to resemble the behavior of the networks biologically (Reby et al., 1997). The function of the system is modeled by assuming that assigned impulse or signals affect the strength or value of the neurons and that they are continuously delivered to other neurons. Three elements of the neurons are dendrites, soma and axon. Basically, the task of dendrites is to receive the signals from neurons and at the same time to deliver the stimulation to soma electrically. The function of soma (also known as the cell body) is to sum up the signal’s inputs and then to transfer these signals to other cells if the level of signals exceeds the threshold. Meanwhile, the task of axon is to deliver the signals from soma to other neurons. The feed forward neural network is one of the biological algorithms that have been widely used for the classification process which is similar to this neuron network. Normally, this algorithm is used to classify a group of large data into categories in a specific manner (Hruschka and Natter, 1999; Arulampalam and Bouzerdoum, 2003; Jiang et al., 2003). This algorithm contains a number of simple neurons that are used to process the units of data (also known as nodes) organized in layers. Each unit in every layer is linked to other units from the previous layer. Normally, each connection between two neurons is not always equal and they run the possibility of having a different weight or strength. The value or information from the network is represented by these weights. Usually, this algorithm’s process involves the entering of data to the inputs and then the data is passed through layer by layer in the network until it reaches the outputs as shown in Figure 1. Two conditions of this algorithm are a) The network is able to be trained using the data inputs provided and b) The network must be able to generalize the data inputs which have similar values or characteristics included in the training data set. The neural network algorithms are expressed in equations (2) and (3).
Multi layer feed forward neural network.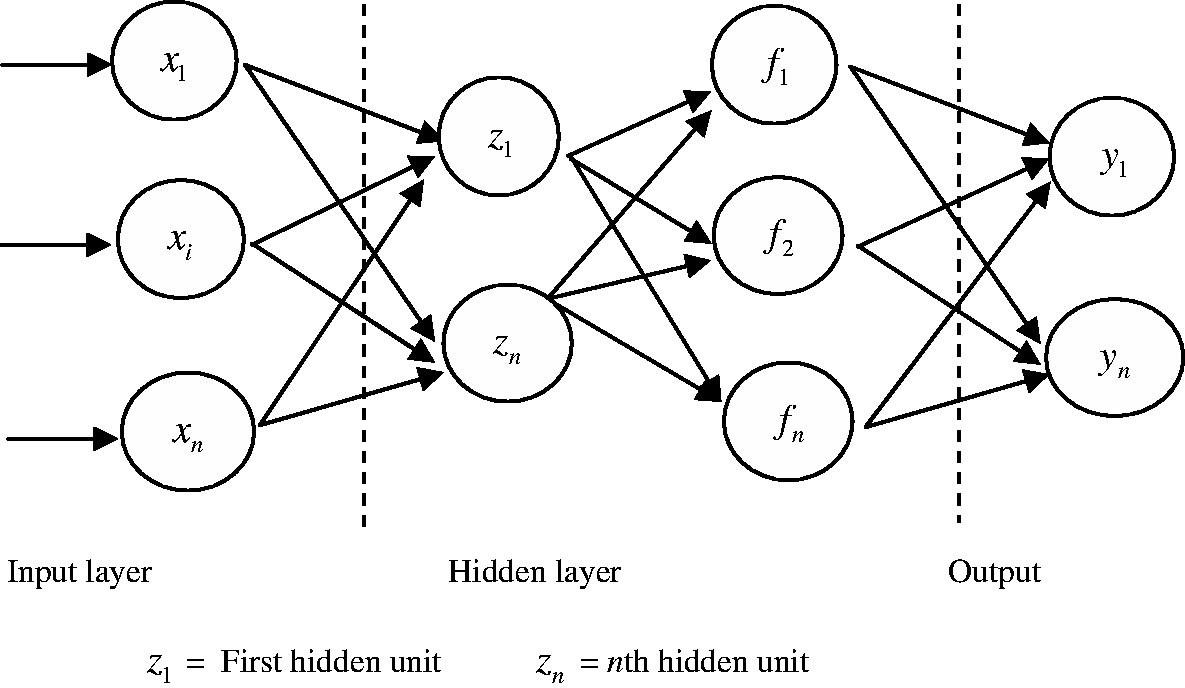


Where,
The feed forward neural network algorithm tries to stimulate the ability of the human brain to learn. In essence, this algorithm is developed based on the neurons that have a certain value of weight that represents the level of the strength of the connection. During the process, the changes that occur only involve the weight’s parameters. In this case if the information provided by certain neurons is reached, then the weight’s parameter value is increased. Contrastingly, if the information is not delivered to other neurons then the parameter of the weight that connects them will automatically decrease. Thus, the most important process in this algorithm is the training process. For the training that is carried out with different inputs, the parameter of weight will dynamically change until it reaches the most stable value (Mazurowski et al., 2008). By achieving the value, it shows that the required outputs have corresponded with the input that has been trained previously. In the learning process, the patterns of inputs will be organized into a single neuron at the layers of inputs. Basically the process of learning can be categorized into three main methods that are 1) Supervised learning, 2) Unsupervised learning and 3) Reinforcement learning. However, in this study, to train the network the focus is only on the supervised learning process since the outputs have been expected previously based on the trained data set provided. The details about the process flow of this algorithm are shown through the pseudo code below.
Step 1. Read the input data from the database and localize the cluster based on the data trends
Step 2. Crop the cluster trends
Step 3. Extract features from cropped cluster
Step 4. Find respected cluster’s vectors
Step 5. Train the neural network towards data
Step 6. Recognize the cluster
1.4.3. K-nearest neighbor
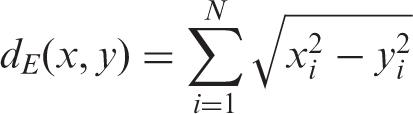
Contradictory to the previous neural network classification, the k-nearest neighbor (k-NN) is a model of classification that exploits lazy learning (Wang, 2012). Basically, this algorithm uses supervised learning to classify new query instances following the majority of the category of the k-NN (Zhang et al., 2010). To determine the category of k-NN, the minimum distance between the training samples and query instance is calculated. Meanwhile, to determine the k-NN, the prediction of the query instance must depend on the majority of the voting of the nearest neighbors’ category. Because query instance that refers to the test signal will be compared with all training signals, thus, the k-NN faces high response time. In this case, for each to have their test signal predicted, the minimum distance is calculated from the test signal to the training set in order to locate the category of the k-NN in the set of training data. In the pursuit of determining how close each member is to the test class in the training data set, the Euclidean distance measure has been used. To measure the Euclidean Distance as shown below, equation (4) is used.
Based on the k-NN category, the test signal’s class label is defined by applying the majority voting. The details about this algorithm are explained in the algorithm’s pseudo code below.
Step 1. Make the number of classified data set the input values.
In this case the
input:
To be classified as new instance:
Step 2. Calculate
Step 3. Arrange the order of
Step 4. Choose the nearest instances of K to
Step 5. Assign to x most frequent class in
2. Methodology
Sound quality measurements were conducted in both stationary and non-stationary conditions. The results were analyzed to get the parameters of sound quality. The measurements of sound were carried out based on the sound’s amplitudes and frequencies by measuring the parameter of sound quality using the binaural head and torso (HAT). To measure the vibration level exposed the assessment was carried out at the points that are commonly believed as dominant sources of vibrating parts in the cabin’s interior. In this study, the locations or parts that were selected to be assessed for the level of exposed vibration are the car floor, steering box, dash box, gear box and front door (driver side). Meanwhile, to measure the exposed vibration on the car’s floor, the location was the passenger’s floor next to the driver’s side. Both the sound and vibration measurements were carried out at the same time, depending on the engine speeds revolutions per minute (rpm). The measurement based on velocity [kmh−1] is only practically done while the car is on the driving mode, since the measurement is based on distance. However, at stationary position, the measurement cannot be based on velocity since the car is parked. As another option, the measurement based on engine speed (rpm) is used. Thus, to standardize the measurements of the sound and vibration under both stationary and non-stationary conditions, the measurements are performed over the changes of the rpm engine.
2.1. Test method
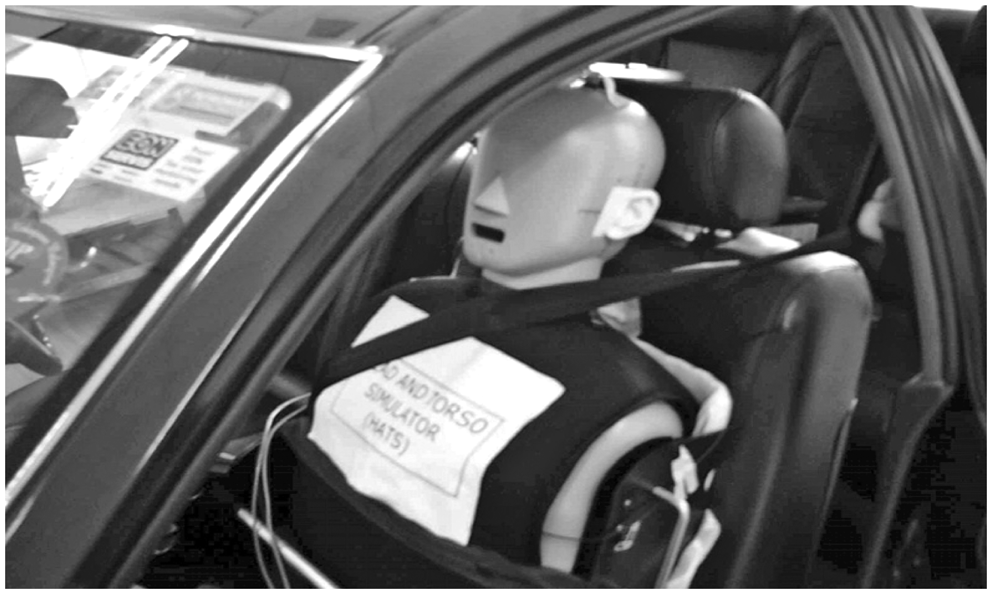
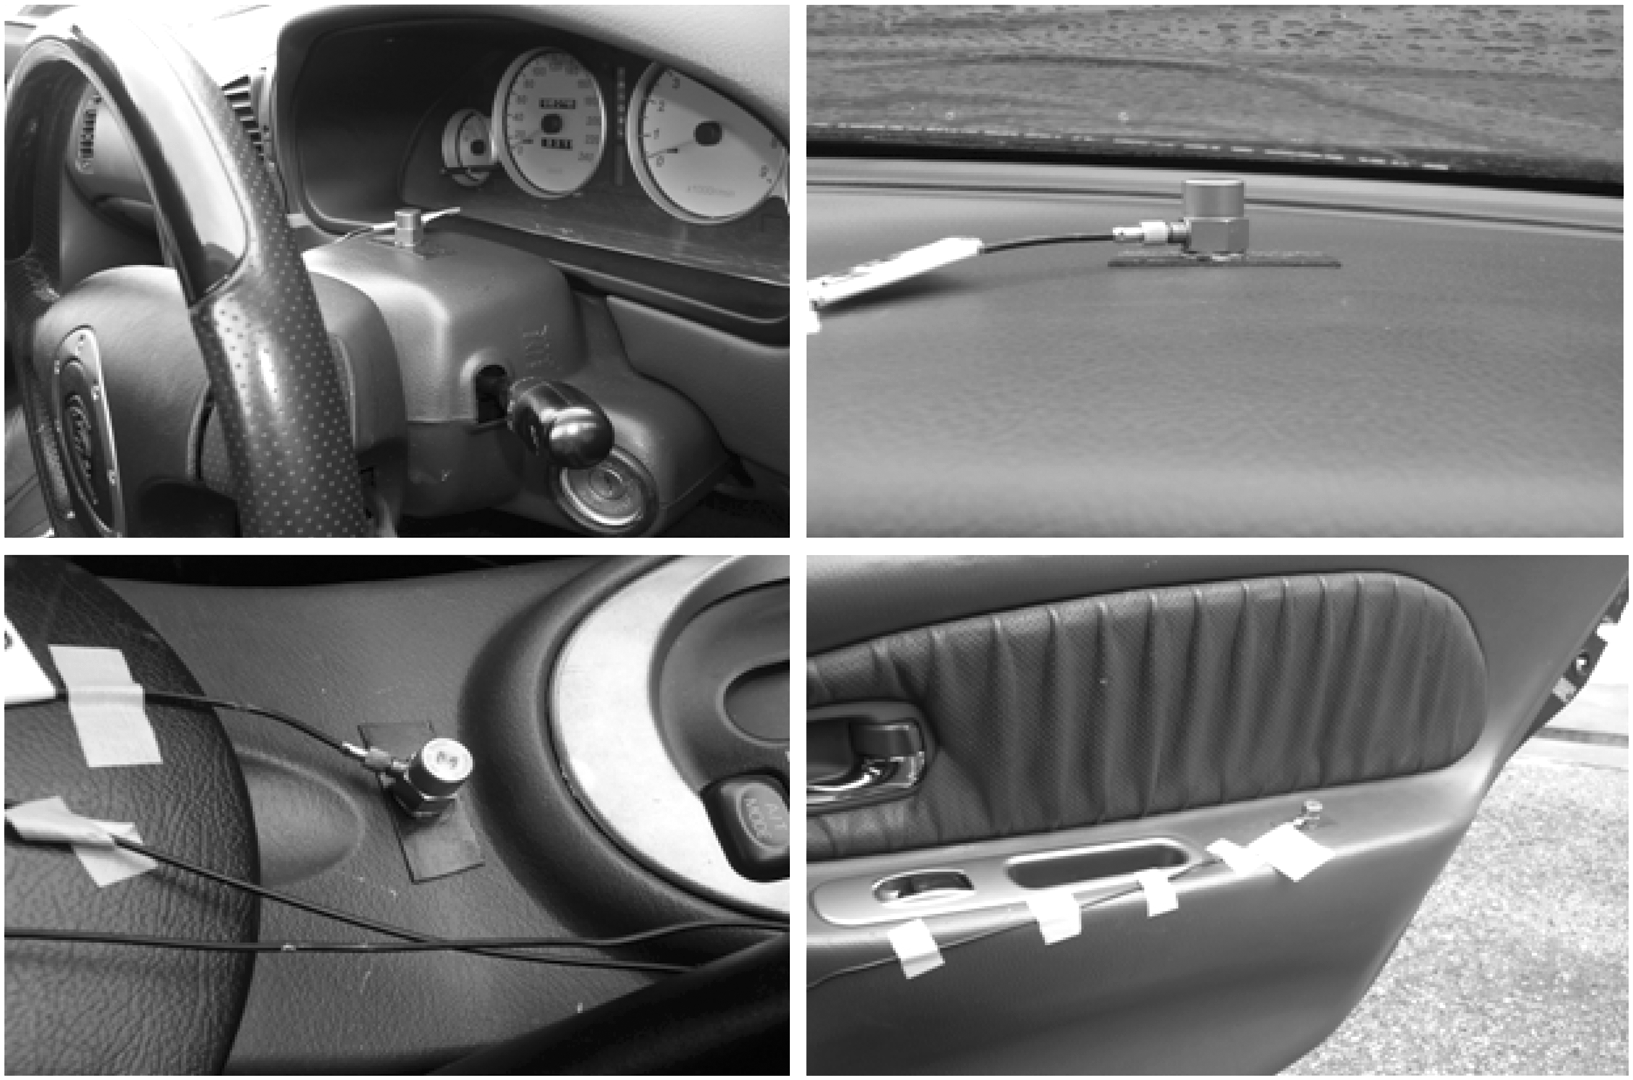
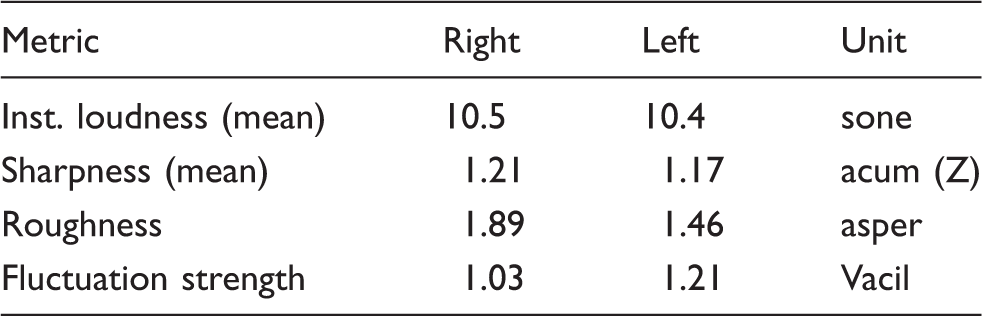
The vehicle that was used to measure the sound and vibration was the Proton Perdana V6 Automatic car (Figure 2) which is similar to the one used in previous studies (Nor et al., 2008). This is because the results of the acoustics evaluation will be compared with the previous evaluation method. Portable and multi-channel Bruel & Kjaer PULSE type 3560 D was used as equipment to perform the sound quality measurements. B&K head and torso (HAT) type 4100 was placed on the front seat beside the driver area (Figure 3). Since HAT is a binaural device, for standardization the measurement only selected either the measured sound’s data from the right or left channel to be analyzed as measurement results. In our study, B&K Pulse Labshop was used to measure the level of sounds, and the sound quality software that had been used to obtain the sound quality parameters was B&K type 7698 (Table 1). To evaluate the exposed vibration B&K isotron accelerometer 751–100 was installed on the front floor beside the driver’s side area and a few more locations (Figure 4). Next, to assess the exposed vibration at the car’s floor and other regions equation (1) is used in order to obtain the vibration dos value.
Proton Perdana V6. The B&K head and torso. Vibration level measured points. Example of measured sound quality.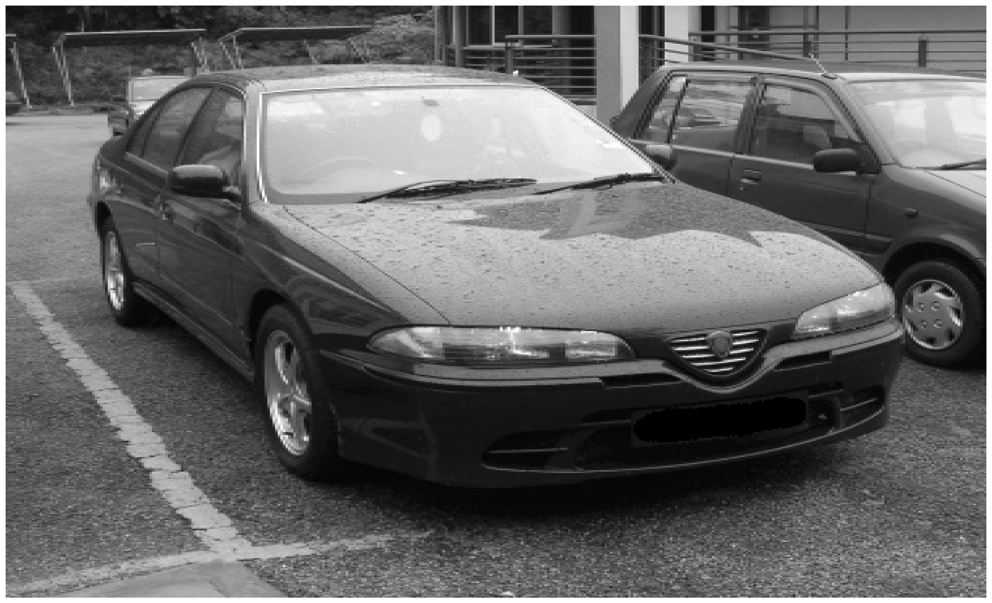
Both the measurements of sound and vibration were conducted in both stationary and non-stationary conditions.
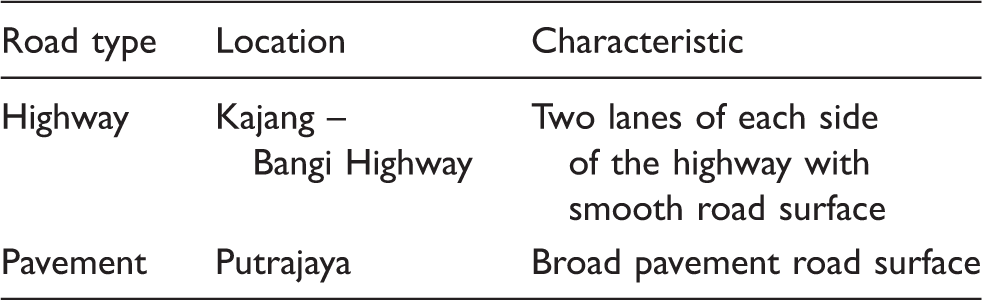
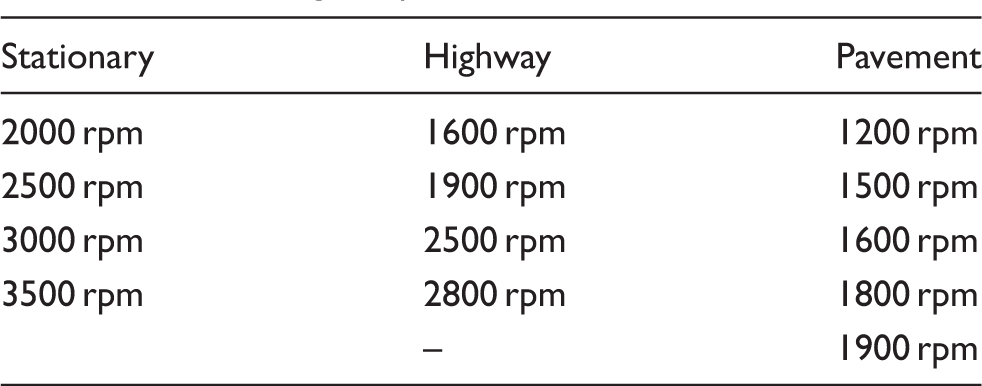
This is because the roughness of the road surface will affect the level of vibration that is exposed in the cabin. This vibration aligns with the generation of the interior sounds. Thus the level of sound and vibration on two types of road was measured, namely highway road and pavement road (Figure 5). Meanwhile, Table 2 shows the locations and also the characteristics of each tested road. Table 3 below shows the engine rpm that has been used in the test. At the stationary position, the test was started from 2000 rpm since the initial engine speed is normally within the range of 1400 rpm to 1800 rpm. In addition, it is also believed that there is no major difference between the generation of sound and vibration exposed in both conditions, the initial engine speed and 2000 rpm.
Two different roughness levels of road surface (a) Highway and (b) Pavement road. Locations of tested road. Tested engine speeds.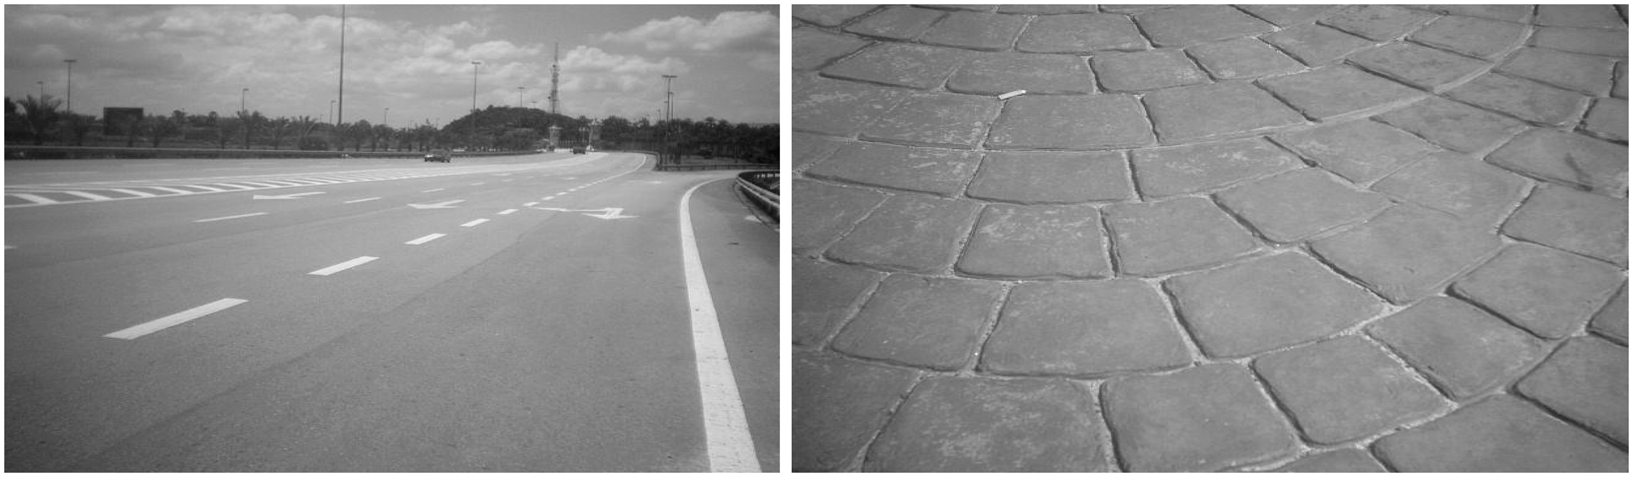
Ten seconds is a period that was decided for each measurement. The test was conducted by two members. In this case the driver has to drive at the same time focusing on the specific engine speed following the testing plan, meanwhile one assistant is needed to handle the laptop computer in order to record the level of sound and vibration using the measurement software. To get more reliable data, the measurement must be repeated for a few times for each engine speed. In our case, each measurement is repeated for four times to observe the engine speed. The procedures of the study are explained in more detail through Figure 6 below.
Research procedures process flow. The changes of sound quality’s parameters over engine revolutions per minute (rpm) at stationary condition. The changes of sound quality’s parameters over engine revolutions per minute (rpm) on the highway road. The changes of sound quality parameters over engine revolutions per minute (rpm) on the pavement road.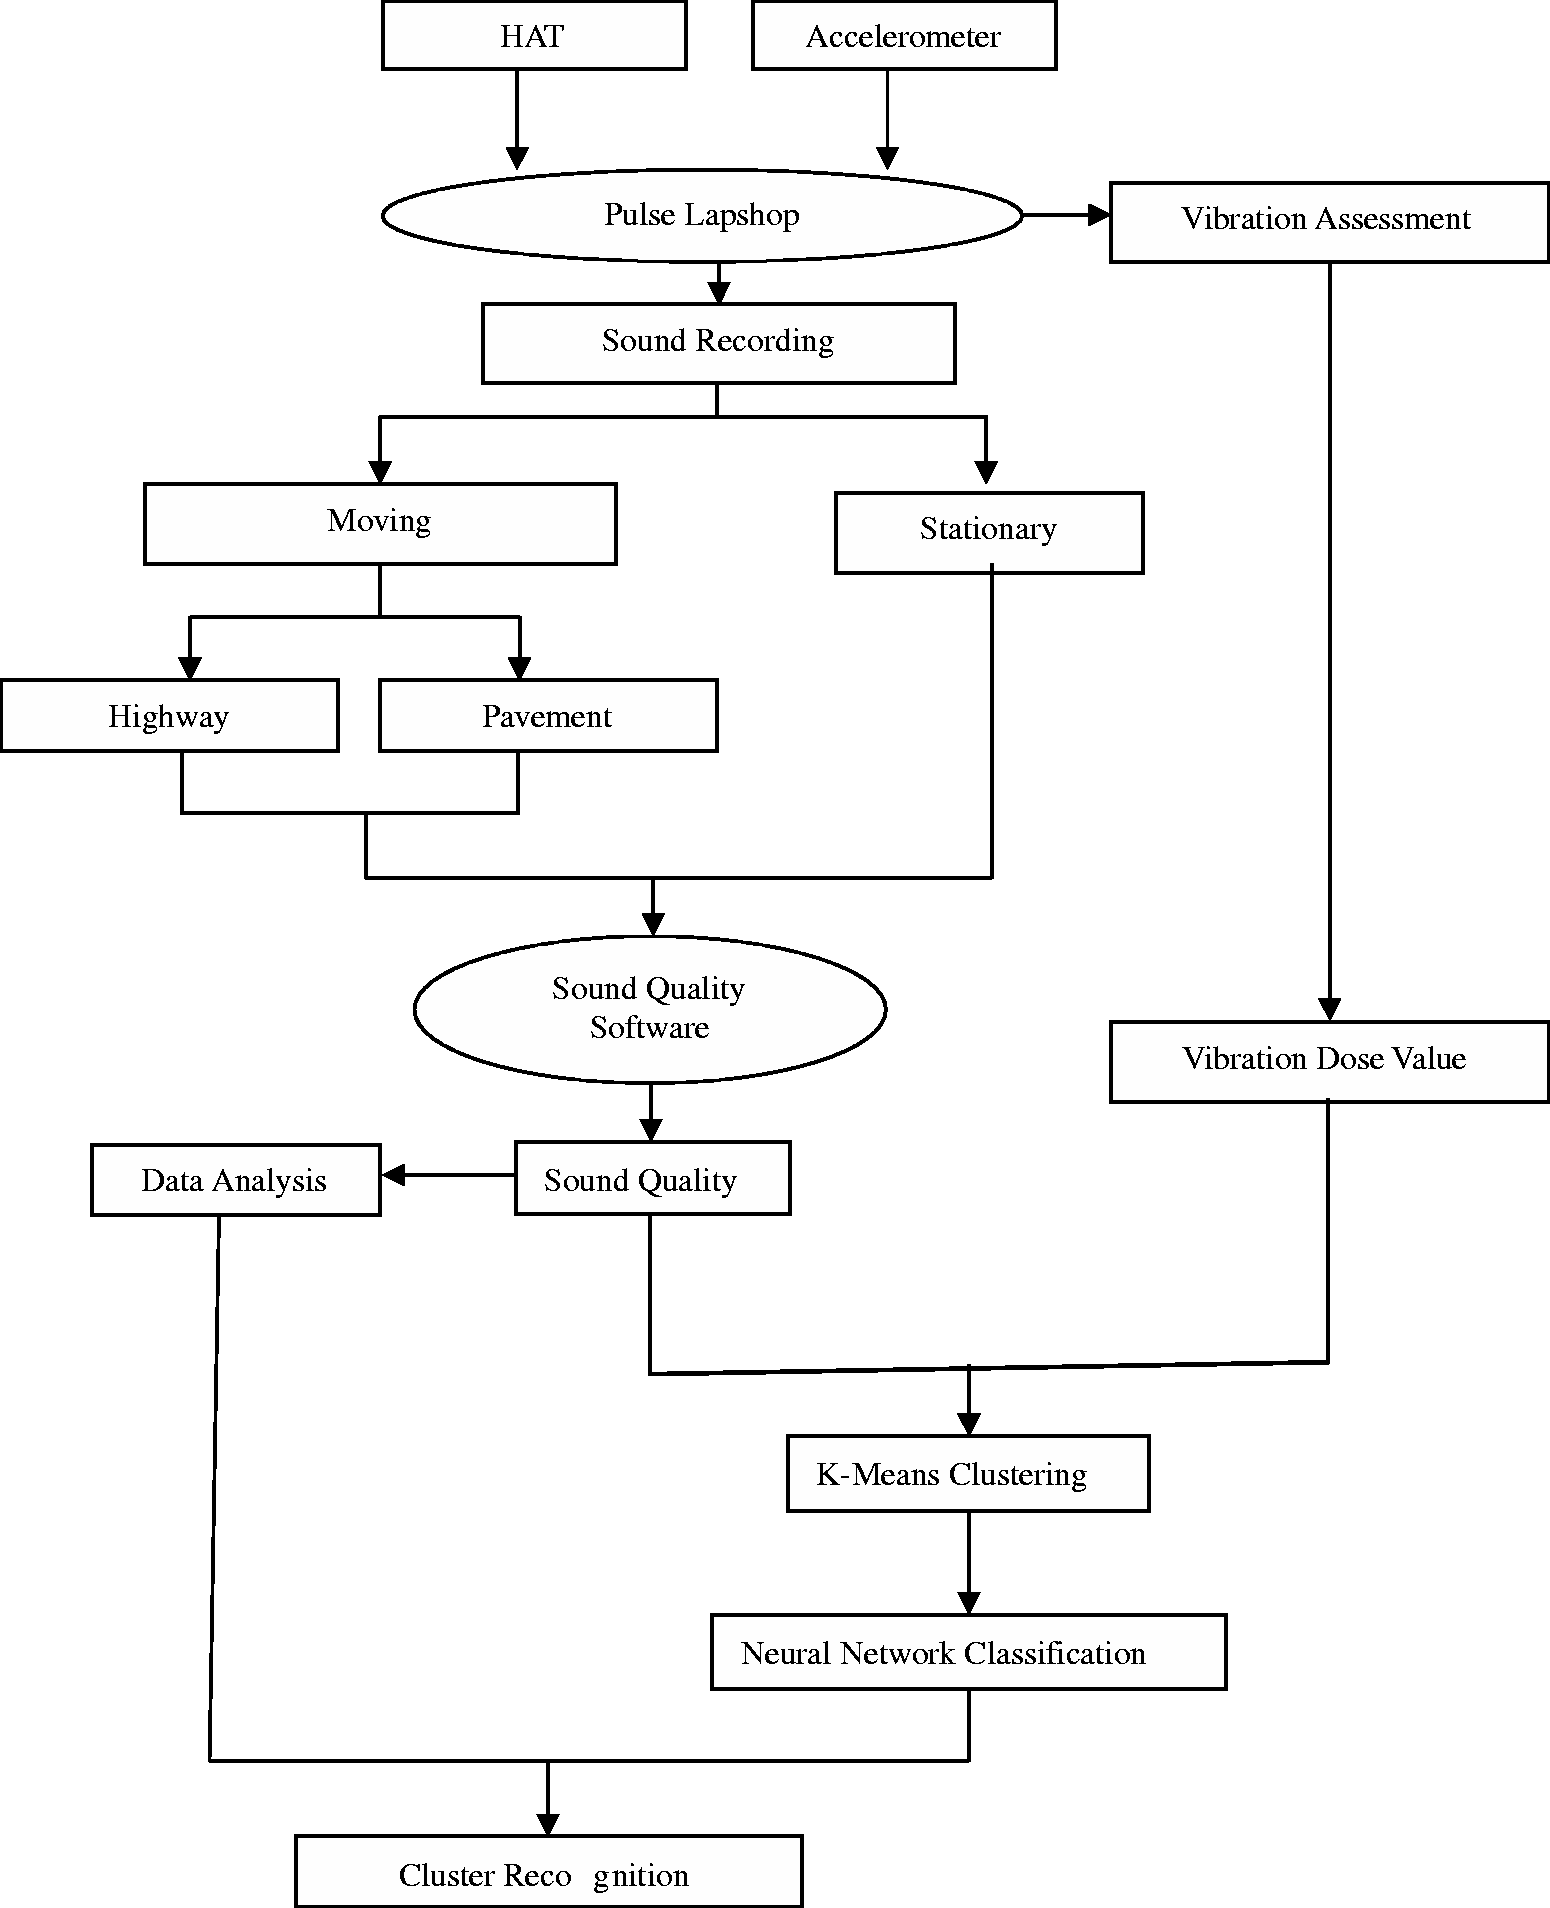
3. Data analysis
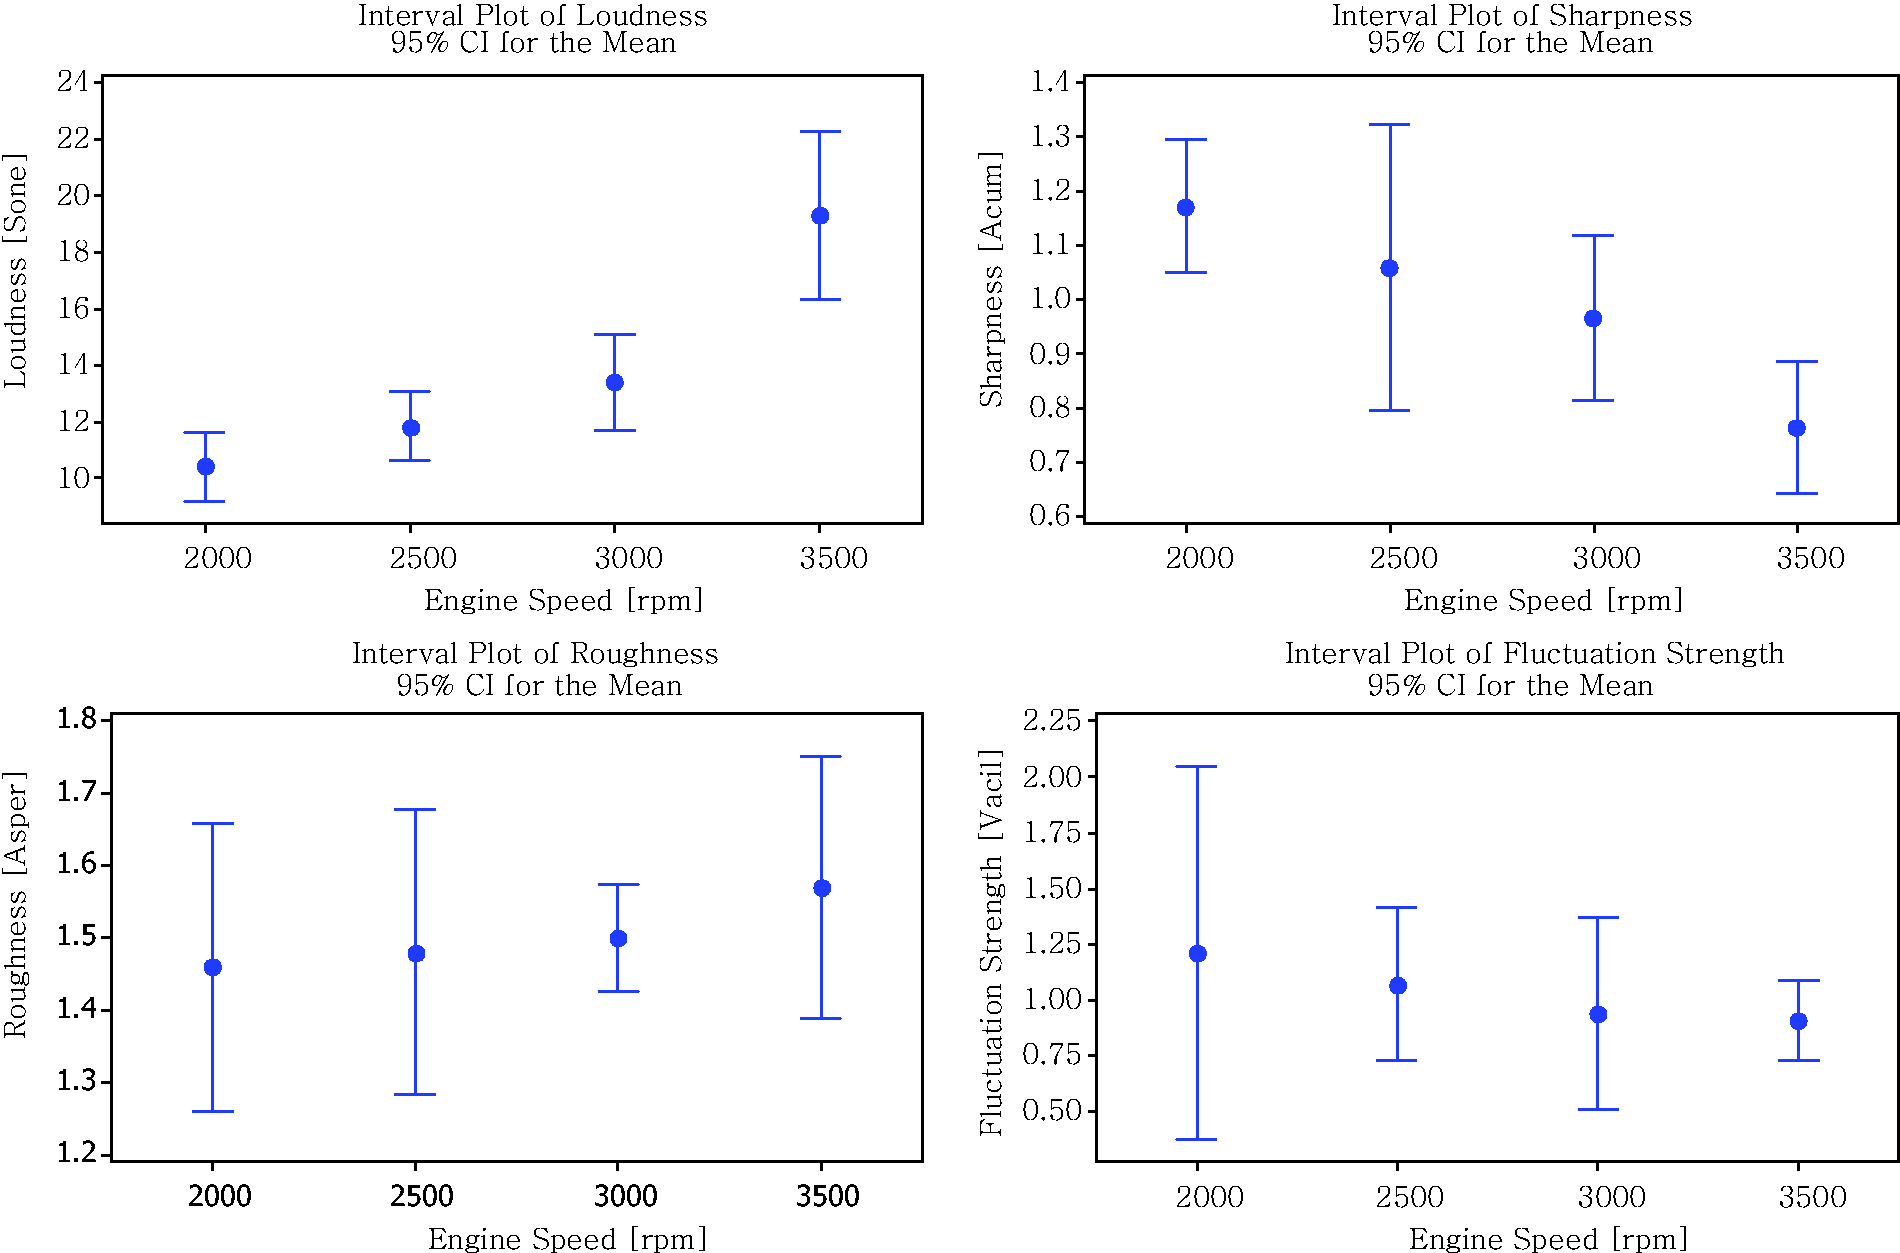
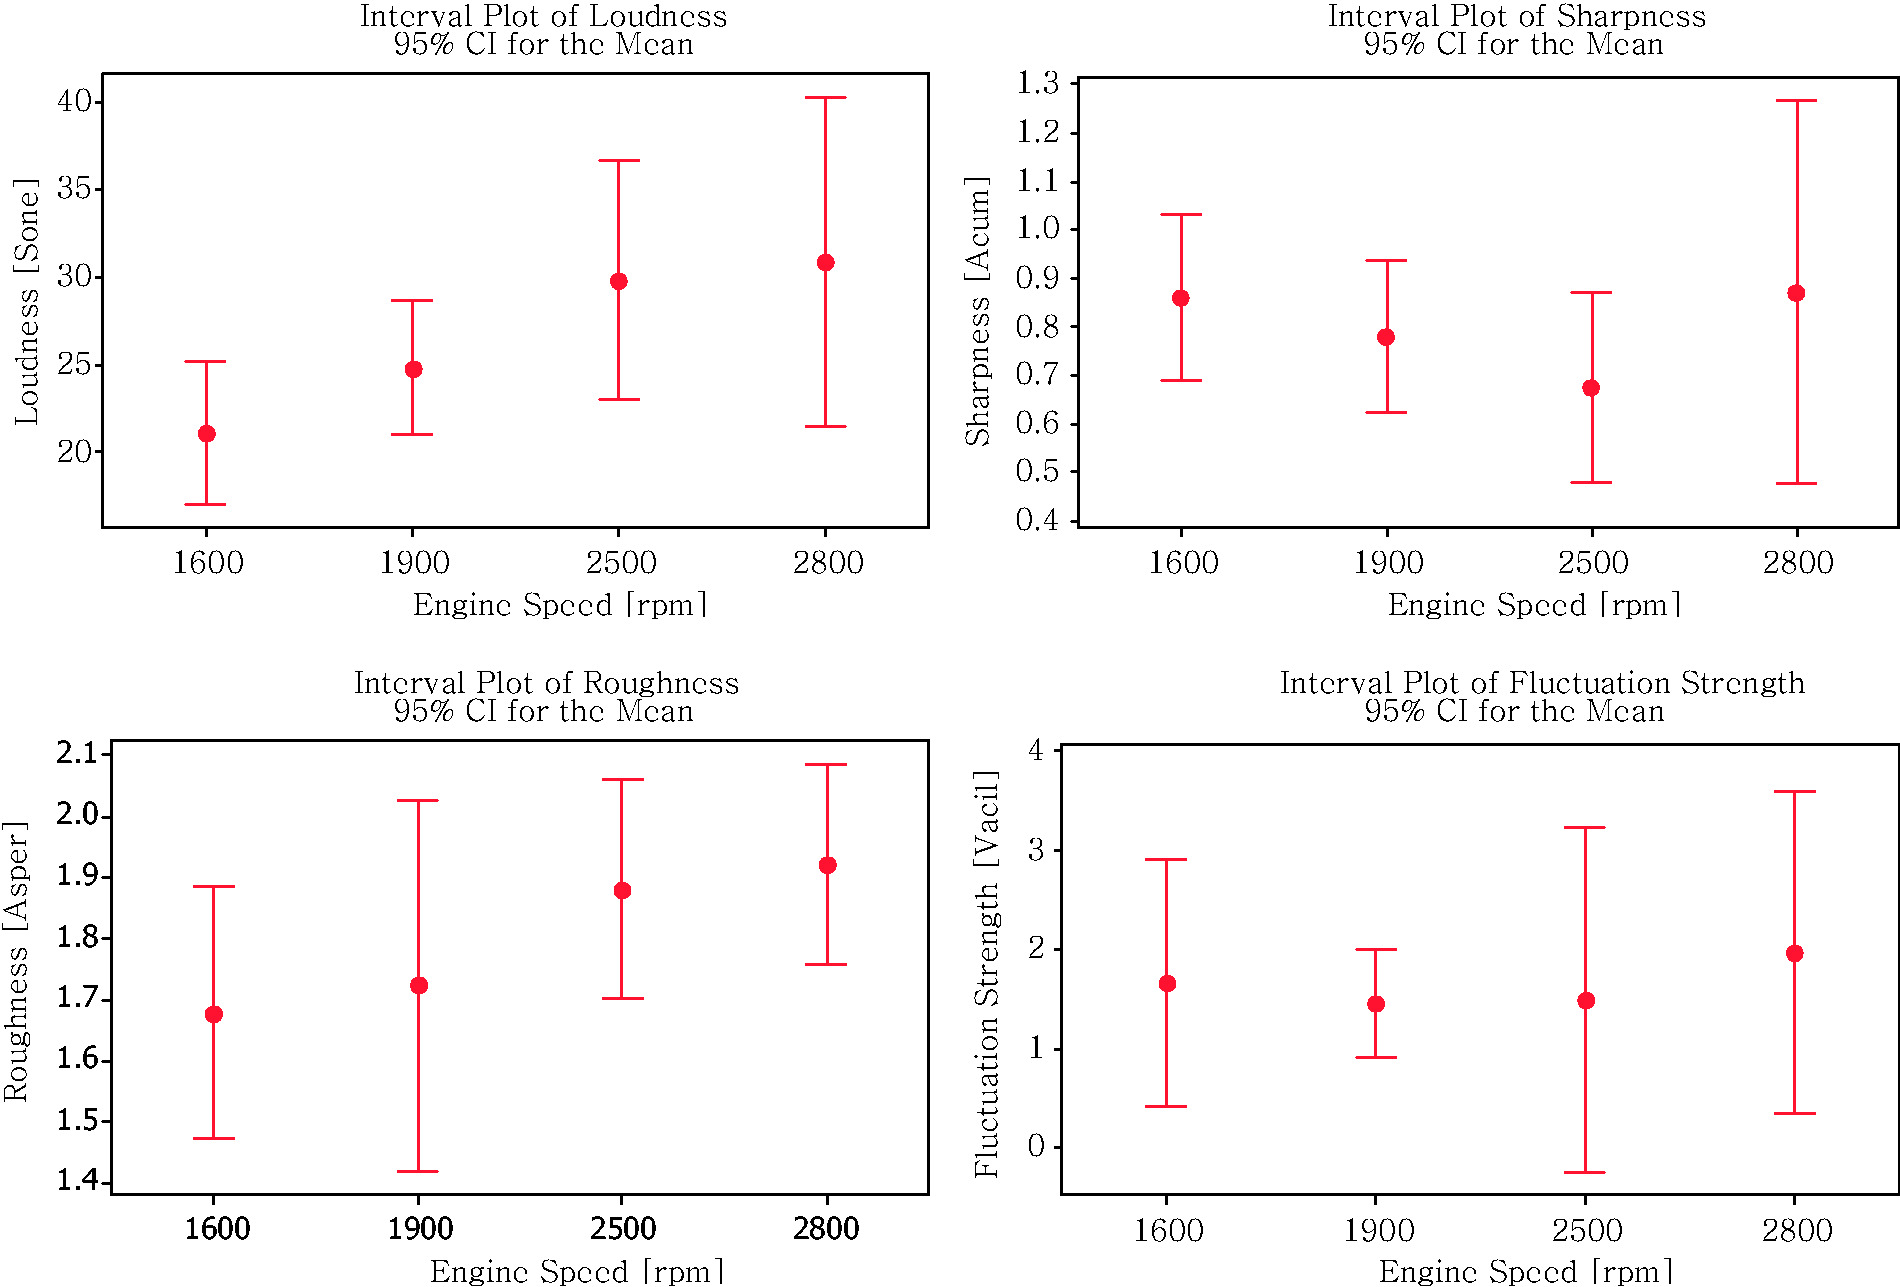
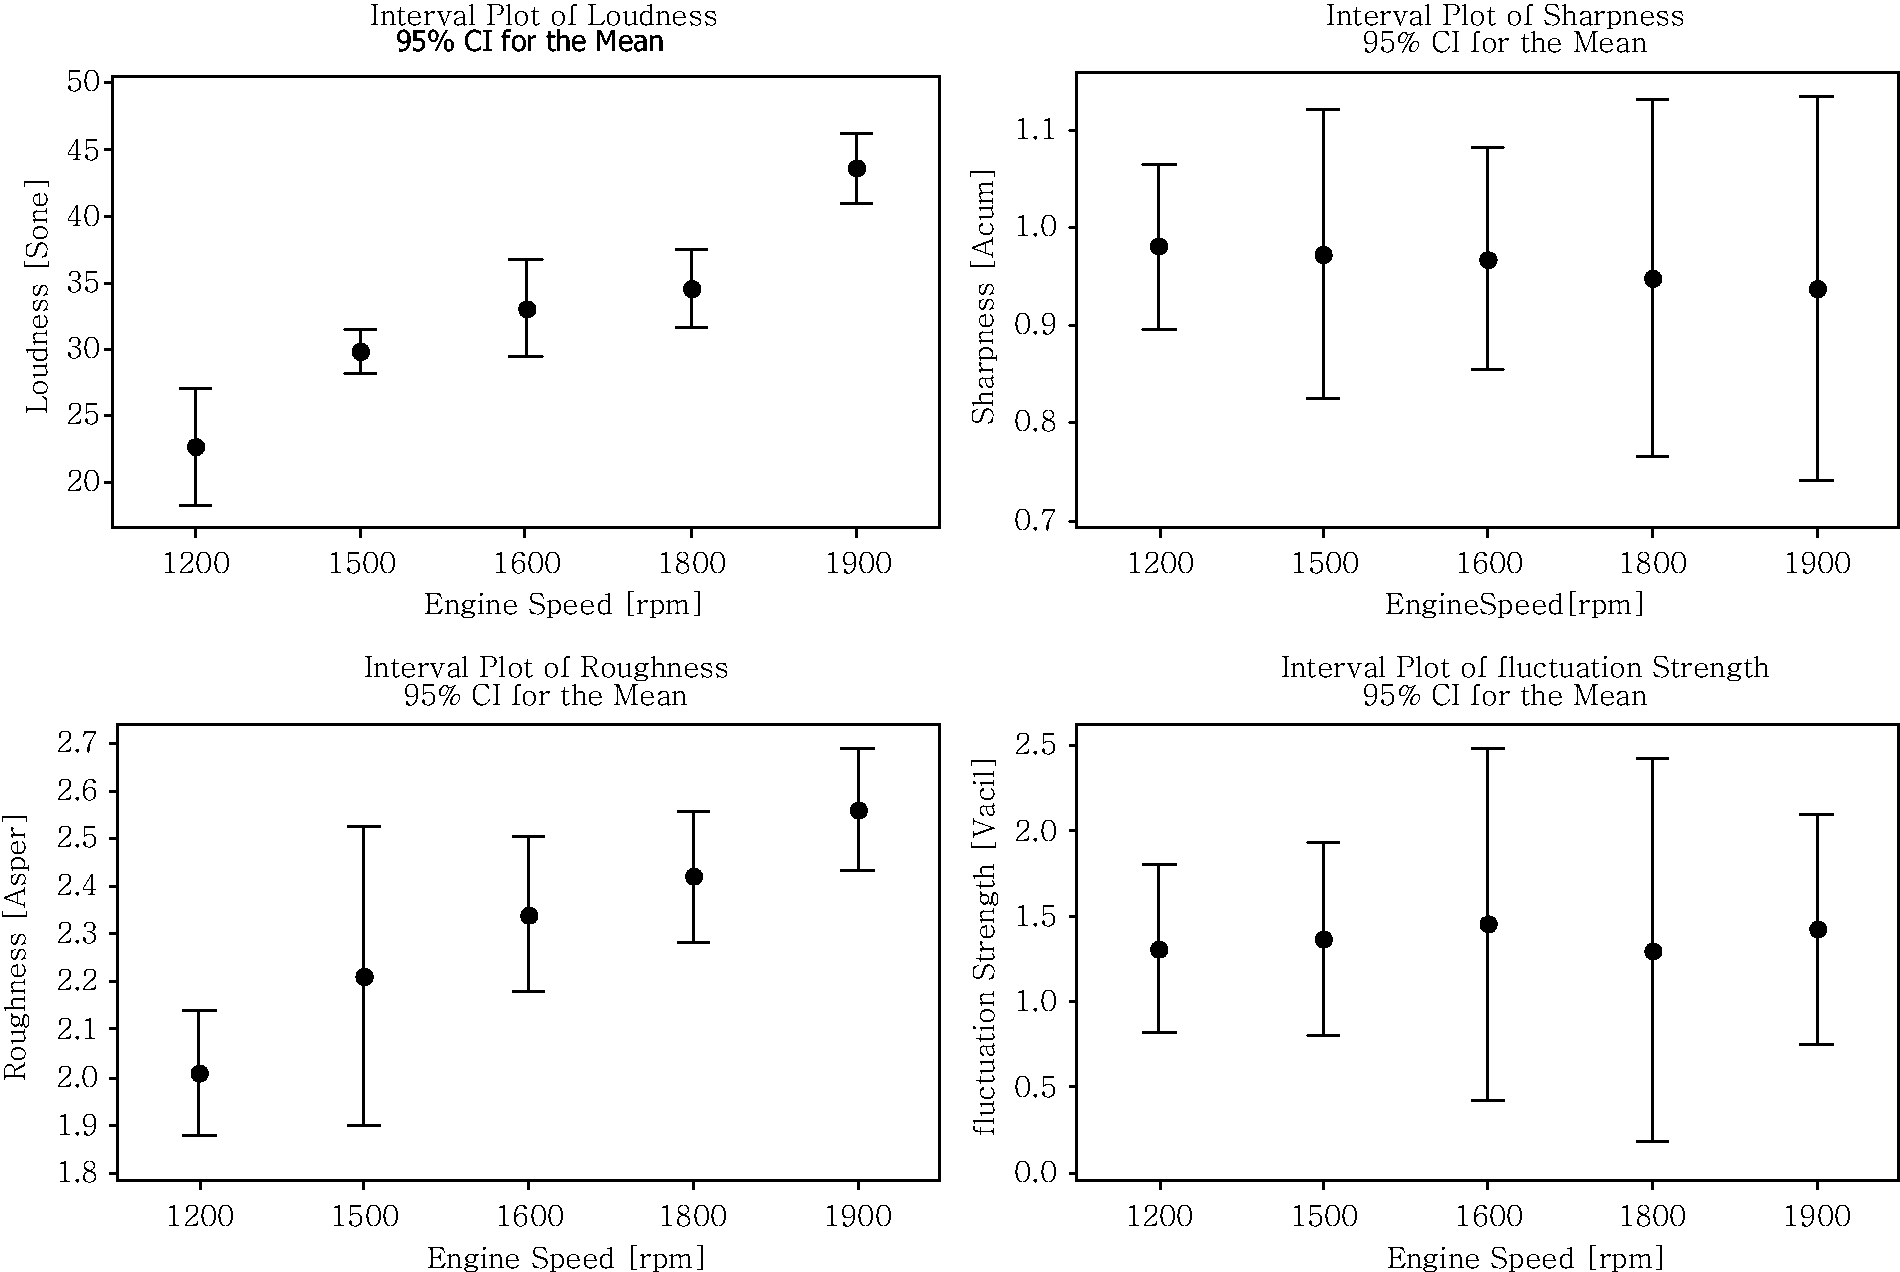
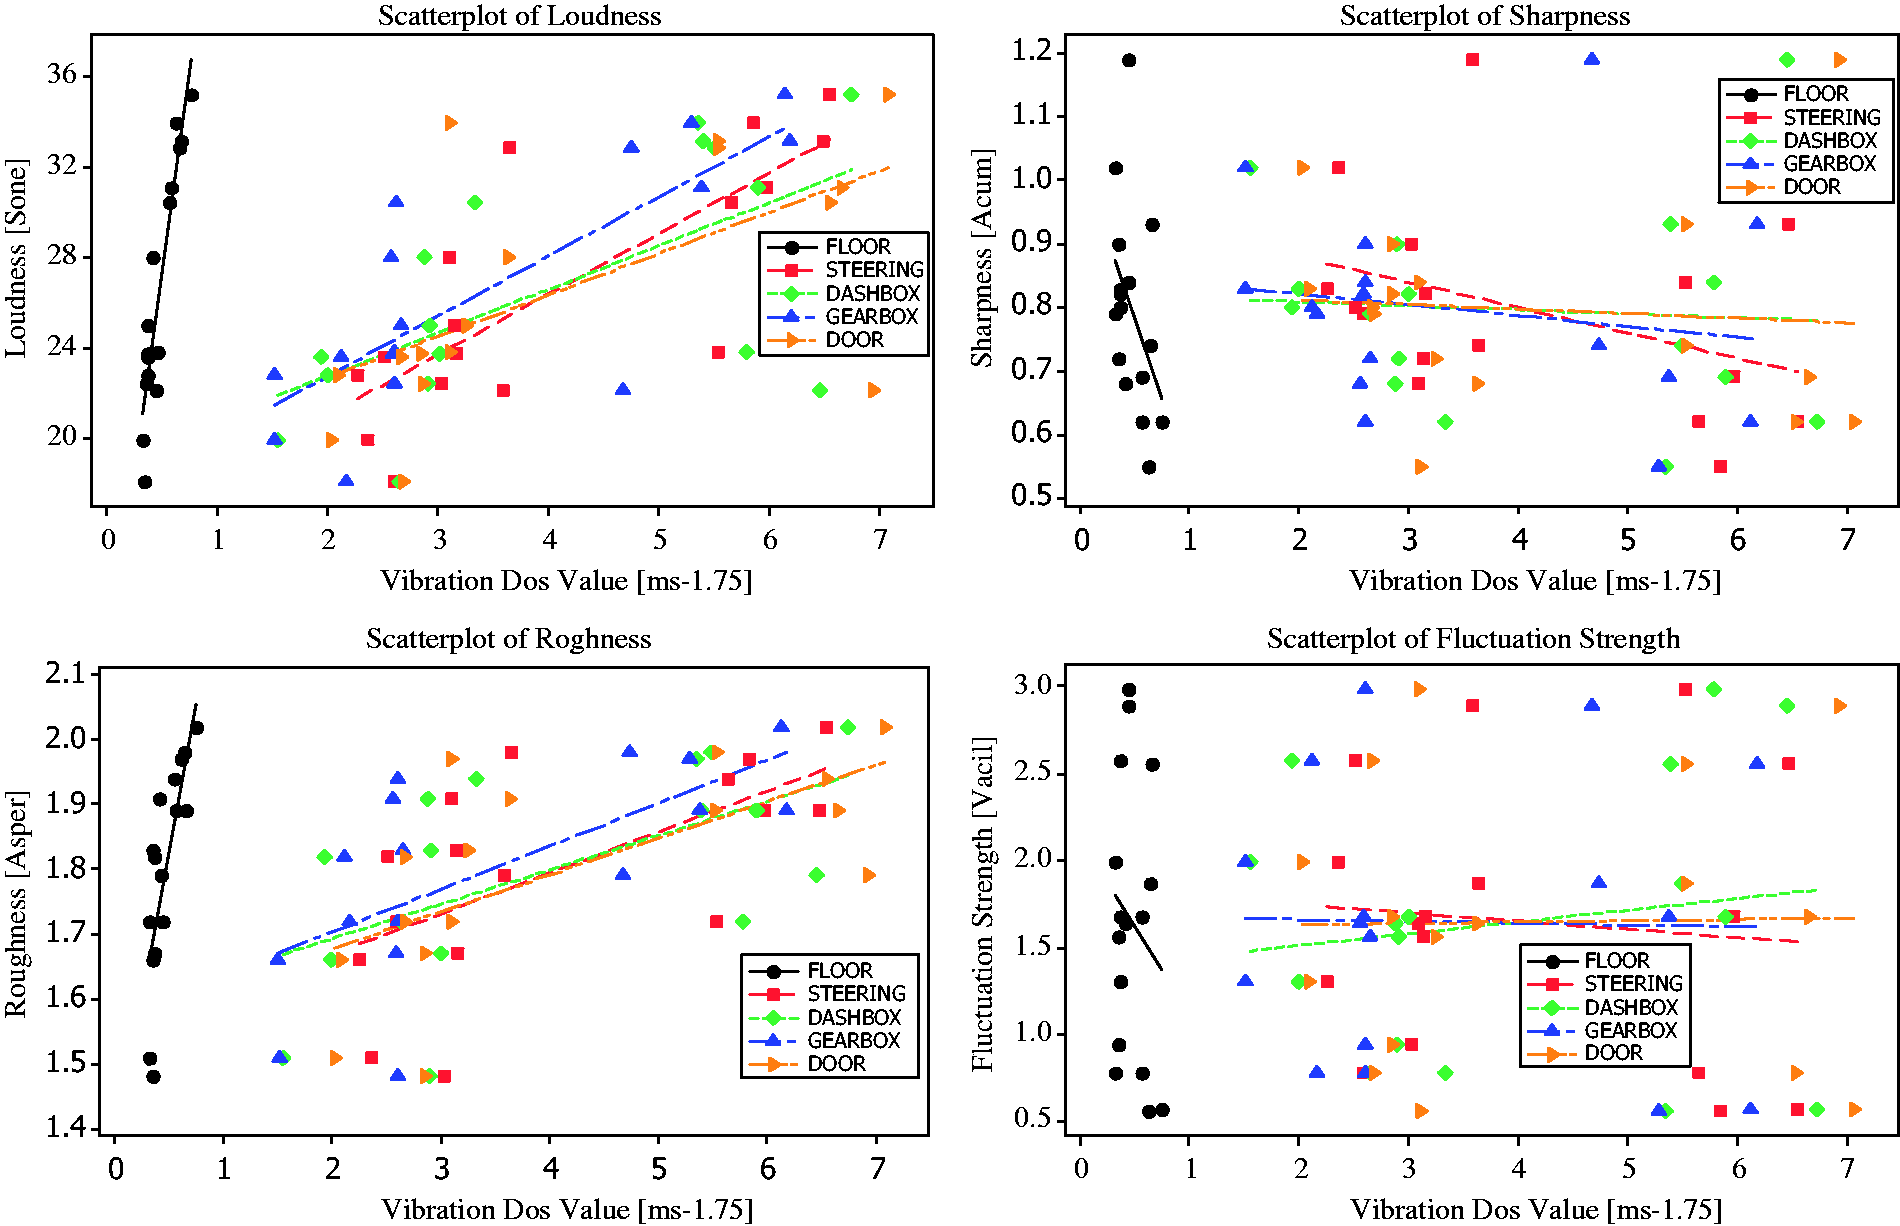
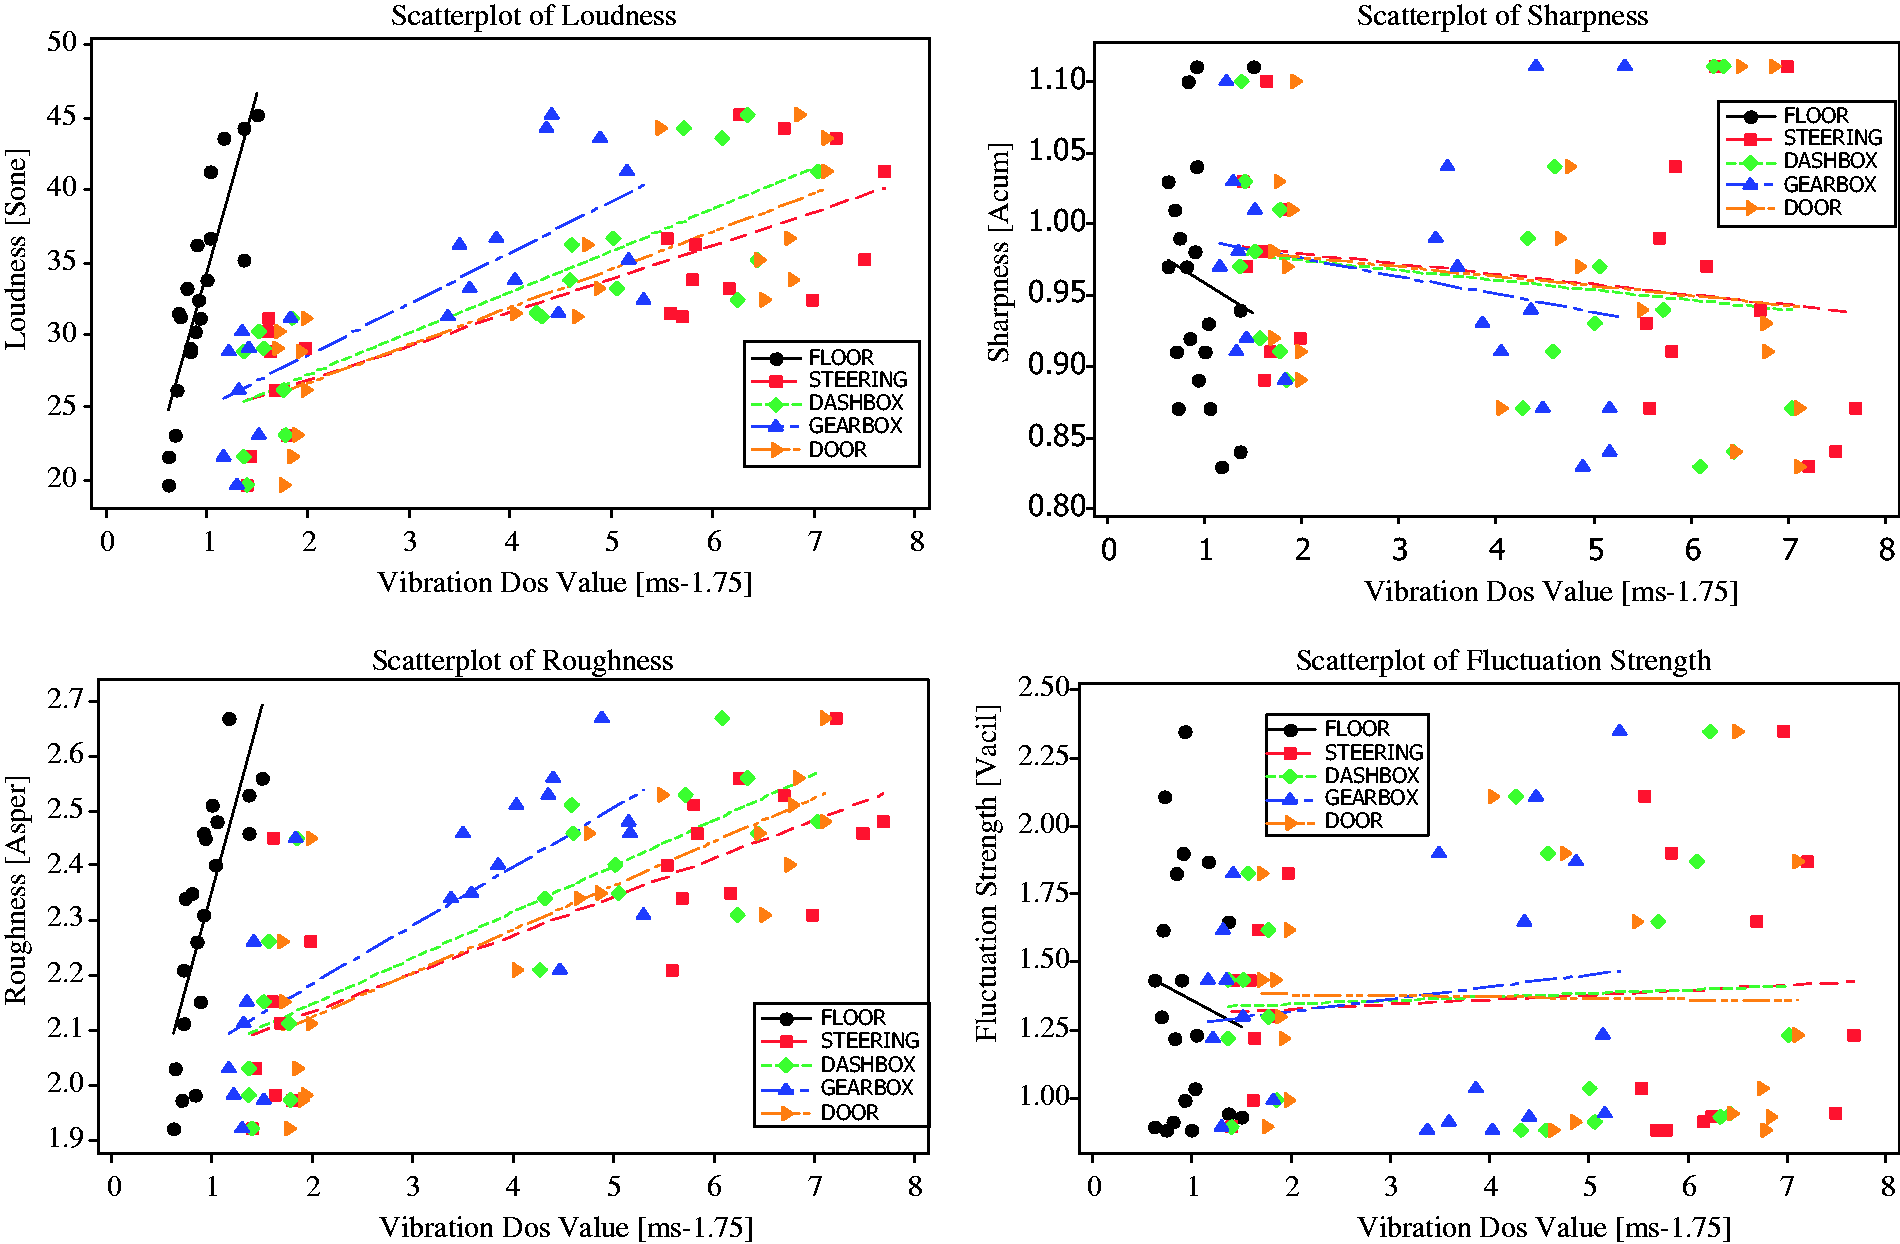
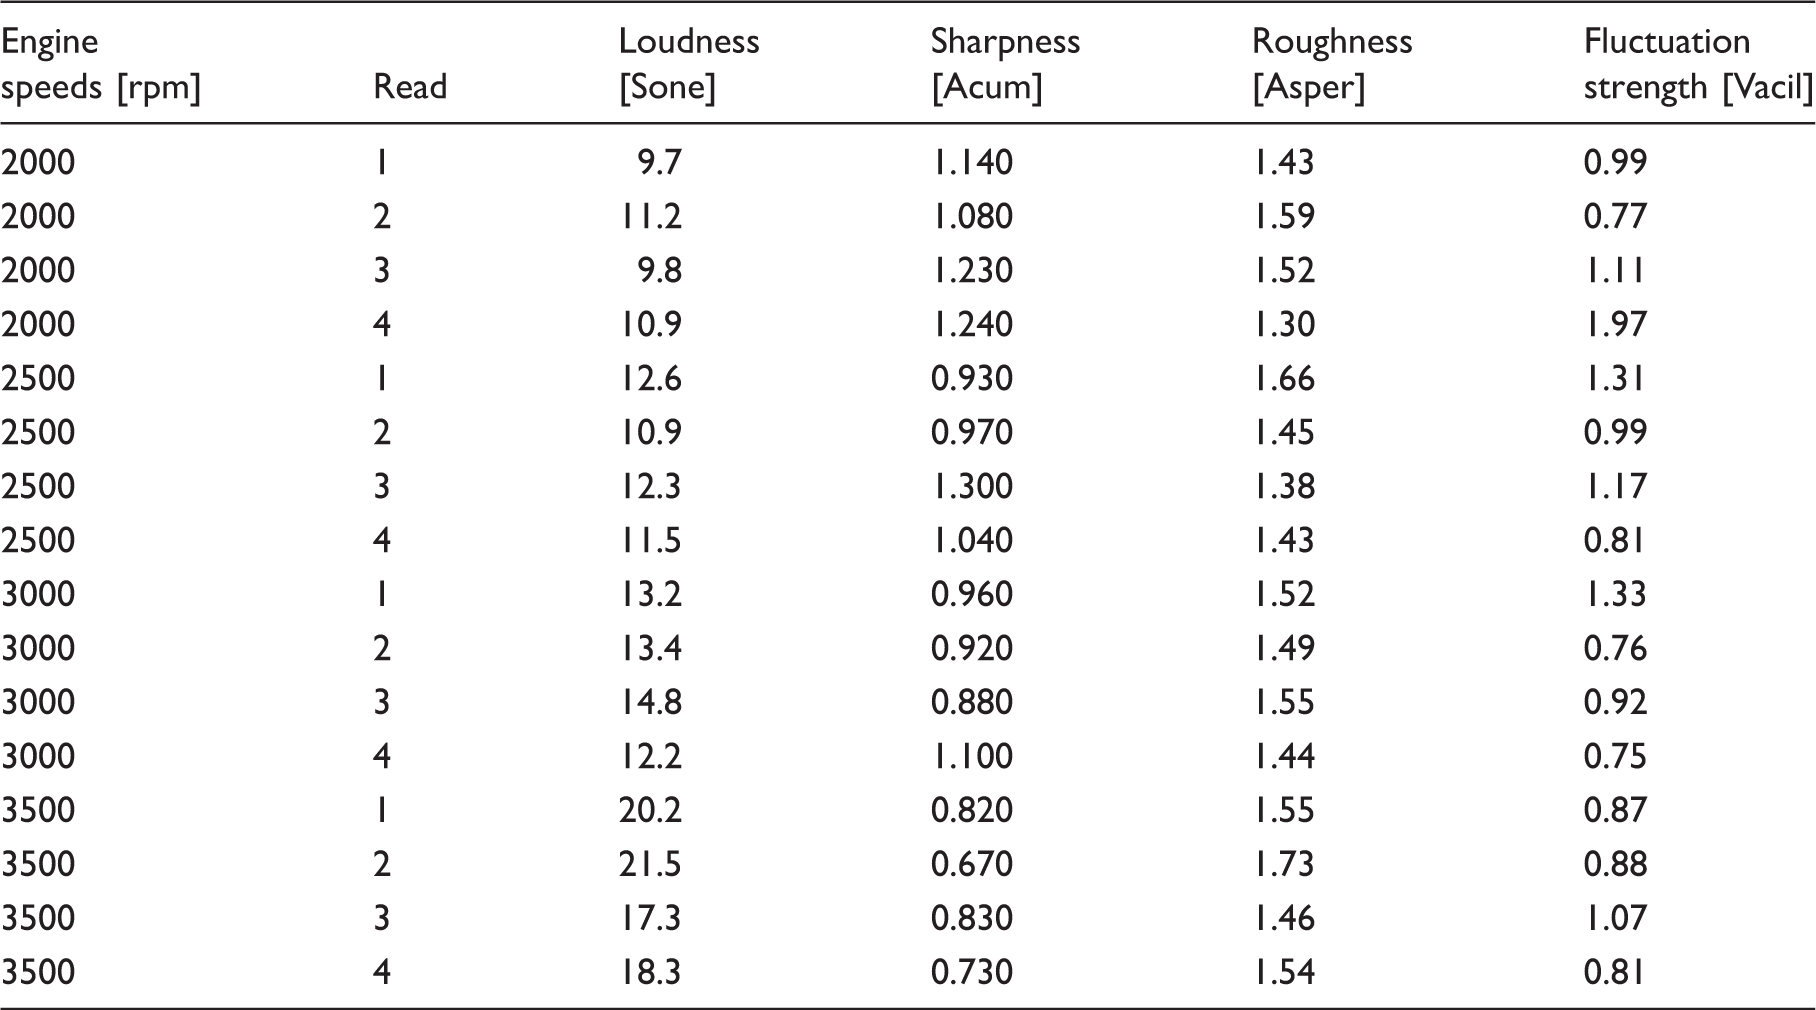
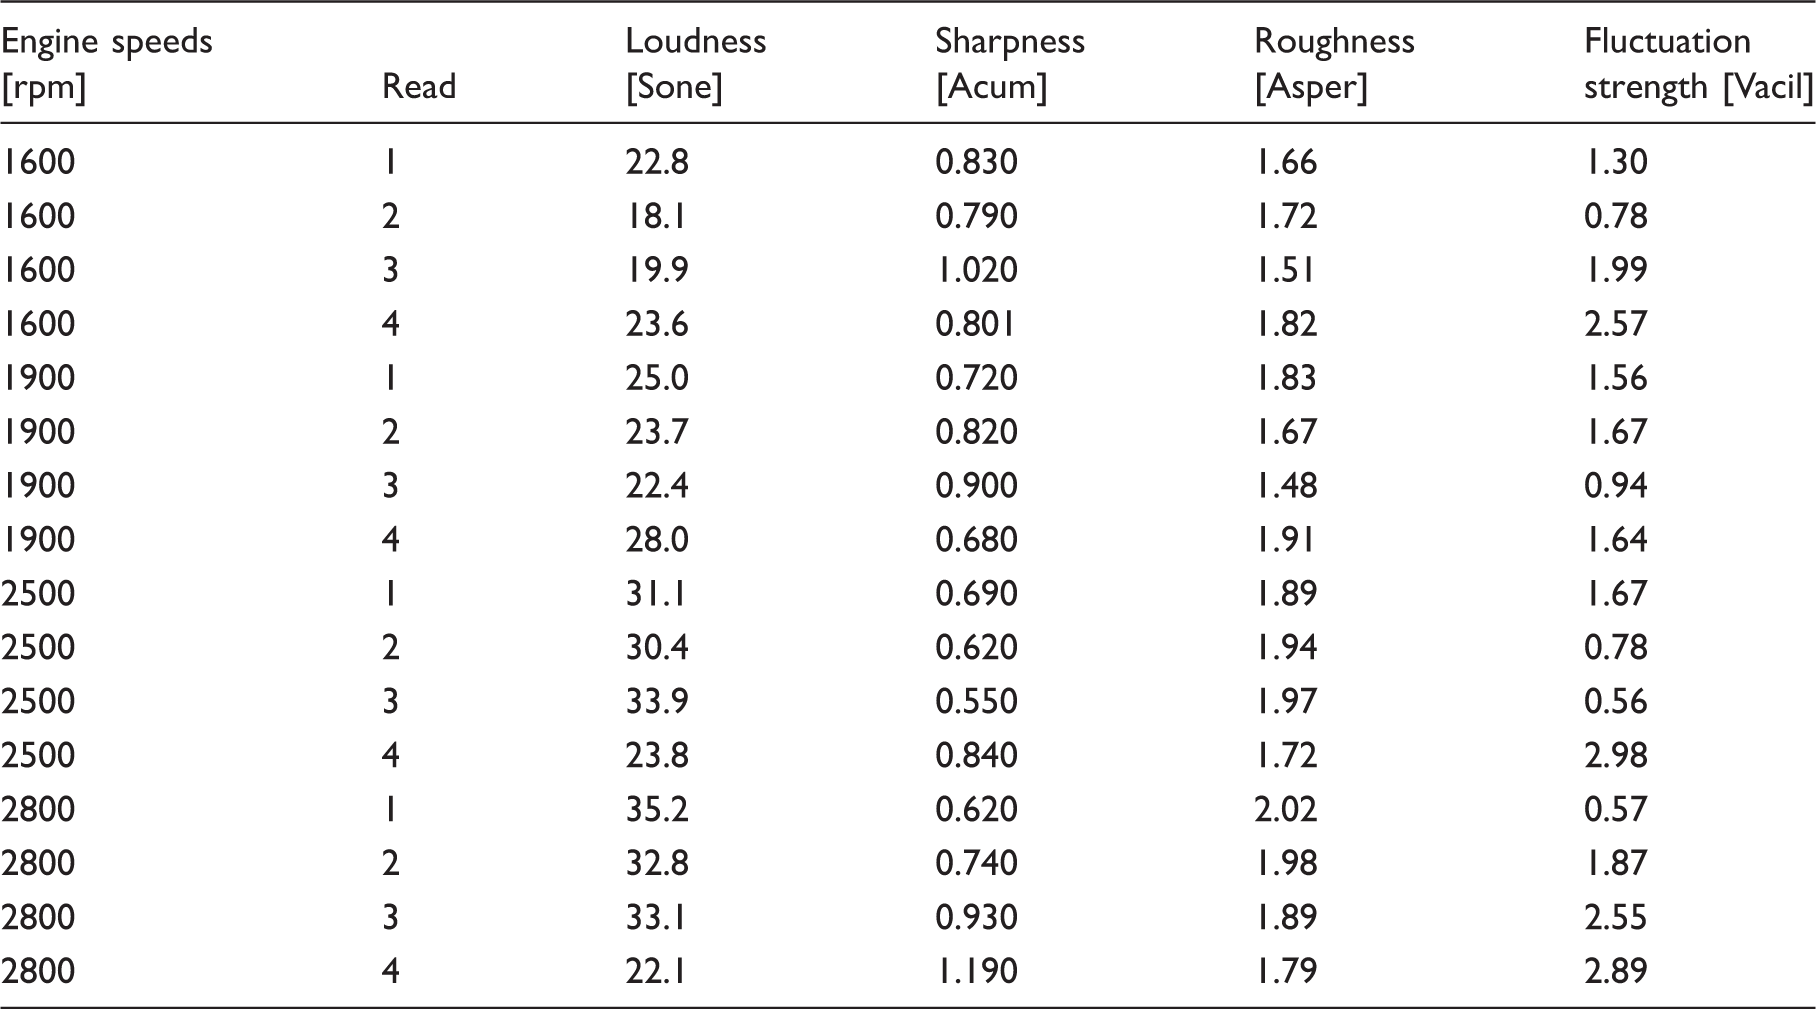
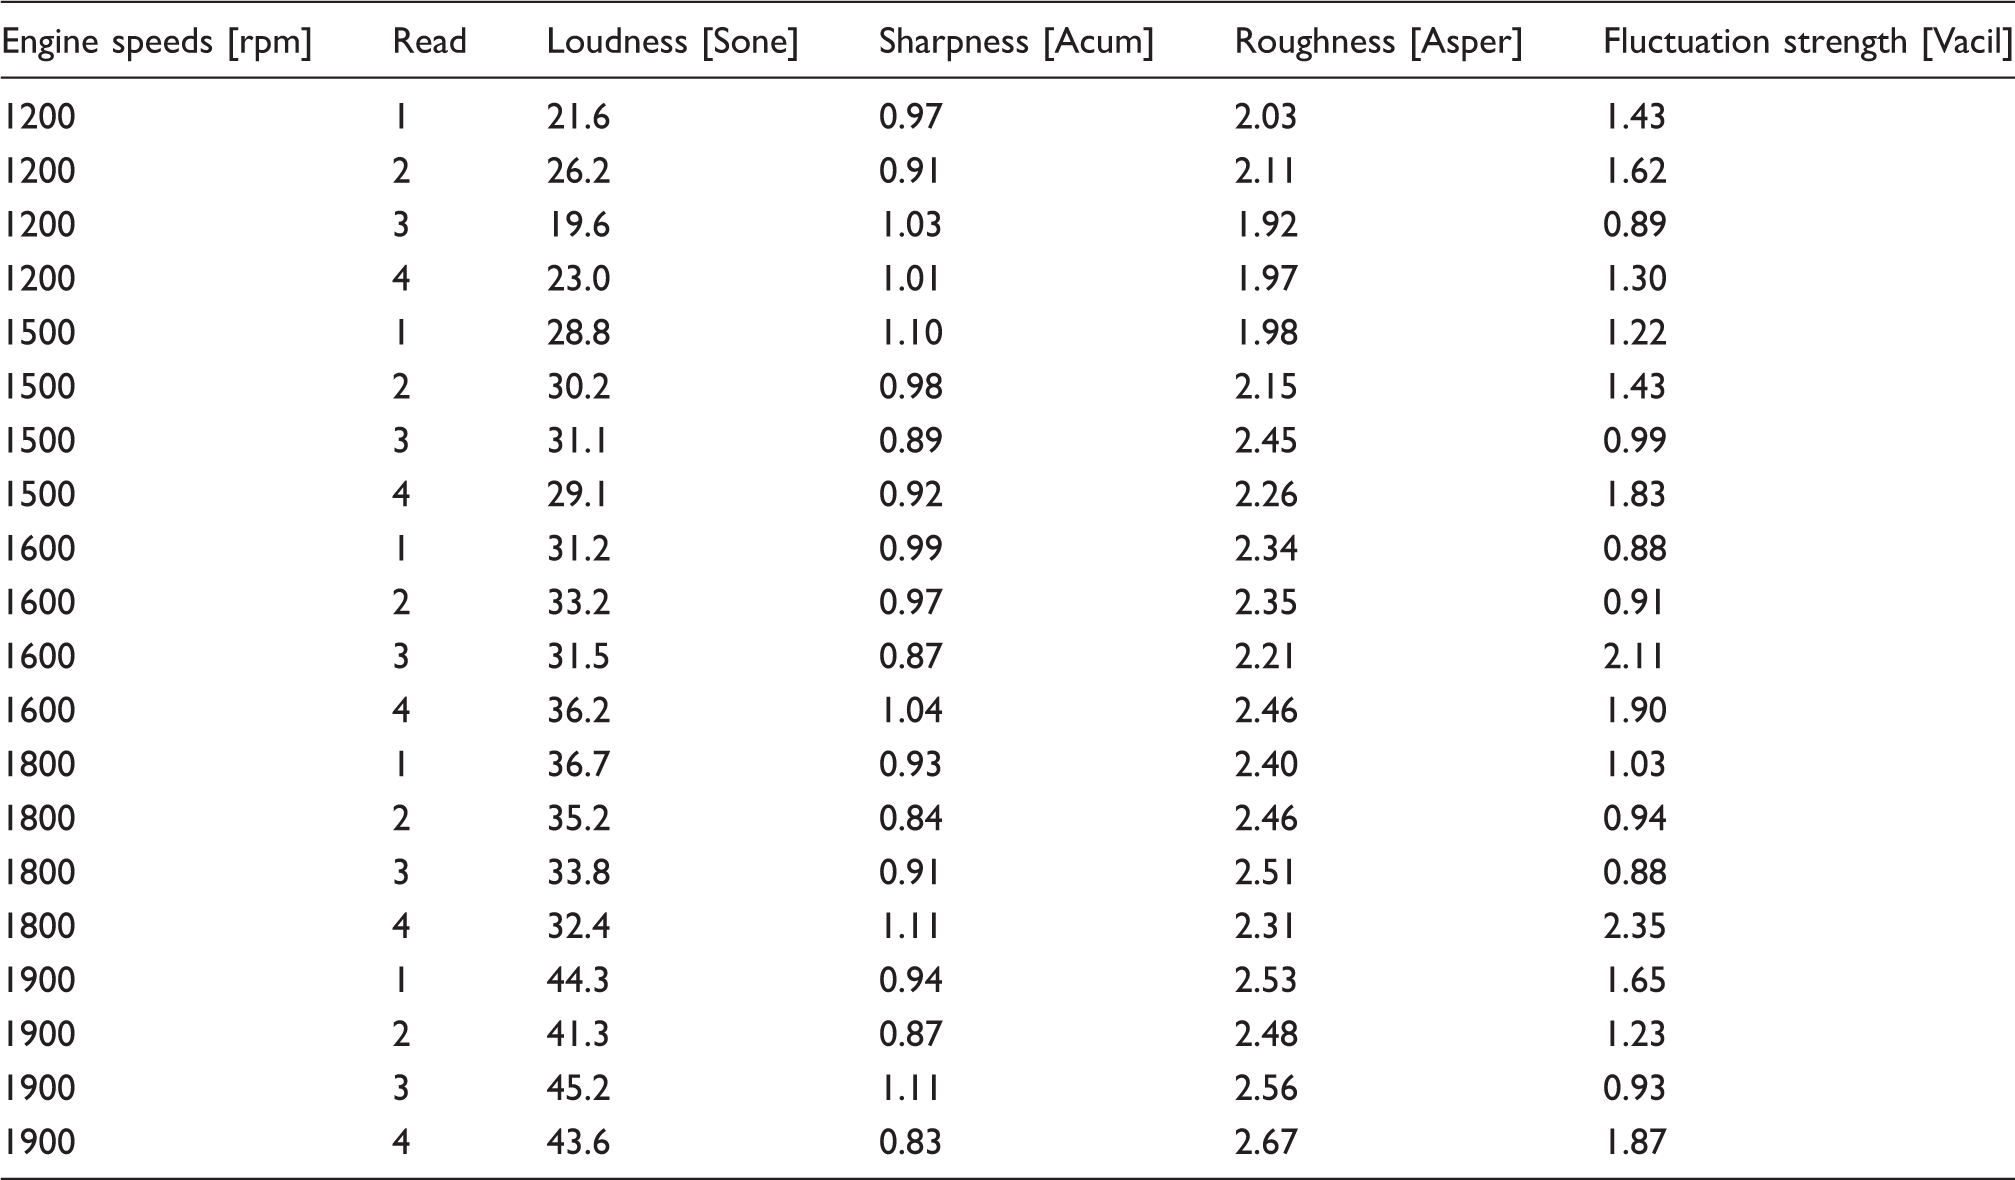
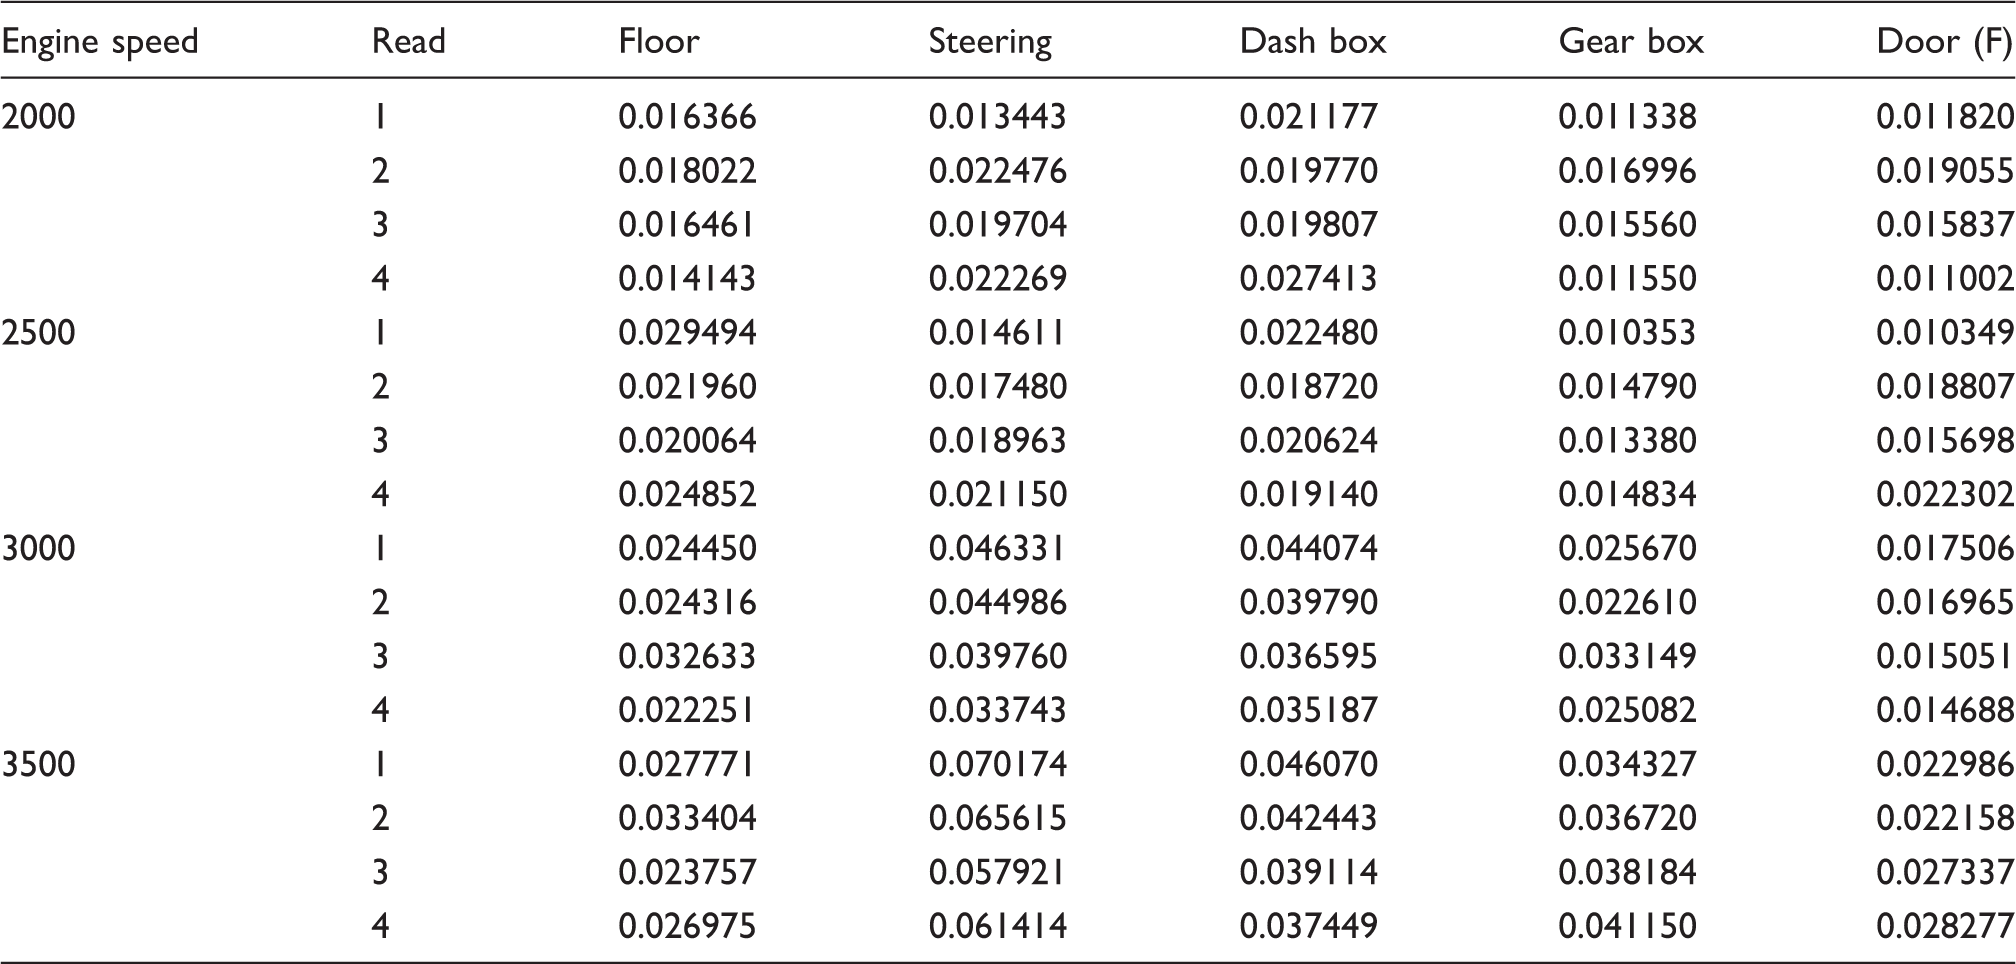
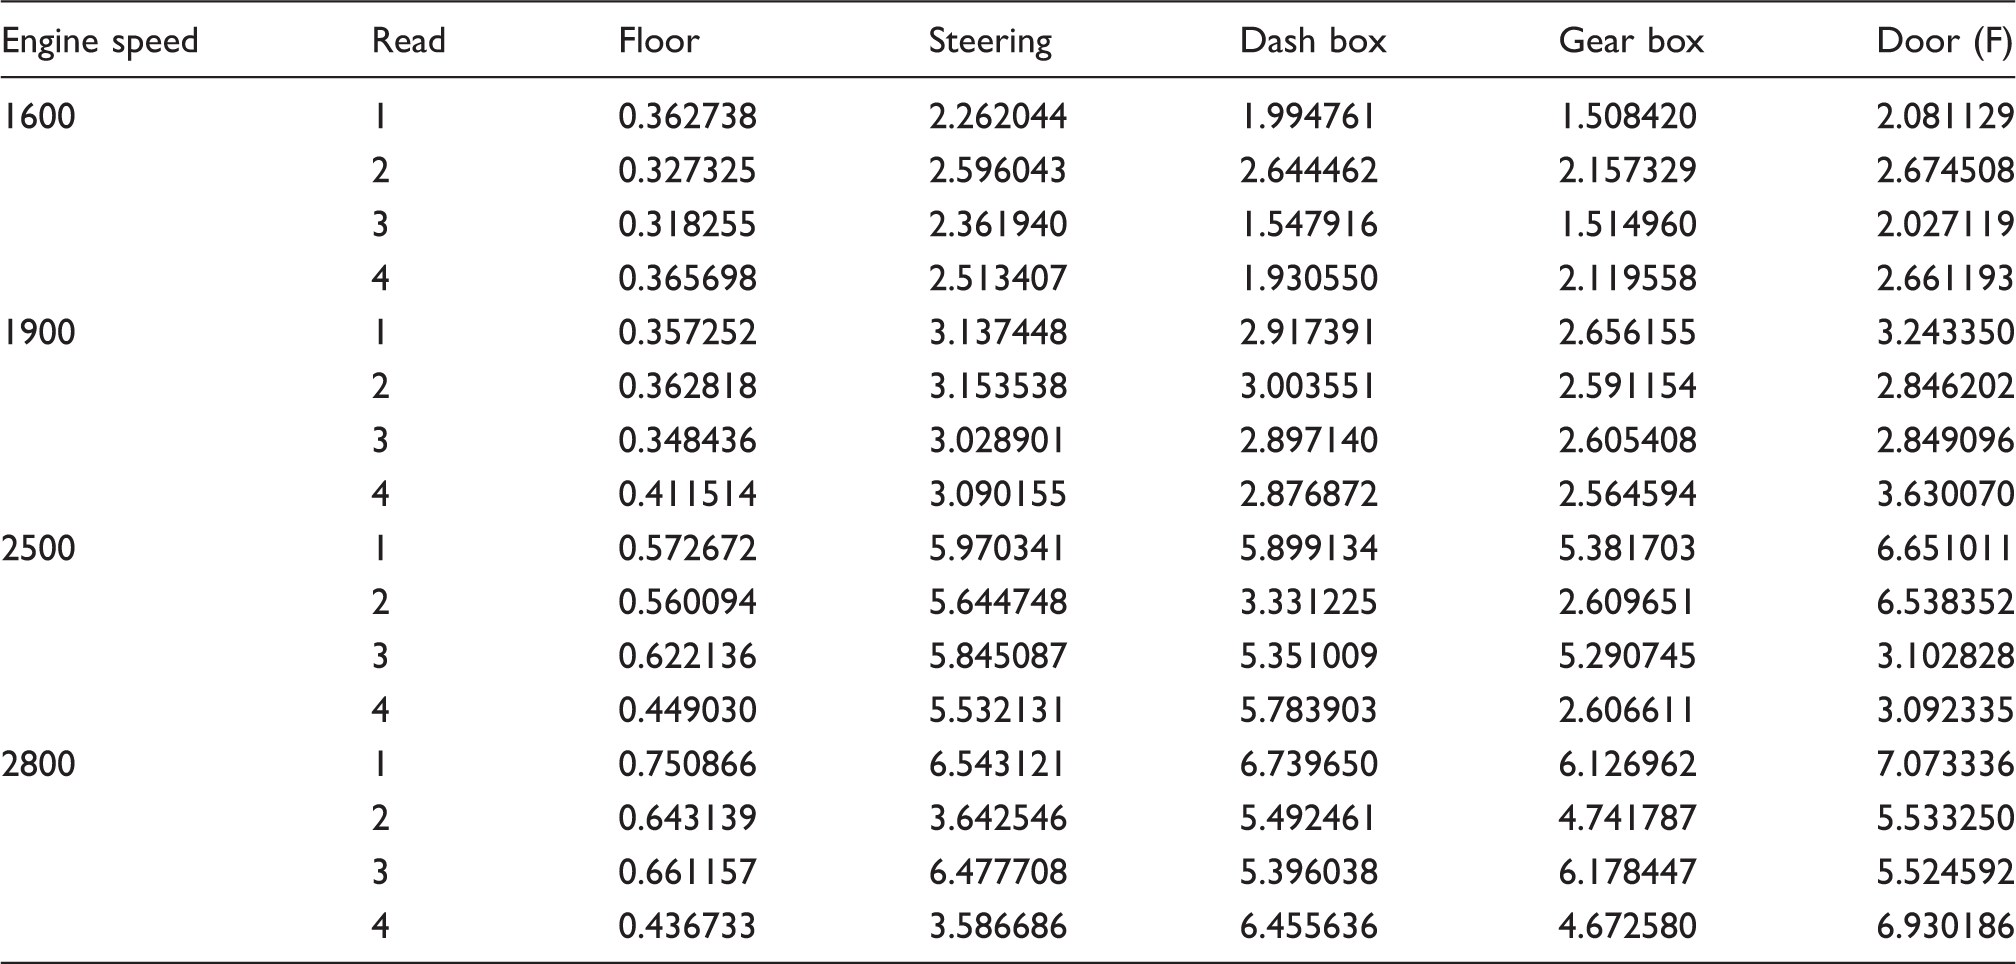
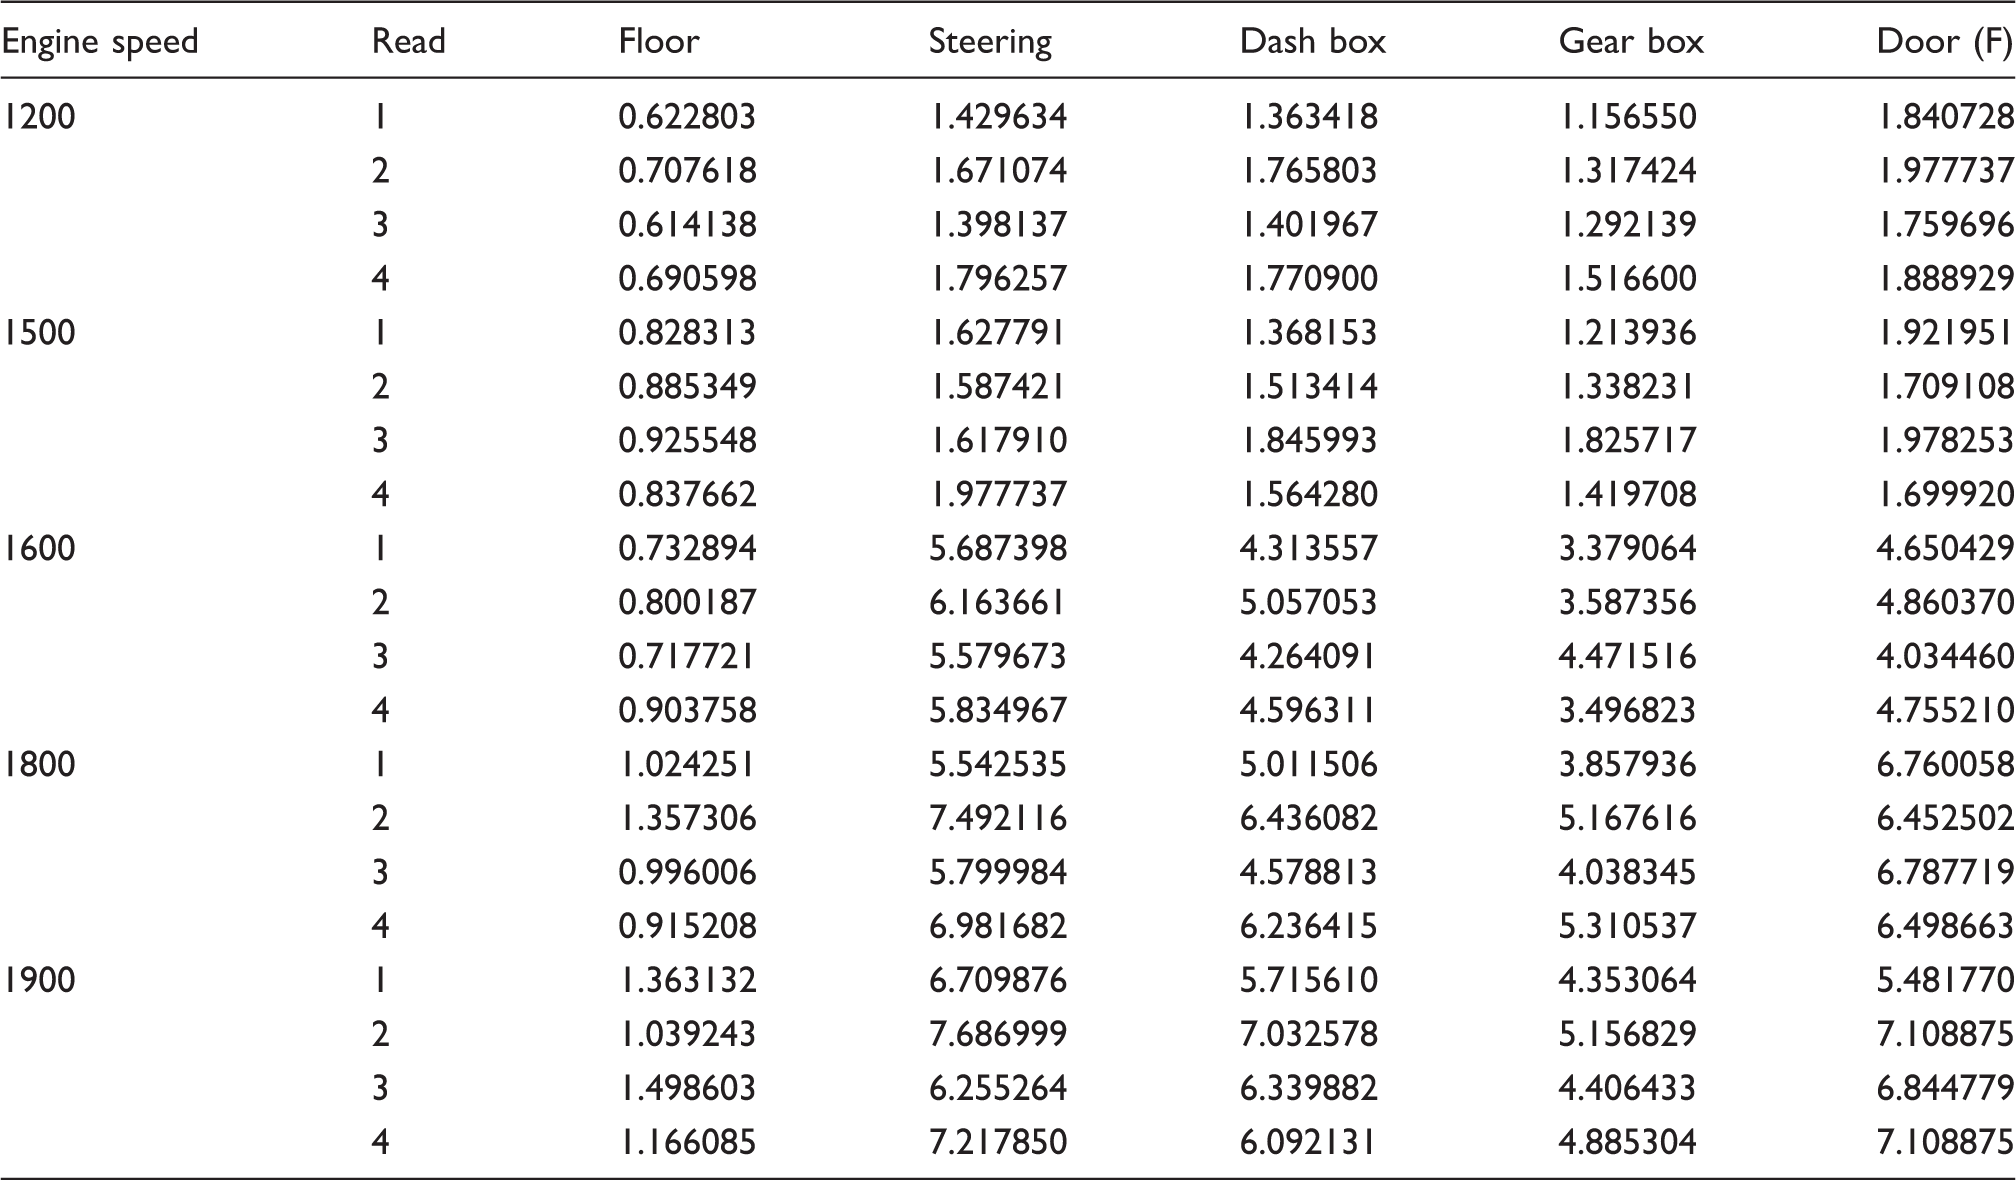
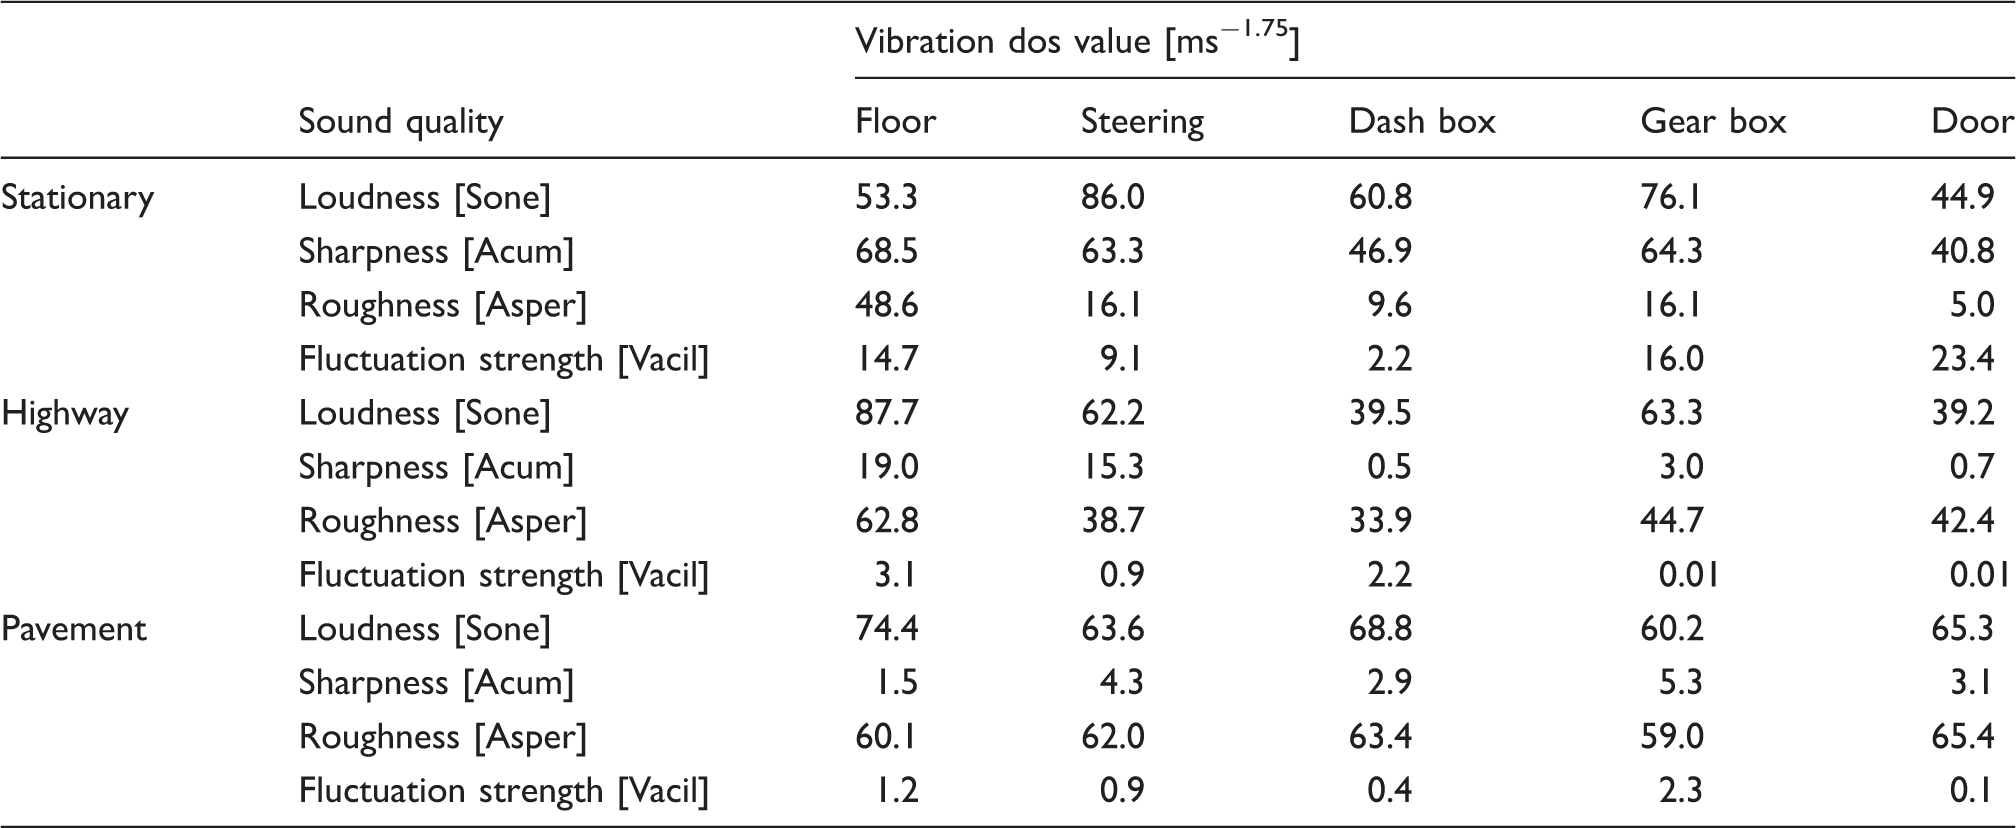
The parameters of each sound quality obtained from measured sounds are displayed in Table 4 (stationary), Table 5 (highway) and Table 6 (pavement). Based on the results from Tables 4–6, a graphical summary is displayed of the distribution of the parameters of the sound quality using the interval plot by showing their tendency and variability. The plotted interval plot graphs are shown in Figure 7 (being stationary), Figure 8 (for the highway) and Figure 9 (for the pavement). From the observation through Figures 7–9 it was found that the value of loudness’s parameters corresponds with the increase in engine speeds. By contrast, the value of sharpness parameters decreases with the increase of the rpm engine. However there is no particular trend towards the changes for both the roughness and fluctuation strengths against the engine speeds. Tables 7–9 show the VDV values that are obtained from the measured exposed vibration at the car floor and other parts. The tables are formed to observe the correlations that exist between the level of vibration and engine speed. Meanwhile, these tables were plotted to show the trend pattern of the generated sound quality against the exposed vibration (Figures 10–12).
The changes trend of sound quality’s parameter against the exposed vibration at stationary condition. The changes trend of sound quality’s parameter against the exposed vibration on the highway road. The changes trend of sound quality’s parameter against the exposed vibration on the pavement road. The values of sound quality parameter from measured sounds in the stationary condition. The values of sound quality parameter from measured sounds on the highway road. The values of sound quality parameter from measured sounds on the pavement road. The values of vibration dose value at stationary condition. The values of vibration dose value on the highway road. The values of vibration dose value on the pavement road.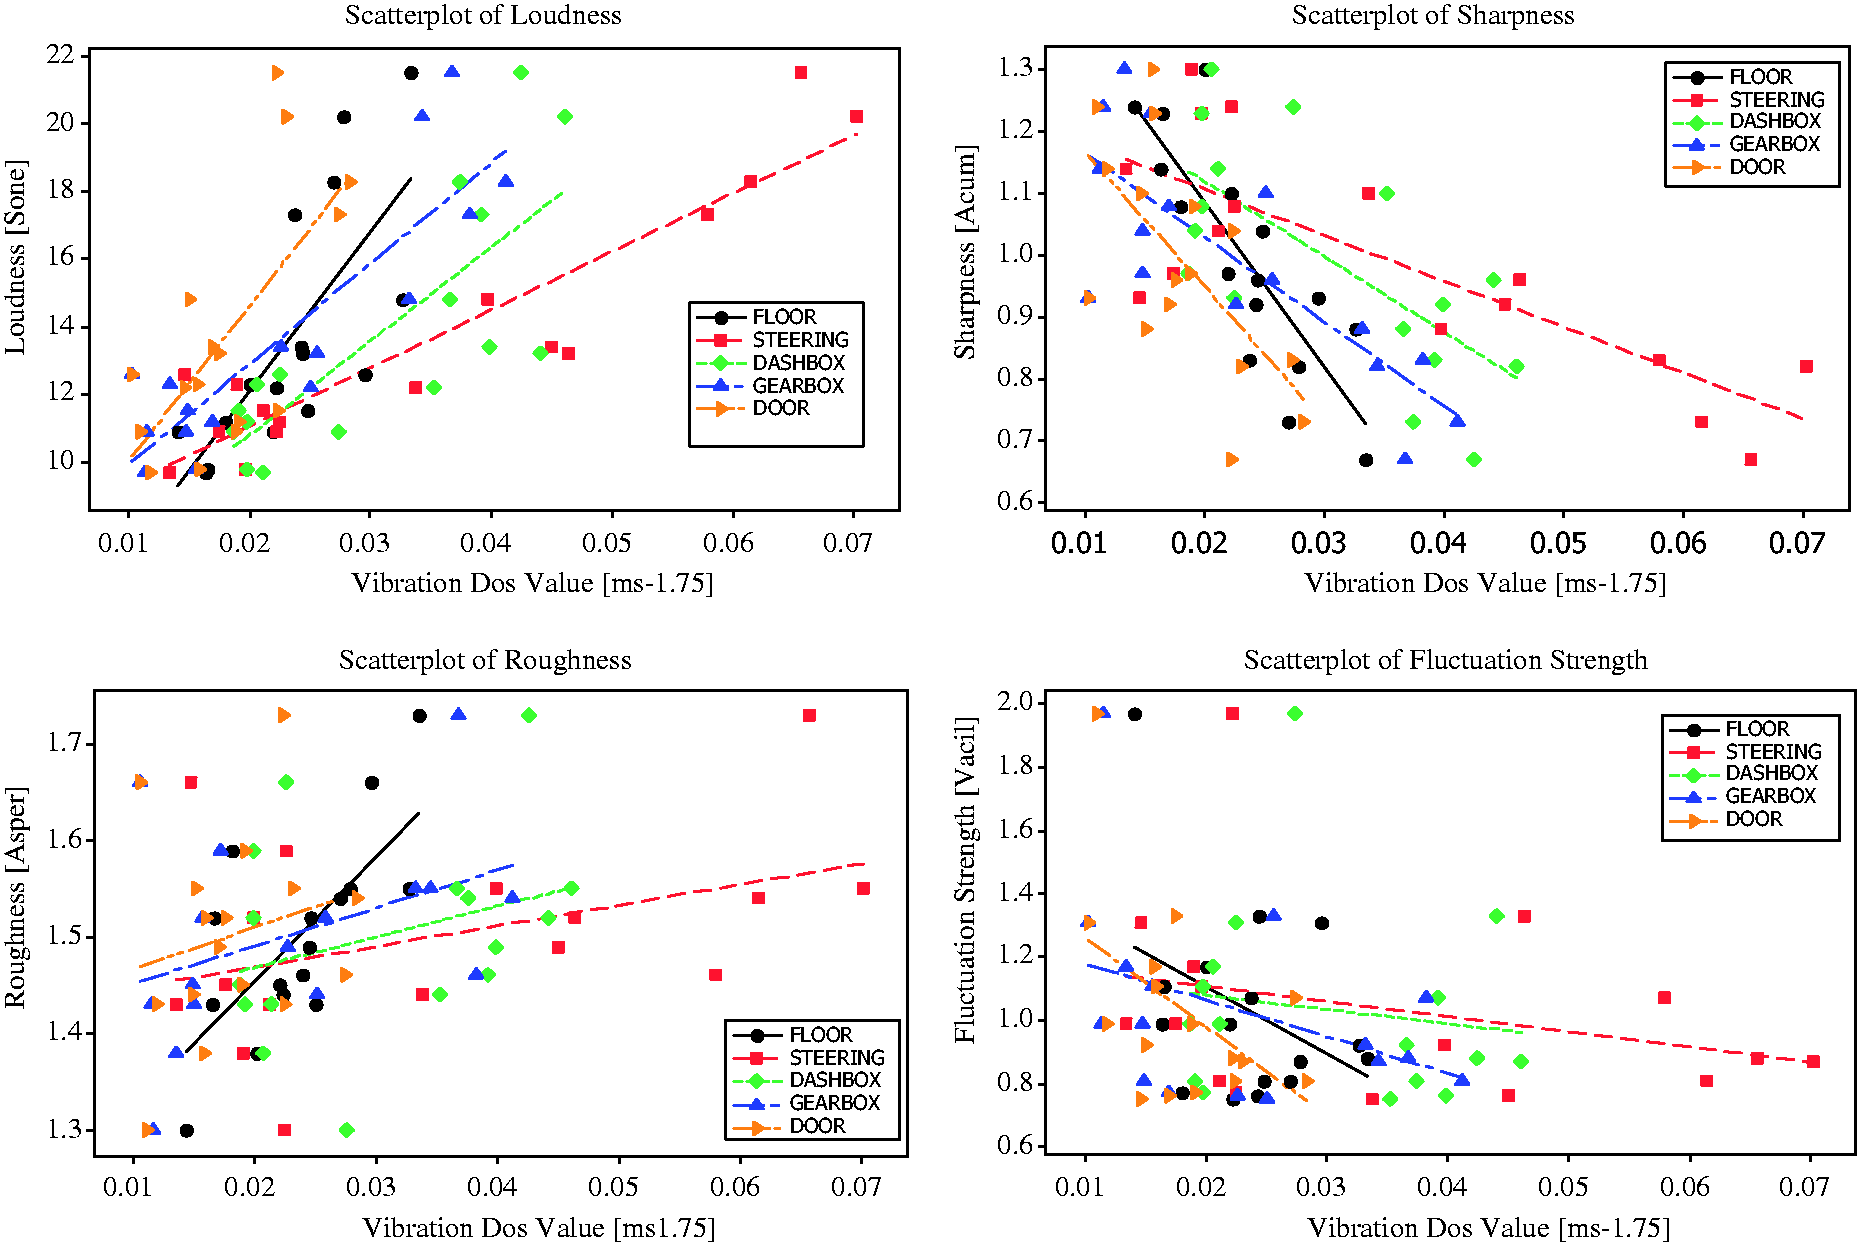
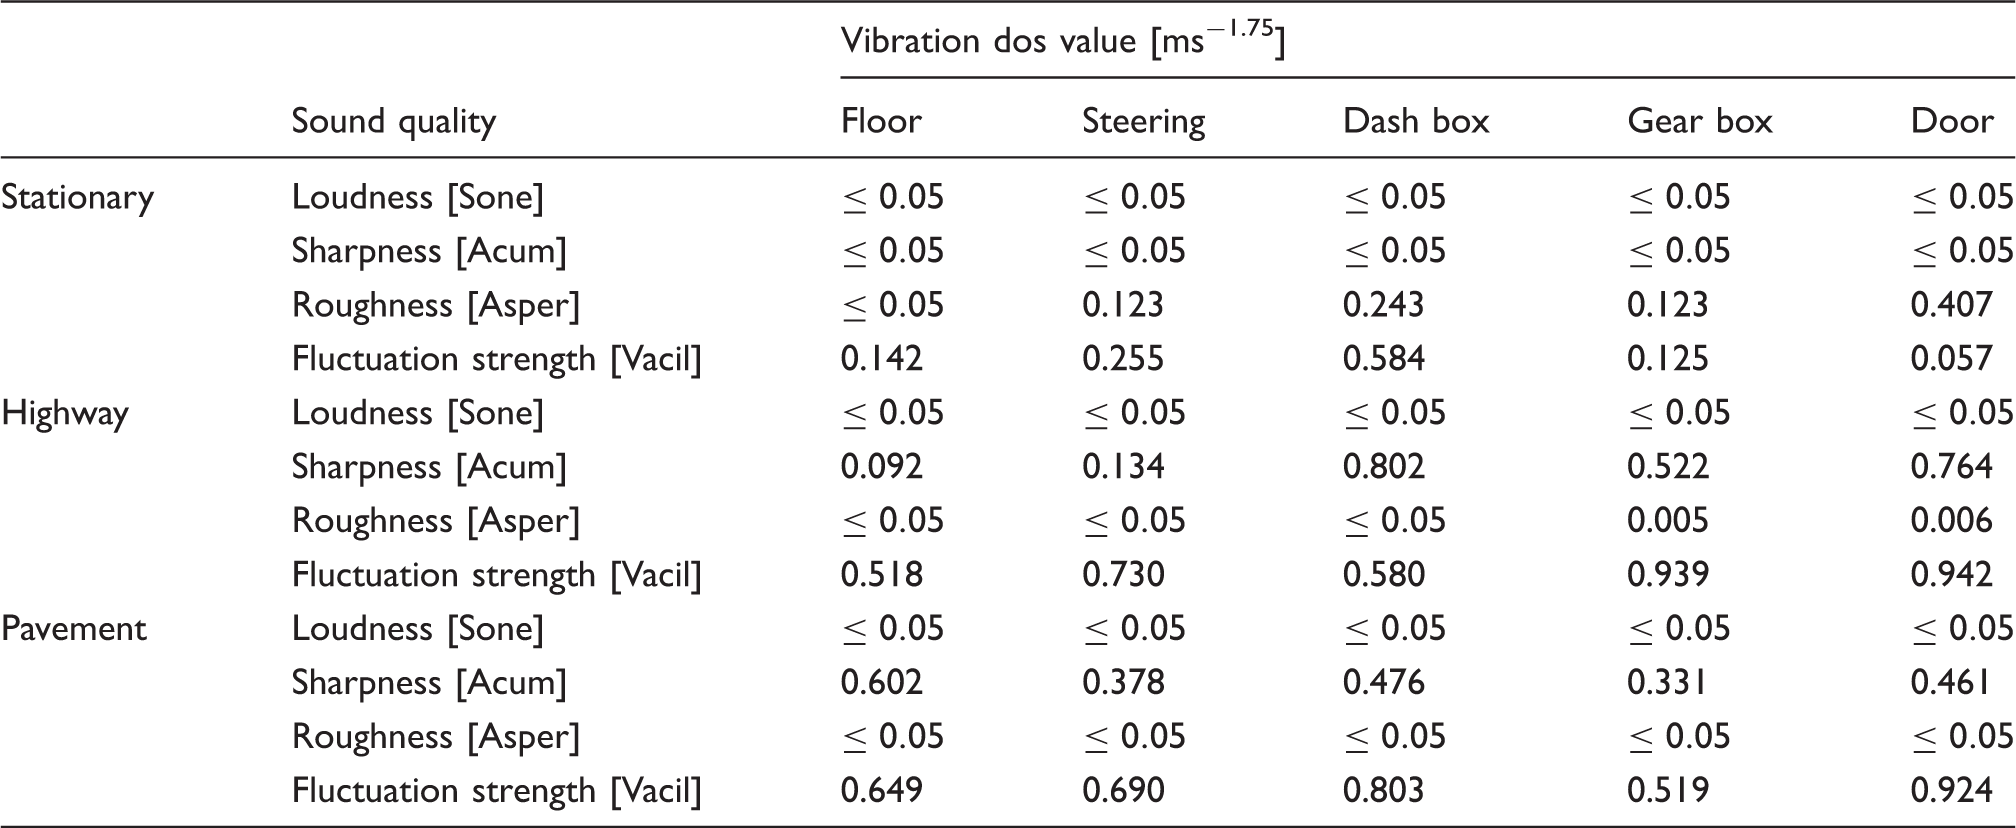
After performing the regression analysis, the trend patterns of the correlation between the particular sound quality’s parameter and exposed vibration at particular points or areas in the cabin were observed. Later, the parameters of sound quality and the parts/locations that have a significant correlation between both of the elements were chosen. In our case they must fulfill both of the criteria below in order to be selected as the model’s variable from the data. Those criteria are:
The regression (r-square) value must be larger than 50% The p-value must be below than 0.05
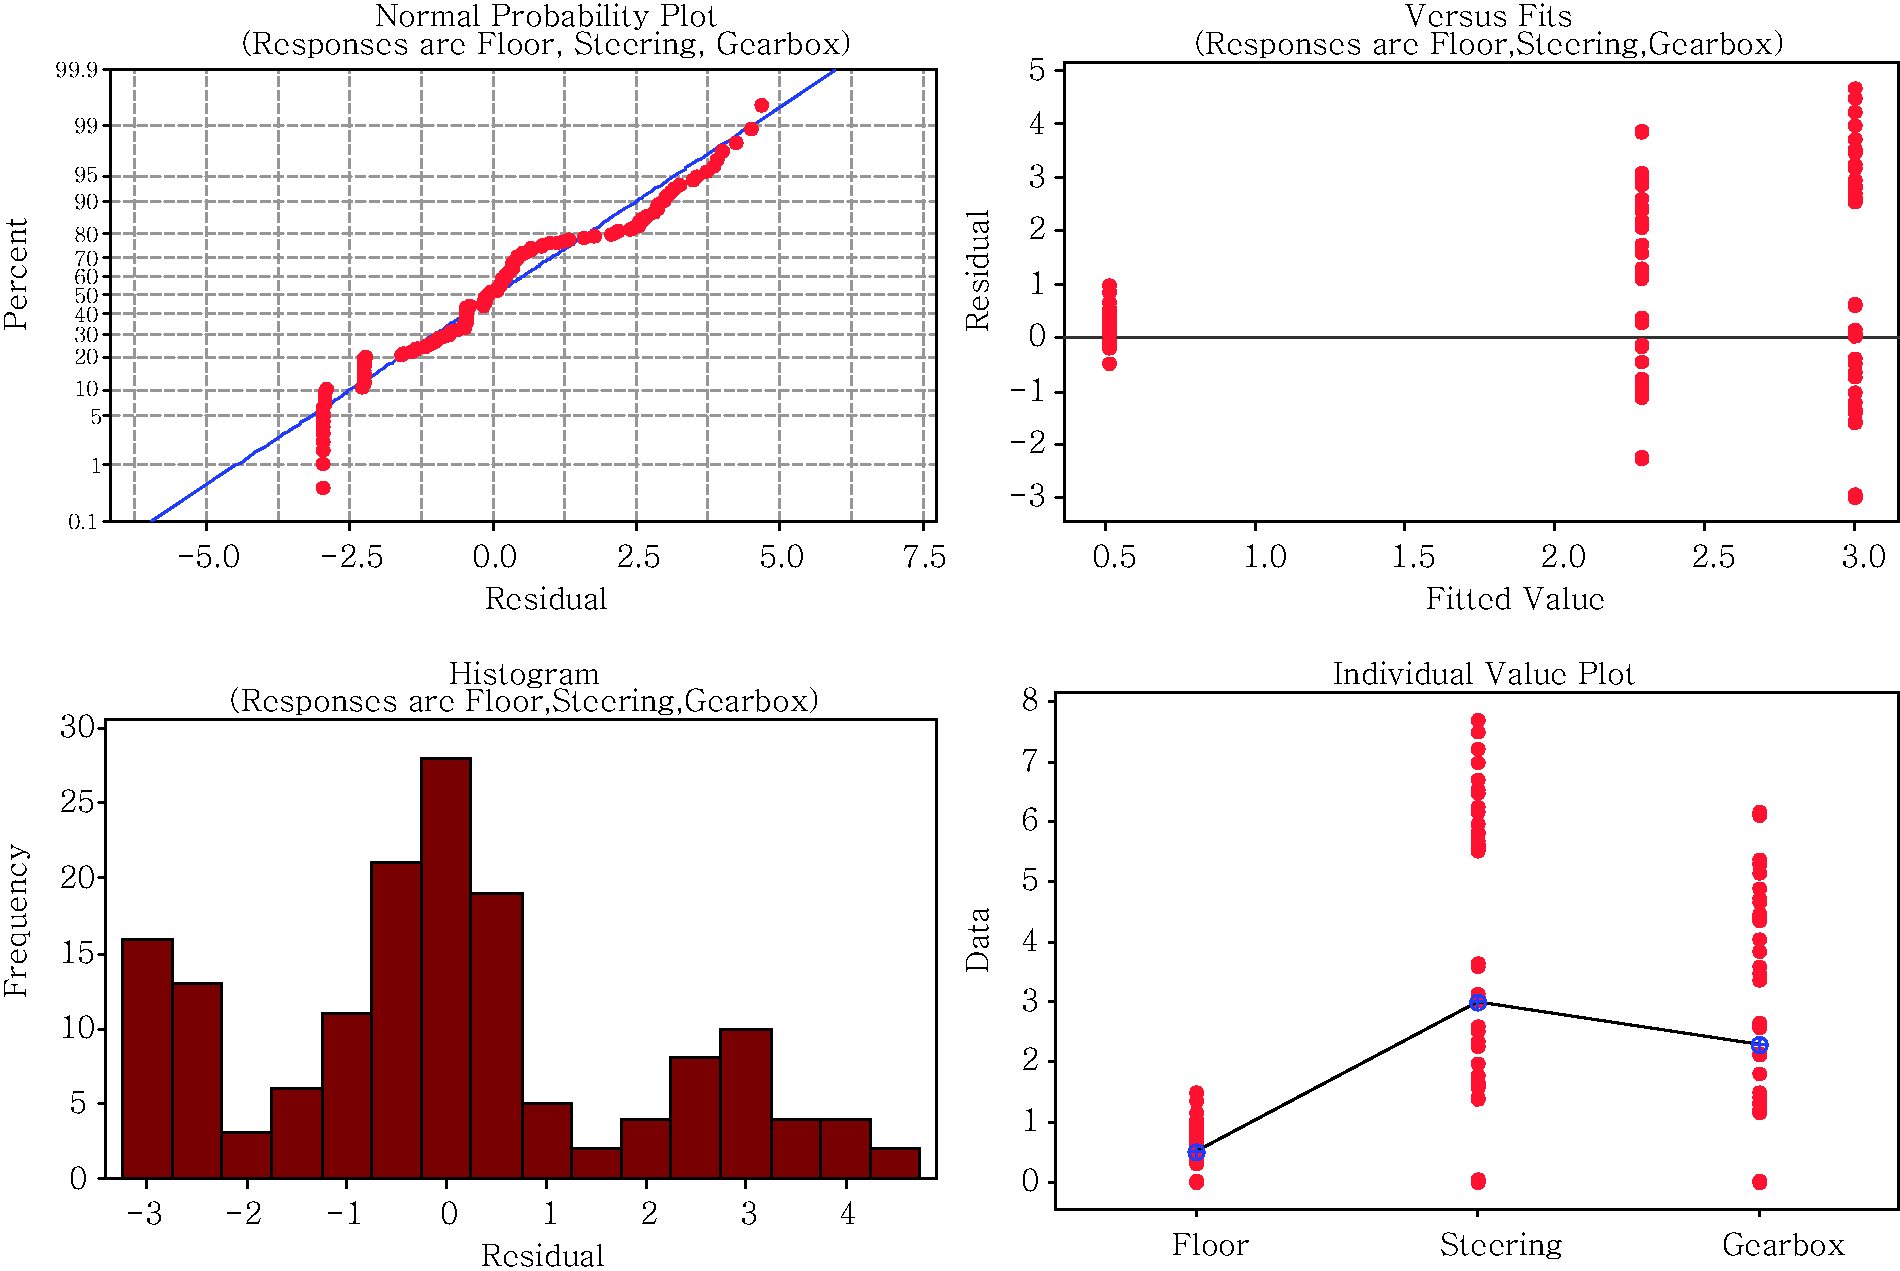
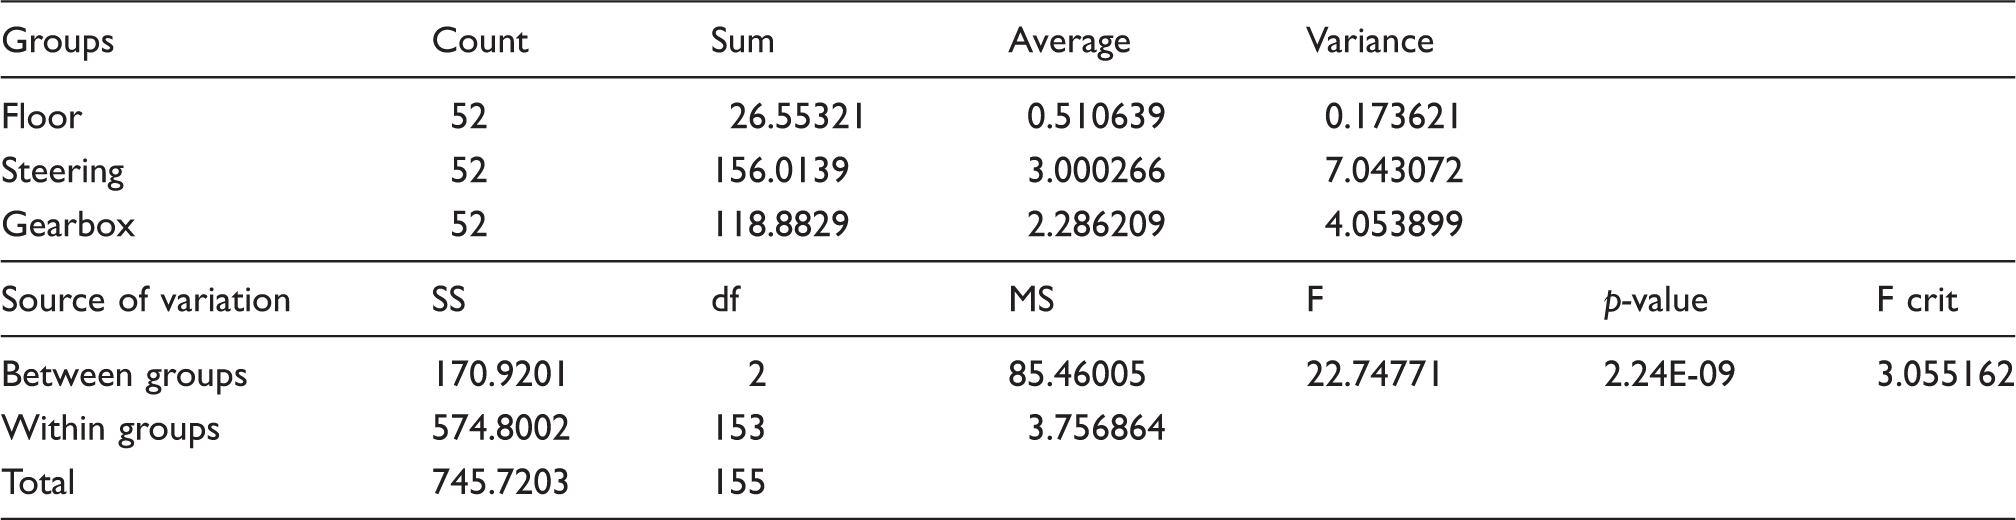
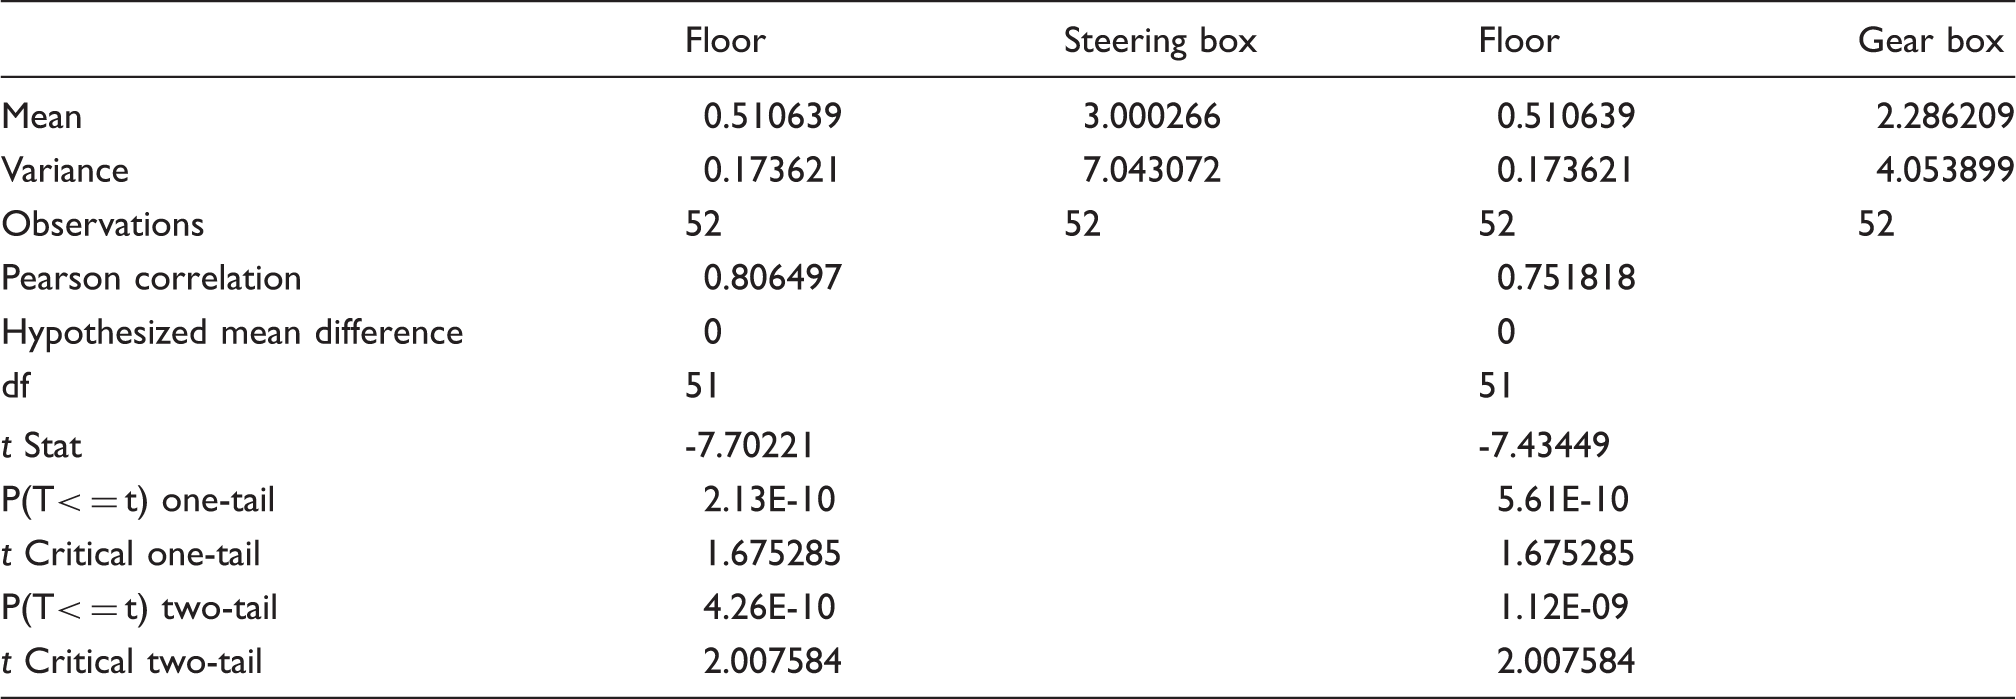
According to the results that are obtained from Tables 10 and 11, the authors consider that the significant correlations that can be used in the model are the correlation between the loudness parameter and exposed vibration level at the floor, steering and gearbox (Figure 13). By looking at the results of the regression, ANOVA and t-test, it shows that the increase in engine speeds truly corresponds with the exposed vibration. Meanwhile, the main contributor of vibration among the investigated parts mainly comes from the steering box. This can be seen from Tables 12 and 13 and Figure 14.
The changes of the loudness parameter against the exposed vibration at each significant point. (a) Normal probability plot, (b) Versus fits, and (c) Histogram and individual value plot. The values of r-square from regression analysis. The p-values from regression analysis. Summary of one way analysis of variance (ANOVA) towards the vibrating parts. Summary of means of the comparison of vibration level through t-test at vibrating parts.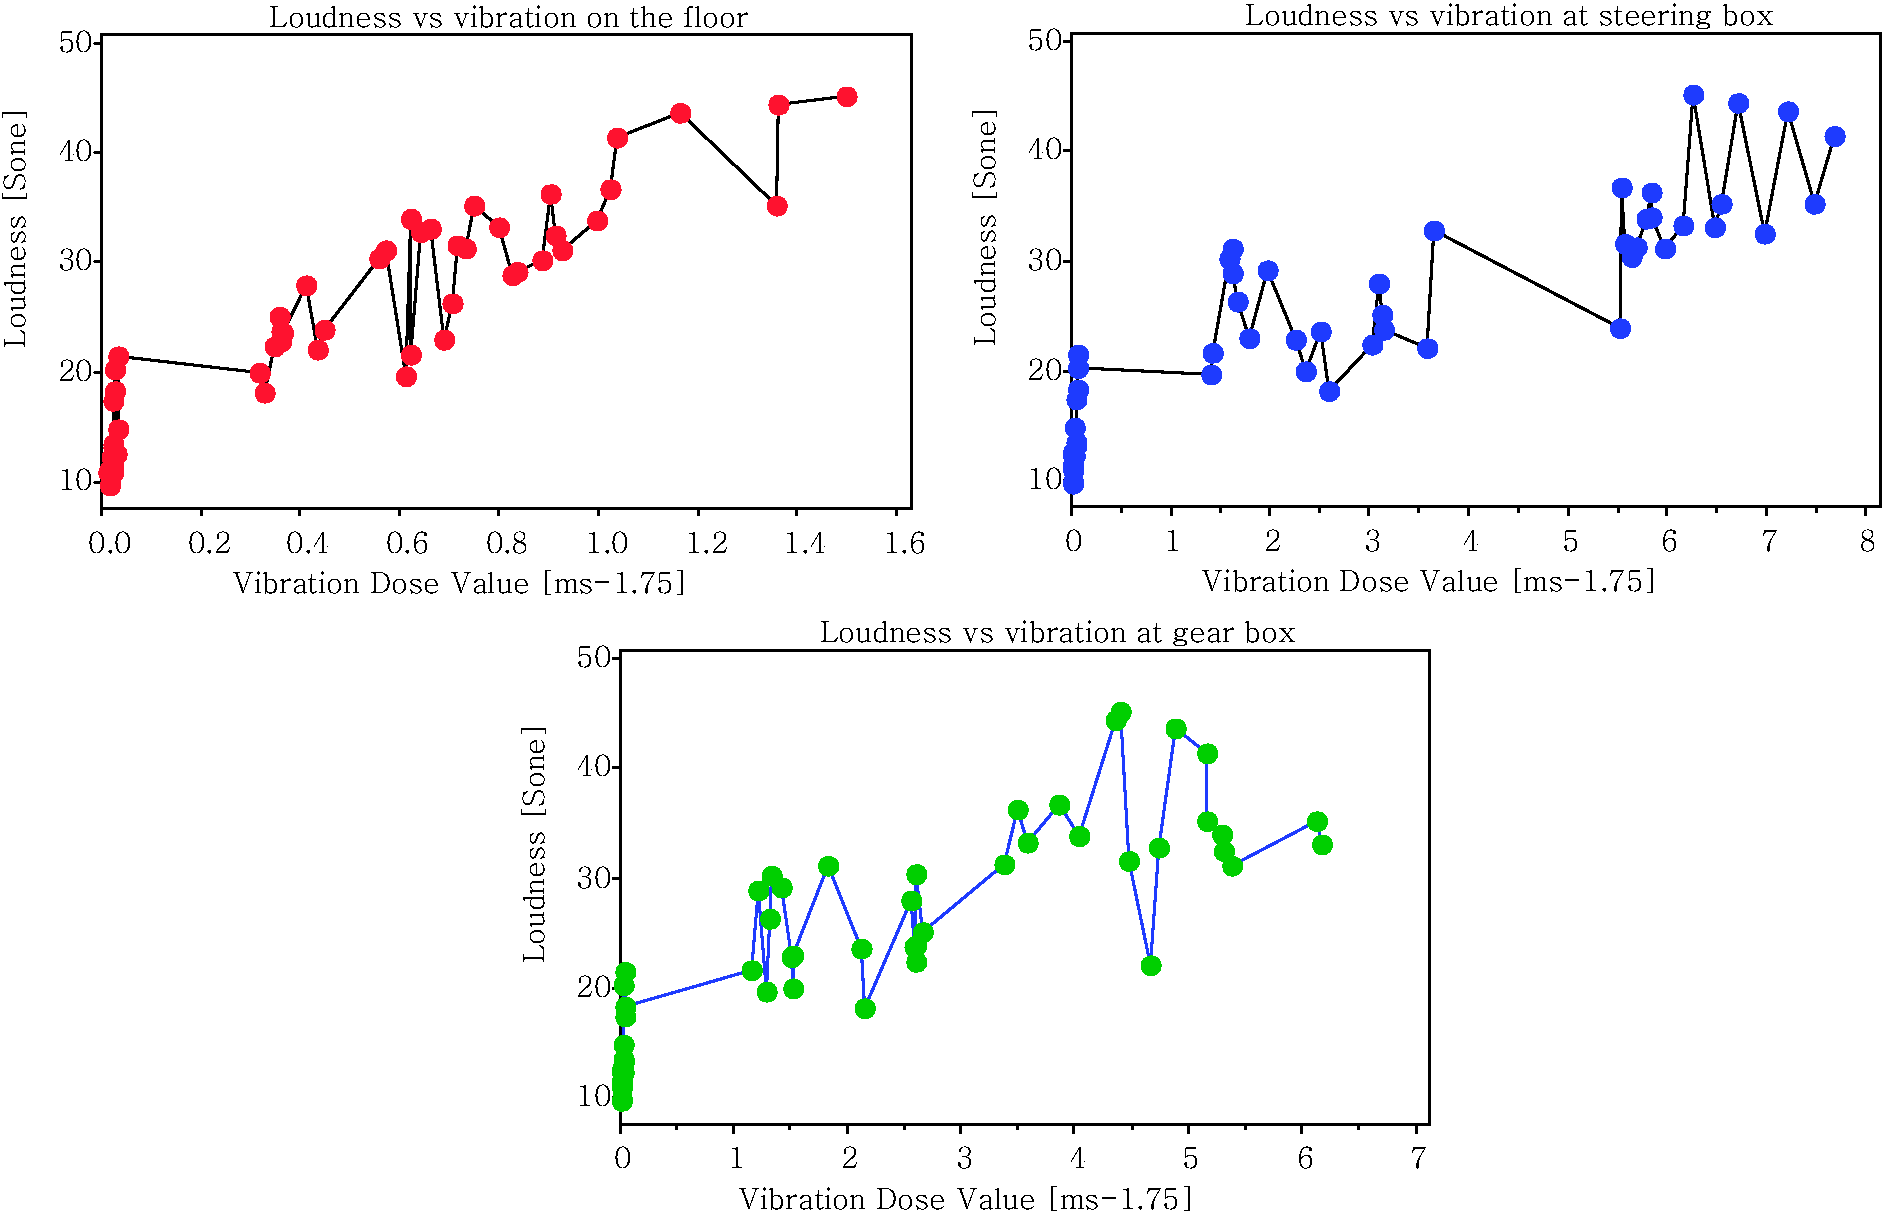
4. Modeling
The characteristics of the comfort levels.
Since the number of this data is limited, thus, based on clustering results the data were simulated to increase the number of the data. This is because more data will make the model more efficient and the results of classification will be more accurate. This simulation will provide a method to produce the simulated values of output data that have been generated based on random inputs of the data. Thus, in this simulation process 10,000 random samples of simulated observations were produced using the JMP Statistical Discovery software. Through this simulation, it allows the discovery of the distribution of the output data in the model as a function of random variation in the data noise. To perform the process of classification, the MATLAB Neural Network tool box was used. This Neural Network tool box contains a set of structures and functions that can operate the task performed by the neural network efficiently. Based on previous clustered data, it can be classified by the neural network approach since this algorithm is very commendable when it comes to solving pattern recognition problems. In this case, the back propagation algorithm will be applied, as the neural network involves the learning or teaching algorithm in order to estimate the parameter of each variable in the modeled data. The task of the data preparation contains two groups of data comprising of 80% of trained data and 20% of tested data. Later, in order to verify the results that have been obtained from a previous neural network model, the authors use the k-nearest neighbor algorithm as their second classification method. In this case, the raw data that are produced from the clustering process is used without simulation since this algorithm has practically been used in processing smaller data.
5. Results
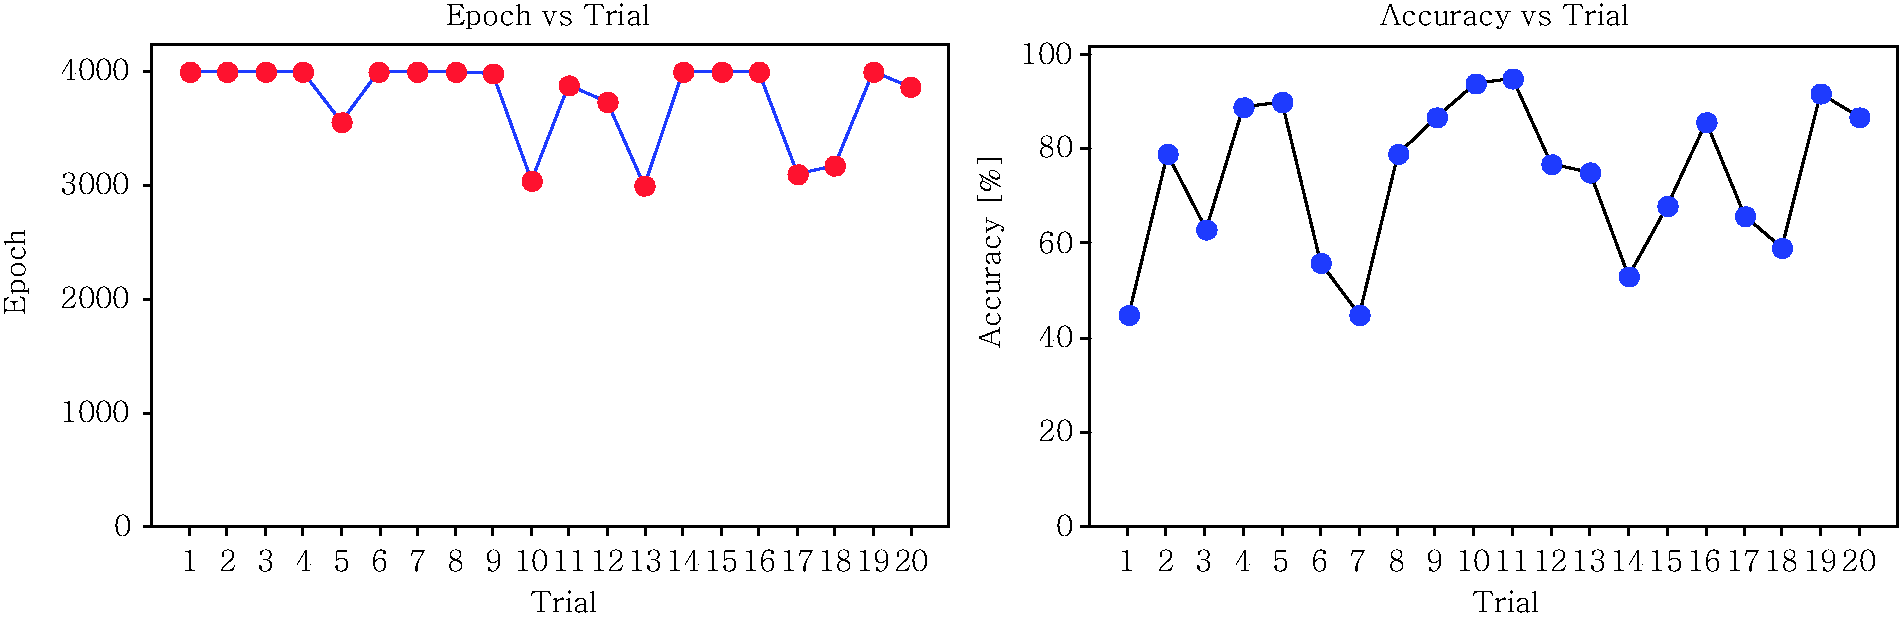
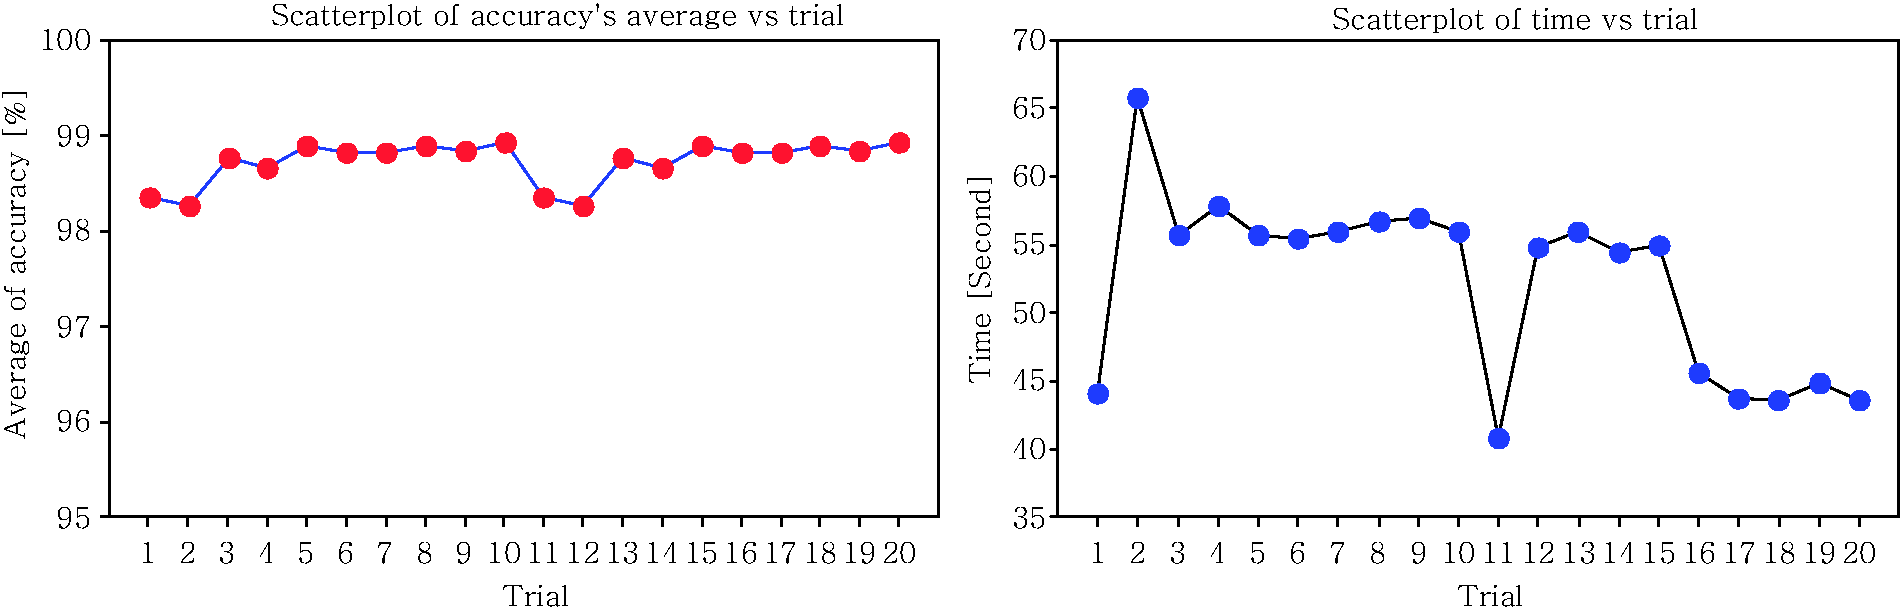
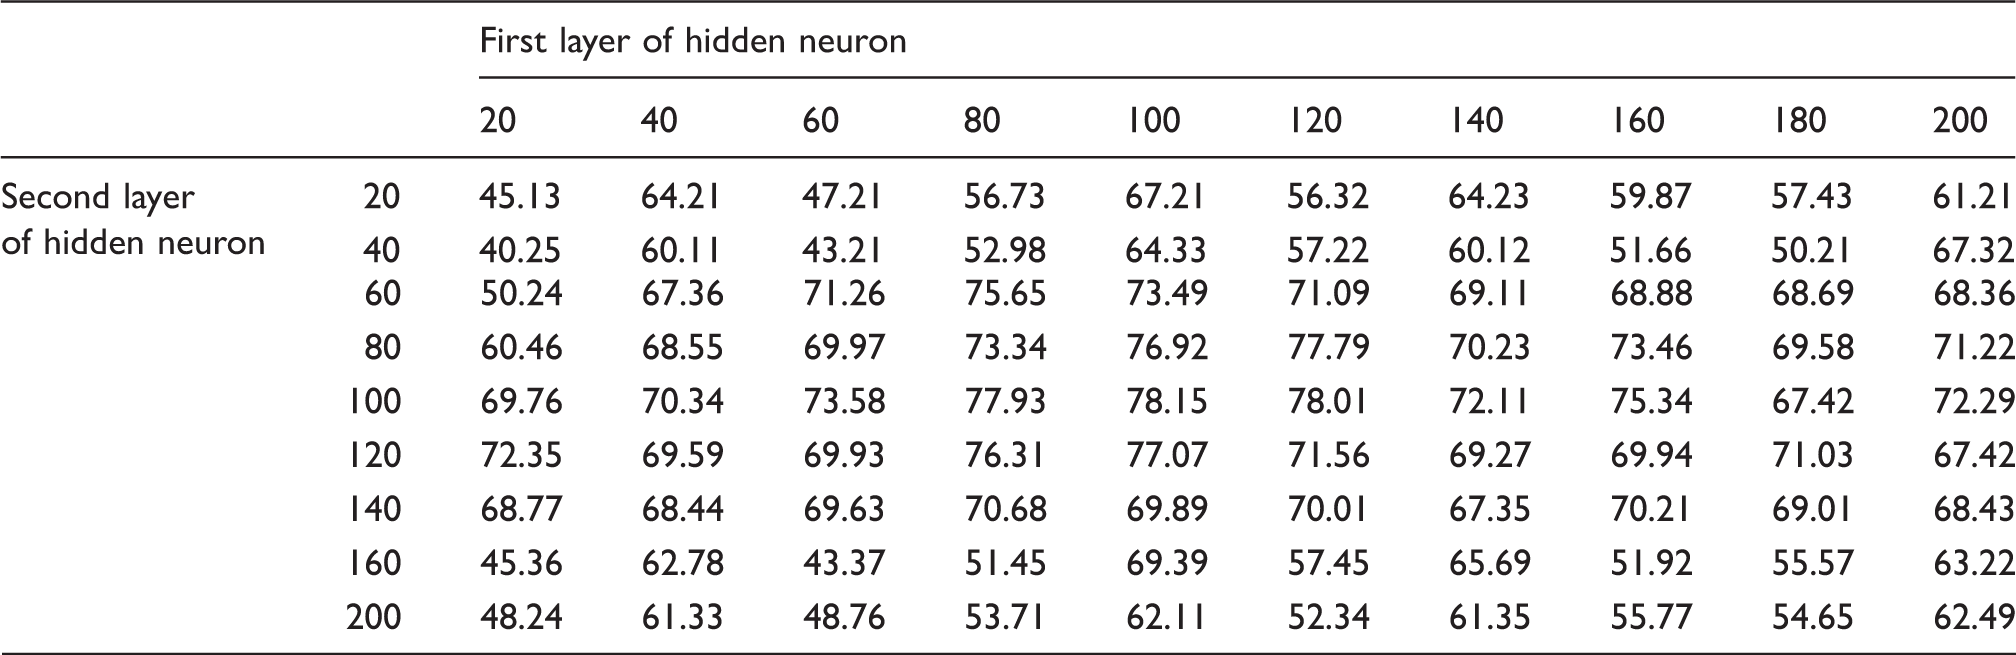
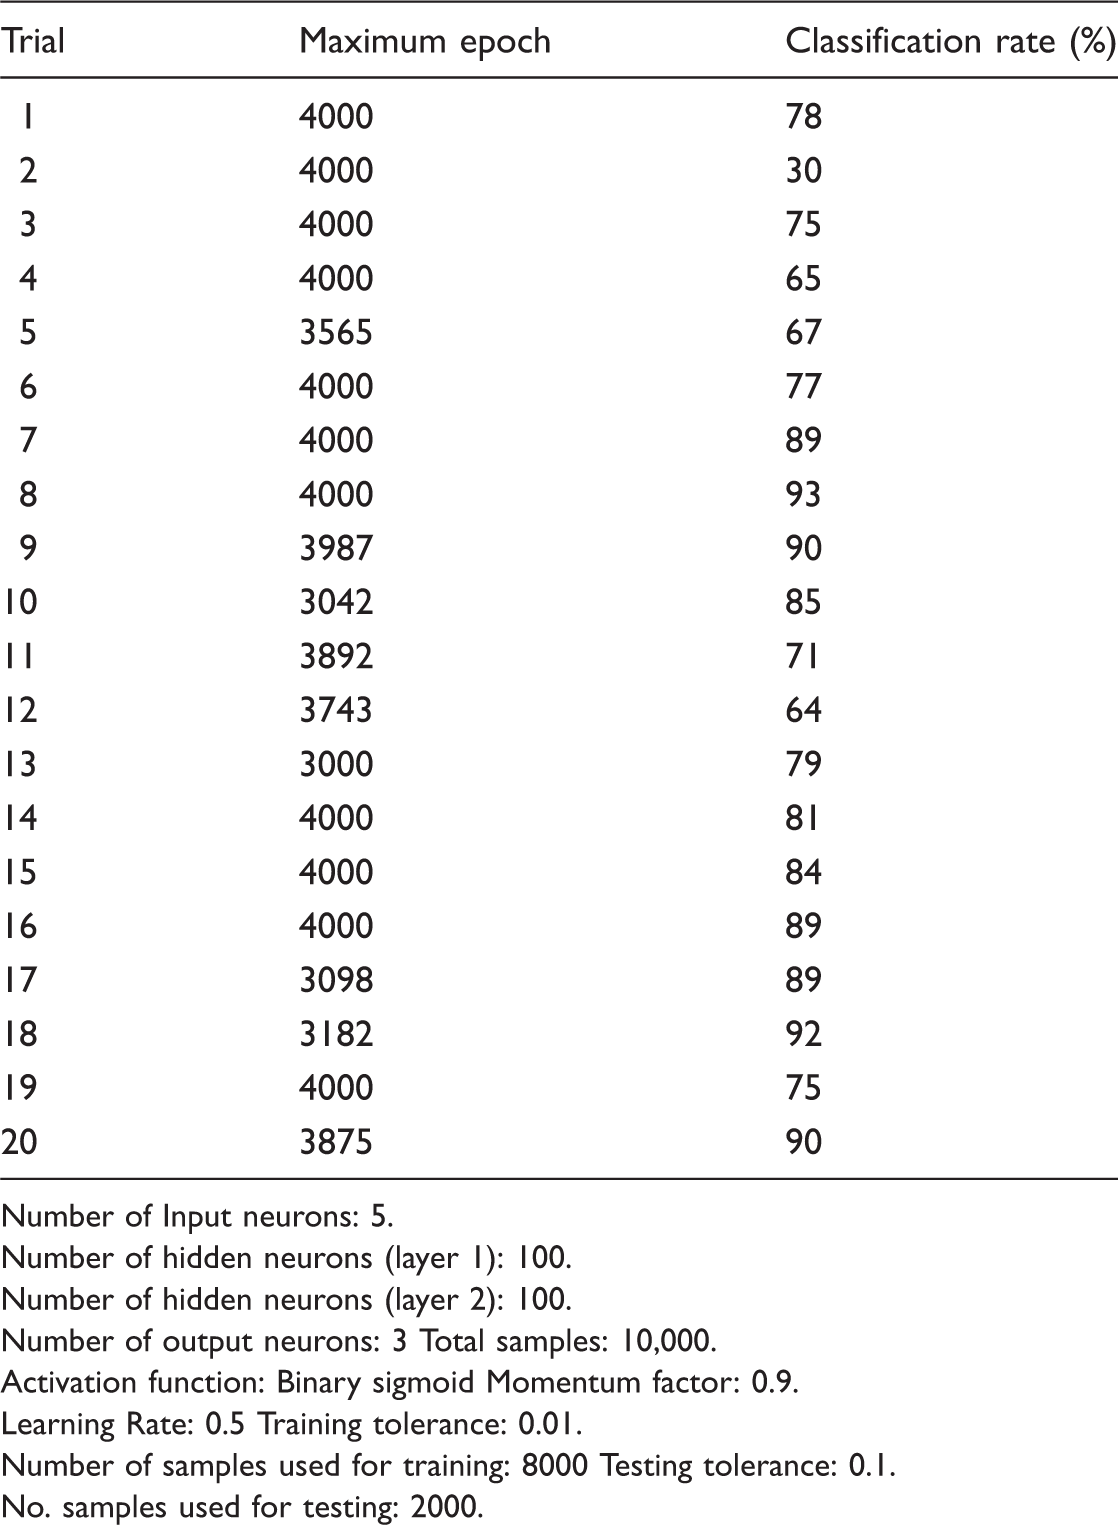
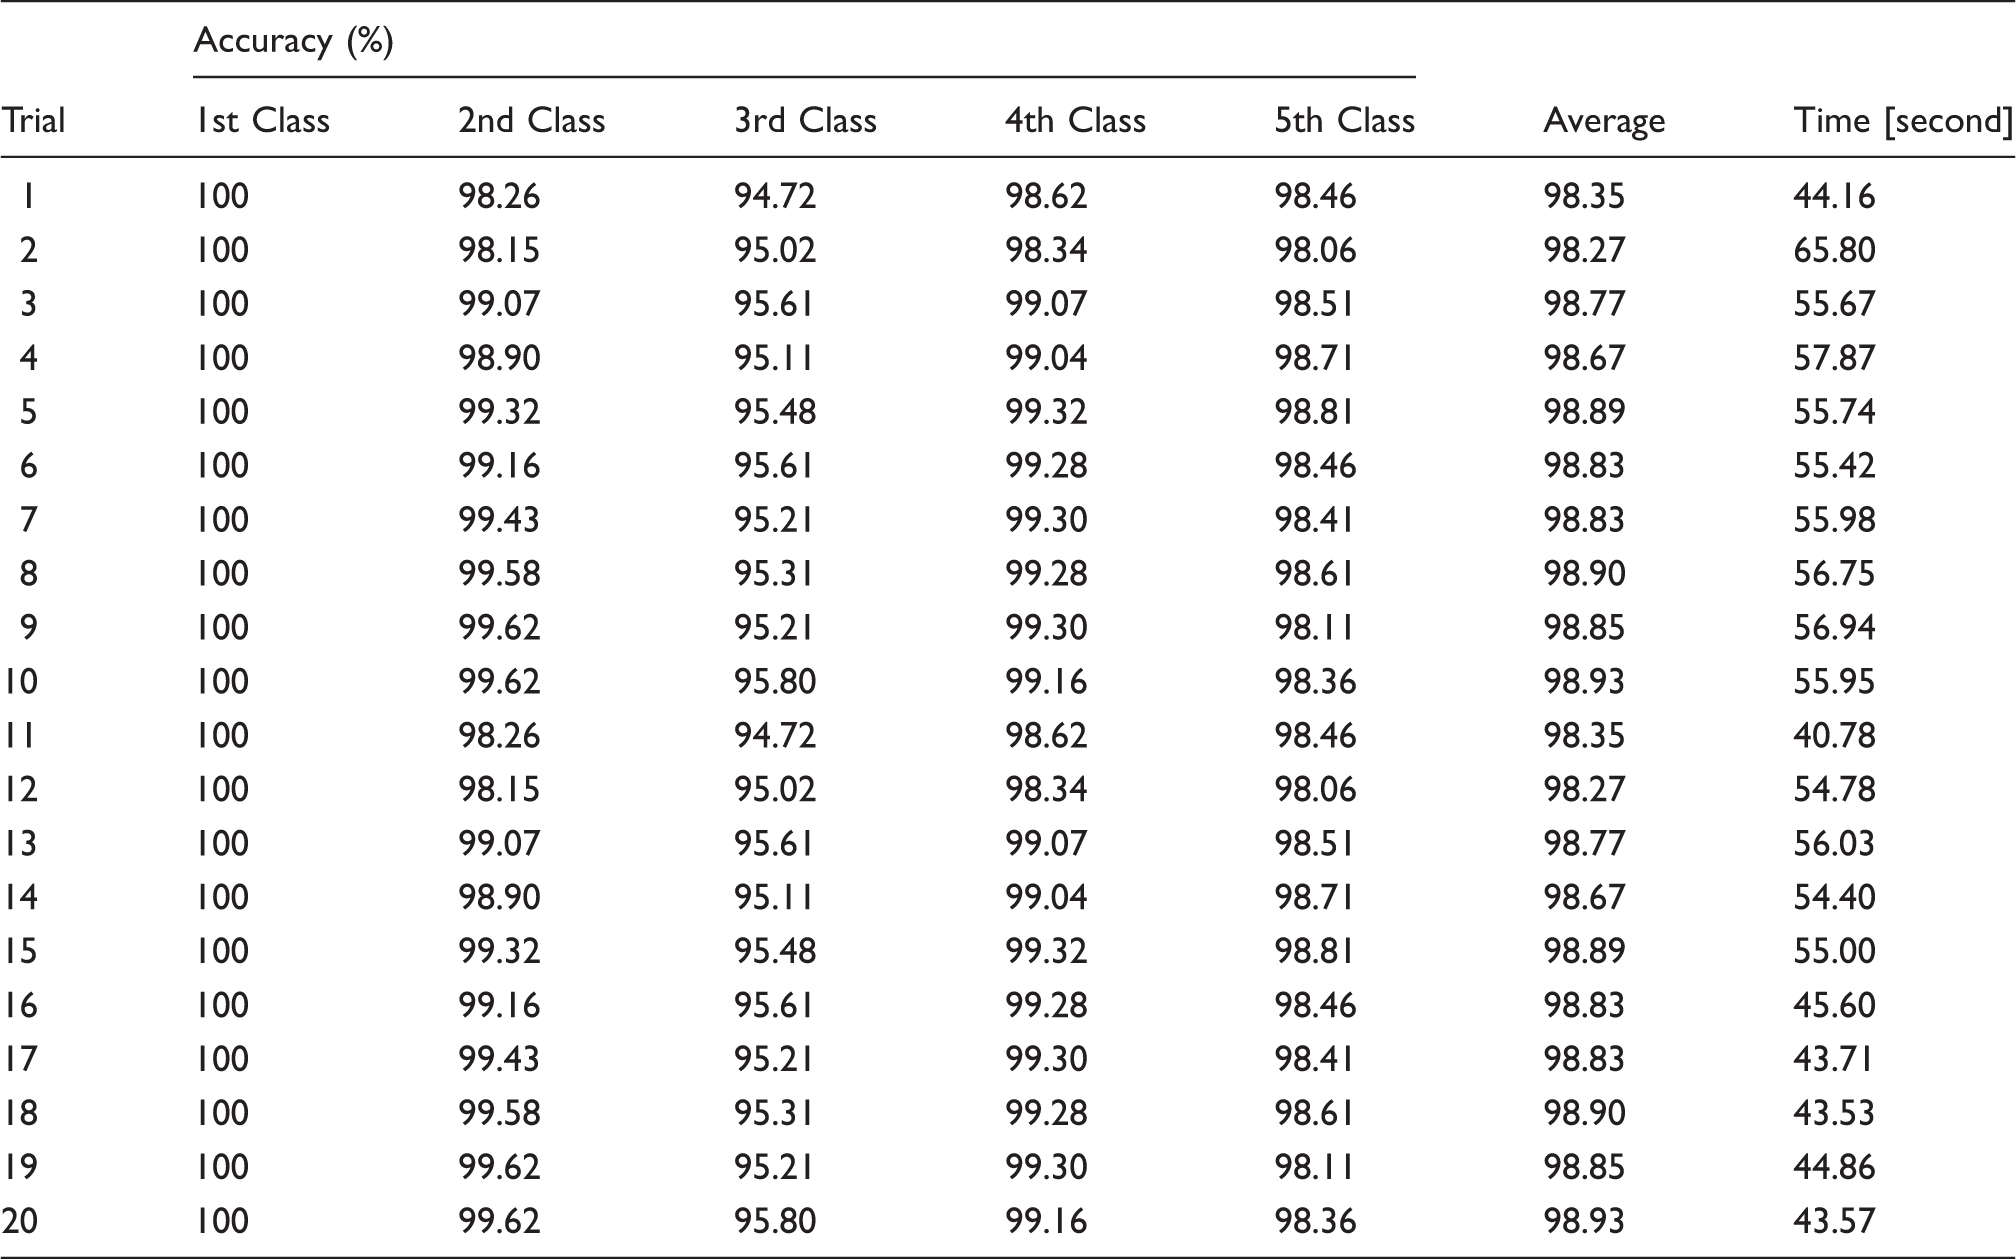
Table 15 represents the results of clustering using the k-means algorithm. Through Table 15, the levels of sound vibration were successfully clustered into five categories, as displayed in the table. From the results, it was found that the clustering algorithm was able to show the correlation between a particular sound quality’s parameter with the generated vibration at certain parts that had been investigated. Through Figure 15 the authors have further found that the distribution of the value of the loudness parameter concentrates on the region following the cluster that has been computed through the algorithm. Meanwhile, for the classification process, the model of the neural network was trained 20 times. The proposed classification algorithm was evaluated on 10,000 databases obtained through the simulation based on the previous clustering results. During the network’s training, the values of the parameter for both hidden layer 1 and hidden layer 2 were adjusted in order to obtain the most ideal combination for getting a network of higher accuracy. Table 16 shows the average values of the accuracy rate produced by each combination of the hidden layer’s parameters. From the results, the most ideal combination of the hidden layer parameter is 100 for layer 1 and 100 for layer 2. In terms of the performance of the network it is also understood that with this combination the accuracy rate is higher compared to other combinations. The results of the trials for this combination are displayed in Table 17 and Figure 16. Meanwhile, Table 18 displays the distribution of the rate of accuracy and the processing period for each trial in the model of the k-NN. To recognize the state of annoyance, the confidence value is computed using the Euclidean distance between the scale of annoyance and the parameter of the trained database. From the results it has been found that the model is efficient enough to classify the data since the average accuracy for each trial is quite high, which is higher than 90% (Figure 17).
Scatter plot of loudness parameter following the cluster at each investigated vibrating parts. Distribution of epoch and accuracy results. Distribution of average of accuracy and taken time. The clustering results following classes. Average value of accuracy rate of 20 trials in percentage [%]. Distribution of trial’s accuracy. Number of Input neurons: 5. Number of hidden neurons (layer 1): 100. Number of hidden neurons (layer 2): 100. Number of output neurons: 3 Total samples: 10,000. Activation function: Binary sigmoid Momentum factor: 0.9. Learning Rate: 0.5 Training tolerance: 0.01. Number of samples used for training: 8000 Testing tolerance: 0.1. No. samples used for testing: 2000. The results of k-NN algorithm.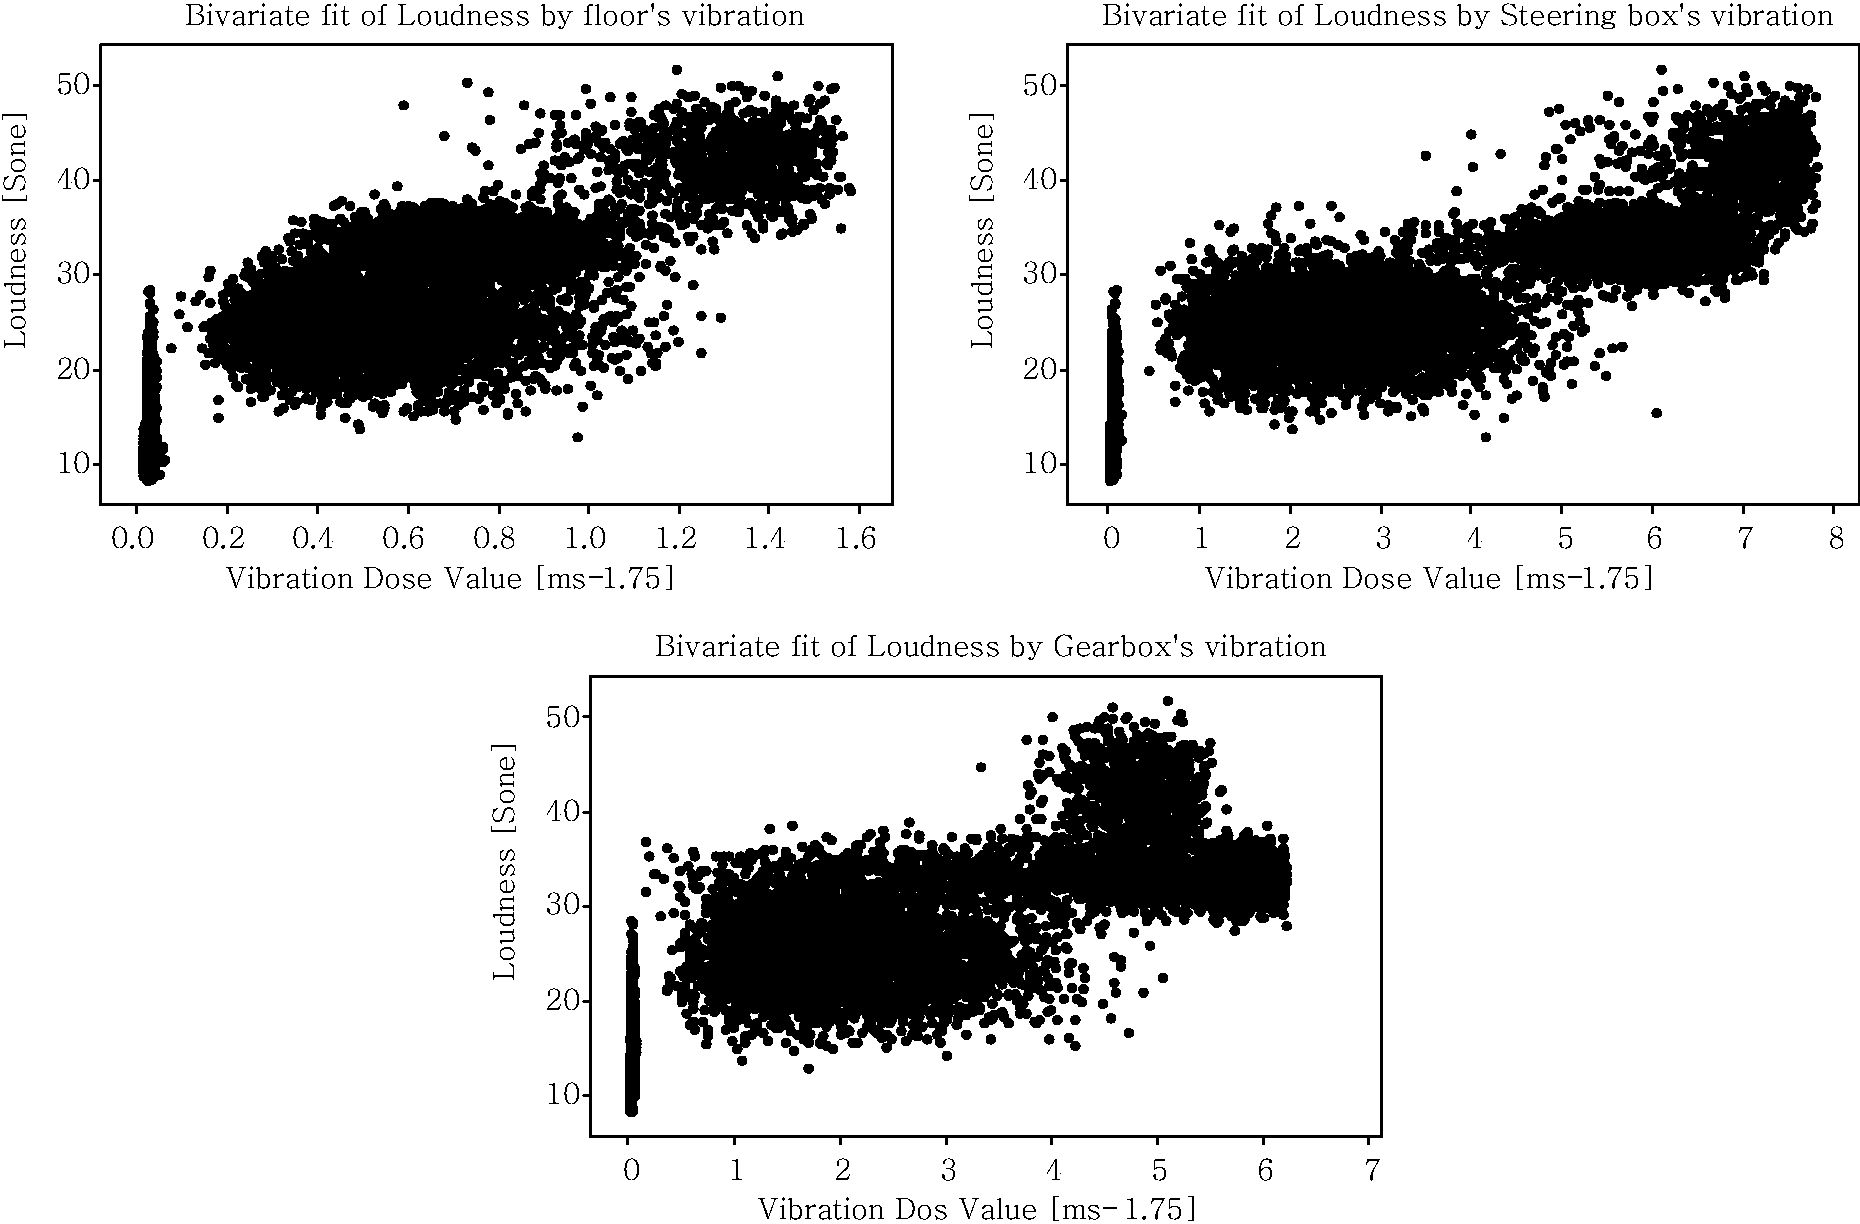

6. Conclusion
From the results it may be concluded that the developed model is able to cluster and classify the level of sound vibration in the vehicle cabin successfully. The proposed k-means algorithm and neural network algorithm are able to cluster and classify the sound vibration level from the provided database efficiently. Based on the trends of the noise experienced and exposed vibration, the model is able to differentiate the level of comfort between the clusters by grouping the level of sound vibration into five categories which are most pleasant, medium pleasant, marginal, medium annoying and most annoying. These two clustering and classification algorithms are efficient as they can be applied in order to evaluate the level of sound and vibration towards the noise experienced and exposed vibration in the vehicle cabin by excluding the subjective test. This normally involves human assessment that is always influenced by errors and bias during the tests. Besides, the additional method of the k-NN algorithm successfully localizes the state of annoyance of the sound and vibration experienced using the input of sound and vibration database. This algorithm is quite efficient since the distribution of the rate of accuracy is higher than that of the previous neural network. In addition, the result of the study also suggests that not all of the parts or areas in the vehicle cabin are vibrating constantly with the changes of the engine rpm. A few parts or areas are randomly vibrating following the force that is affected by the vehicle’s body. Thus, in order to recognize which part or location that significantly corresponds with the engine rpm, the statistical data analysis is deemed compulsory.
Footnotes
Funding
This research received no specific grant from any funding agency in the public, commercial, or not-for-profit sectors.