
Abstract
Rolling element bearing is not only the most important failure unit in rotary machinery, but it is also the most common, and its performance degradation assessment has been proposed to realize equipment’s near-zero downtime and maximum productivity. Therefore, exploring effective indices is crucial. Rolling element bearing’s vibration signals often contain complex, non-stationary and nonlinear characteristics. In this work, the changes of complexity, which are measured by two nonlinear methods: correlation dimension and approximate entropy, in the performance degradation process of rolling element bearing based on simulation and bearing accelerated life test data have been studied. Results show that the complexity decreases with the development of obvious defects, and that correlation dimension and approximate entropy have different sensitivities to different performance degradation stages, with the different ability of reflecting the first degradation stage being explained by their different computation processes.
1. Introduction
Rolling element bearing is not only the most important failure unit in rotary machinery, but it is also the most common. Condition monitoring for it has received considerable consideration because its implementation can effectively prevent costly, and even catastrophic, downtime. Vibration signal-based analysis methods are the most suitable and effective for bearing (McFadden and Smith, 1984b).
The field of condition monitoring is always open to the introduction of new techniques. Up to now, a variety of analysis methods have been proposed and applied in the field of rolling element bearing condition monitoring, and some studies, such as those of Tandon and Choudhury (1999), Neild et al. (2003), Samuel and Pines (2005), and Jardine et al. (2006) give a good review of many of them. As a whole, they can be sorted into two classes. The first class mainly aims to identify the frequency components to detect localized defects, such as fast Fourier transform (FFT), high frequency resonance analysis (also known as envelope analysis) (McFadden and Smith, 1984b), short-time Fourier transform (STFT), Wigner-Ville distribution (WVD), wavelet (packet) transformation (Nikolaou and Antoniadis, 2002), Empirical Mode decomposition (EMD) (Yu et al., 2006) and cyclostationary analysis (Antoni, 2007). The other class aims to quantify and assess signals from different statistical aspects to give some indices, such as mean, peak, peak-peak, root mean square, shape factor, crest factor, impulse factor, and kurtosis factor.
Performance degradation assessment (Lee, 1996) is a new research direction for prognostics that is much more efficient than diagnostics to achieve zero downtime performance (Jardine et al., 2006). To date, some research productions have been achieved (Lee, 1996; Qiu et al., 2003; Yan et al., 2004; Lei et al., 2005; Yan and Lee, 2005; Huang et al., 2007; Ocak et al., 2007; Wenbin Xiao, 2009; Lei Guo, 2008), which have mainly focused on the new intelligent assessment methods, such as cerebellar model articulation controller (CMAC), logistic regression (LR), self-organizing map (SOM) and hidden Markov model (HMM). In fact, performance degradation assessment proposes new requirements for feature extraction, which are completely different from diagnostics. However, this has not been given enough attention in previous research. Feiyun Cong and Pang (2011) proposed Kolmogorov-Smirnov’s method to test bearing performance degradation, and results showed that this method can reflect performance degradation earlier than root mean square (RMS), but it cannot reflect bearing’s whole degradation process.
Rolling element bearings’ vibration signals often contain complex, non-stationary and nonlinear characteristics (Hively and Protopopescu, 2004). Therefore, it is favorable to investigate the nonlinear dynamic behavior using nonlinear dynamical analysis to measure the complexity throughout the bearings’ lifetime.
Correlation dimension and approximate entropy are the two most commonly used nonlinear methods to measure a signal’s complexity. Correlation dimension, developed by Grassberger and Procaccia (1983) to quantify the complexity of a dynamical system on an attractor, has been widely used as a powerful tool for interpreting irregular signals in many engineering domains including condition monitoring. Logan and Mathew (1996a,b) introduced the correlation dimension for the diagnosis of rolling element bearing defects, and results showed that the correlation dimension can classify three major rolling element bearing faults: outer race fault, inner race fault and roller fault. Jiang et al. (1999) introduced a new technique for extracting quantitative parameters from a raw time series of vibration acceleration data with the correlation dimension, and results showed that there are distinctive differences in the correlation dimension obtained from a normal gearbox and those with cracked or broken teeth. Craig et al. (2000) applied correlation dimension to monitor the condition of a system with clearance, and it was discovered that there was a discernible decrease for correlation dimension with the clearance increasing. Wang et al. (2001) reported the analysis results of correlation dimension in a large rotating machine with an aerodynamic excitation fault and oil whirl fault, and it was shown that the correlation dimension can provide some intrinsic information about an underlying dynamical system and can be used to classify different faults intelligently. Rolo-Naranjo and Montesino-Otero (2005) introduced a robust method for correlation dimension estimation in an automatic way and applied it in online condition monitoring of large rotating machinery. Zhu et al. (2007) studied the changes of correlation dimension of frictional signals in the running-in wear process, and it was shown that the correlation dimension increases gradually with the running-in procedure and goes on to ultimately reach its maximum – it was observed that the correlation dimension of frictional signals was consistent with the fractal dimension of worn surfaces in the running-in process, which demonstrated that it can identify the running-in state of a friction pair by the change of correlation dimension of the frictional signals. Janjarasjitt et al. (2008) performed nonlinear dynamical analysis throughout a life test of a rolling element bearing utilizing a modified form of the correlation integral, and results showed that the dimensional exponent (an approximation of the correlation dimension) as computed from the partial correlation integral algorithm tends to increase as time progresses and the useful remaining life of the bearing decreases; the dimensional exponents of a healthy bearing and a bearing close to failure are statistically different. Approximate entropy (ApEn) (Pincus, 1991, 1994, 1998; Pincus and Michael, 1995) is proposed by Pincus to quantify complexity and regularity. It is mainly applied to analyze biologic signals, and its application in condition monitoring is much less. Tian et al. (2007) used ApEn as a tool to describe the fan condition, and results showed that ApEn is able to identify the conditions of a fan with faults compared with its normal condition. Wei et al. (2008) discussed and summarized machinery fault diagnosis based on a chaotic oscillator and ApEn, and results showed that ApEn can recognize the change of chaotic oscillator. Yan and Gao (2007) established a quantitative relationship between the severity of bearing degradation and the ApEn, and results showed that ApEn can effectively characterize the severity of structural defect.
In this work, the changes of complexity in the performance degradation process of rolling element bearing based on simulation and bearing accelerated life test data have been studied. Results show that the development of evident defect results in a decrease in complexity, which is different from the conclusions made by Janjarasjitt et al. (2008) and Yan and Gao (2007). These two methods are compared with each other, including the computation speed, the operability in application and the capability of reflecting a bearing’s performance degradation.
In this paper, the theoretical background of correlation dimension and ApEn is presented in Section 2. In Section 3, a vibration mathematical model of a defective rolling element bearing is introduced, and the changes of correlation dimension and ApEn with defect development under three different noise levels are analyzed. In Section 4, experiment results are shown and analyzed after introducing bearing accelerated life test, and in Section 5, conclusions made from these results are presented.
2. Theoretical background
2.1. Correlation dimension
A dynamical system can often only be investigated by analyzing an observable time series, which cannot generally provide complete state information. However, a more complete description can be obtained by unfolding the attractor into a higher dimensional space using the time-delay embedding scheme (phase space reconstruction developed by Packard et al. (1980)), which was proved by Takens (1981).
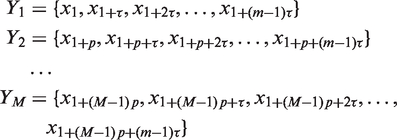
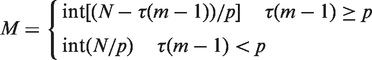
Grassberger and Procaccia (1983) developed the correlation integral and the concept of correlation dimension D2 to quantify the active degrees of freedom or the complexity of a dynamical system on an attractor. The correlation dimension is derived from the correlation integral given by the following equation:
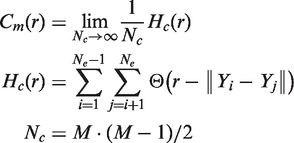

The correlation integral

In real applications, such a scheme is adopted to calculate D2: increasing r from a small value, and calculating the slope of best fitting
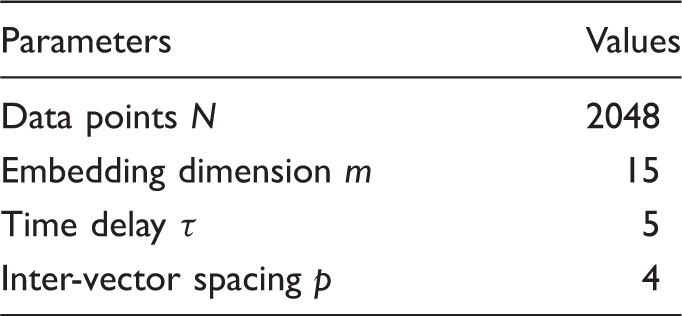
From the above process, it can be observed that D2 is influenced by several parameters: embedding dimension m, time delay τ, inter-vector spacing p, and the selection of scaling region. Kember and Fowler (1993) suggested some choices for time delay τ; Jiang et al. (1999) summarized the influence and choices of time delay τ and embedding dimension m, and discussed the influence of sample size and noise; Pang (2006) proposed a method of recognizing an automatically scaling region. Although so much research has been done, these parameters’ optimal values depend on a signal’s feature. In this paper, the optimal values are not focused upon, because: (1) it is difficult to choose optimal values for bearings’ whole lifetime signal one by one; (2) here, the correlation dimension is just used as an index to reflect bearing performance degradation, not to reflect chaotic behavior.
2.2. Approximate entropy
Approximate entropy was developed by Pincus (1991, 1998; Pincus and Michael, 1995) to measure the complexity of a time series
In equation (7), each vector is composed of m consecutive and discrete data points of the time series X. The distance

The similarity between the vector Yi and all vectors
It is can be observed that
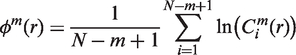
The approximate entropy of the time series X can be calculated as
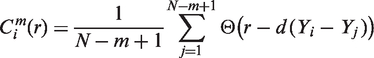
In practical application, a finite time series including N data points is used to estimate the value of ApEn, defined as

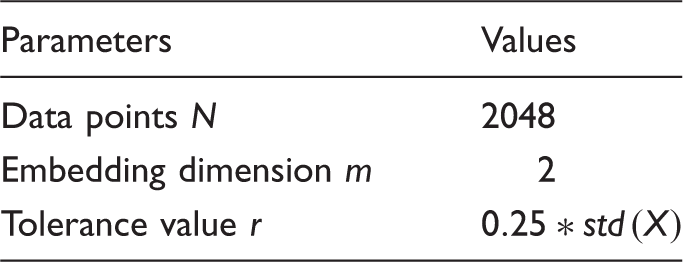
From the calculation process of ApEn, it can be observed that ApEn is influenced by several parameters: data length N, tolerance value r and embedding dimension m. The selection of these parameters have experiential values,
The ApEn has the following characteristics:
Only short length data is required, often about 1000 points data is enough It can be used to measure the complexity of both random and determinate signals Has excellent robustness to noise, especially strong transient noise It yields lower value for the more regular signal, e.g. the sin signal’s ApEn is small, and the Gaussian noise’s ApEn is big.
From the ApEn’s definition, it can be seen that this method has an inhibitory action for transient noise and noise which is smaller than predetermined tolerance value r, but correlation dimension does not have these advantages. In addition, from the calculations’ process of correlation dimension and ApEn, it can be observed that they are both involved in the selection of embedding dimension, but as pointed out by Pincus, ApEn can not only be applied to nonlinear dynamical systems but also to random and determinate systems, and therefore the embedding dimension m in ApEn is not the same in correlation dimension which has a clear nonlinear dynamical meaning.
3. Simulation based on mathematical model
3.1. Vibration signal’s mathematical model of rolling element bearing
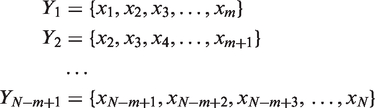
Vibration signal of rolling element bearing is complex under a normal state or with a defect, including components resulting from its structure (geometrical shape), tolerance and surface deterioration such as spalling fatigue and abrasive wear (Sunnersjo, 1985). McFadden and Smith (1984a) developed a model produced by a single point defect, which incorporates the effects of rolling element bearing geometry, shaft speed, load distribution, transfer function and the exponential decay vibration. This model was extended to describe the vibration produced by multiple point defects (McFadden and Smith, 1985). The above models considered shocks as exact periodicity. However, these shocks’ periodicity is not exact, because the rolling elements experience some random slip (this is partly due to the fact that they have a faster spin rotation in the load zone than in the unloaded zone). In addition, their amplitudes are subjected to modulation by the rotations of the inner race (inner race fault), the outer race (outer race fault) or the cage (rolling element fault) (Antoni et al., 2004). Synthetically considering these factors, the mathematical model of defective rolling element bearing can be expressed as equation (14), which has been successfully used for describing faults in rolling element bearings (Randall et al., 2001; Antoni and Randall, 2002; Feiyun Cong et al., 2013).
Where amplitude modulator with period attenuated damping oscillation with mean impulse period T minor fluctuation around T Gaussian noise with zero-mean natural frequency related to bearing or system resonance intensity arbitrary constant coefficient of resonance damping, depending on system
3.2. Simulation and analysis
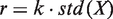
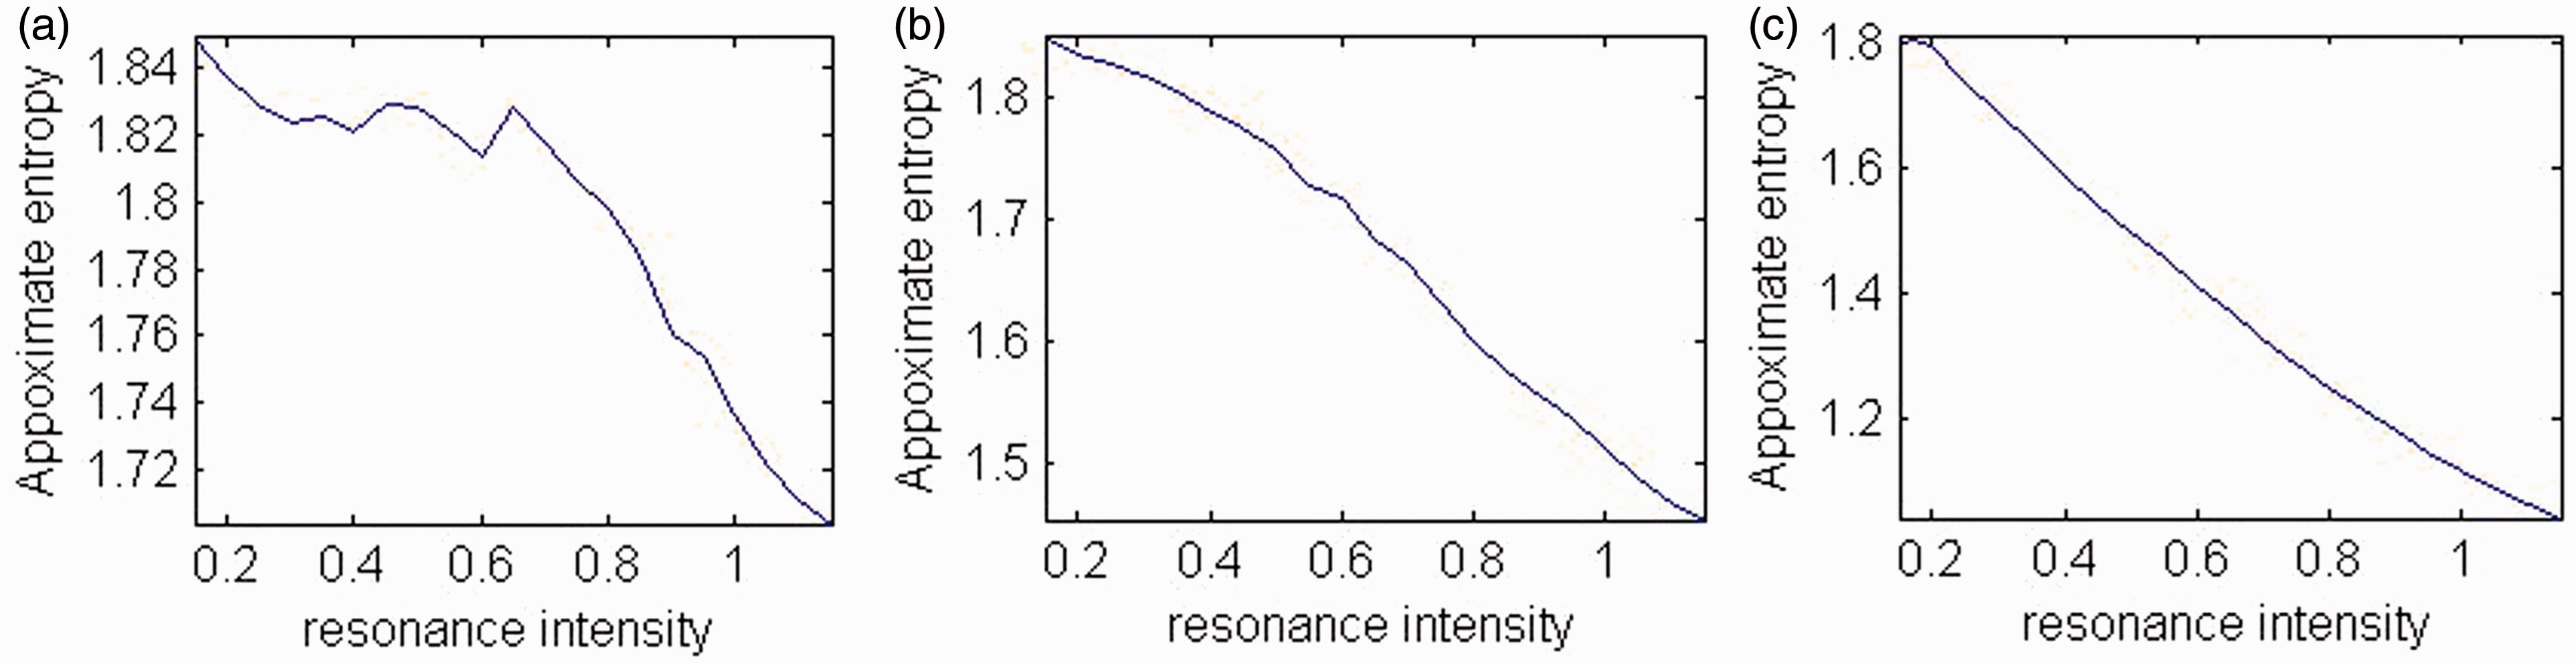
In this paper, an inner race defect (IRD) is taken as an example and simulated using equation (14); the bearing parameters and sampling frequency are the same as the following experiment. Defect development is simulated through increasing A0 from 0.15 to 1.15 in equation (14), which means the occurrence of a bigger defect, and this is also a process of increasing signal-noise-ratio (SNR). Three noise levels (corresponding standard deviations are
Parameters for calculating correlation dimension and ApEn are shown in Table 1 and Table 2, respectively, and the same parameters are selected in the following experiment. Figures 1 and 2 show, respectively, the changes of correlation dimension and ApEn with defect development under different noise levels. It can be observed that: (1) the complexity decreases with the rolling element bearing’s defect development; (2) a lower noise level makes the changes of complexity more consistent with the rolling element bearing’s defect development; (3) a lower noise level makes the values of complexity smaller and the variance ranges bigger, which is favorable to more obviously observe the degree of defect. Under the three noise levels, the variance ranges of correlation dimension are about Correlation dimension’s changes with defect development. (a) Approximate entropy’s changes with defect development. (a) Parameters for calculating correlation dimension. Parameters for calculating approximate entropy.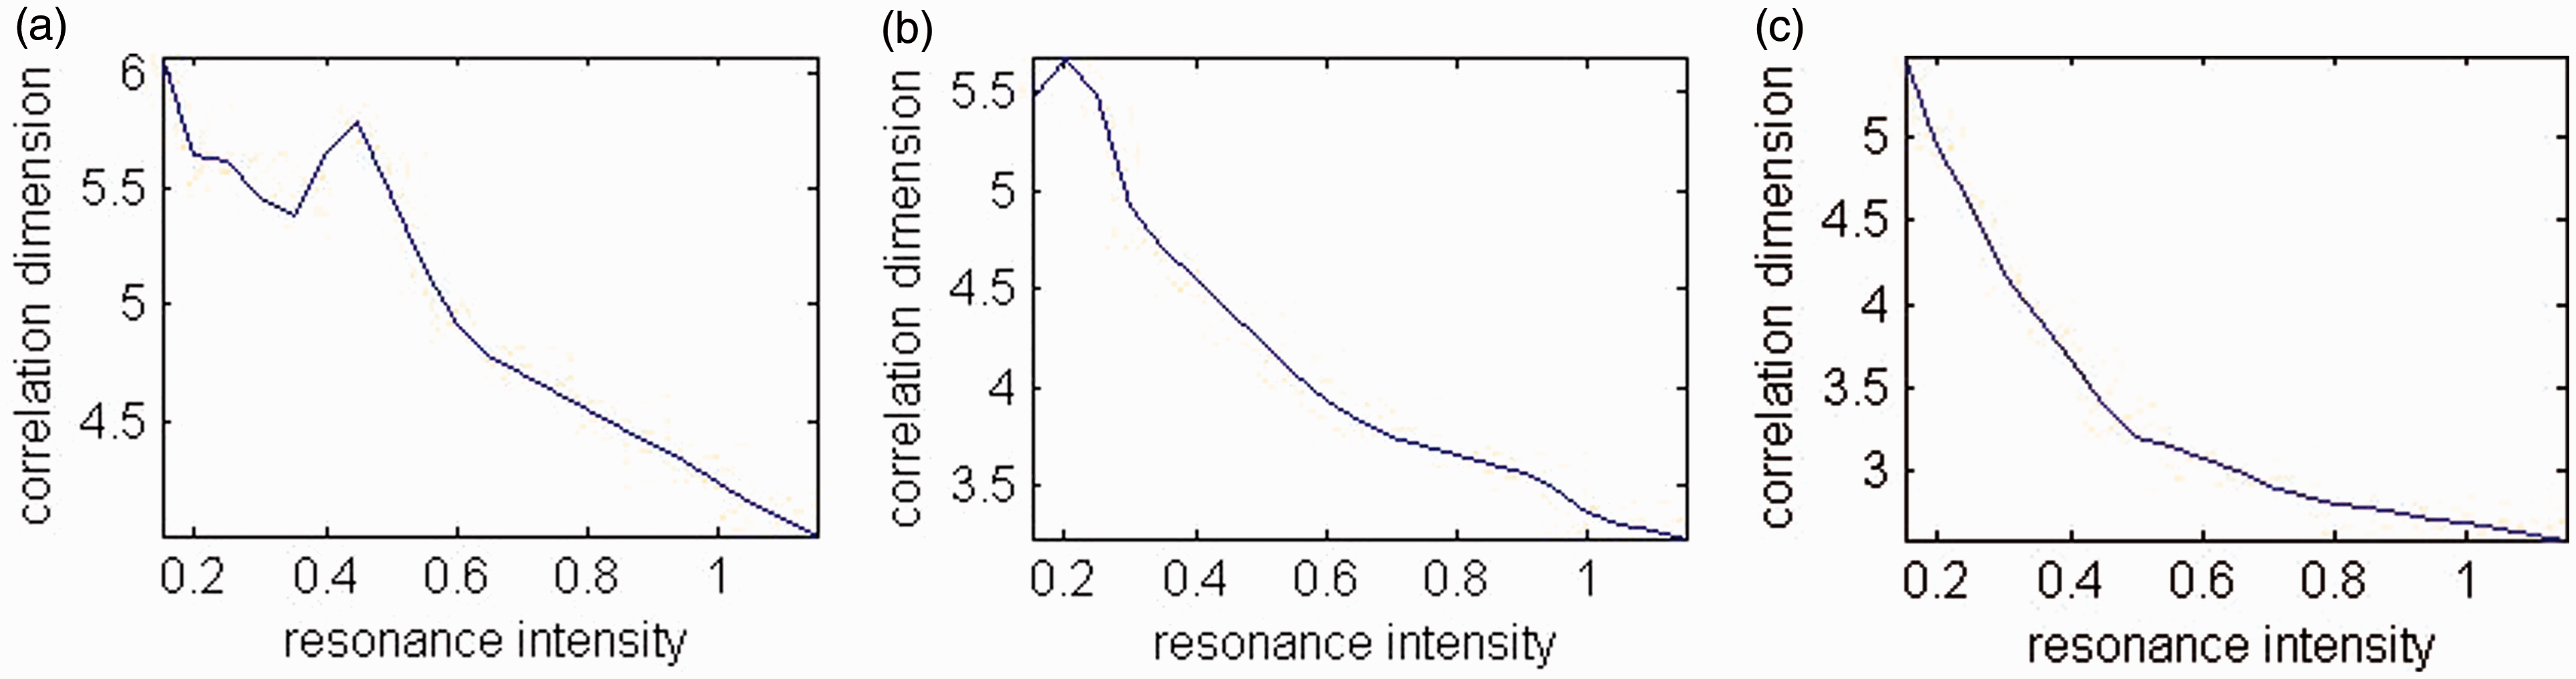
4. Experiment validation
From the above simulation, it can be observed that the complexity decreases with the rolling element bearing’s defect development. However, the actual performance degradation process of a rolling element bearing is so complex that it cannot be simulated completely. In this section, the changes of complexity in a rolling element bearing’s actual degradation process are studied.
4.1. Experiment rig
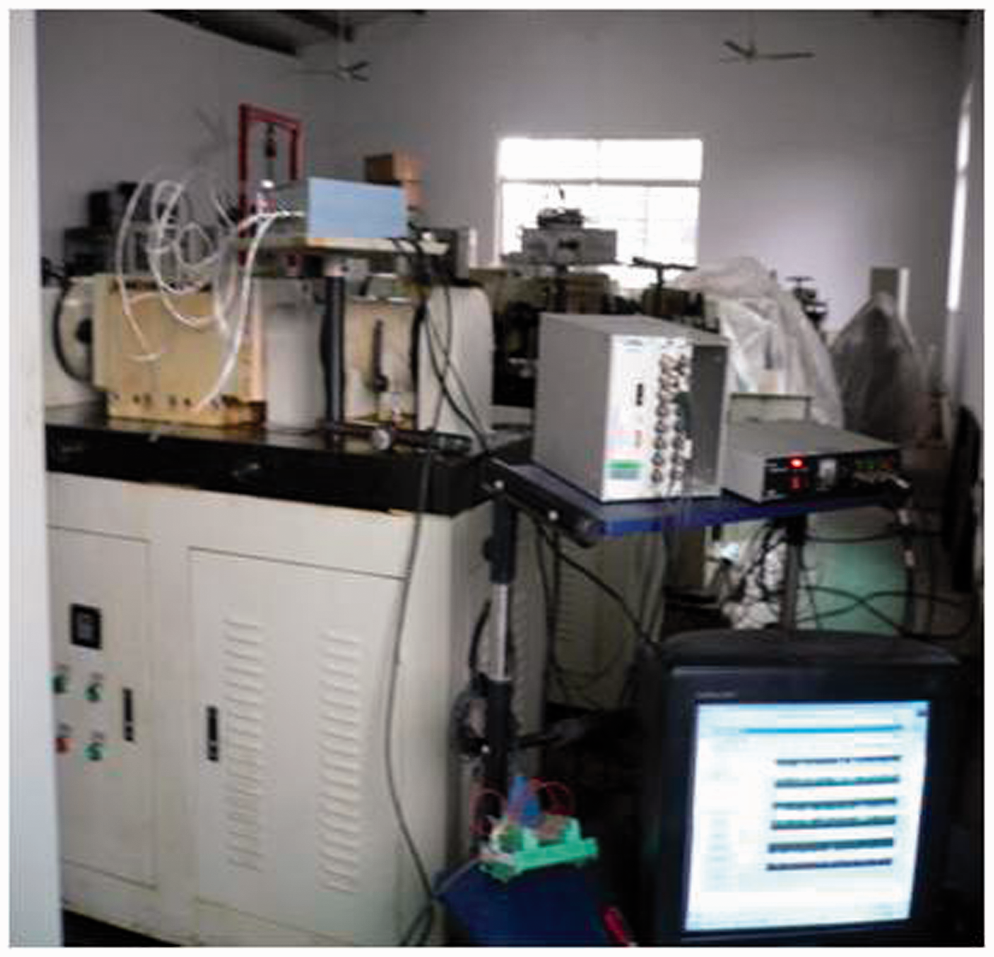
A rolling element bearing accelerated life test (Pan et al., 2009a) has been performed to collect vibration data throughout a whole lifetime. Accelerated bearing life tester (ABLT-1A) was provided by Hangzhou Bearing Test & Research Center (HBRC) with the assistance of UNDP/UNIDO (ISO/IEC 17025 Accreditation). This simultaneously hosts four rolling element bearings on one shaft driven by an AC motor and coupled by rub belts. A new one will be installed if one is a failure, which improves test efficiency. The data acquisition system includes three acceleration sensors (the installation sketch is given in Figure 3), one signal switch instrument and DAQCard-6023E data acquisition card. Data acquisition software is programmed with National Instruments LabView. The experiment’s equipment can be seen in Figure 4. One group (20,480 points) was collected per minute with 25.6 kHz sampling rate. The tested rolling element bearing’s type is 6307, and its corresponding parameters and operational condition can be seen in Table 3. Five characteristic frequencies can be seen in Table 4.
The sketch of sensor installation. Experiment equipment ABLT-1A. Rolling element bearing’s parameters and operation condition. Five characteristic frequencies of rolling element bearing 6307 (Hz).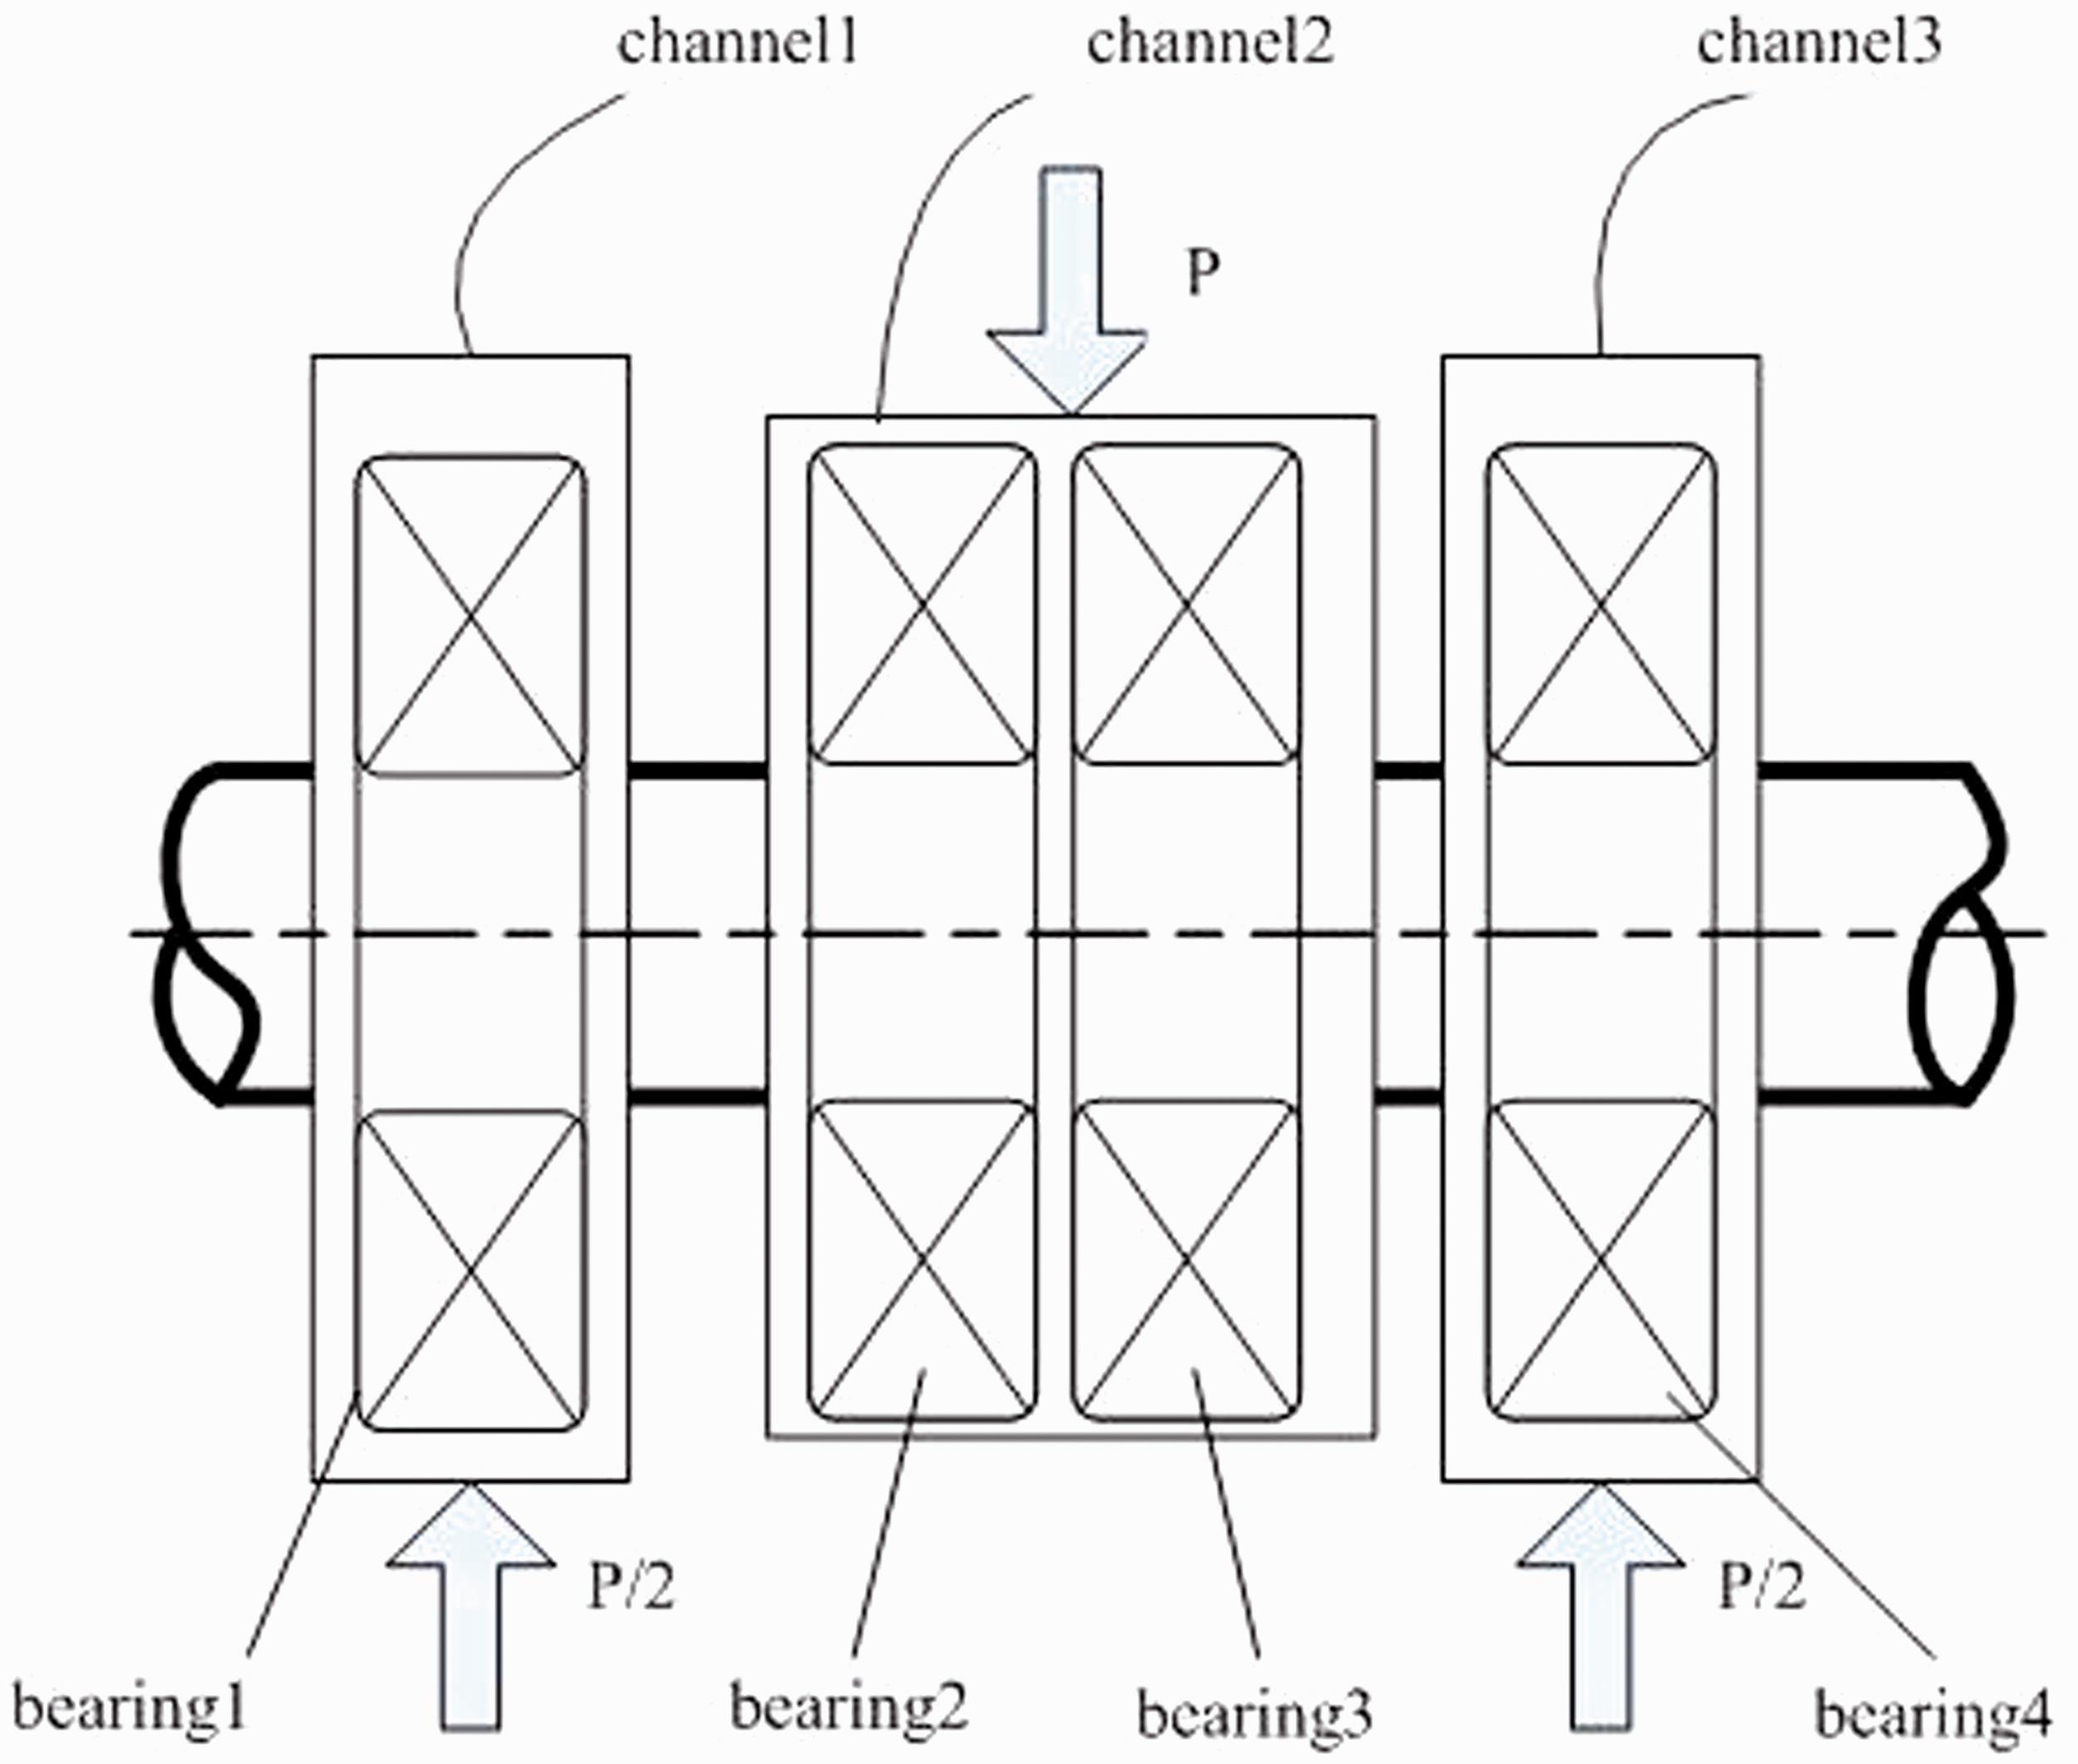

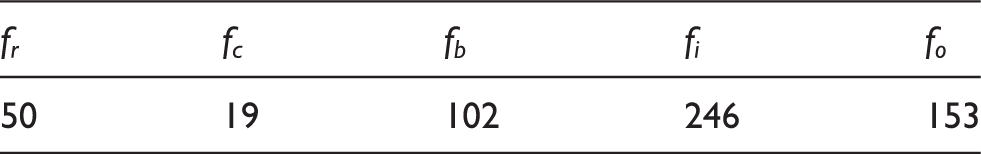
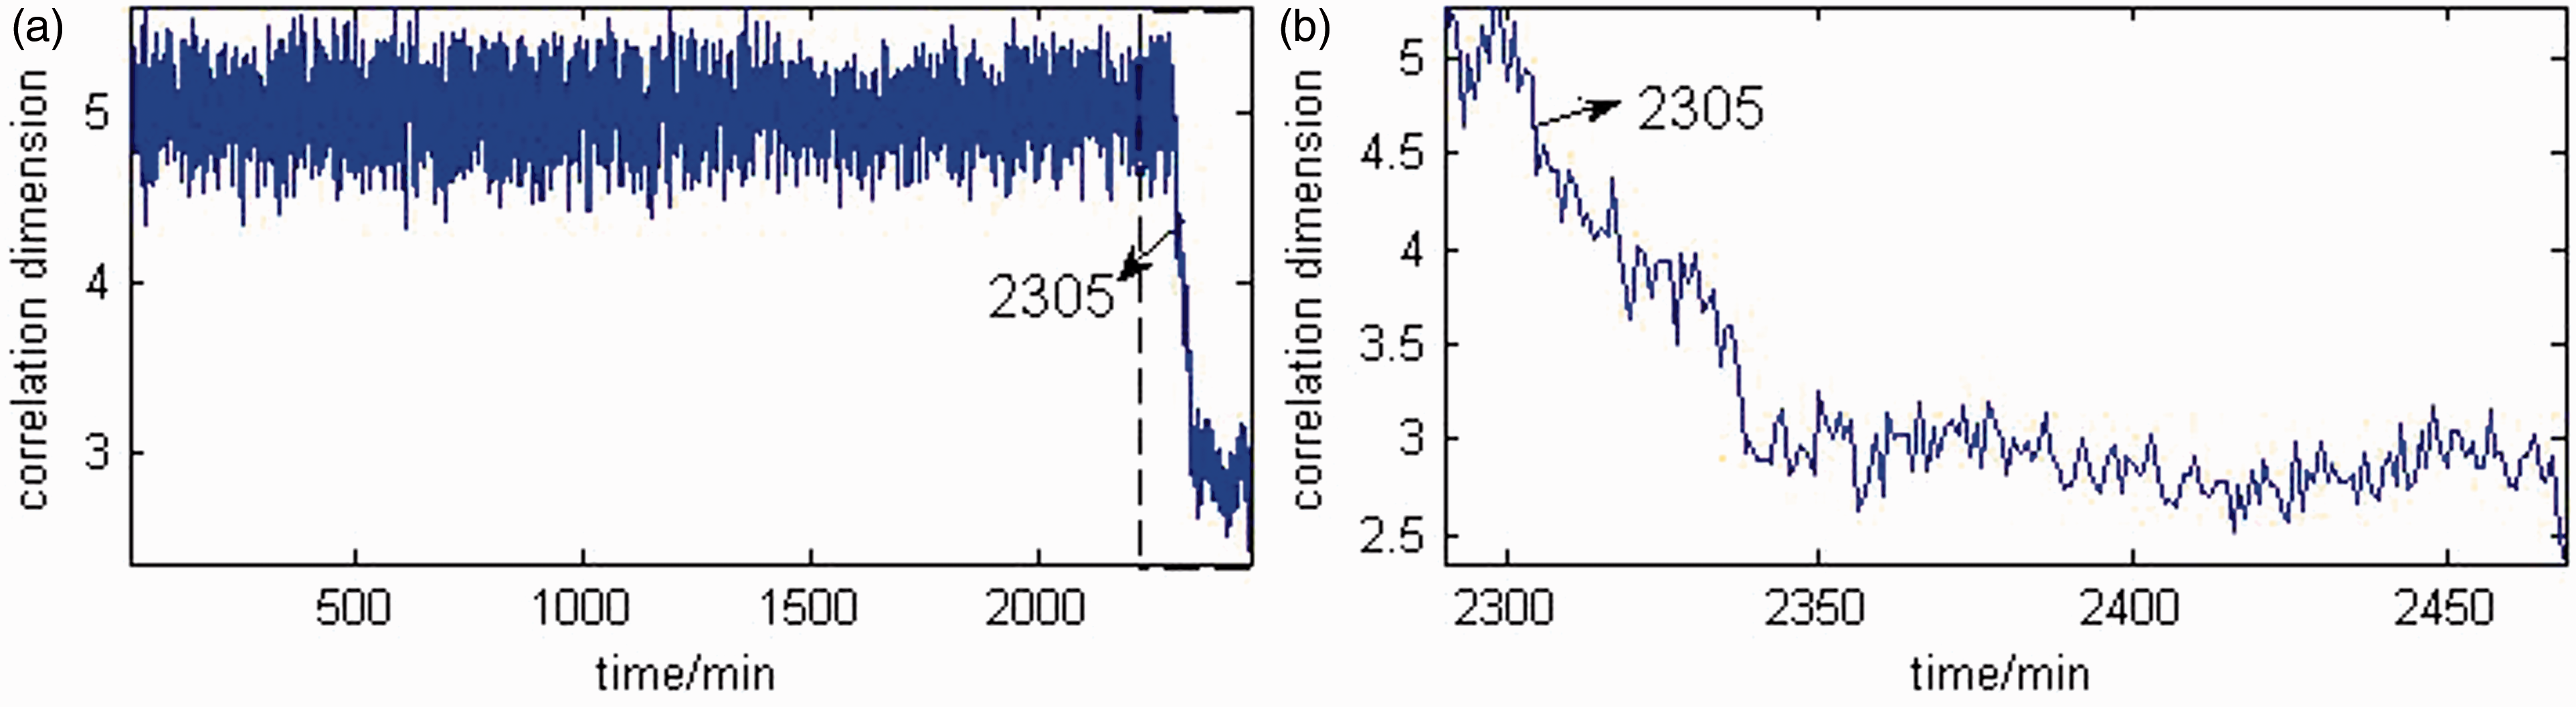
Two failed rolling element bearings, B1 and B2, are studied using 1062 (the previous 900 groups are canceled because of an unstable running state) and 2469 groups’ data, respectively. Figures 5 and 6 (Pan et al., 2009b) show the changes of RMS throughout their whole lifetime, respectively, to analyze the changes of correlation dimension and ApEn. It can be observed that: (1) B1 and B2 both experienced two stages of performance degradation – the first one is the RMS’s abrupt increase and then the performance remains stable for a long time – this occurs at about 517 minutes for B1 and 1297 minutes for B2, but the increase of RMS is so weak that it is hardly observed. The second one is the RMS’s durative increase until B1 and B2’s failure – this starts from about 978 minutes for B1 and 2304 minutes for B2, and this point is reflected more obviously for B1 than B2; (2) the occurrence of B1’s failure is gradual and B2’s is abrupt, which may result from the occurrence of big spall or crack; (3) the RMS’s values are different as B1 and B2 fail, more than 0.2 for B1 and about 0.13 for B2.
The changes of root mean square over B1’s whole lifetime. (a) Whole lifetime; (b) local enlargement of stage one; (c) local enlargement of stage two. The changes of root mean square over B2’s whole lifetime. (a) Whole lifetime; (b) local enlargement of stage one; (c) local enlargement of stage two.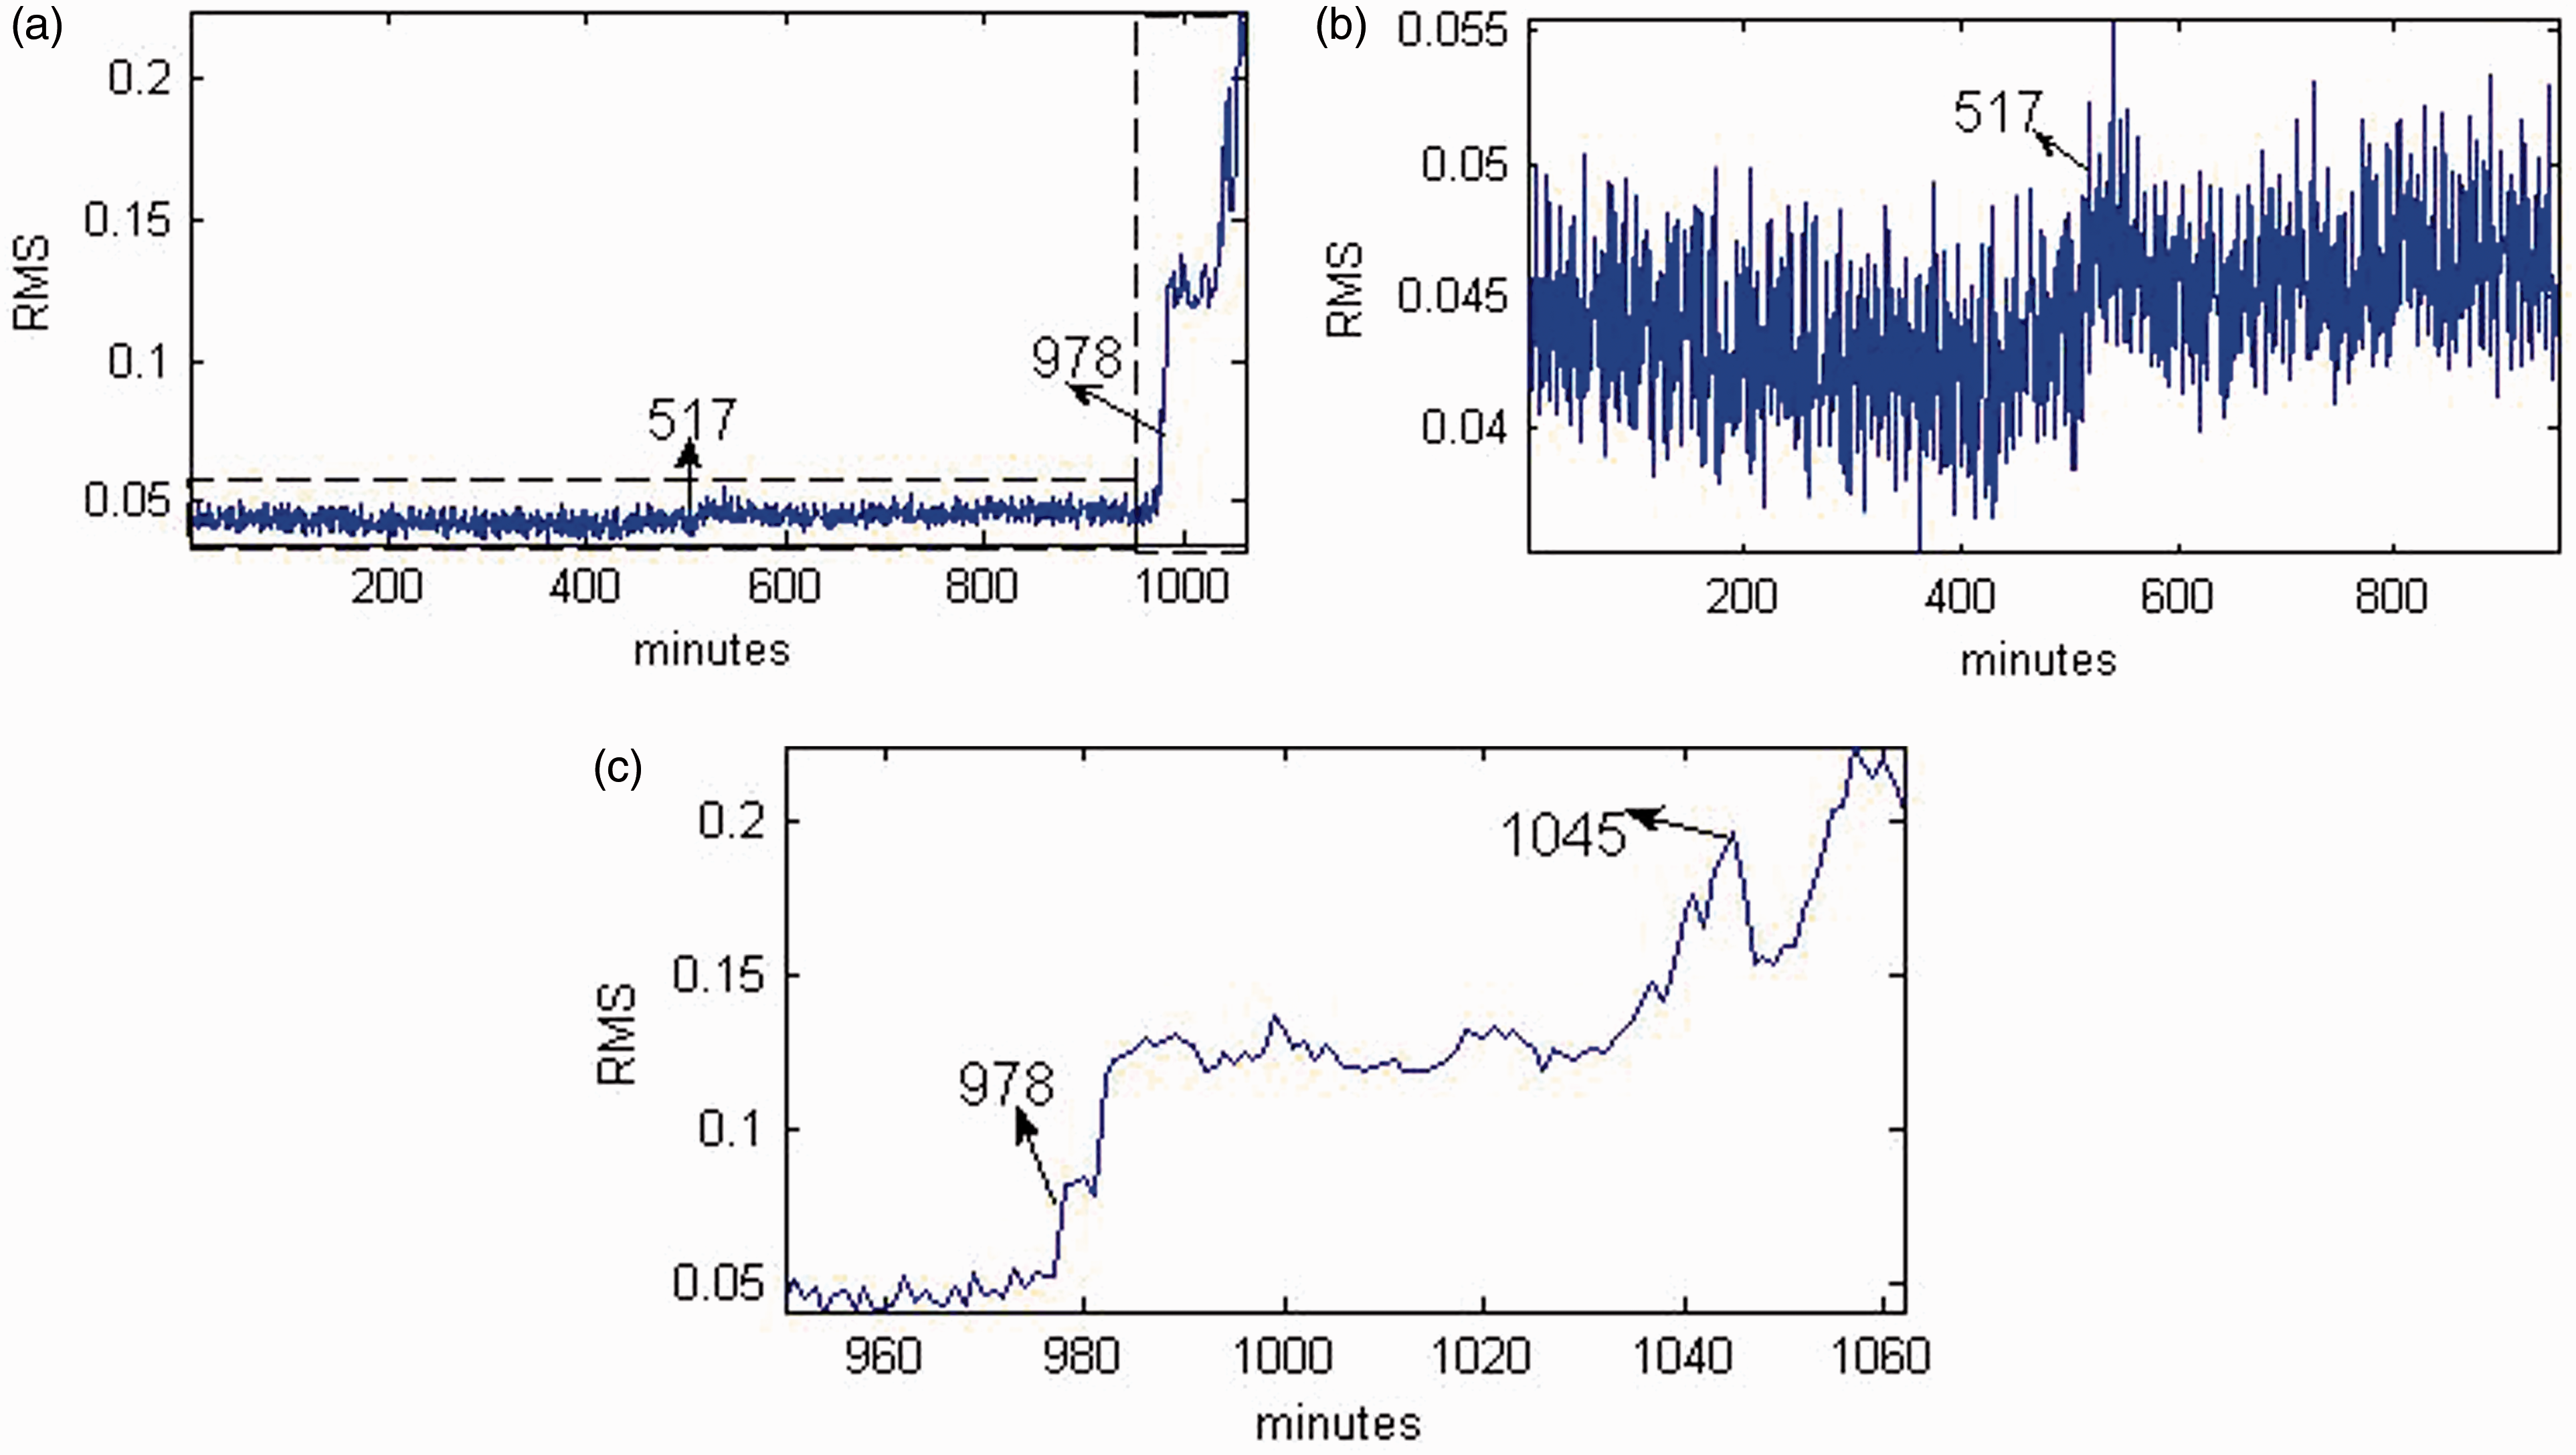
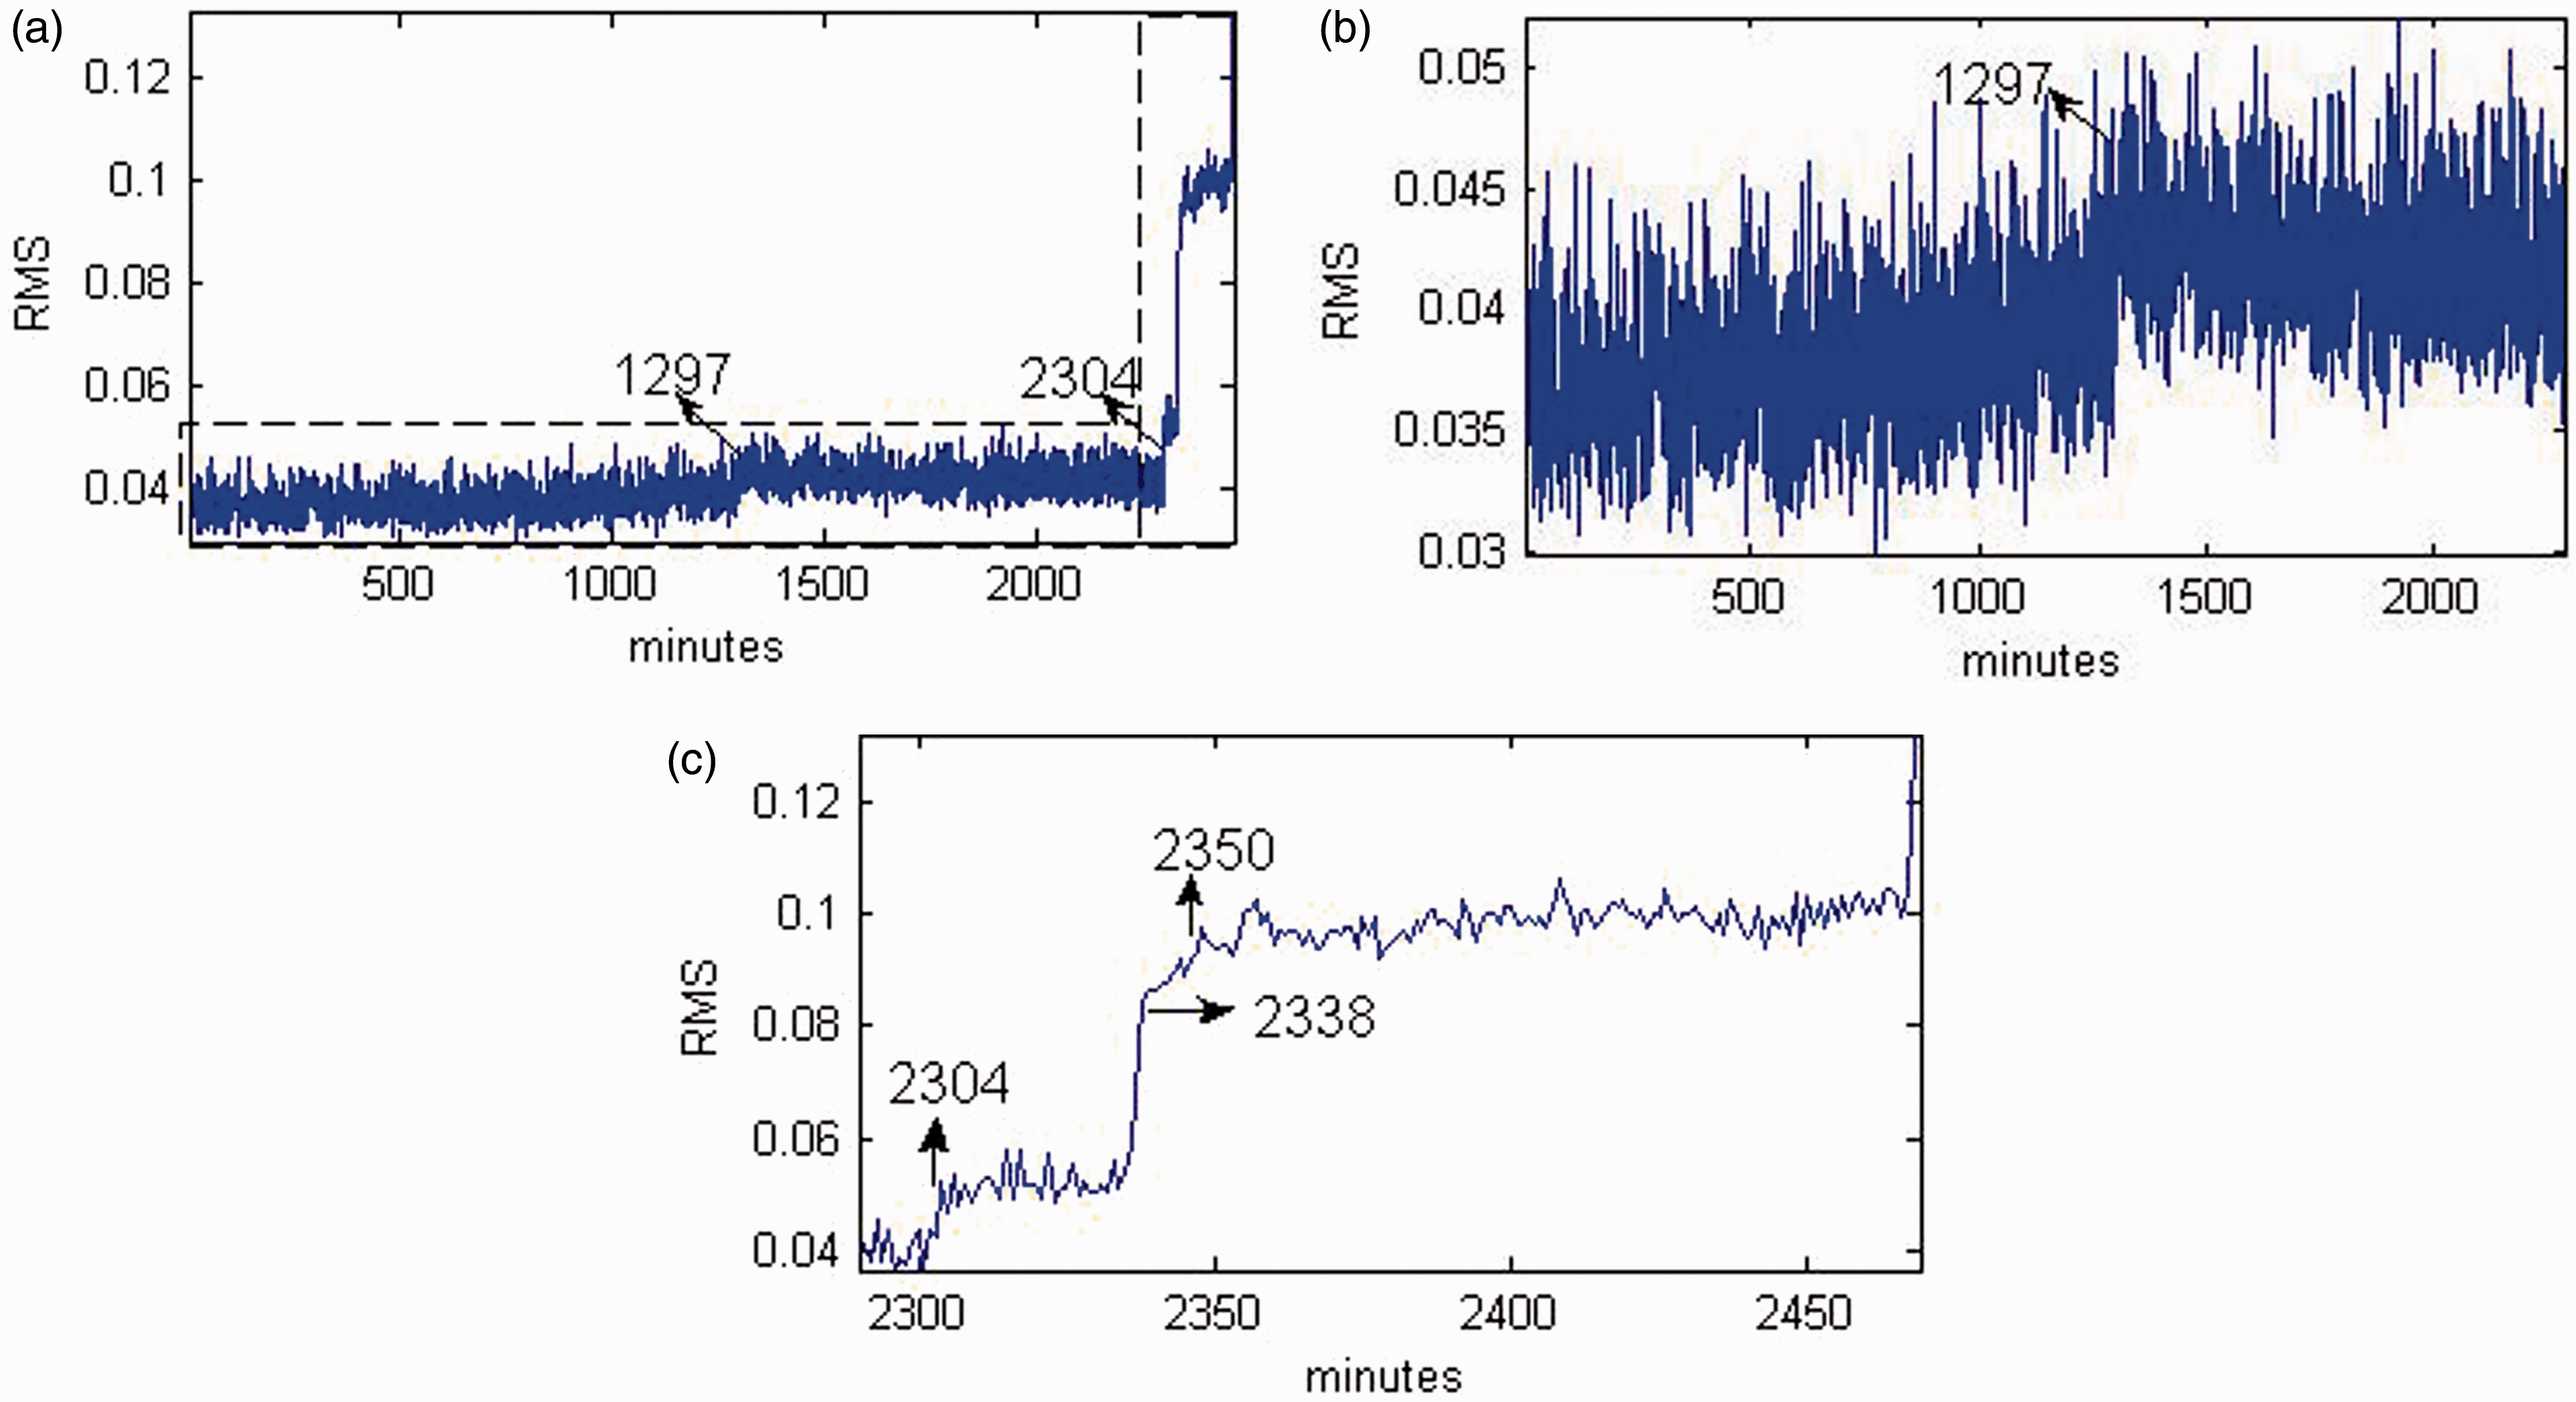
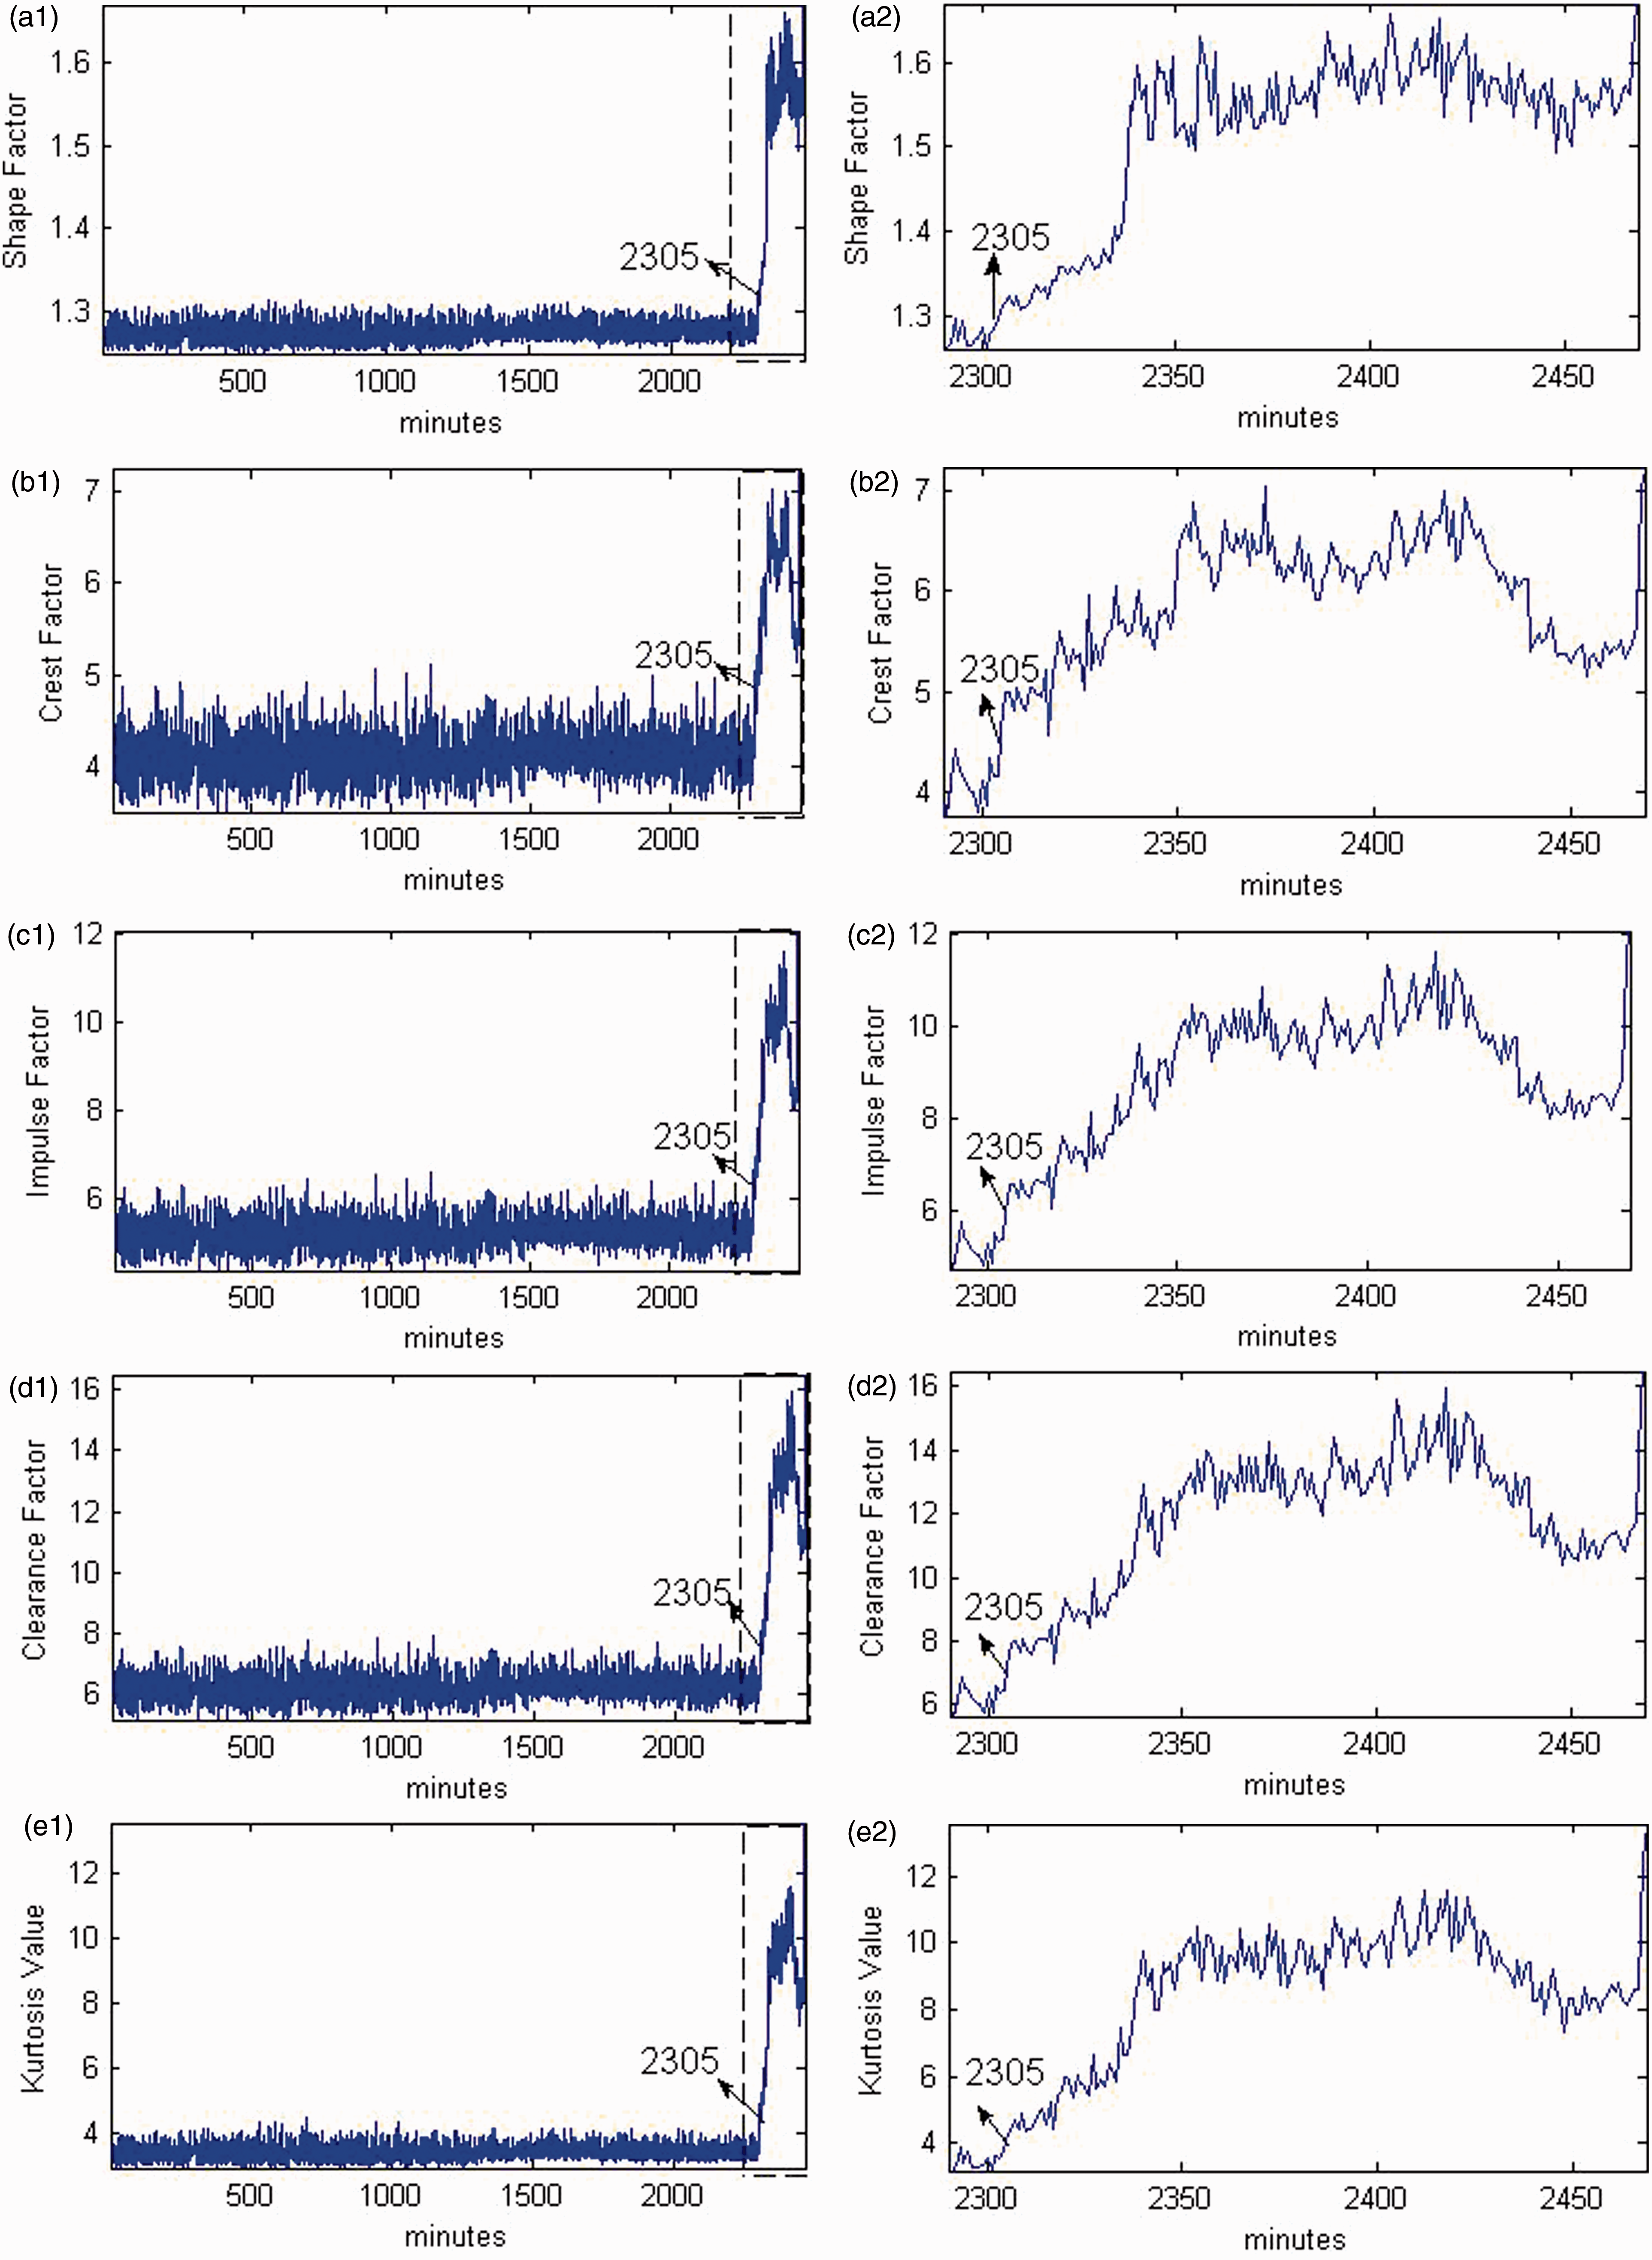
Shape factor, crest factor, impulse factor, clearance factor and kurtosis value are classical statistical indices, and the changes in them throughout B1 and B2’s whole lifetime are shown in Figures 7 and 8. It can be observed that: (1) they cannot reflect the first stage of performance degradation; (2) the variance trends of them are similar, basically in the form of increase-decrease-increase, especially the crest factor, impulse factor, clearance factor and kurtosis value; (3) shape factor is the best among them to reflect the bearing performance degradation process, but the variance ranges is small, about (1.3, 1.7).
The changes of five indices over B1’s whole lifetime. (a1) Shape factor; (a2) local enlargement of (a1); (b1) crest factor; (b2) local enlargement of (b1); (c1) impulse factor; (c2) local enlargement of (c1); (d1) clearance factor; (d2) local enlargement of (d1); (e1) Kurtosis factor; (e2) local enlargement of (e1). The changes of five indices over B2’s whole lifetime. (a1) Shape factor; (a2) local enlargement of (a1); (b1) crest factor; (b2) local enlargement of (b1); (c1) impulse factor; (c2) local enlargement of (c1); (d1) clearance factor; (d2) local enlargement of (d1); (e1) Kurtosis factor; (e2) local enlargement of (e1).
Figures 9 and 10 show the changes of correlation dimension throughout B1 and B2’s whole lifetime, respectively. It can be observed that: (1) the correlation dimension cannot reflect the first stage of performance degradation; (2) the correlation dimension decreases with performance degradation, and this occurs at about 978 minutes for B1 and 2305 minutes for B2; this point is reflected more obviously for B1 than B2; (3) the correlation dimension can reflect B1 and B2’s upper performance degradation process and the occurrence of either B1’s gradual failure or B2’s abrupt failure; (4) the correlation dimension is about 2.5 as B1 and B2 fail; (5) the correlation dimension’s variance range is about (5,2.5), bigger than the shape factor’s.
The changes of correlation dimension over B1’s whole lifetime. (a) Whole lifetime; (b) local enlargement of (a). The changes of correlation dimension over B2’s whole lifetime. (a) Whole lifetime; (b) local enlargement of (a).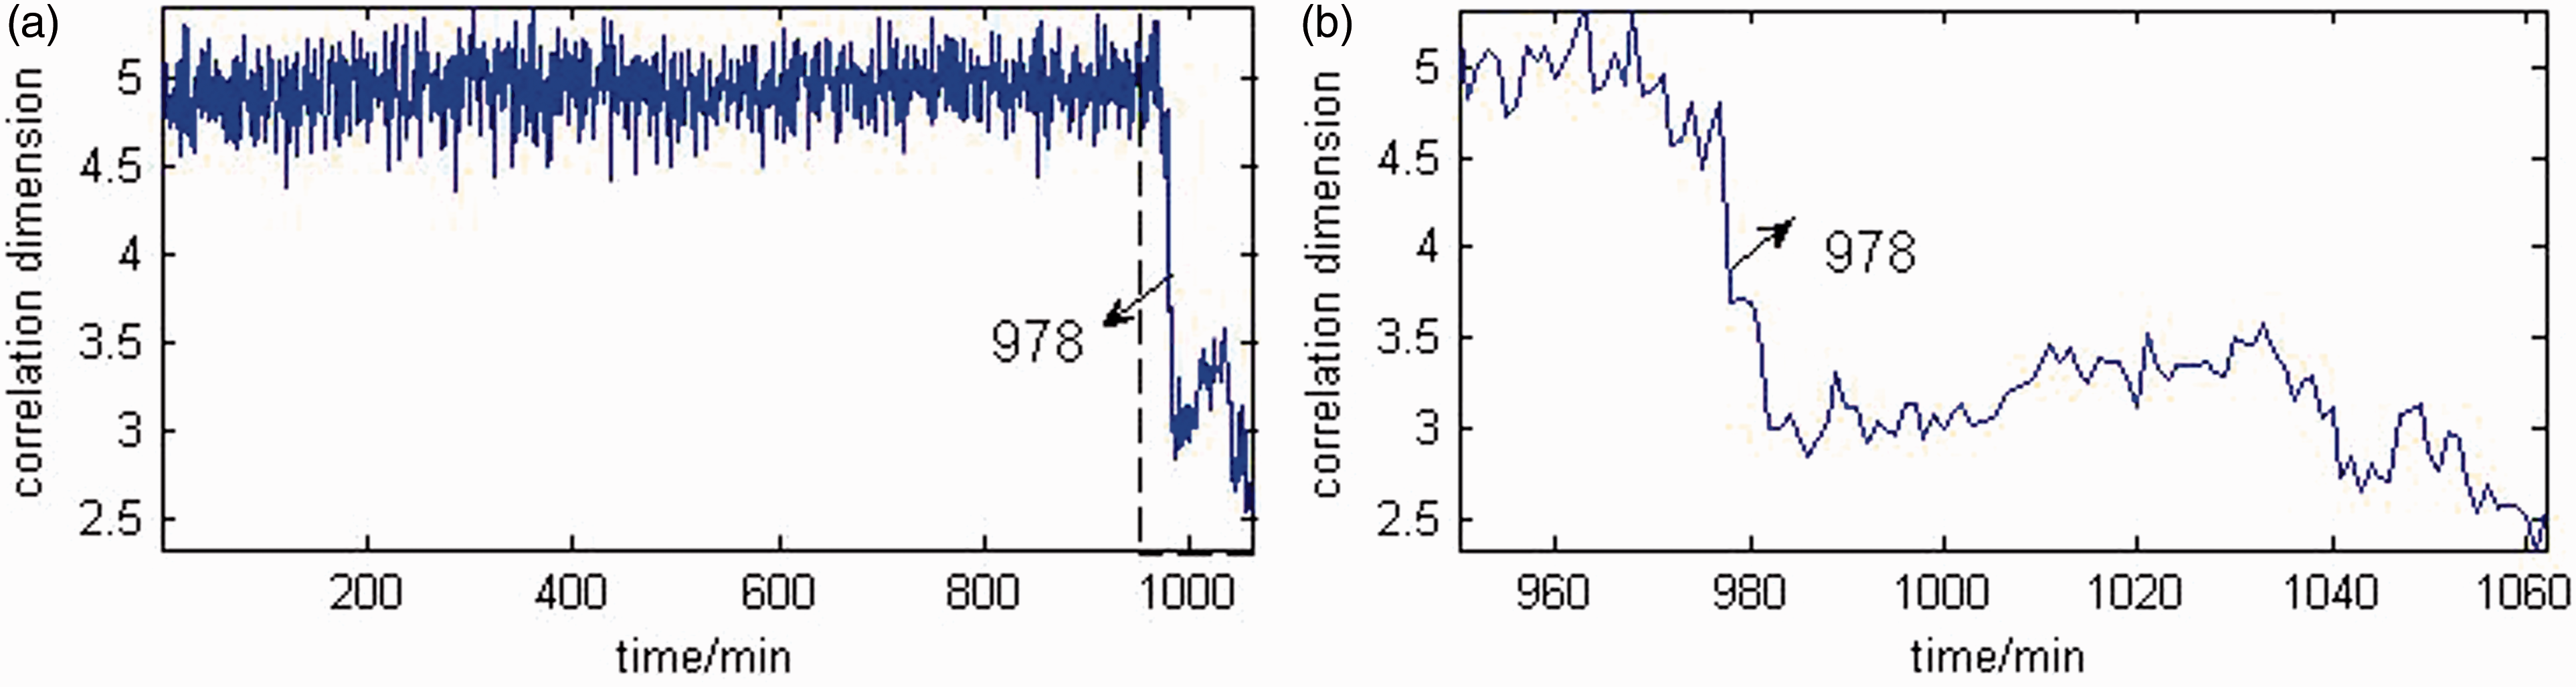
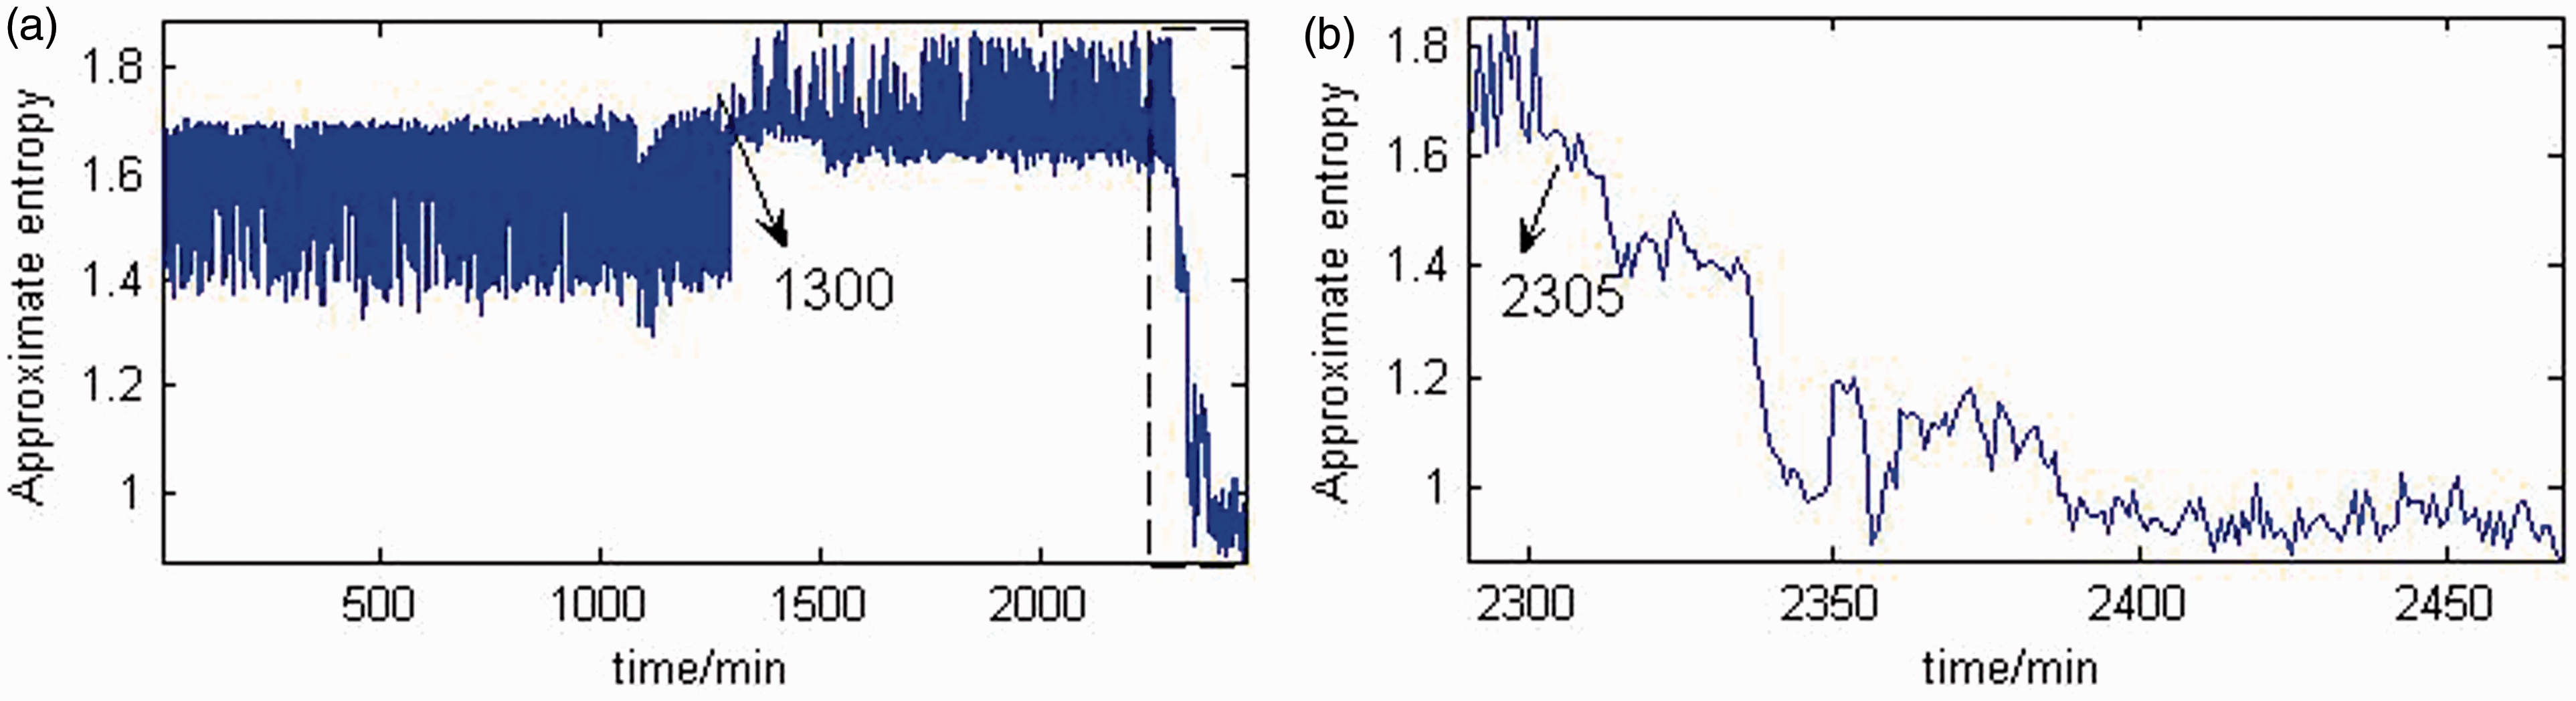
Figures 11 and 12 show the changes of ApEn throughout B1 and B2’s whole lifetime, respectively. It can be observed that: (1) the ApEn can reflect the two stages of B1 and B2’s performance degradation. The first one is the ApEn’s abrupt increase, which occurs at about 513 minutes for B1 and 1300 minutes for B2, though the occurrence of this stage is reflected more obviously than RMS, there is a big fluctuation in the normal state and the first degradation stage. The second one is the ApEn’s gradual decrease, which starts from about 978 minutes for B1 and 2305 minutes for B2, and this point is reflected more obviously for B1 than B2; (2) the ApEn can reflect B1’s gradual failure, but cannot reflect B2’s abrupt failure; (3) the ApEn is about 0.9 as B1 and B2 fail.
The changes of approximate entropy over B1’s whole lifetime. (a) Whole lifetime; (b) local enlargement of (a). The changes of approximate entropy over B2’s whole lifetime. (a) Whole lifetime; (b) local enlargement of (a).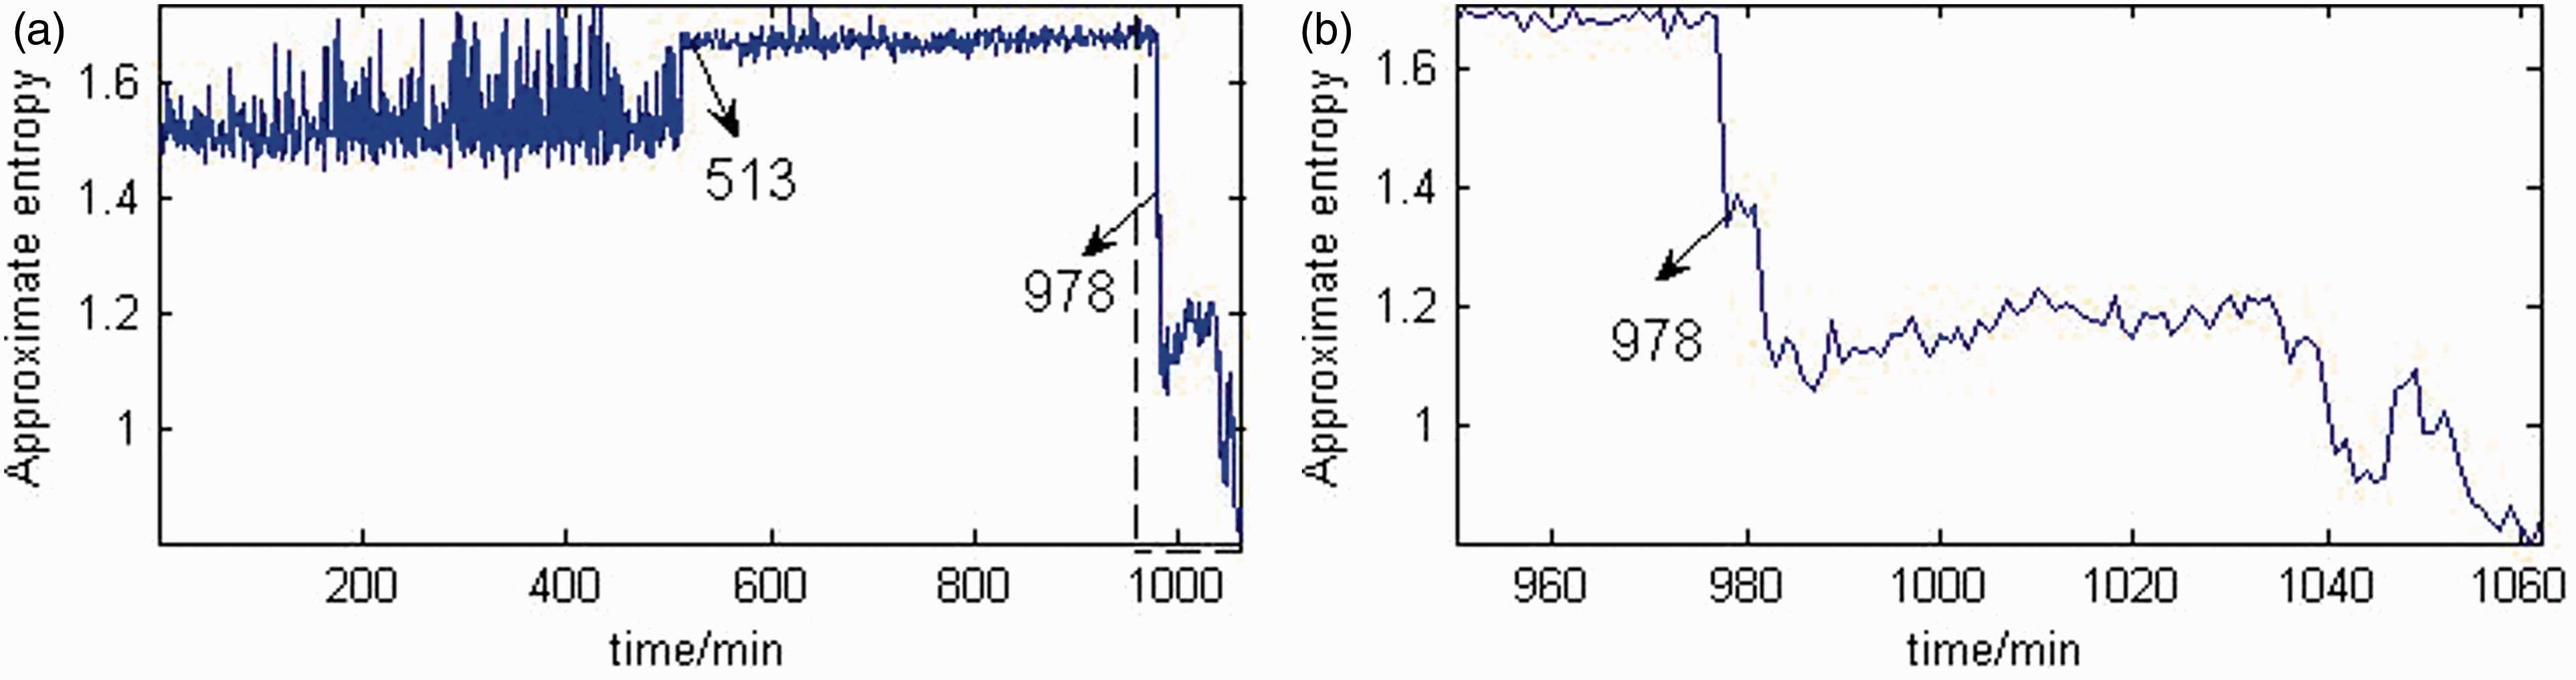
5. Conclusion
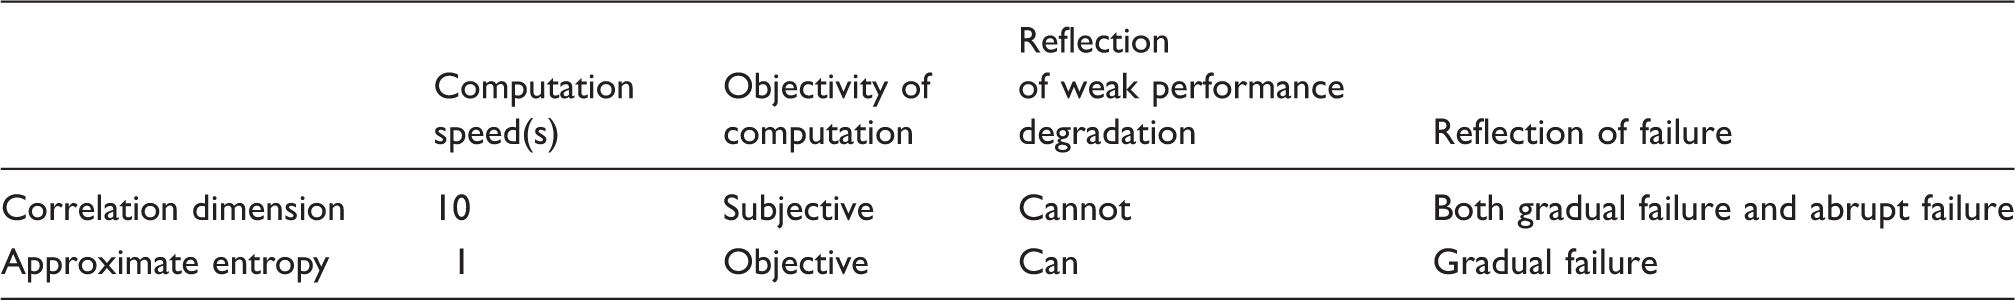
In this study, the complexity of rolling element bearings’ vibration signal is measured by two nonlinear methods: correlation dimension and approximate entropy. These two methods hold some peculiarities: (1) the computation speed of ApEn (the fast algorithm proposed in Bo et al. (1999) is adopted) is faster than the correlation dimension; (2) many parameters should be determined before computing the correlation dimension, which often depends on trial, although many works have been done in this respect. In addition, the linear slope of
The comparison of correlation dimension and approximate entropy.
In addition, it can be concluded from simulation results that low noise level is favorable to improving the correlation dimension and ApEn’s capability of reflecting a rolling element bearing’s defect development, so performing an effective denoising method to original signals before measuring complexity is worthwhile carrying out.
This work applies complexity to bearing performance degradation, the changes throughout a whole lifetime have been described, analyzed and summarized, and comprehensive comparison with RMS, shape factor, crest factor, impulse factor, clearance factor and kurtosis value has been done. The results have shown that the complexity has great potential as an effective index for bearing performance degradation assessment. Further research on complexity, such as combining it with a proper denoising method, cyclostationary analysis, etc., is being done in our group, and some elementary results have been achieved.
Footnotes
Acknowledgements
The authors appreciate the support of Hangzhou Bearing Test & Research Center (HBRC) with the assistance of UNDP/UNIDO (ISO/IEC 17025 Accreditation) in our experiment. The authors also appreciate the work of reviewers and editors.
Funding
The work was supported by the National Natural Science Foundation (approved grant: 50675140), the Excellent Young Teachers Program of Shanghai (approved grant: ZZyy12028) and the SIT Scientific Research Foundation (approved grant: YJ2012-7).