
Abstract
In this study, the use of acoustic absorbent materials specifically felt to mitigate tire cavity resonance noise is presented. The inclusion of a trim in the tire cavity is represented by the addition of the acoustic damping loss factor into the sound pressure response function. In addition, the possible solution of using multilayer trim materials to mitigate the cavity mode effect is presented using the sound absorption coefficient values from the impedance tube experiments and by adopting other empirical models. Moreover, the sound absorption coefficient calculated from the method of electrical-analogy is compared with that from the experimental data and found to be reasonable. Experimental modal analysis was performed to show the effect of inserting an absorbent material (polyfelt) onto the inside surface of the tire where reduction in both the inside cavity sound pressure level and the wheel hub acceleration was observed. A Taguchi analysis is also done to rank the effectiveness of varying trim thickness and mass density as well as adding air gap to suppress tire cavity resonance noise.
1. Introduction
The noise and vibration transmitted from the excitation sources of tire-road interaction and powertrain into the vehicle cabin through the vehicle structure path residing below the 500 Hz frequency range. Within these noise sources, the tire cavity resonance (TCR) has been identified as tonal noise that can be clearly heard inside the vehicle cabin which contributes to the increased level of annoyance. The presence of the tire cavity modal peaks can be detected when the tire is given force or sound excitation. The latest experiment from Feng et al. (2009) showed a split peak phenomenon where a microphone was used and mounted inside the tire cavity when the wheel and tire was rolling. It was observed that there was a side peak in addition to the main peak. The presence of sound absorbent material inside the tire attenuated these peaks. In previous studies, foam or other suitable porous materials filled into the tire cavity would be able to reduce the distinct peak at the first TCR mode (Sakata et al., 1990; Richards, 1991; Haverkamp, 2000; Molisani et al., 2003; Fernandez, 2006; Jessop and Bolton, 2011; Mohamed and Wang, 2015; Mohamed et al., 2013; Wang et al., 2014).
By experiment, Haverkamp (2000) found that filling the mineral fibers into the tire cavity could reduce the transmitted energy by more than 20 dB while Fernandez (2006) showed that placing sound absorbent material with 30–40 cm in thickness inside the tire cavity could reduce the sound pressure level in the cavity by up to 11 dB. According to Fernandez (2006), the inside wall of the tire is hard which would give small acoustic damping (given by the cavity damping loss factor). Adding sound absorbing material can increase the cavity damping loss factor and therefore reduce the magnitude of the resonance. Grazing incidence sound absorption coefficient would best describe the tire cavity damping loss factor, however, since the purpose was to compare between felt materials, the impedance tube result was deemed sufficient. In any case, grazing incidence sound absorption coefficient would be less than normal incidence sound absorption coefficient.
In this work, the use of felt as an alternative solution to mitigate TCR is presented. Even though the method using acoustic absorbent materials has been investigated before, this time the use of felt materials was introduced together with multilayer consideration. Previously, other studies covered other materials such as fiberglass, aluminum and polyurethane foam. Felt materials tested in this study are of low cost, recyclable and commonly adopted as interior trim material for conventional vehicles. Using empirical models and acoustic absorption measurements, it was shown that this material can offer a viable solution to reduce sound pressure level in the tire cavity as well as reduce the wheel hub acceleration which in effect contributes to a reduction in the cabin noise at TCR frequencies. The damping loss factor for several felt samples were calculated by first finding their sound absorption coefficient. Several felt materials were measured for their normal incidence sound absorption coefficient using a two-microphone impedance tube system. For the one type of felt with 20 cm in thickness, the reduction of the sound pressure level at the tire cavity resonance frequency was found to be around 6–10 dB. This reduction is comparable to what was obtained in previous studies using other materials. The reduction of the acceleration at the wheel hub at the tire cavity resonance frequencies was observed. Both the added trim onto the inner surface of the loaded and unloaded tires gave a good suppression of the sound pressure levels at the tire cavity resonance frequencies. The effectiveness of using different multilayer trim thickness and mass density as well as adding air gap was also ranked by the Taguchi analysis.
2. Sound absorption coefficient
Sound absorption coefficient α is proportional to the tire cavity damping loss factor
For tire cavity geometry, Simplified tyre geometry.
For a known sound absorption coefficient α, the damping loss factor of the tire torus cavity added with the trim can be calculated from equation (1). In order to calculate the sound absorption coefficient of the polyfelt trim, the normal acoustic impedance of the trim layer has to be measured by the impedance tube method. The sound absorption coefficient of the polyfelt trim, α can be calculated from the normal acoustic impedance Z by (Attenborough and Vér, 2006)
Six types of porous materials were selected and their sound absorption coefficients were measured using a two-microphone impedance tube system. Details of the measurement are included in the appendix. The sound absorption coefficients for the six different samples are plotted in Figure 2 for the frequency range of 100–800 Hz. Overall, it is seen that Trim 5 has the largest absorption coefficient with comparable values to Trim 1. The sound absorption coefficient around 200–250 Hz was 0.075. The trim thickness played an important role as Trim 1 and 5 were around 20 mm in thickness while other samples were only between 5–10 mm in thickness.
Sound absorption coefficients measured for 6 types of trim.
2.1. Estimation using empirical models
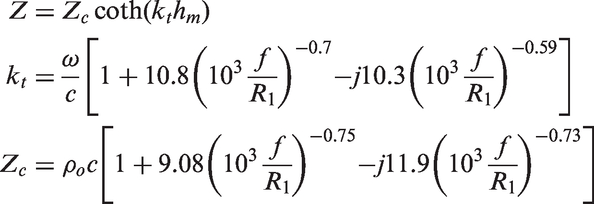
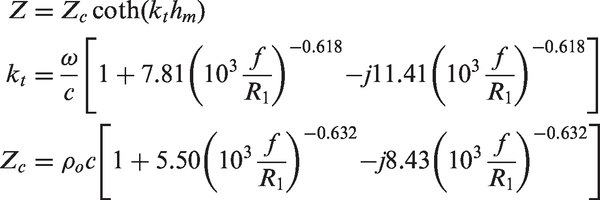
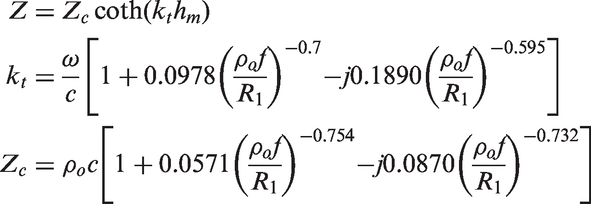
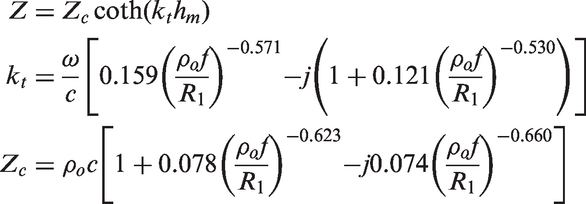
Acoustic properties of porous materials can be estimated using several empirical models found in literature. In the empirical models, the criteria of great importance are the characteristic acoustic impedance and propagation coefficient. Delany and Bazley (1970) used power law functions to present the characteristic acoustic impedance and propagation coefficient for several materials based on numerous impedance tube measurements. Miki (1990) noticed that the Delany-Bazley model gives a negative real part of the surface impedance when computed at low frequencies denoting a non-physical result and hence modified the Delany and Bazley model by correcting the surface impedance behavior. Allard and Champoux (1992) produced an empirical model based on the assumption that the thermal effects are dependent on frequency. Garai and Pompoli (2005) also developed an empirical model to predict the flow resistivity, acoustic impedance and sound absorption coefficient of polyester fiber materials.
According to Delany and Bazley (1970), normal acoustic impedance Z is given by
Allard and Champoux (1992) presented the empirical equations such that
Lastly, Garai and Pompoli (2005) presented a simple empirical model of polyester fibre material according to
Static flow resistivity of Trim 1 and 5 were obtained from another experiment (Egab et al., 2013). The sound absorption coefficients for Trim 1 were calculated using all of the above empirical models and plotted in Figure 3. The formula above are different by their coefficients because each group of the formula was meant for dissimilar types of porous materials based on empirical data. From the plot, it was observed that the empirical model from Garai and Pompoli (2005) would best fit the result from the impedance tube for 100–800 Hz frequency range. Therefore, equation (6) was used for the multilayer trim analysis later on.
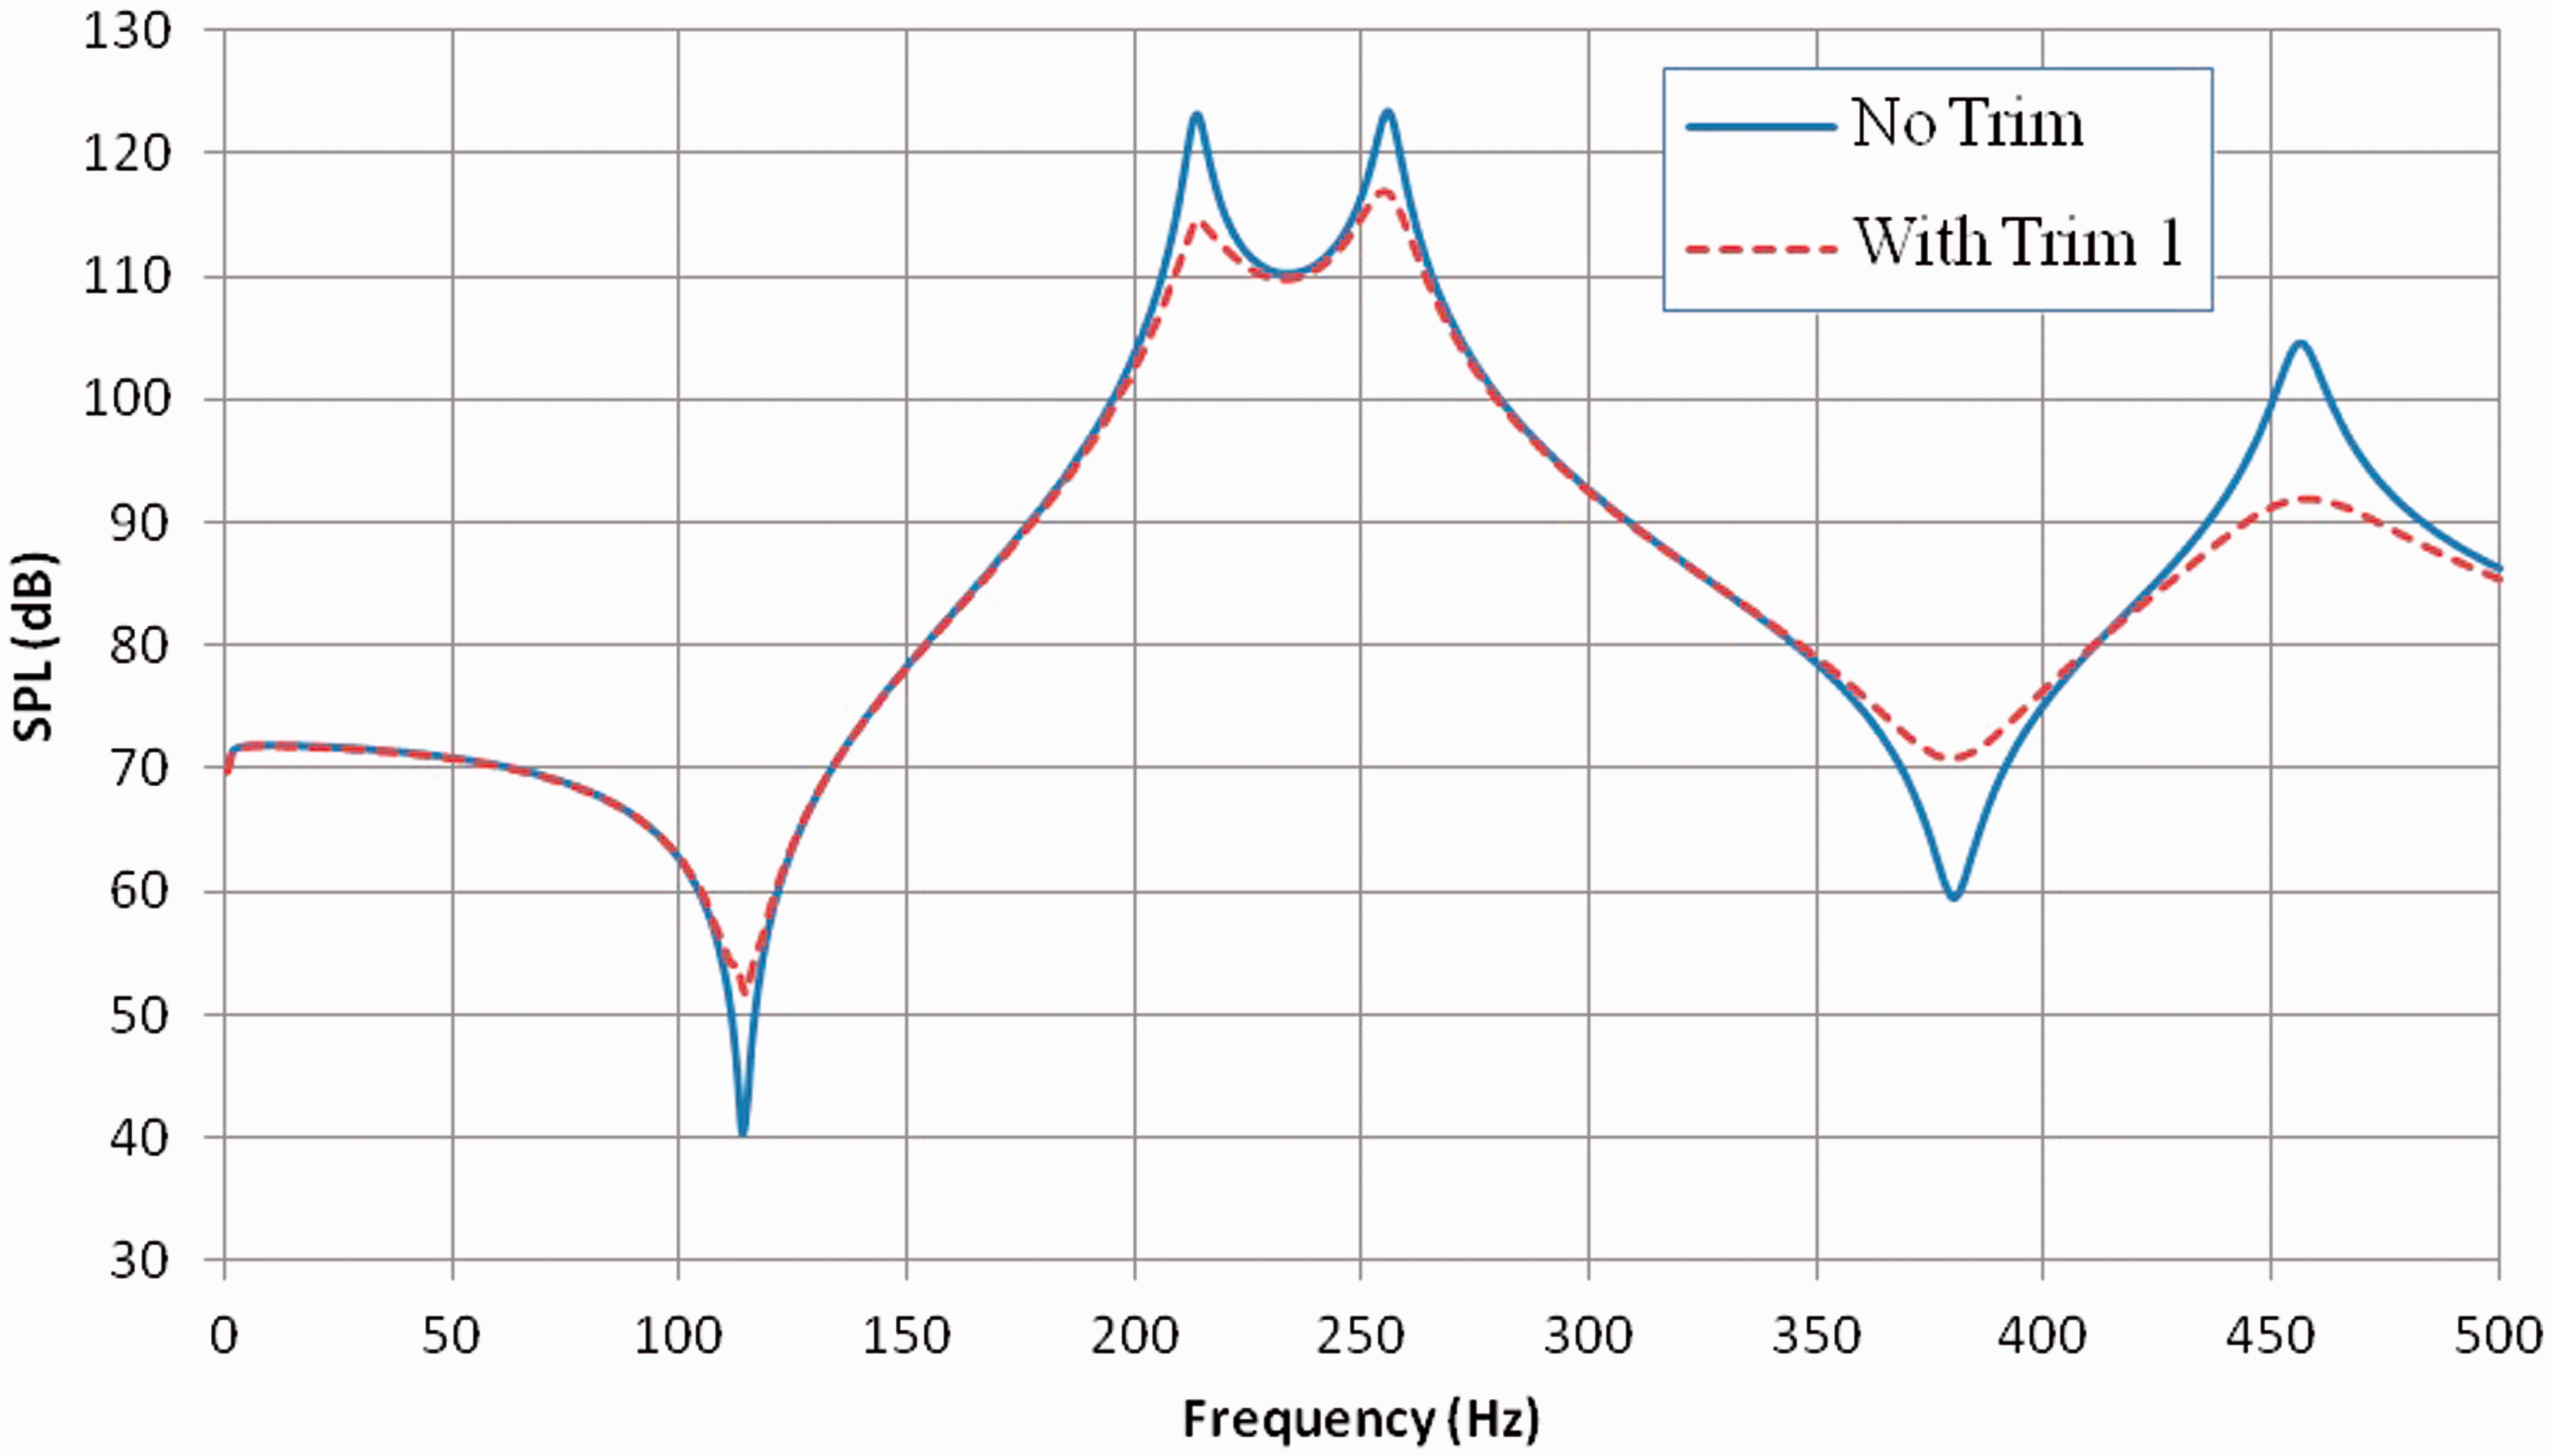
Comparison of measured and predicted sound absorption coefficients in the frequency range of 0–500 Hz (Trim 1). Calculated sound pressure at the toroid cavity point of r = (Ro + Ri)/2, z = W/2, θ = 0 (0–500 Hz).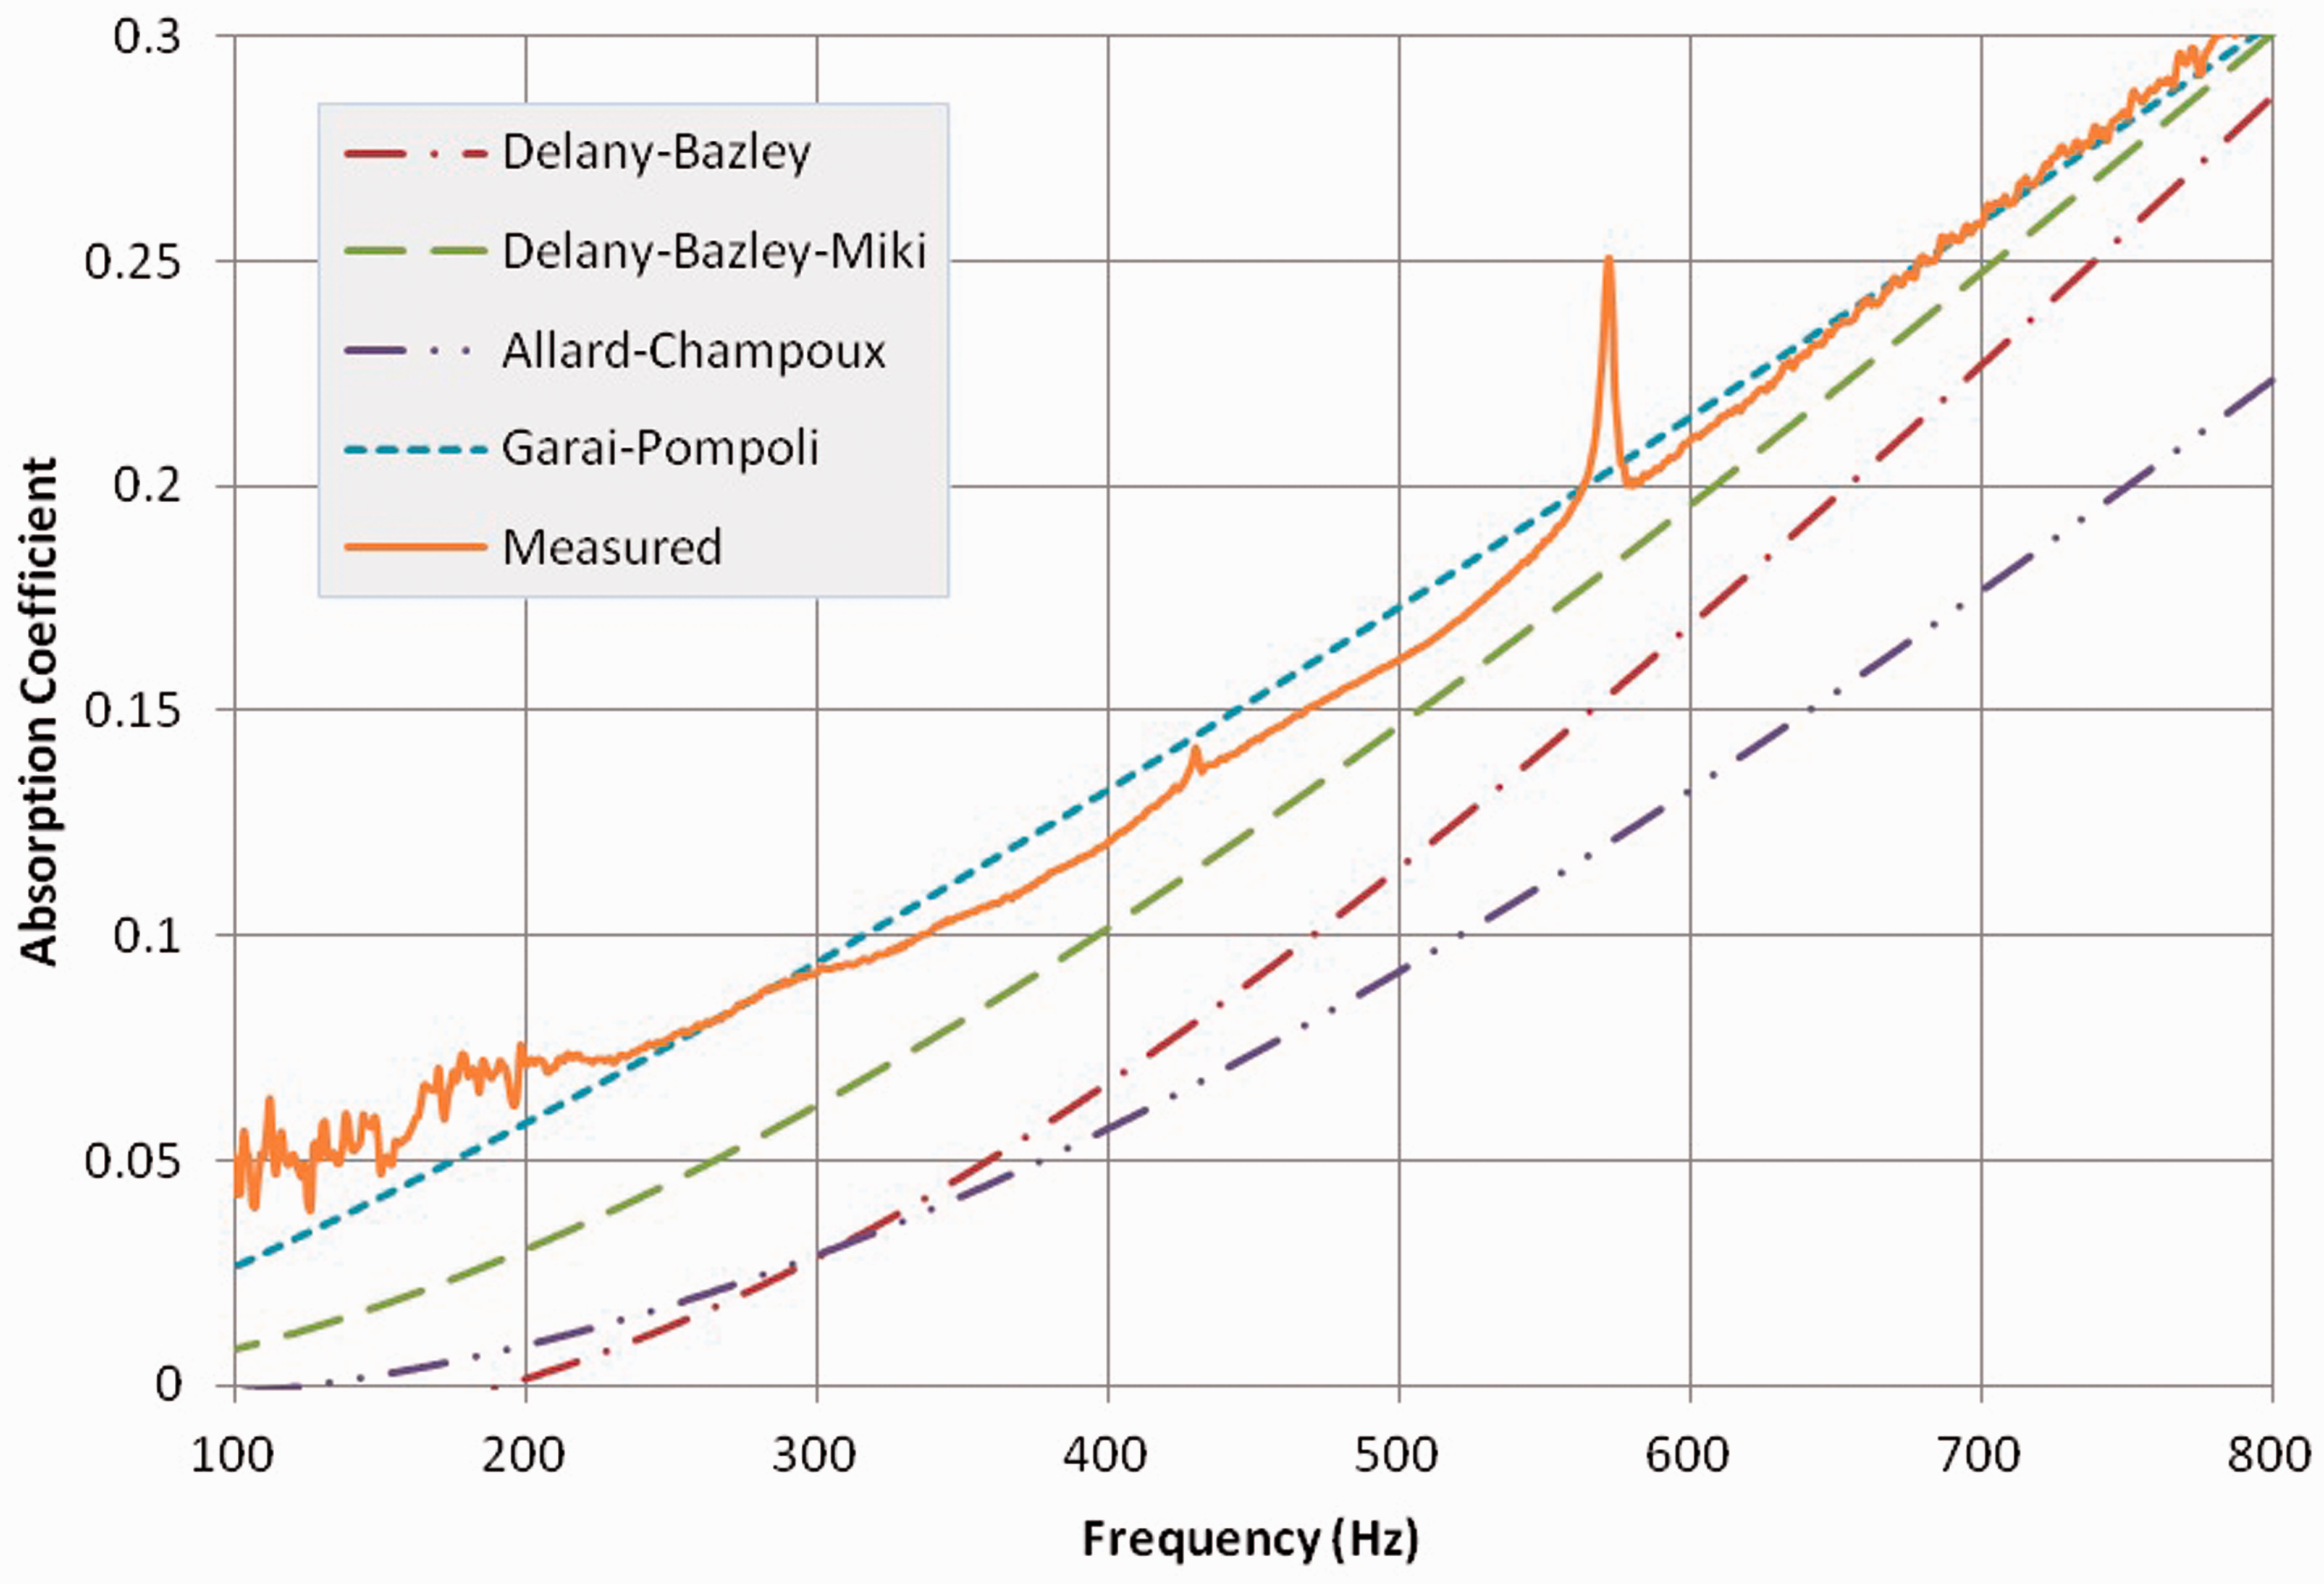
3. Numerical simulation
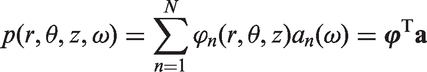
To obtain the acoustic pressure in the tire cavity with the application of the trim, a similar method from Kim and Brennan (1999) and Mohamed et al. (2014) was adopted to calculate the sound pressure level at a point inside the tire cavity. The sound pressure p is given by
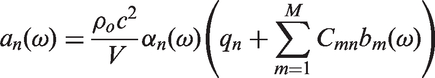
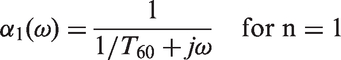
T60 is the reverberation time to 60 dB and
4. Experiment using trim
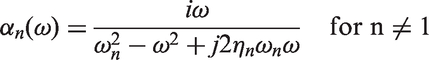
There were studies done to realize the TCR noise mitigation using absorbent materials (Sakata et al., 1990; Haverkamp, 1999; Haverkamp, 2000; Fernandez, 2006). The materials were either fitted onto the rim or attached onto the tire inner surface. Tire acoustic tests were conducted in static and rolling conditions. In this study, it was found that fitting a tire onto a rim is difficult when the rim is attached with trim or absorbent materials. As shown in Figure 5, the material would easily disintegrate during the fitting process because of the limited space on the rim surface. The depression on the rim surface which is often called the rim drop center is designed to make the mounting and dismounting of the tire easy. Therefore, even though it would provide a suitable guide in placing the trim layer, the fitting process would damage the applied trim layer. It was also difficult to know whether the trim layer would be properly seated after the fitment due to the tire bead movement across the rim drop center. Therefore, adding trim material layer onto the rim surface was considered unfeasible in comparison to placing it on the tire inner surface.
Installation of the trim onto the rim and tyre (a) the trim layer on the rim and (b) the trim layer onto the tyre.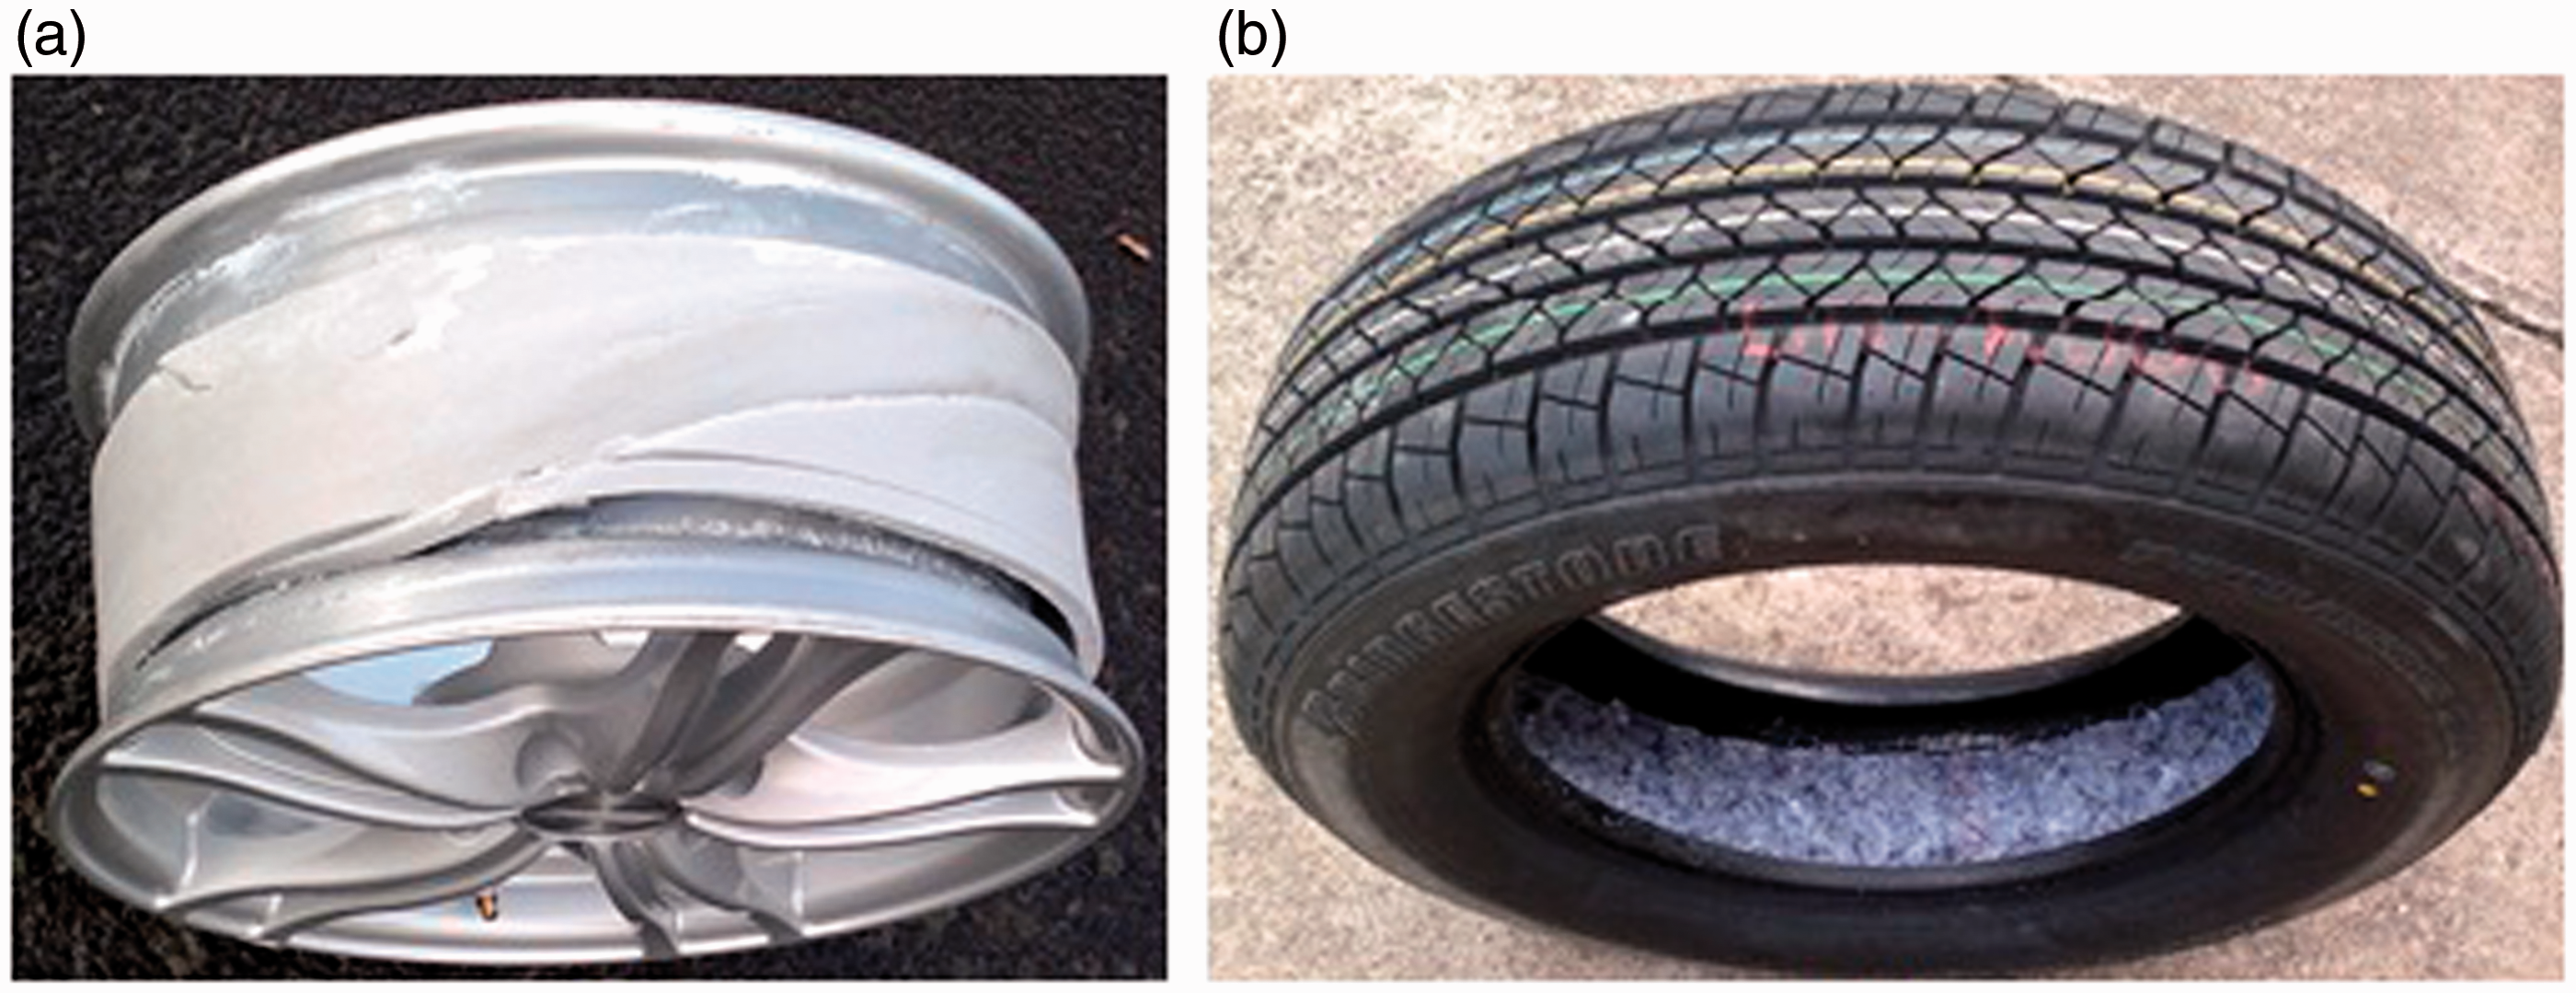
The placement of absorbent materials onto the tire inner surface was done previously but without any guidelines for the attachment method and the detailed parameters of materials. Fernandez (2006) explored various methods to apply noise absorbent materials inside the tire cavity although it was arguable that the method conformed to the tire manufacturer guidelines and specifications. The experiment done in this study was not intended to best reduce the cavity resonance noise effect, but to verify the numerical prediction in the previous section.
4.1. Experimental modal test
Impact modal test was performed for undeformed tire with trim placed on the inside tread area. The experiment description is placed in the Appendix. In the experiment, it was quite difficult to apply the excitation in the same direction of the tire load, the fore-aft mode was chosen as the direction of excitation. The shaker location in either the vertical or fore-aft direction only affects the sound pressure level amplitude for each mode. If the excitation is applied in the vertical direction of the tire (same as the vehicle load direction), the vertical cavity mode will have higher noise amplitude than that of the fore-aft cavity mode. If the excitation is applied in the fore-aft mode, the fore-aft cavity mode will have higher noise amplitude than that of the vertical cavity mode. The effect of trim is regarded the same (in terms of its roles) for both excitation direcions. When installed with the trim layer, the resonance amplitude of the tire-wheel was reduced in comparison to that without the trim layer. In Figure 6, the vibration suppression was very apparent at 226–228 Hz where the cavity resonance peak was not very distinct. Other peaks seen in Figure 9 between 0–150 Hz and around 250 Hz came from the tire structural resonance modes and the steel stand mode respectively.
Tyre-cavity-rim FRF from impact test (with Trim 1).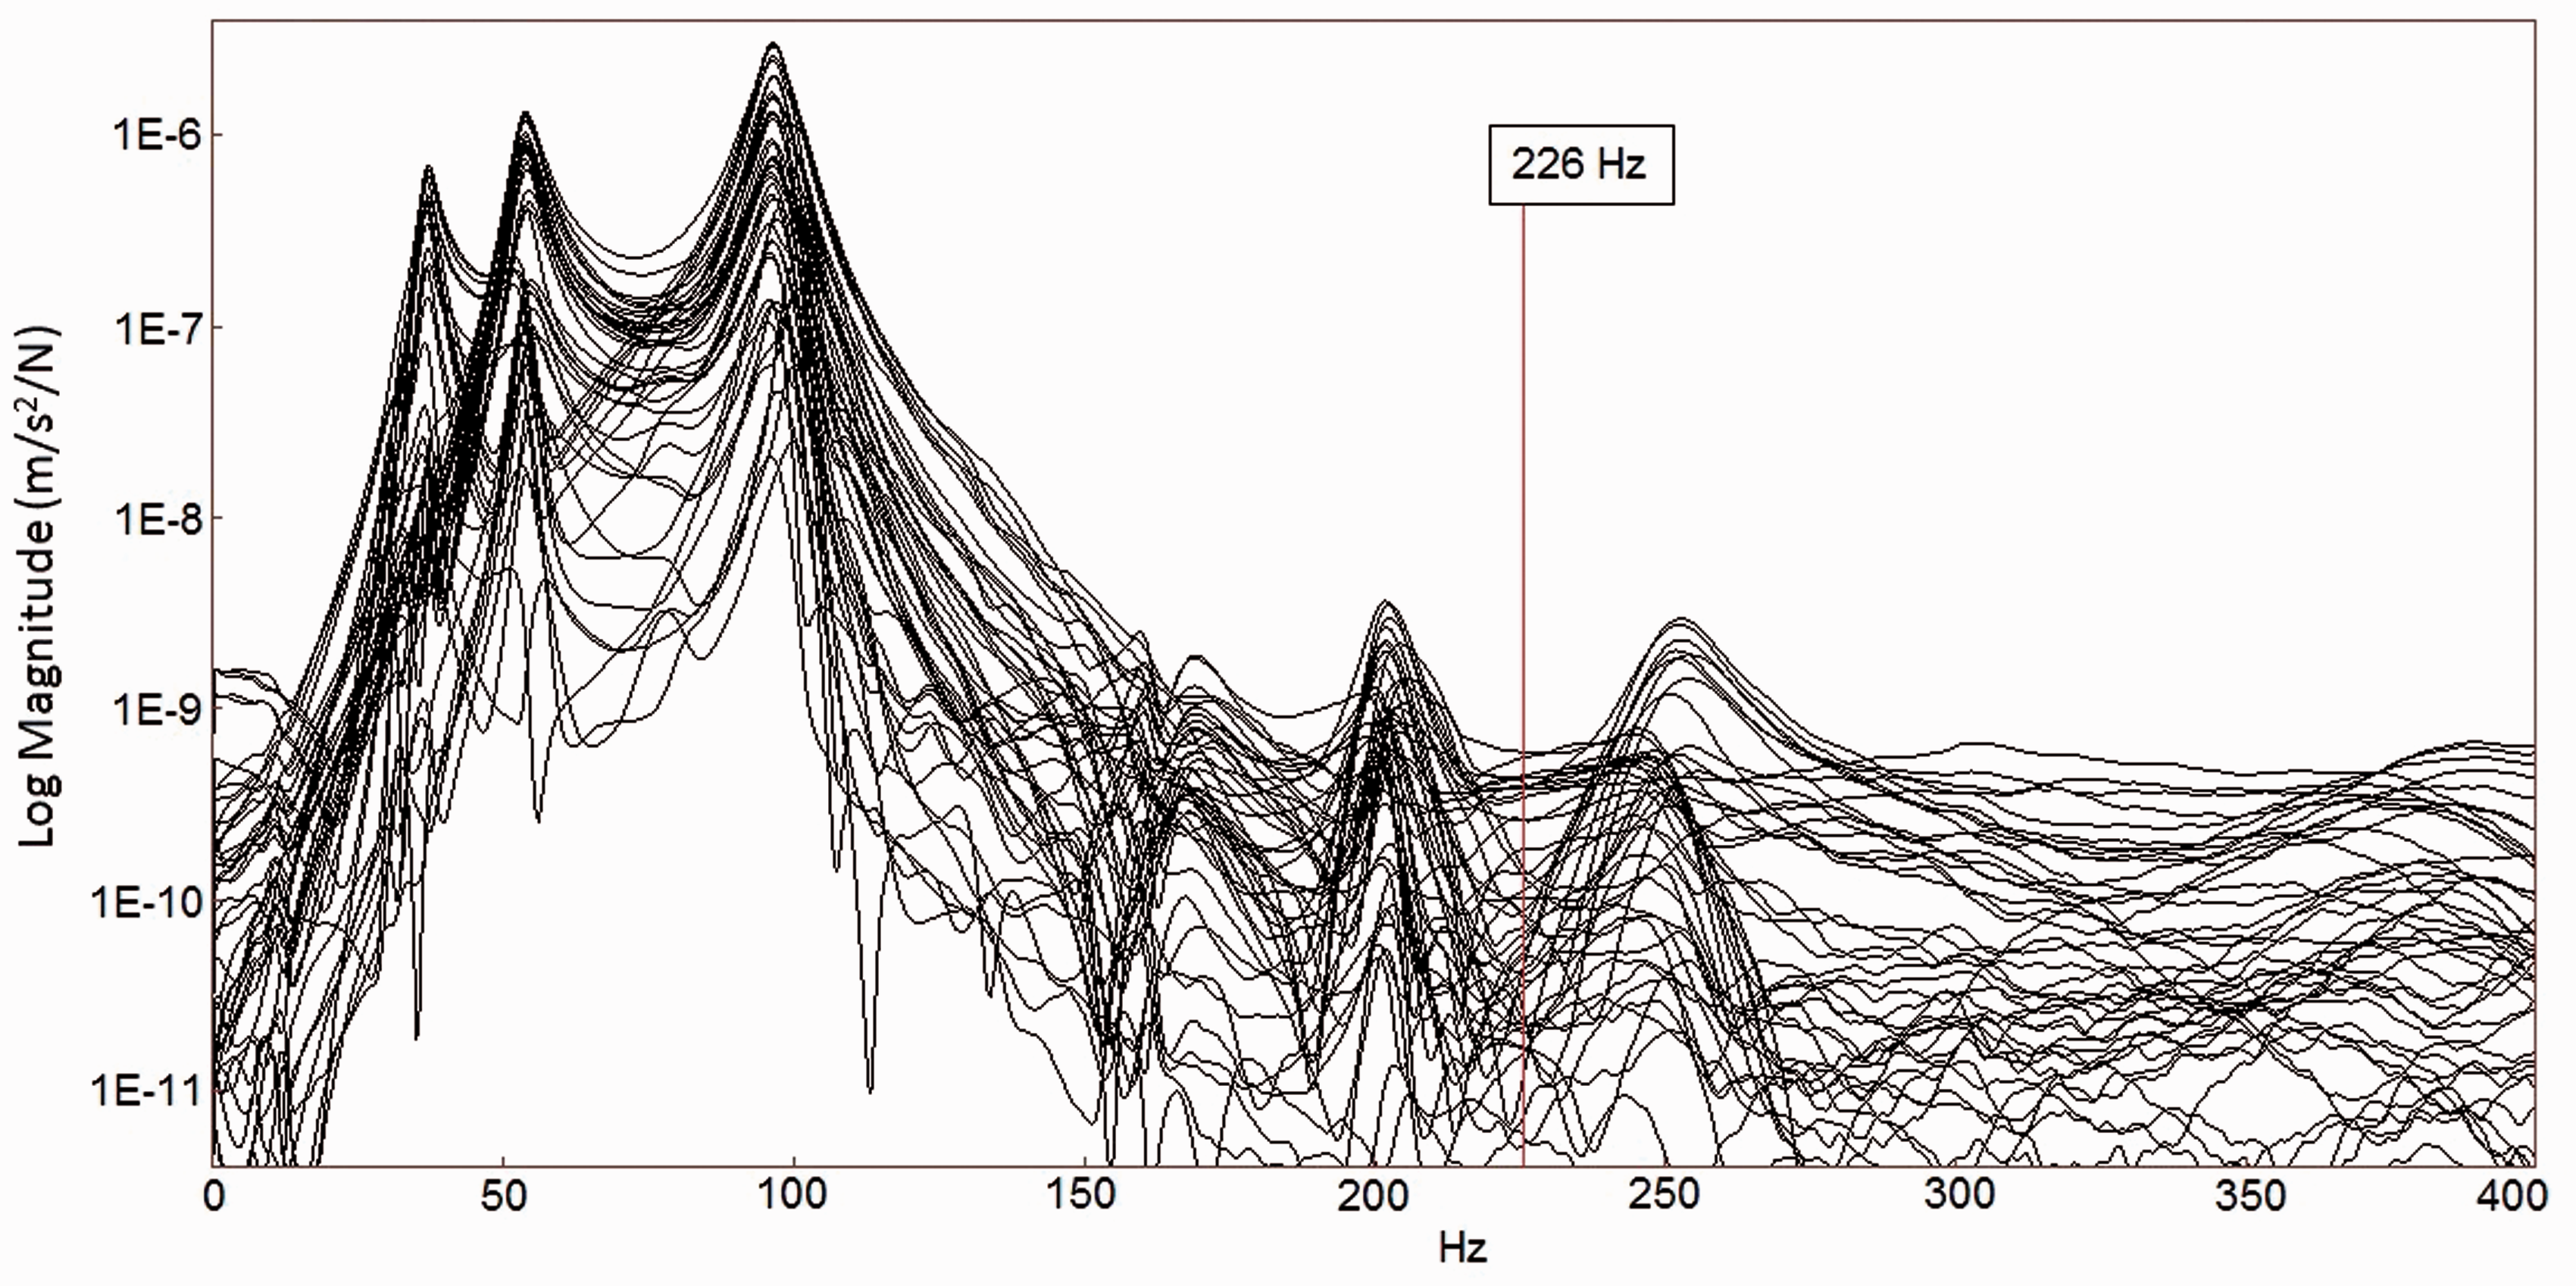
The impact test data were sufficient to describe the characteristic of the cavity resonance without further testing. However, the energy supplied by the impact test may not excite all the structural modes of the tire. The cavity modes may not be able to be excited as well as using the shaker excitation. According to Chittilla et al. (2013), better results were obtained at the frequencies above the first tire cavity modal frequency via the use of an electrodynamic shaker. With the addition of trims, more excitation energy was needed to be able to confirm the difference of the cavity sound pressure amplitude peak before and after the addition of the trim. Therefore, modal tests using shaker excitation were also performed for undeformed and deformed tire. Only the deformed case is shown in the subsequent figure because the undeformed case plot from the shaker test would behave similar to that from the impact test but only with greater accuracy. The experiment setup is included in the appendix. Figure 7 shows the acceleration response for the 30 psi tire inflation pressure where the vertical mode has a higher peak frequency than the fore-aft mode.
Acceleration frequency response function amplitude at the hub for deformed case without trim (——-) and with trim (————–) at 30 psi tyre pressure a) vertical direction and b) fore-aft direction.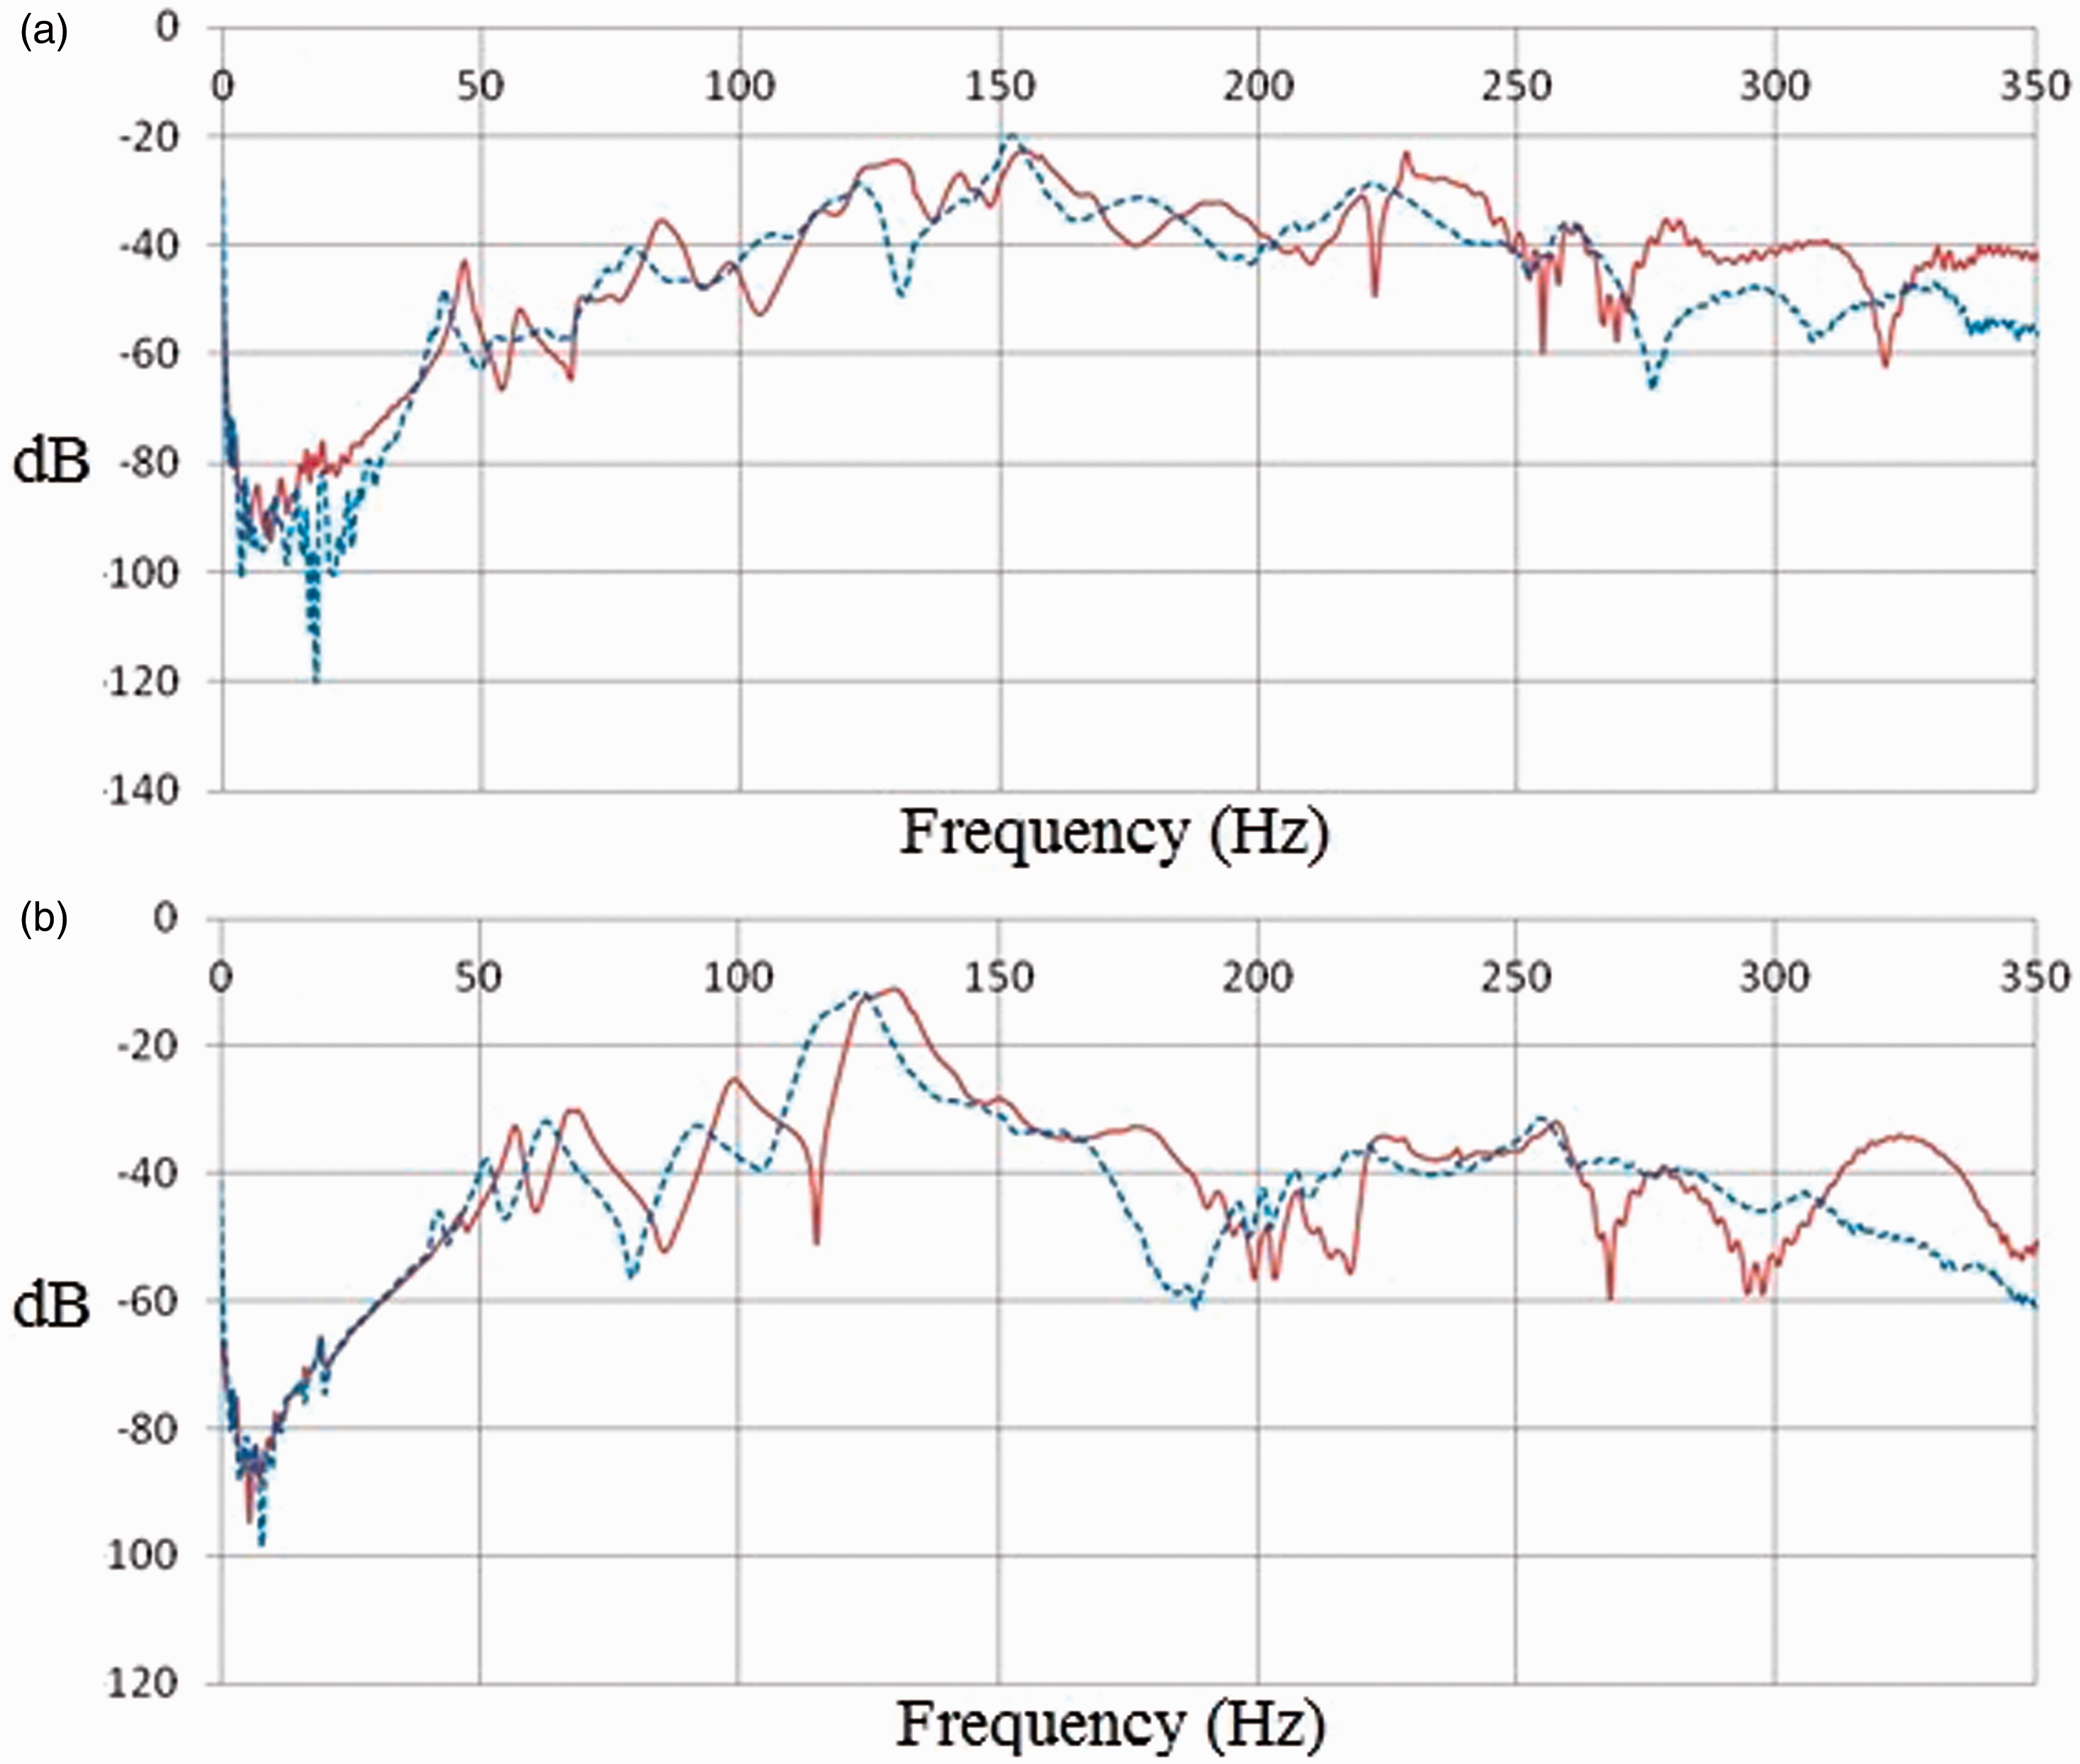
The cavity sound pressure amplitude peak could be seen as a distinct peak at 227 Hz but after the addition of trims, the cavity sound pressure resonance peak was suppressed. For different tire inflations in the experiment, the sound pressure peak frequencies contributed by the tire structural modes were affected, where higher inflation pressure would turn the tire structure to become stiffer and thus changes the structural modal frequency. While the tire inflation pressure does not affect TCR as previously understood, it does contribute to a higher peak magnitude at the cavity mode frequency. The rise in the inflation pressure produces a stiffer tire wall structure and therefore more rigid and effective at reflecting the sound wave. This causes the cavity to have more energy as a result of less energy transfer to the tire structure, and therefore more energy transfer to the hub. Even with the addition of Trim 1, more hub acceleration was measured around 224 Hz at 30 psi than that at 19 psi (Figure 8).
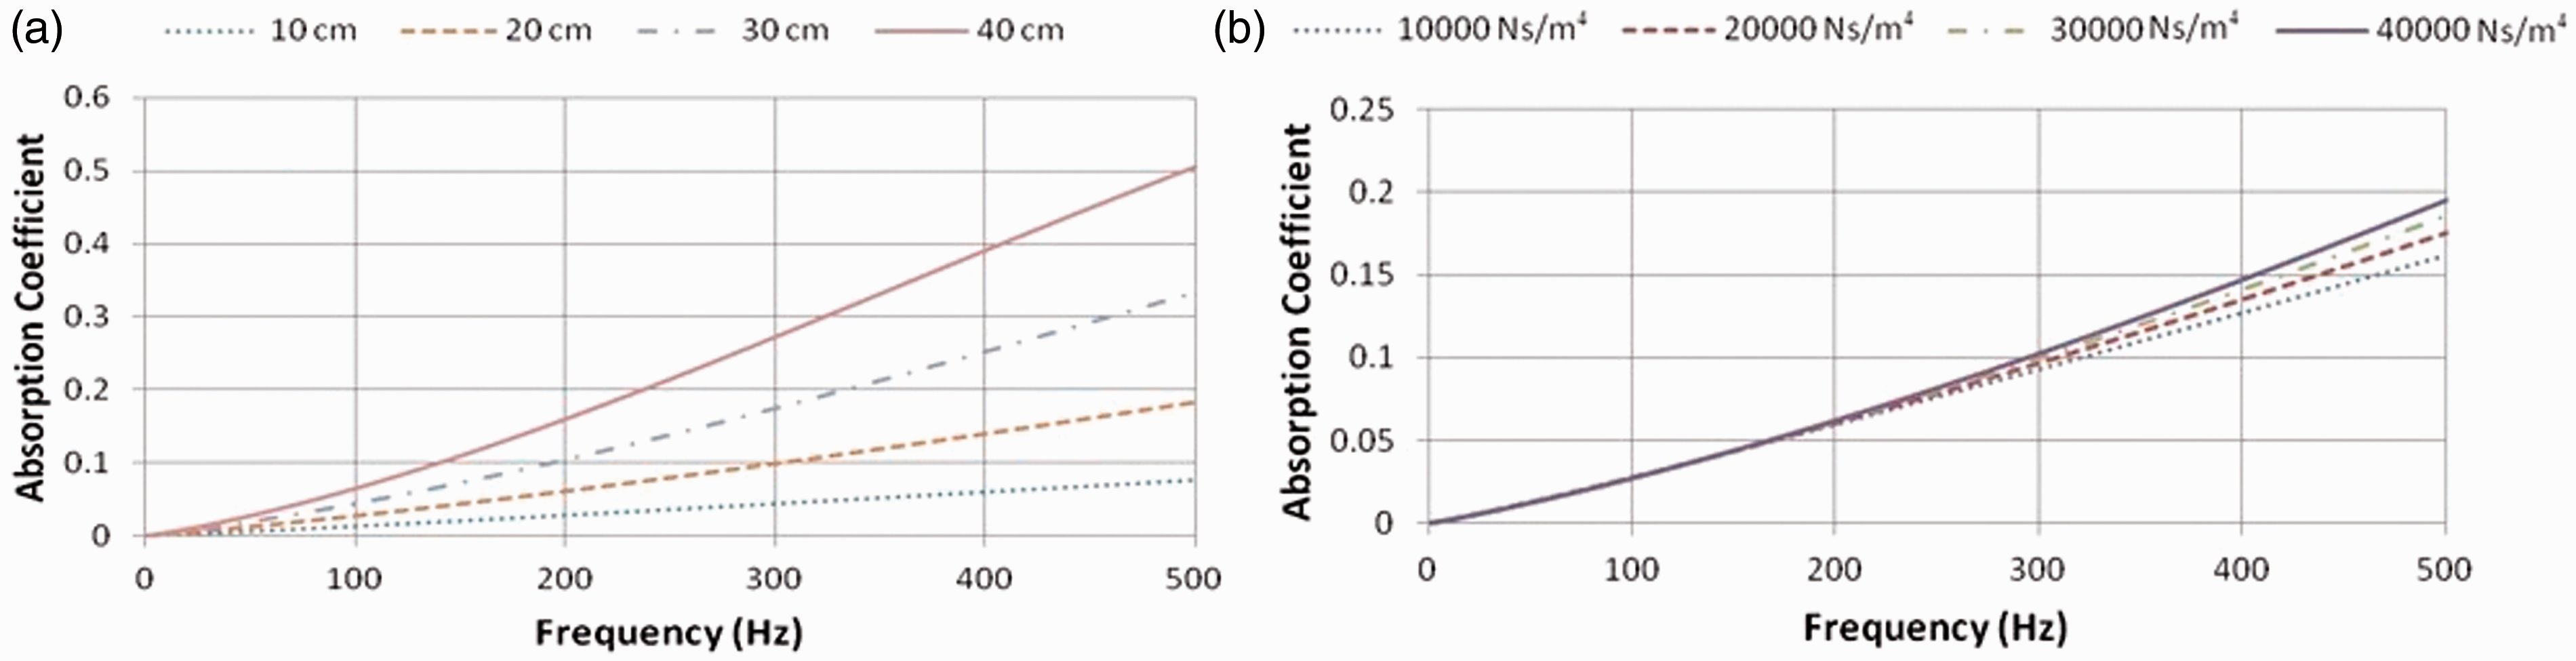
Acceleration frequency response function amplitude curves at the hub for the case of the deformed tyre without trim at tyre pressure of 19 psi (——-) and 30 psi (—————-) a) fore-aft direction and b) vertical direction. a) Absorption coefficients of Trim 1 for various trim thickness and b) absorption coefficients of 20 cm polyfelt for various trim flow resistivity.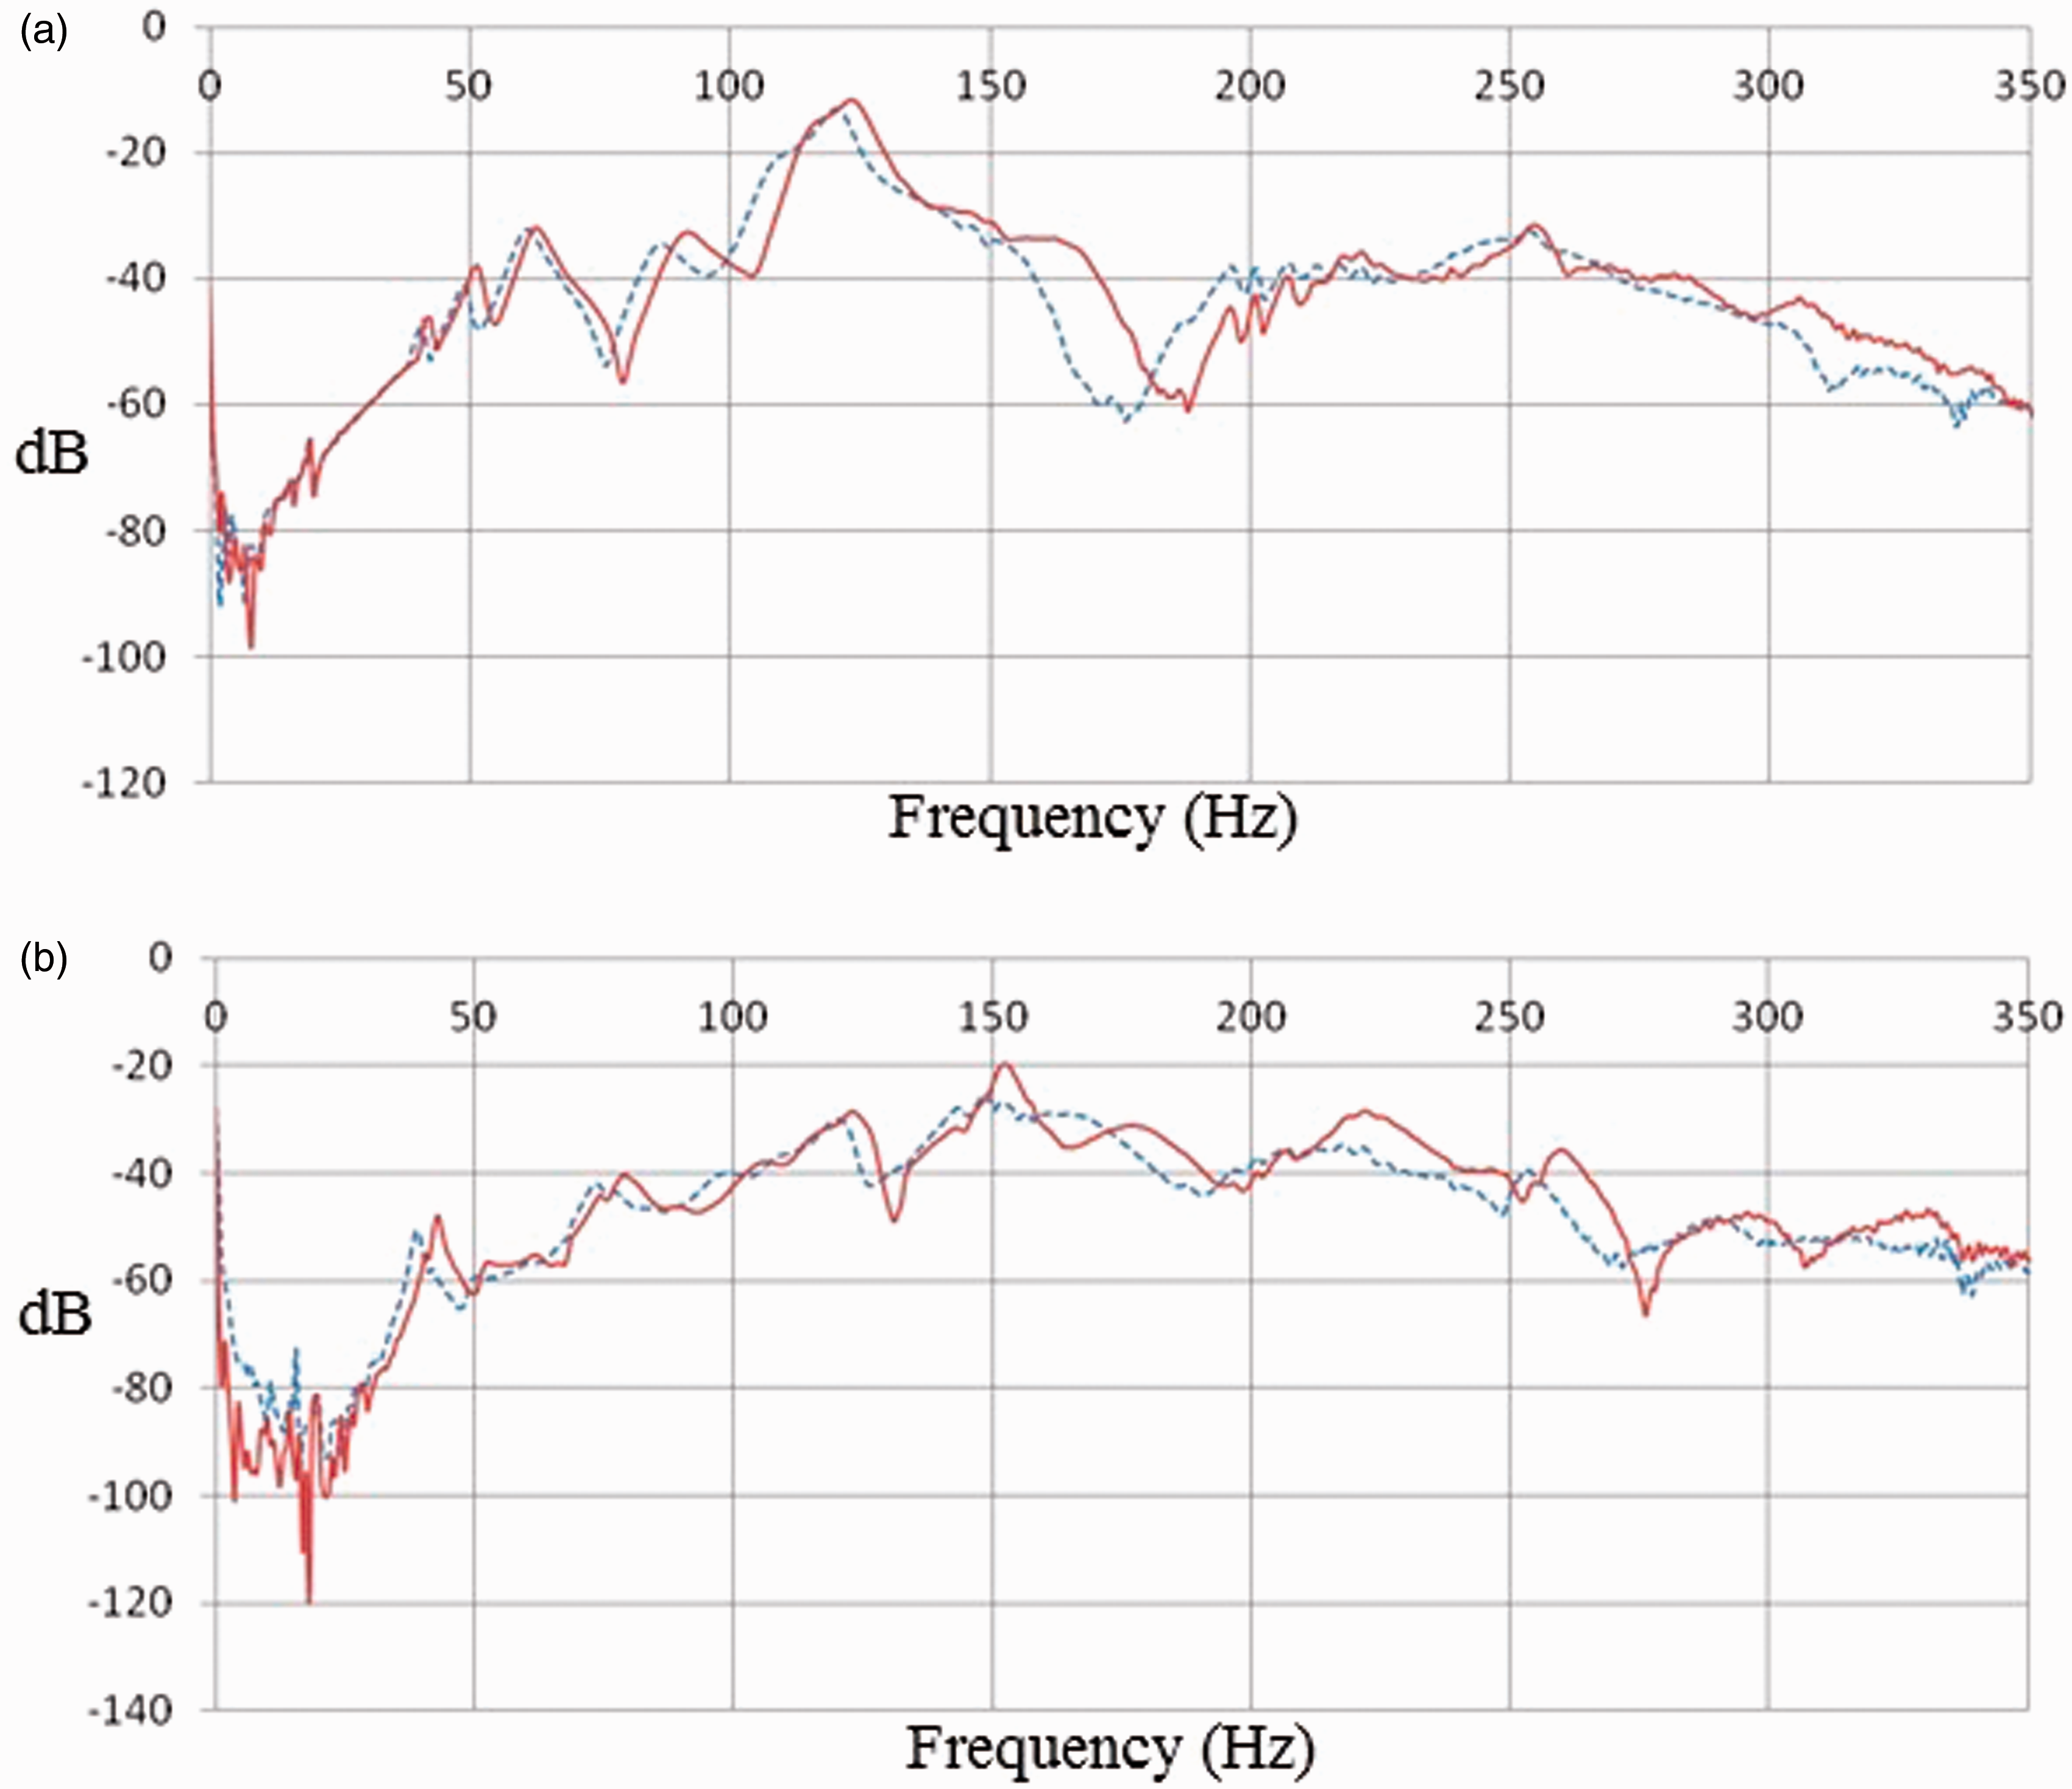
5. Single layer trim parameter
5.1. Effect of trim thickness and flow resistivity
From section 2, it was found that equation (6) was more accurate than others for the trim materials studied. Therefore, this equation was used to predict the sound absorbing performance if the thickness or the flow resistivity were changed. The thickness of Trim 1 was changed from 10 to 40 cm, its absorption coefficient was calculated using equation (6) as illustrated in Figure 9(a). The absorption coefficient showed a linear relationship with the thickness addition. For the same trim thickness of 20 mm, when the flow resistivity increases, which would simulate different types of felt materials, the absorption coefficient increases; but not as large as changing the thickness as shown in Figure 9(a).
5.2. New empirical model for flow resistivity
From the previous section, equation (6) only takes into account the trim thickness and flow resistivity to calculate the normal acoustic impedance. However, the air flow resistivity can only be ascertained from measurement. A new empirical model was proposed in Egab et al. (2013) where they performed a series of experiments to find the air flow resistivity for 14 polyfelt materials and derived the empirical model for the air flow resistivity which can be calculated based on the density and thickness of the polyfelt materials. This empirical model would be advantageous to use for engineers who want to get a quick air flow resistivity value so that the characteristic impedance can be estimated. This new empirical equation is given by
a). Absorption coefficients for polyfelt trim with various thickness while density at 50 kg/m3 and b) absorption coefficients for polyfelt trim with thickness = 2 cm and various densities.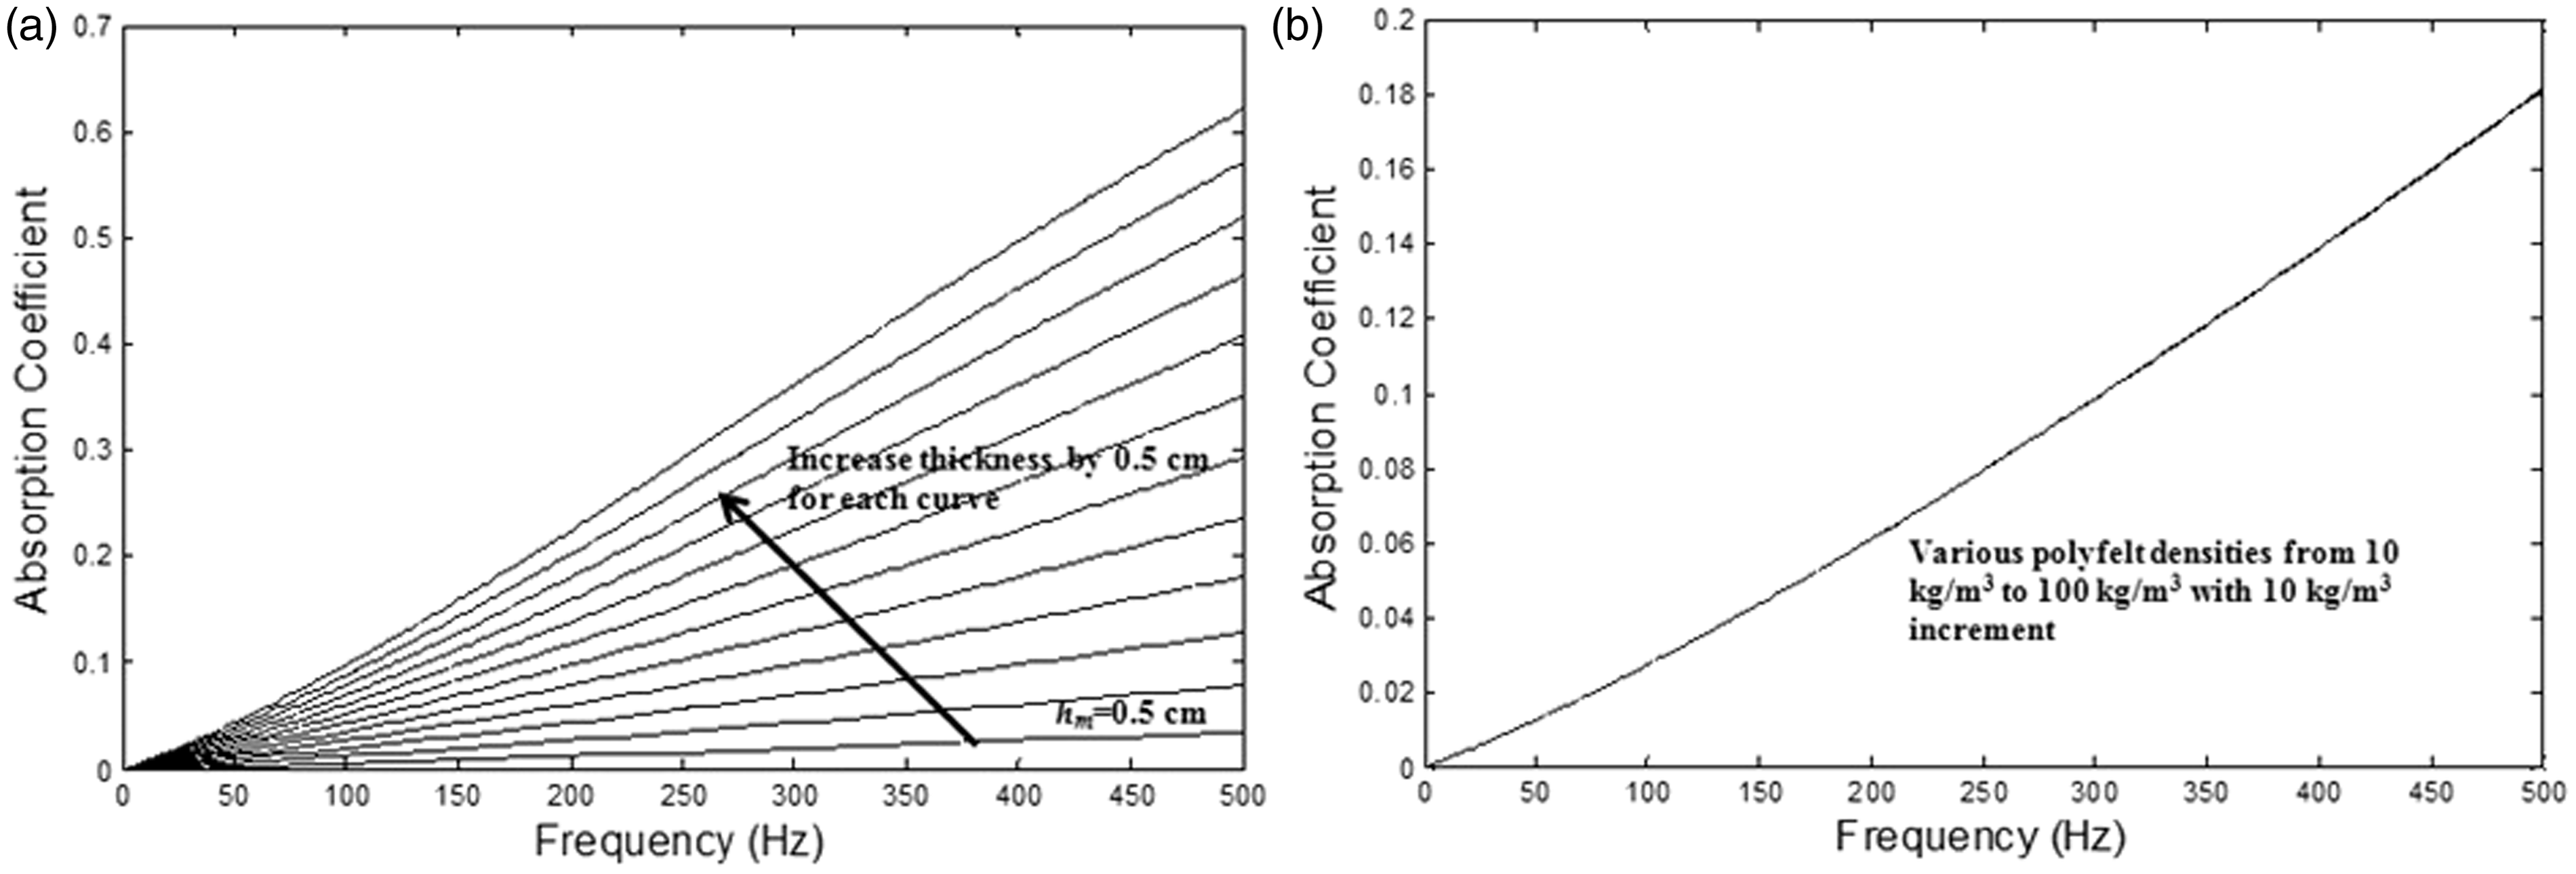
6. Multilayer trim parameter
Multilayer sound absorbers were studied before as an option to optimize noise absorption. From the experimental data in Congyun and Qibai (2005), there were 3 types of absorber tested. The first type was constructed with three layers of perforated panel separated by air gaps. The second type was constructed with three layers of perforated panels separated by porous materials while the third one was the combination of the first and second type. The sound absorption coefficient values for all three types were 0.14–0.17, 0.30–0.40 and 0.70–0.85 respectively in the frequency range of 200–250 Hz. Lee and Chen (2001) also tested multi-layer absorbers where they obtained an acoustic absorber type of good sound absorption coefficient that incorporated all three segments (i.e., perforated plate, porous material and air gap). Providing more length of air gaps and porous materials would generally give higher noise absorption. About the usage of noise absorbent materials inside the tire, it is preferred that the materials are thin and durable. Therefore, the minimum number of layers with the highest absorption coefficient should be sought.
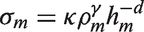
Perforated plates, porous materials and air gaps are commonly combined for sound absorption. As in Delany and Bazley (1970) and Lee and Chen (2001), the acoustic impedance of the mth perforated plate layer is given as
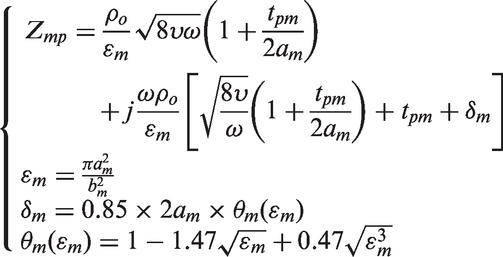

The acoustic impedance of the nth layer air gap backed by a rigid wall is given by Example of a multi-layer trim arrangement with perforated plate and its analogy to electrical impedance.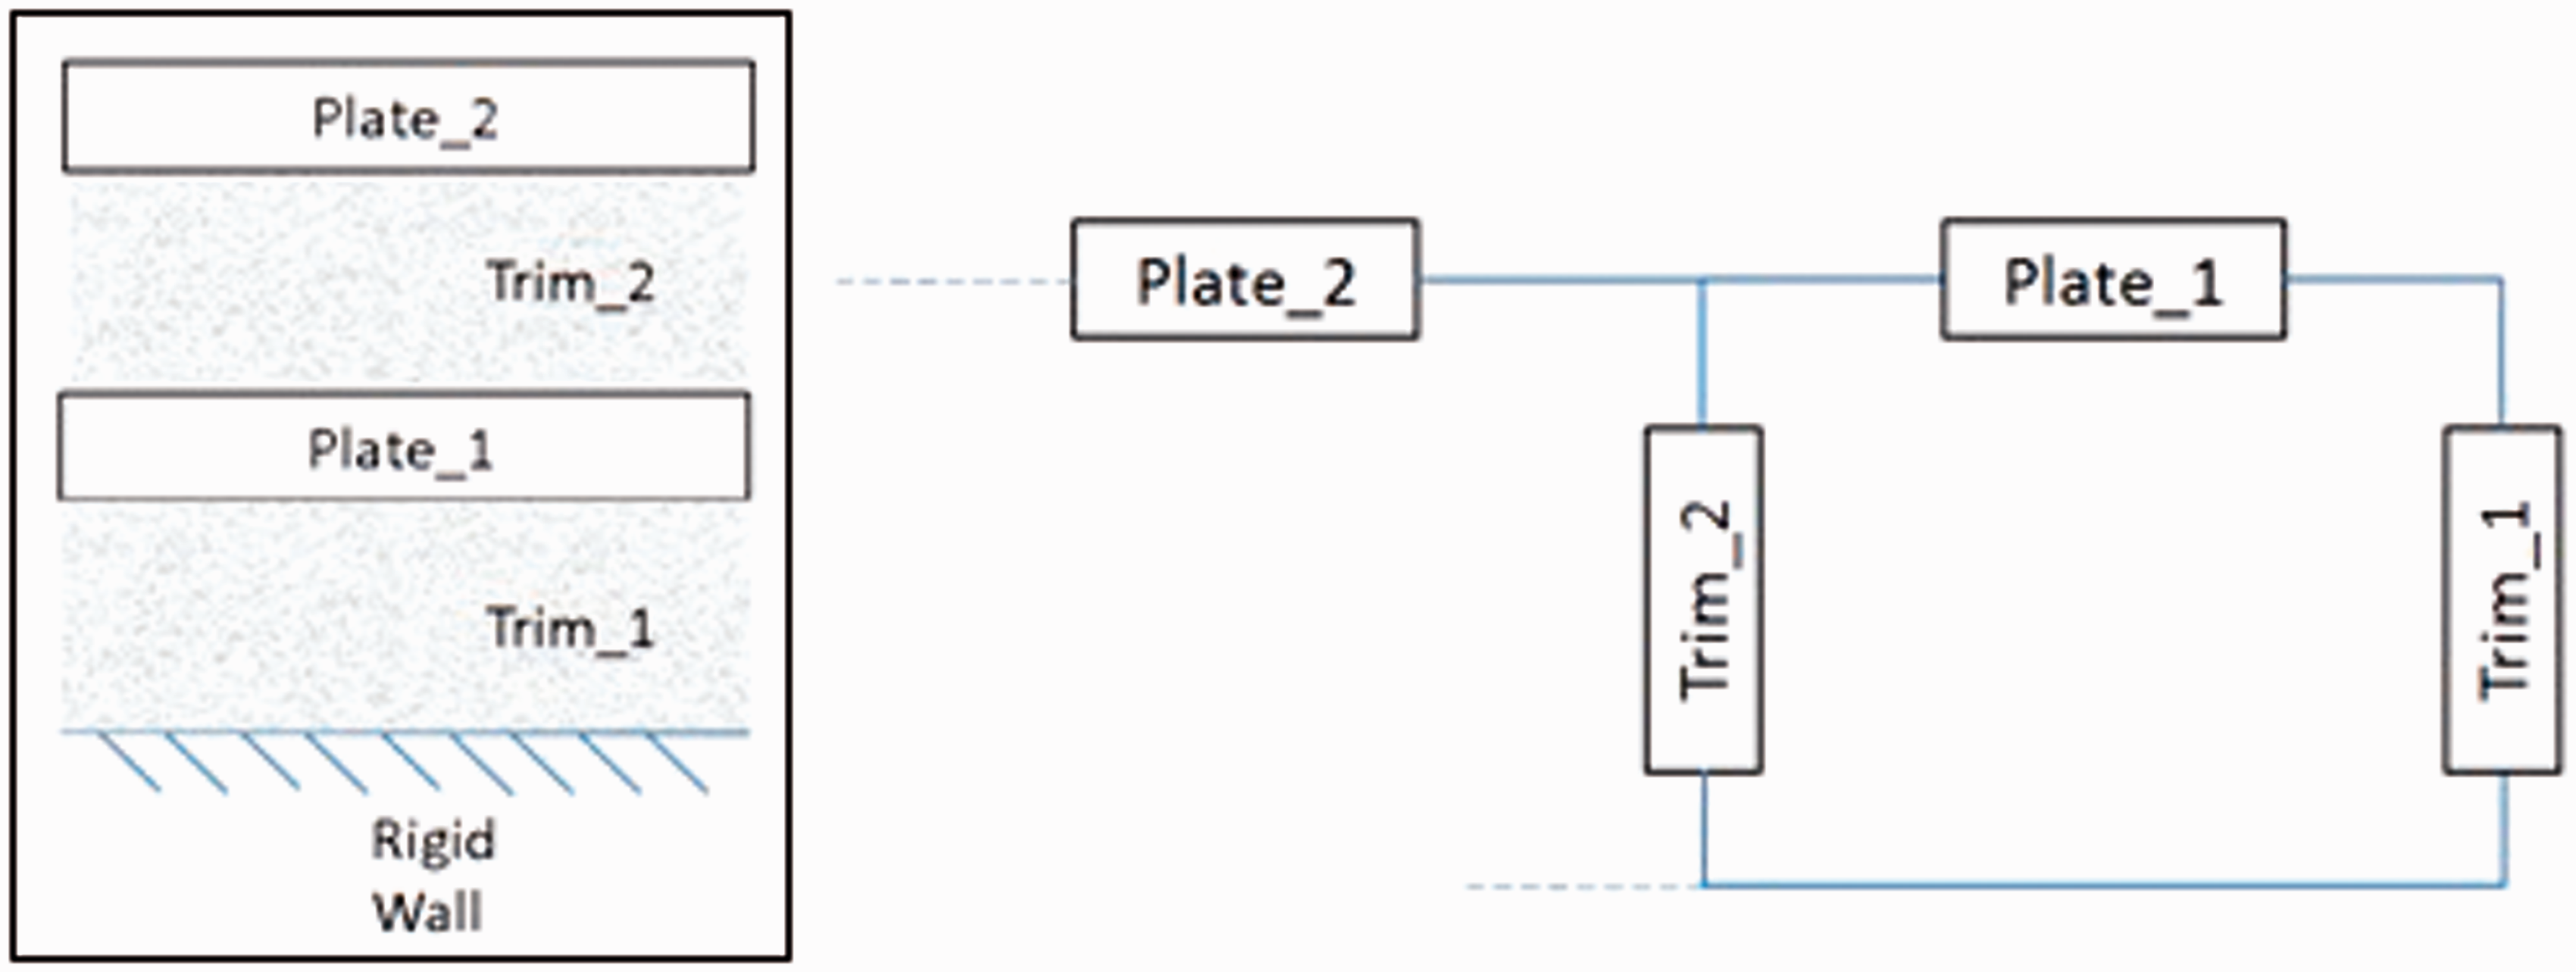

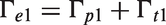
Due to the sound pressure continuity, the equivalent acoustic impedance
The same calculation procedures can be done to the next layer of perforated plate and trim materials in analysis. For a multilayer acoustic absorber configuration consisting of perforated plates, porous materials and air gaps, the effect of backspace air gap and porous material need to be considered. In Lee and Chen (2001), the multilayer absorbers were divided into several compartments where each compartment consists of one layer of perforated plate and several layers of air gap and porous materials. For one compartment, the surface acoustic impedance of the first layer of air gap or porous material is given by
The final equivalent multi-layer acoustic impedance can be denoted as
6.1. Multilayer configuration design
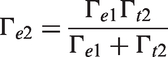
For the TCR mitigation, three cases were considered; the first one used Trim 1 and Trim 2 backed with a rigid wall, the second used Trim 1, Trim 2 and air gap backed with a rigid wall and the third one used perforated plates, Trim 1, Trim 2 and air gap backed with a rigid wall. For the case without perforated plate, equation (17) was applied at each layer beginning from the innermost layer (beside a rigid wall). For the case with perforated plate, equations (17) and (15) were used.
The addition of an air gap to Trim 1 and Trim 2 improved the sound absorption coefficient as shown in Figure 12. Adding an air gap between the trims and the cavity wall would increase the absorption coefficient compared to the case with only the trims against the cavity wall. Figure 12(b) shows the sound absorption coefficients for Trim 1 and Trim 2 calculated separately.
a) Calculated sound absorption coefficient of Trim 1 and Trim 2 for the case with and without 1 cm air gap and b) calculated sound absorption coefficient for the case with Trim 1 only and Trim 2 only.
To investigate on the improvement of adding perforated plates, the associated sound absorption coefficients were also calculated but its effect was small for changing hole pitch and plate thickness parameters except by changing the hole radius. Even by varying the hole radius, hole pitch and plate thickness, the absorption coefficient would not get any better than 0.82 at 500 Hz as shown in Figures 13(a)-(c). The kinematic viscosity of air at room temperature was taken as 18.6 × 10⁻⁶ Pa.s. To further investigate the effect of varying the air gap thickness, the sound absorption coefficient of the absorber configuration with Trim 1, Trim 2 and air gap were calculated when the air gap varied from 1 cm to 10 cm (Figure 13(d)). There was a significant improvement when the air gap was added by 1 cm for every curve in the 0–300 Hz frequency range.
a) Calculated sound absorption coefficient for (Trim 1 + Trim 2 + 1 cm Air gap) with perforated plate (hole radius = 10 mm, hole pitch = 20 mm, plate thickness 0.1 to 1 mm by 0.1 mm increment). b) Calculated sound absorption coefficient for (Trim 1 + Trim 2 + 1 cm Air gap) with perforated plate (plate thickness = 0.1 mm, hole radius = 10 mm, hole pitch 20 to 50 mm by 5 mm increment). c) Calculated sound absorption coefficient for (Trim 1 + Trim 2 + 1 cm Air gap) with perforated plate (plate thickness = 0.1 mm, hole pitch = 60 mm, hole radius 5 to 30 mm by 5 mm increment). d) Calculated sound absorption coefficient for (Trim 1 + Trim 2 + Air gap) with air gap varied from 10 to 100 mm by 10 mm increment..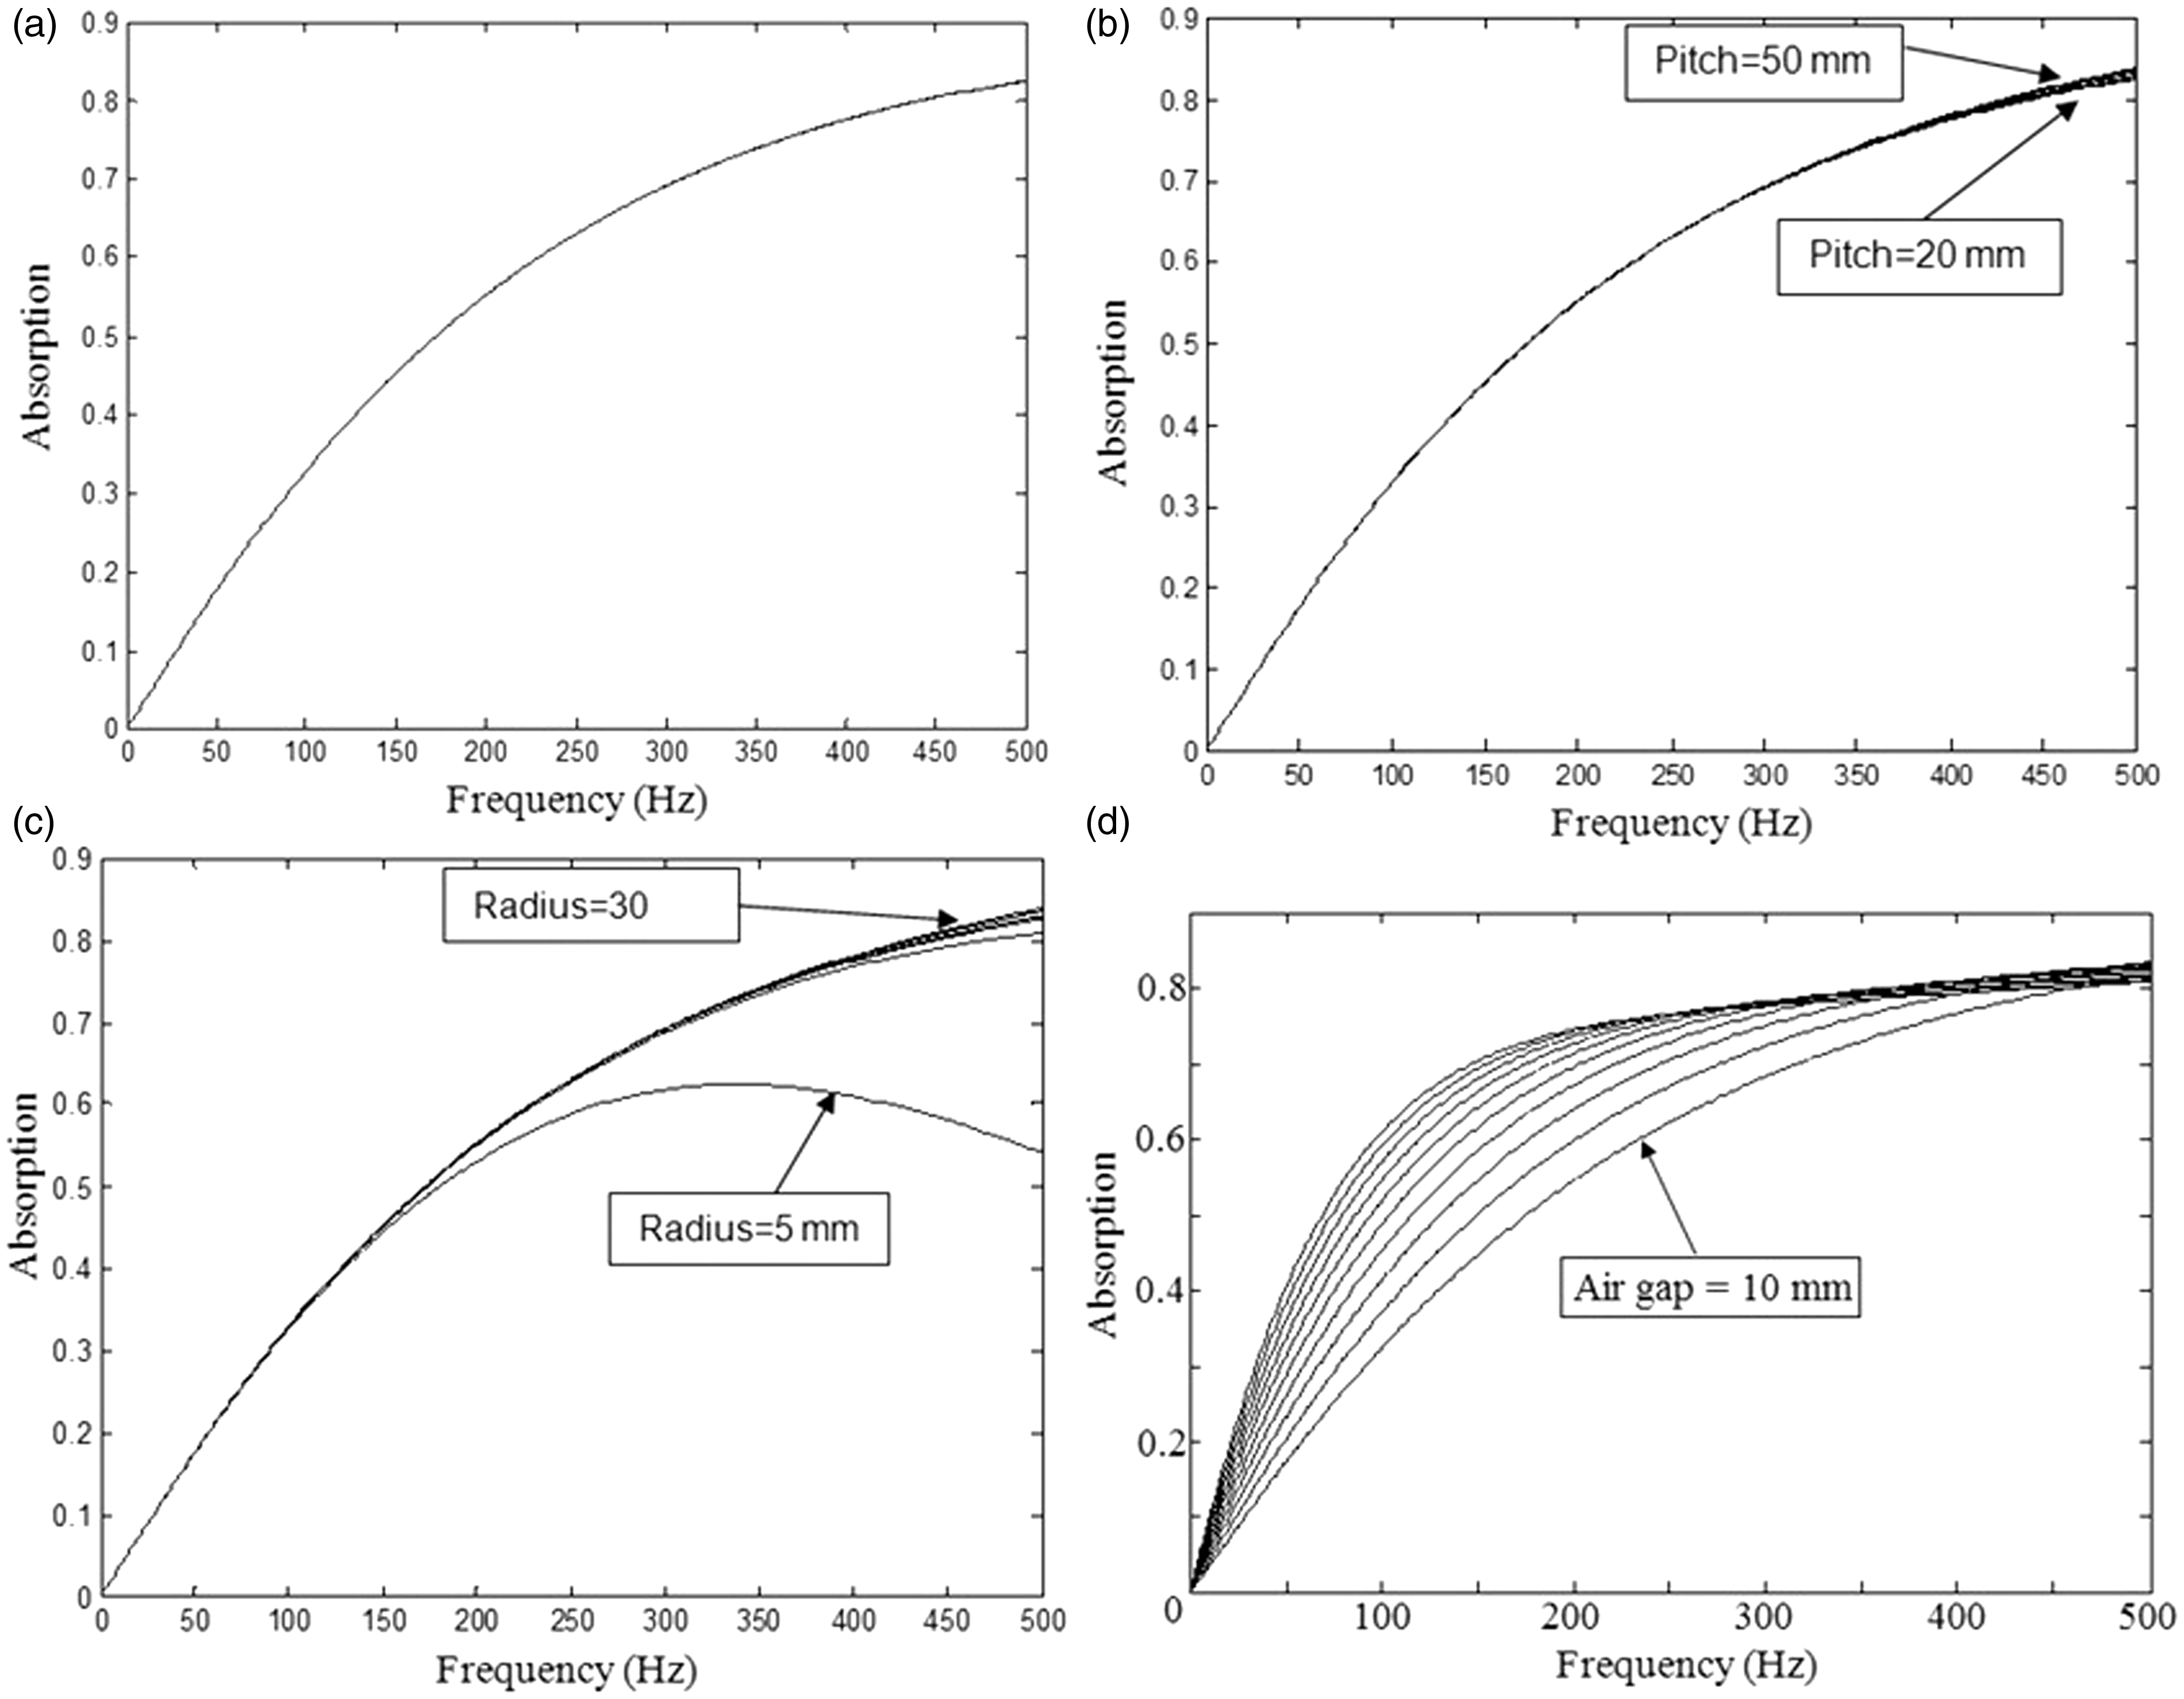
To study the effect of the trim thickness on the reduction of the sound pressure amplitude peaks at 215 Hz and 255 Hz, the mean power spectral density (PSD) for 16 points inside the tire cavity was simulated by a vibroacoustic software when the Trim 1 thickness was changed from 1 cm to 7 cm. In Figure 14(a), both the peaks at 214 Hz and 255 Hz were found to linearly decrease as the Trim 1 thickness increased. The same method was done to study the effect of trim density variation and air gap thickness with the trim thickness held constant. In Figure 14(b), both the peaks at 215 Hz and 255 Hz were not changed when the Trim 1 density was varied from 30 kg/m3 to 150 kg/m3. For the case with air gap addition as shown in Figure 14(c), it was found that the peak at 215 Hz was not reduced as much as the peak at 255 Hz when the air gap was increased. For the 255 Hz peak, the air gap thickness of 2 cm was found to be optimal as adding more air gap thickness did not reduce the sound pressure amplitude peaks further.
a) The sound pressure PSD amplitude peak values (mean of 16 points inside the tyre cavity) at 214 and 255 Hz vs Trim 1 thickness, b) the sound pressure PSD amplitude peak values (mean of 16 points inside the tyre cavity) at 214 and 255 Hz vs the Trim 1 mass density where Trim 1 thickness was held constant at 20 mm and c) the sound pressure PSD amplitude peak values (mean of 16 points inside the tyre cavity) at 214 and 255 Hz vs the air gap where Trim 1 thickness was held constant at 20 mm.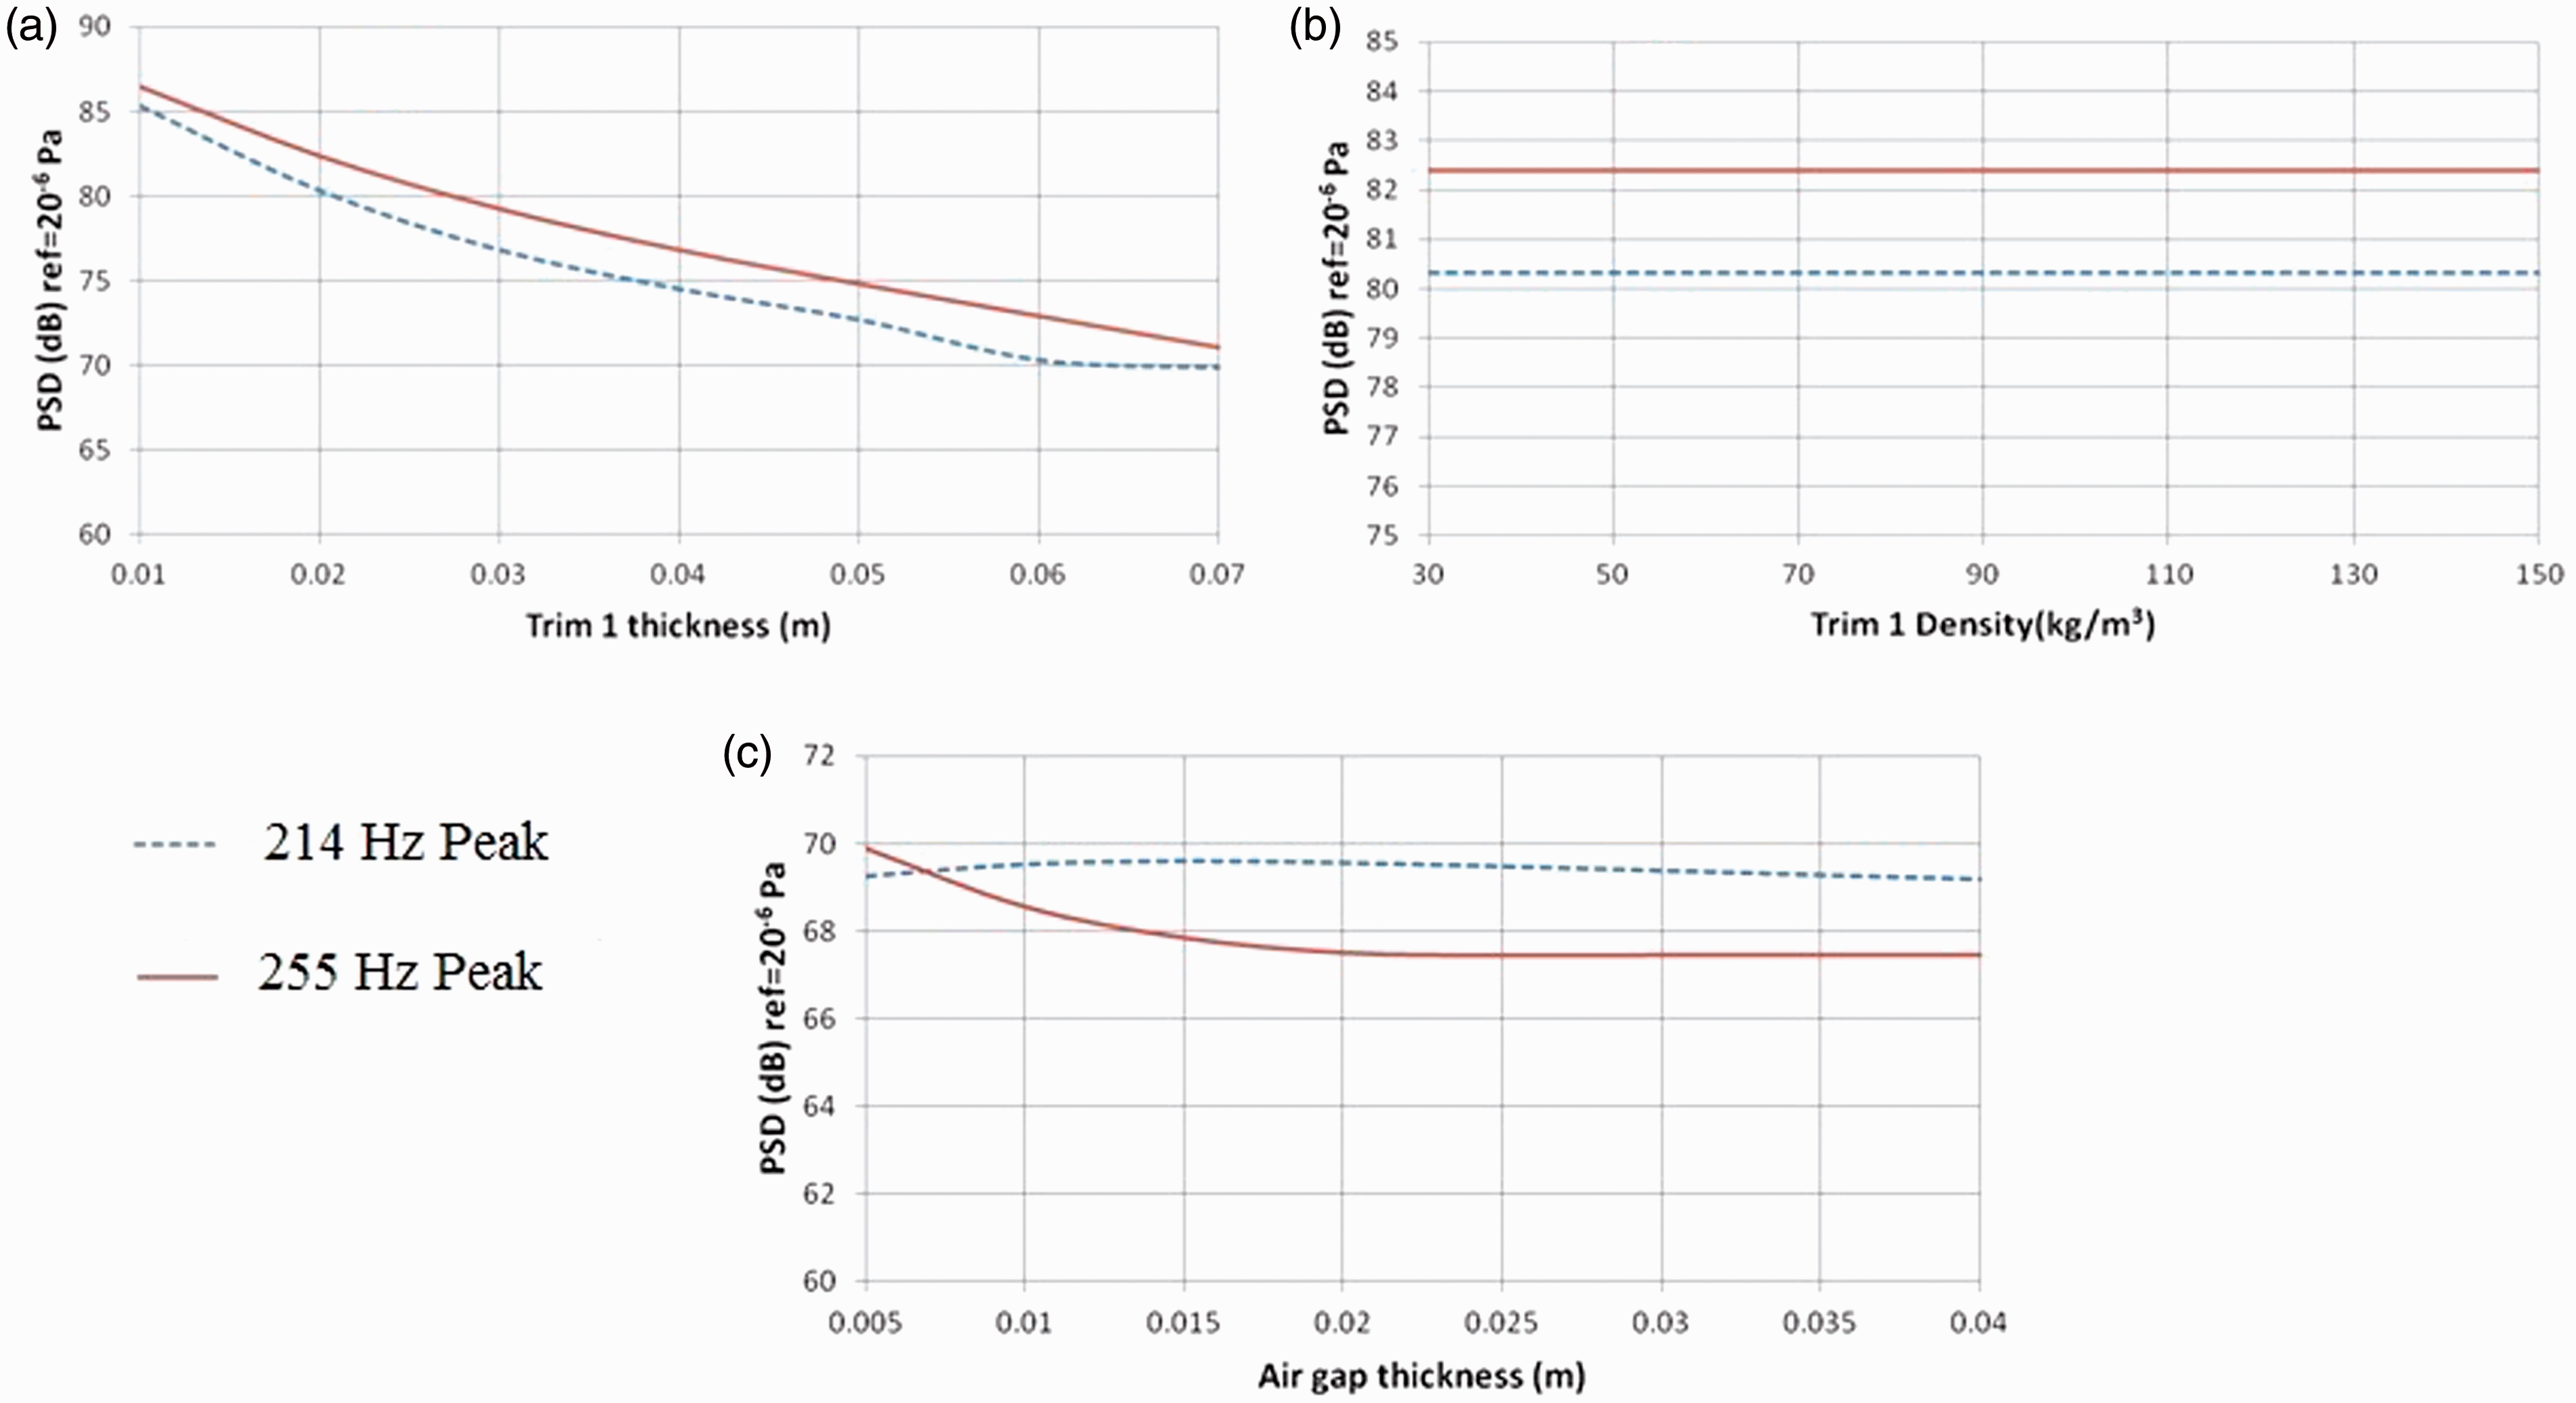
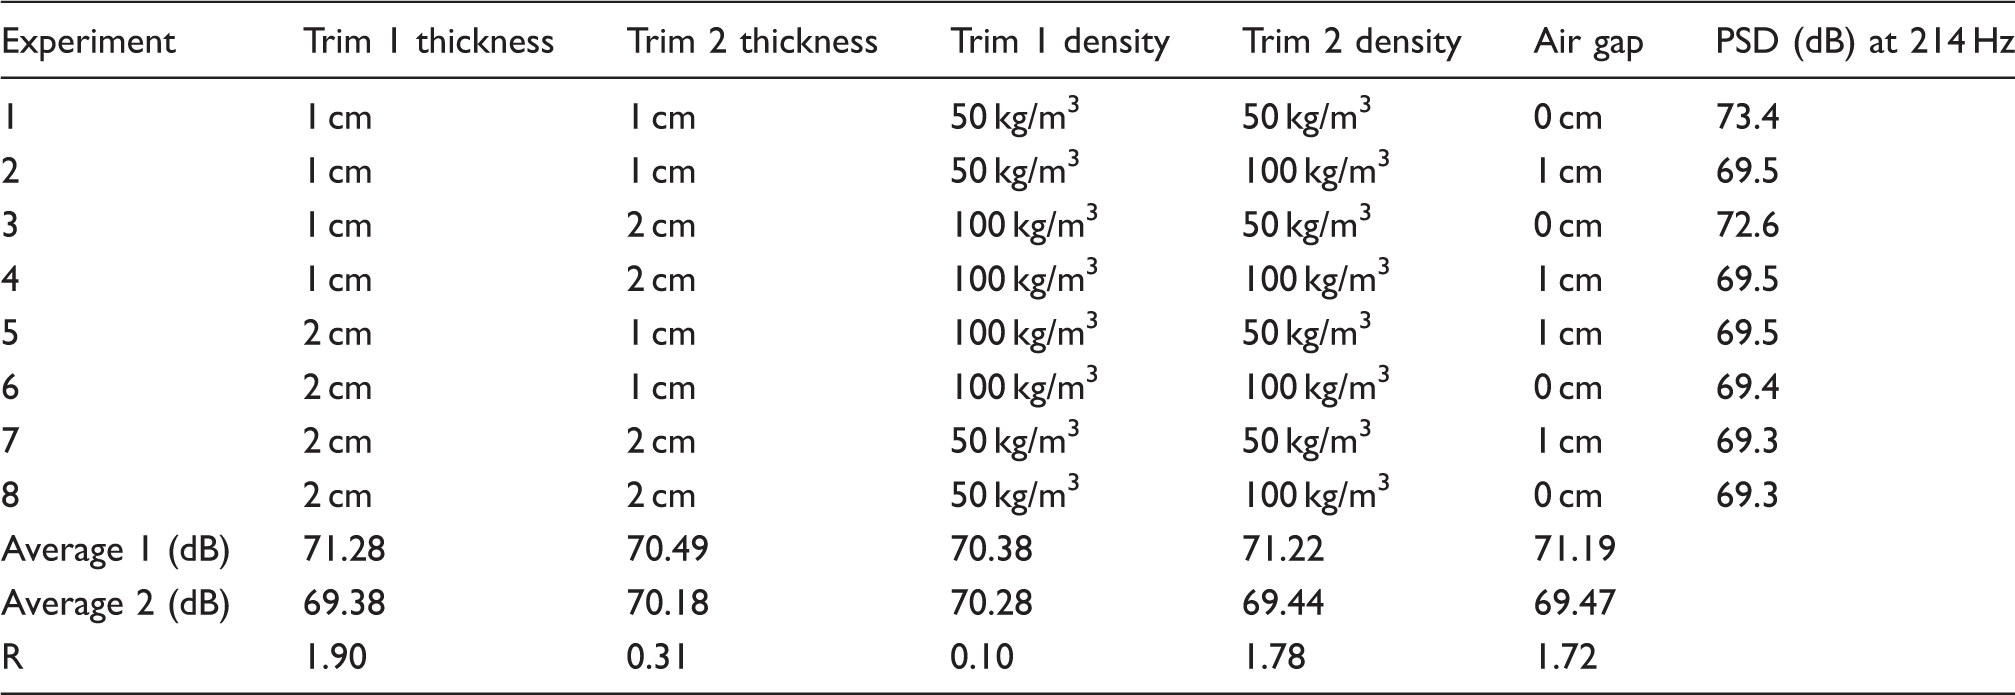
Taguchi method analysis of the effect of the trim thickness, trim mass density and air gap on the PSD amplitude peak value at 214 Hz.
Taguchi method analysis of the effect of the trim thickness, trim mass density and air gap on the PSD amplitude peak value at 255 Hz.

7. Conclusion
The use of acoustic absorbent materials to mitigate TCR noise was presented. The inclusion of a trim in the tire cavity was represented by the addition of the acoustic damping loss factor into the sound pressure response function. In the analytical result, the tire cavity sound pressure level was plotted with the addition of the acoustic absorptive materials where their sound absorption coefficients or damping loss factors were obtained from the impedance tube experiment. For TCR mitigation, a multilayer approach was introduced where the multilayer sound absorption characteristics of felt materials were studied using empirical models. The effect of varying the trim thickness and mass density as well as adding air gap and perforated plates were studied. The Taguchi analysis was performed to rank the effect of changing the trim thickness and mass density as well as the presence of air gap on the sound pressure level peaks at 215 Hz and 255 Hz. It was concluded that the Trim 1 thickness, Trim 2 mass density and the addition of the air gap would be effective at reducing the sound pressure level peaks of TCR.
Footnotes
Acknowledgements
The above work is documented from postgraduate research by the author at RMIT University. The author would like to acknowledge Associate Professor Xu Wang and Dr Venkatesham B for their support.
Declaration of Conflicting Interests
The author(s) declared no potential conflicts of interest with respect to the research, authorship, and/or publication of this article.
Funding
The author(s) disclosed receipt of the following financial support for the research, authorship, and/or publication of this article: Funding from Ministry of Education Malaysia and Universiti Malaysia Pahang is much appreciated.