
Abstract
In this paper, a hybrid empirical mode decomposition (EMD) method is proposed to undertake ambient modal identification of civil structures. Unlike univariate EMD that uses single channel measurement independently, multivariate EMD (MEMD) is employed to estimate the joint information of multichannel vibration measurements of structural systems. The mode mixing in the resulting modal responses from MEMD is then circumvented using ensemble EMD (EEMD). The proposed hybrid MEMD method is validated using a suite of numerical models and experimental studies including the presence of low energy modes, closely-spaced frequencies, measurement noise and reduced sensor densities. The results show the improved performance of the proposed method over the traditional EMD method and reveal the potential of MEMD as a possible candidate for the ambient modal identification method.
1. Introduction
With the advancement of modern sensing technology, output-only modal identification has shown excellent capabilities in real-time monitoring, retrofitting and rehabilitation of large civil infrastructures. Several time and frequency domain algorithms have been studied extensively for modal identification towards model updating, vibration control and damage detection (Doebling et al., 1996; Carden and Fanning, 2004), and there is a wealth of literature on this topic (Maia and Silva, 2001; Staszewski and Robertson, 2007). More recently, powerful signal processing methods including wavelet transform and short-time Fourier transform (STFT) (Ghanem and Romeo, 2000; Hou et al., 2000; Lardies and Gouttebroze, 2002; Kijewski and Kareem, 2003; Hera and Hou, 2004; Yan et al., 2006; Yang and Nagarajaiah, 2014), blind source separation principles (BSS) (Antoni et al., 2004; Poncelet et al., 2007; McNeill, 2011; Antoni and Chauhan, 2013; Yang and Nagarajaiah, 2012; Sadhu, 2013; Sadhu et al., 2014), empirical mode decomposition (EMD) (Yang et al., 2003; Darryll and Liming, 2006; Liu et al., 2012; Geng et al., 2014) and Hilbert-Huang transform (Huang et al., 1998; Huang et al., 2003; Yang et al., 2003, 2004b; Feldman, 2009; Ming et al., 2015) have been investigated in numerous applications of structural health monitoring.
Unlike any other time-frequency decomposition tools, EMD (Huang et al., 1998) is capable of dealing with nonlinear and nonstationary signals and therefore it has gained significant popularity in the field of structural condition assessment. EMD is considered as an adaptive time-frequency decomposition method, where a multi-component signal is decomposed into a finite number of mono-component signals and a residue by successive enveloping operations. When a signal contains random measurement noise, the noise is directed to the residue component of EMD. As the measurement noise does not have a well-defined envelope, it is not treated as an inherent signal component. Therefore, the key frequency components (e.g. modal responses in vibration data) can be readily obtained from EMD. EMD is well suited for signals of both linear and nonlinear systems. In fact, the EMD method decomposes nonlinear and nonstationary signals as sums of signals with amplitude and frequency modulation, and therefore this method is fundamentally the same for both linear and nonlinear systems. Unlike any other time-frequency analysis (like wavelet), the EMD method is free of basis function selection and is self-adaptive in nature. Moreover, EMD utilizes just a single sensor vibration measurement to extract a subset of modal information (Yang et al., 2003; Lei et al., 2013). Recently, multivariate EMD (MEMD) was proposed to utilize multichannel signals in data-driven time-frequency analysis (Rehman and Mandic, 2010), in order to combine the joint information of multi-sensor measurements. In this paper, a hybrid MEMD based modal identification technique is proposed, which employs multiple vibration measurements.
Because of its self-adaptive nature (without requiring a basis function), the EMD method has garnered a significant popularity over other time-frequency decomposition methods like wavelet transform, BSS or STFT (Nagarajaiah and Basu, 2009). The EMD method was originally developed by Huang et al. (Huang et al., 1998; Feldman, 2009) and is capable of decomposing a signal into several oscillatory waveforms named intrinsic mode functions (IMF). IMFs are primarily obtained from multiple averaging and interpolation operations over the envelopes of local maxima and minima of the raw signal, known as sifting. However, such consecutive interpolations in the sifting operations introduce significant mode mixing in the resulting IMFs (Rilling et al., 2003; Kim et al., 2012). Recently, EMD has been successfully employed for parametric identification of structural and mechanical systems in conjunction with Hilbert transform (e.g. Hilbert-Huang transform) (Yang et al., 2003; Xu et al., 2003; Yang et al., 2004b,a; Darryll and Liming, 2006; Bao et al., 2009; Lei and Zuo, 2009; Liu et al., 2012; Tang et al., 2012; Bahar and Romezani, 2014; Ming et al., 2015), where mode mixing is alleviated using band-pass filtering. EMD is also integrated with other time-frequency methods like BSS (Hazra et al., 2010, 2012a,b) and random decrement technique (He et al., 2011) to perform modal identification. However, significant user intervention in the form of intermittency criteria based on band-pass filtering is a prerequisite in these methods. Recently, a noise assisted data analysis, the ensemble EMD (EEMD) method (Wu and Huang, 2005; Lei et al., 2009) was developed to circumvent the mode mixing issue in EMD. In EEMD, an artificial noise is introduced repeatedly and then an ensemble of EMD operations is conducted to cancel out the effect of mode mixing.
Other than the mode-mixing issue in EMD, the standard EMD method primarily works only for a single real-valued signal. While dealing with the measurements of multiple sensors, the standard EMD method faces two problems (Rehman and Mandic, 2010): (a) there is no guarantee that the decomposition of IMFs from multiple channels of measurements will match in terms of their number or frequency contents, and (b) the joint information between multiple sensors is not exploited because signals from multiple sensors are treated individually. Therefore, it is clear from the above discussion that traditional EMD has the following limitations in the context of modal identification: (a) mode mixing associated with the sifting operation, (b) separate analysis of individual measurements which could be computationally demanding for large structures, and (c) the method is incapable of using joint information of multichannel measurements.
The EMD method was recently extended to its multivariate version, which is suitable for multichannel signals (Rehman and Mandic, 2010). In multivariate EMD (MEMD), multidimensional envelopes are firstly developed by utilizing the projections of the raw signal along different directions, with the average of these envelopes being denoted as the local mean. Recently the MEMD method was successfully used to separate the source signals of multichannel measurements of bio-medical and mechanical systems (Zhao et al., 2012). However, mode mixing is still an issue (Zhao et al., 2012), as in the standard EMD. Moreover, unlike EMD and EEMD, the performance of MEMD has not yet been explored in the system identification of civil and mechanical structures. In this paper, MEMD is explored for the first time as a possible tool for modal identification of structures, and a hybrid EMD-based modal identification is proposed, which combines the relative merits of MEMD and EEMD to circumvent mode mixing whilst dealing with multichannel vibration measurements of structures.
The paper is outlined as follows. First, a background of EMD, EEMD and MEMD is presented followed by the description of the proposed algorithm. Numerical illustration is then conducted using several realistic cases followed by an experimental validation. Finally, the key conclusions are summarized.
2. Background
Before going into the details of the algorithm, a brief background of empirical mode decomposition and its variants is presented here, including their relative advantages and disadvantages in light of the modal identification.
2.1. Empirical mode decomposition
Empirical mode decomposition (EMD) is a powerful signal decomposition tool for nonlinear and nonstationary signals. It was originally developed by Huang et al. (Huang et al., 1998), and it primarily decomposes a signal into several oscillatory waveforms denoted as intrinsic mode functions (IMF). An IMF satisfies the following two conditions: (1) the number of extrema and the number of zero-crossings must be either equal or differ at most by one, and (2) at any point, the mean value of the envelope defined by local maxima and minima is zero. The procedure of extracting an IMF is called sifting, and is operated by identifying local maxima in the data between successive pairs of zero crossings and connecting them by a cubic spline line to create the upper envelope. Local minima are then connected in the same fashion to produce the lower envelope. If their mean is a1, the difference y(t) − a1 = i1(t) is the first IMF. Ideally, i1(t) should satisfy the conditions necessary to be called an IMF. If it does not, then the sifting process is repeated by treating i1(t) as the original data until the requirements for an IMF are fulfilled. The original signal is then subtracted from the IMF, and the sifting process is repeated to decompose the data into the certain number of IMFs (Huang et al., 1998; Rilling et al., 2003)

2.2. Ensemble empirical mode decomposition
To alleviate the mode mixing of EMD, an improved version of EMD that exploits a noise assisted data analysis, ensemble empirical mode decomposition (EEMD), was proposed (Wu and Huang, 2005). The key idea is to add a white noise, which has uniform time-frequency space at different scales, to the raw signal. Through multiple superpositions and averaging operations of EMD, the artificially added white noise is eliminated, and the raw signal with multiple frequency content is automatically projected onto proper scales of reference. In this way, the EEMD eliminates the mode mixing problem and preserves the physical uniqueness of the resulting decomposition. Primarily it consists of the following steps;
A white noise is added to the raw signal y(t)
Apply EMD with the new signal and decompose it into n IMFs using equation (1)
Repeat the previous two steps, say m
e
times, (i.e. k = 1,2,3, …, m
e
) with different white noise sequences, where the standard deviation of the white noise is kept constant and optimal (Guo and Tse, 2013). It should be noted that the number of ensembles (i.e. m
e
) needs to be set a priori in the EEMD method. However, by increasing the ensemble numbers, the effect of the added white noise can be reduced to a negligibly small level. In general, an ensemble number of a few hundred will lead to a very good result. A detailed study on this can be found in Wu and Huang (2005). Obtain the ensemble average of each decomposed IMF as the final outcomes
Relative performance of EMD and EEMD.
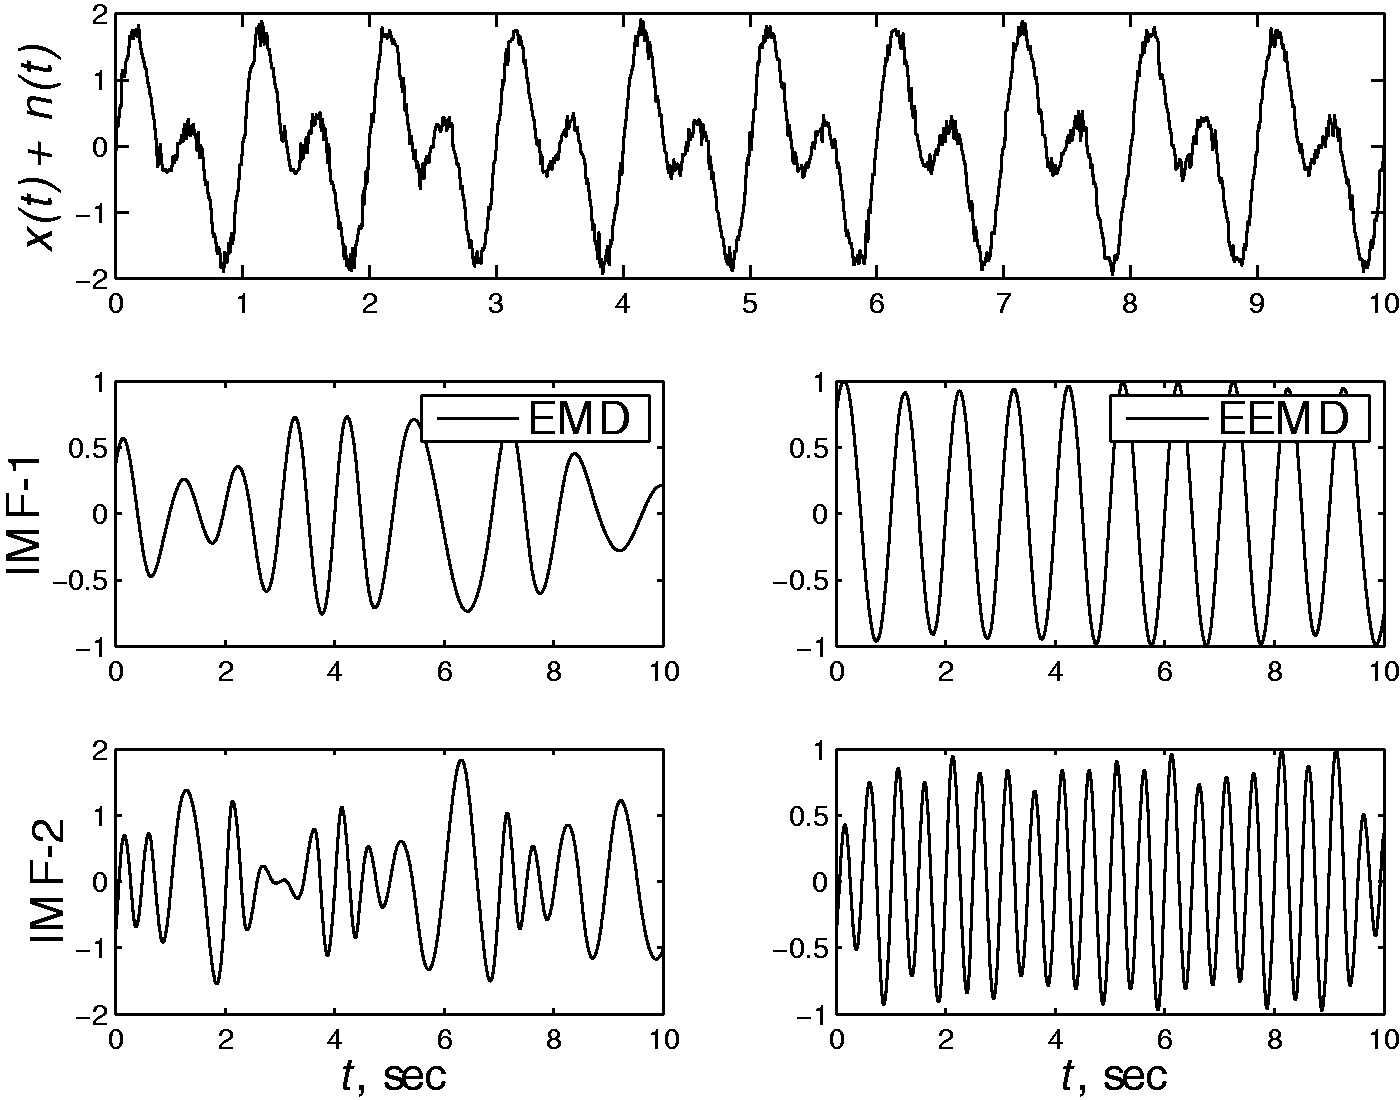
The relative performances of the EMD and EEMD methods are now illustrated using a simple example comprising of sine waves. Two sine waves with frequencies 1.0 and 2.0 Hz are mixed with a signal-to-noise ratio (SNR) of 10 to form the measurements. The resulting measurements are then decomposed using EMD (without using intermittency criteria) and EEMD. As shown in Figure 1, there are amplitude and frequency modulations (i.e. mode mixing) in the IMFs generated by EMD which are absent in the IMFs obtained from EEMD. However, iterative EMD operations in EEMD make it computationally intensive, especially for multi-component signals like vibration data of civil structures.


2.3. Multivariate EMD
As mentioned earlier, the standard EMD method works only for a single real-valued signal. While dealing with the measurements of multiple sensors, the EMD algorithm faces two succinct problems (Rehman and Mandic, 2010);
Because of the single channel dependency of EMD, there is no guarantee that the decomposition of IMFs from different channels of measurements will match, either in number or in their frequency contents. The joint information between multiple sensors is not realized because signals from multiple sensors are treated individually.
In order to address these limitations, the traditional EMD method was recently extended to its multivariate form, which is suitable for multichannel signals (Rehman and Mandic, 2010). In multivariate EMD (MEMD), multidimensional envelopes are firstly developed by utilizing the projections of the raw signal along different directions, and then the average of these envelopes is denoted as the local mean. For a general case of an n-dimensional signal, quasi-Monte Carlo-based low-discrepancy sequences are exploited in order to generate a set of uniformly distributed points on a unit (n − 1)-sphere (Rehman and Mandic, 2010, 2011). Consider a sequence of n-dimensional vectors Choose a suitable set of direction vectors, D. Calculate the k-th projection, p
k
(t) of the input signal y(t) along the k-th direction vector, X
k
, for all k (i.e. k = 1,2,…,L, where L is the total number of direction vectors in D). Find the time instants, Interpolate For a set of L direction vectors, the mean E(t) of the envelope curves is obtained as
Extract the residual r(t) using r(t) = y(t) − E(t). If r(t) satisfies the stopping criteria for a multivariate IMF, apply the above steps to (y(t) − r(t)) to extract the IMF (

In order to demonstrate the application of MEMD, a simple example involving a mixture of sine waves (as shown in equation (7)) is utilized where ω = {1.0, 2.2, 4.0} Hz
Illustration of the MEMD for the sine example.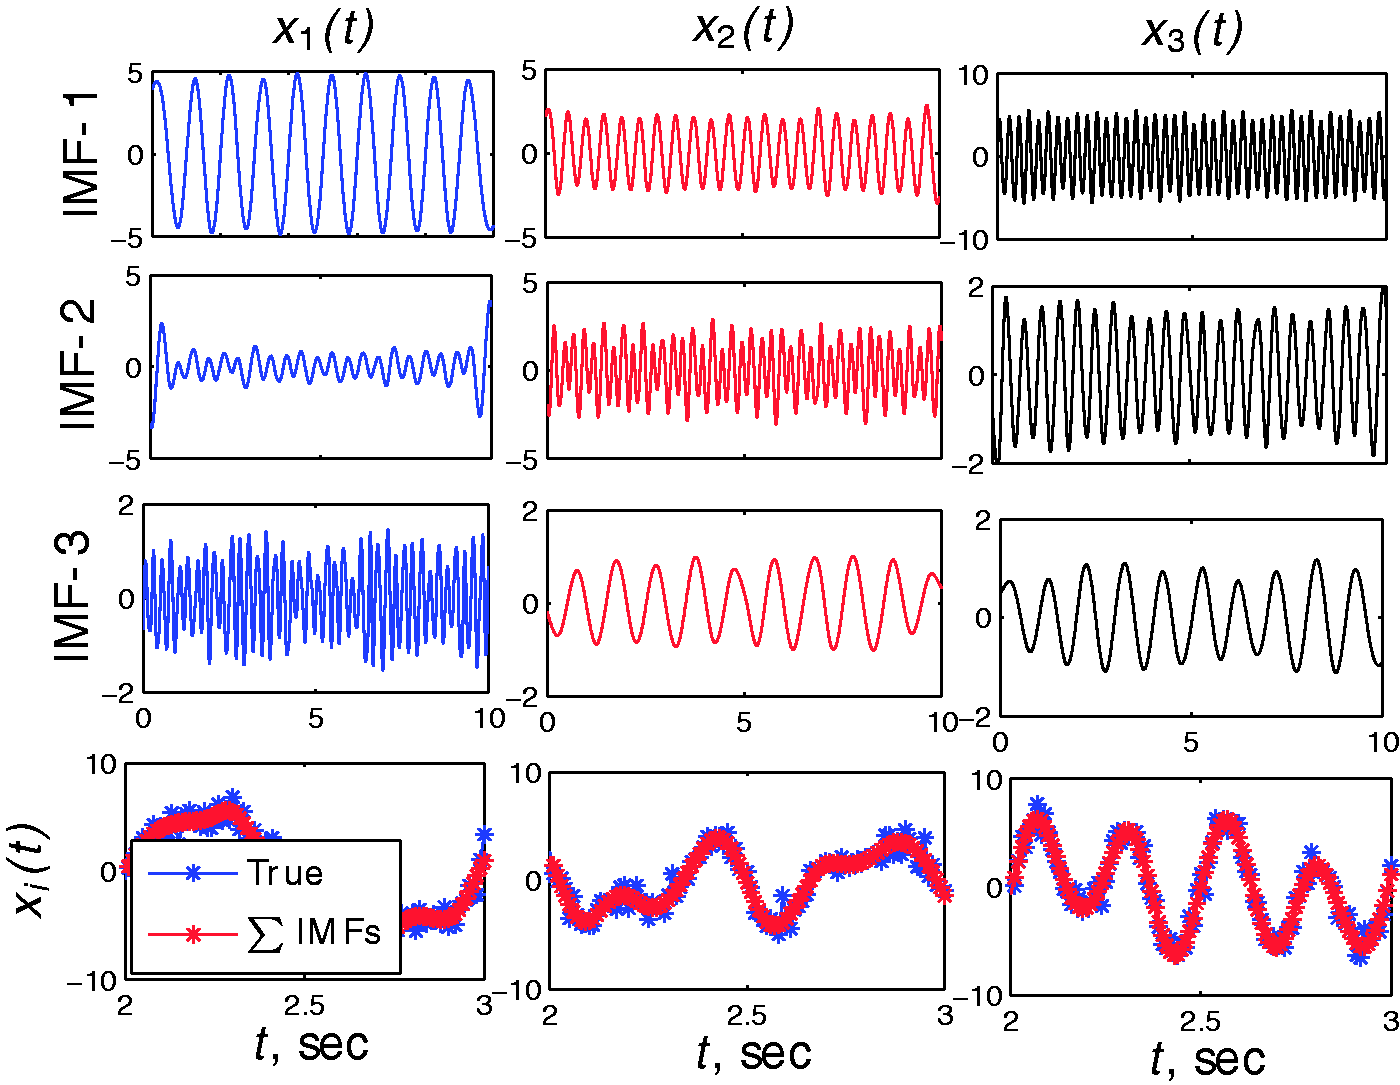
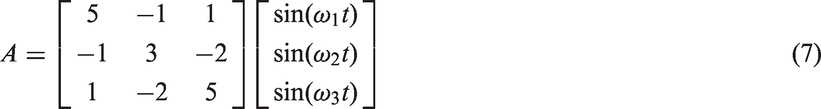
Equation (7) is tantamount to the modal superposition of the structural systems, where the sine waves represent the modal responses and A is the corresponding mode shape matrix. In reality, there are several low energy modes in the vibration responses of a flexible civil structure. In order to simulate such a situation, the amplitude of the sine signal with frequency 2.2 Hz (in equation (7)) is reduced by multiplying it by a factor of 0.1. The MEMD is employed to separate the sources. Figure 3 shows the typical results of the identified IMFs and it can be seen that IMF-2 of all measurements (i.e. the second row of Figure 3) contains a substantial amount of mode mixing, due to its low energy contents in the vibration measurements. This is a key result, and gives the basic motivation to develop a robust MEMD method which can perform modal identification using the vibration measurements containing low energy modes and measurement noise.
Performance of the MEMD under low energy signals.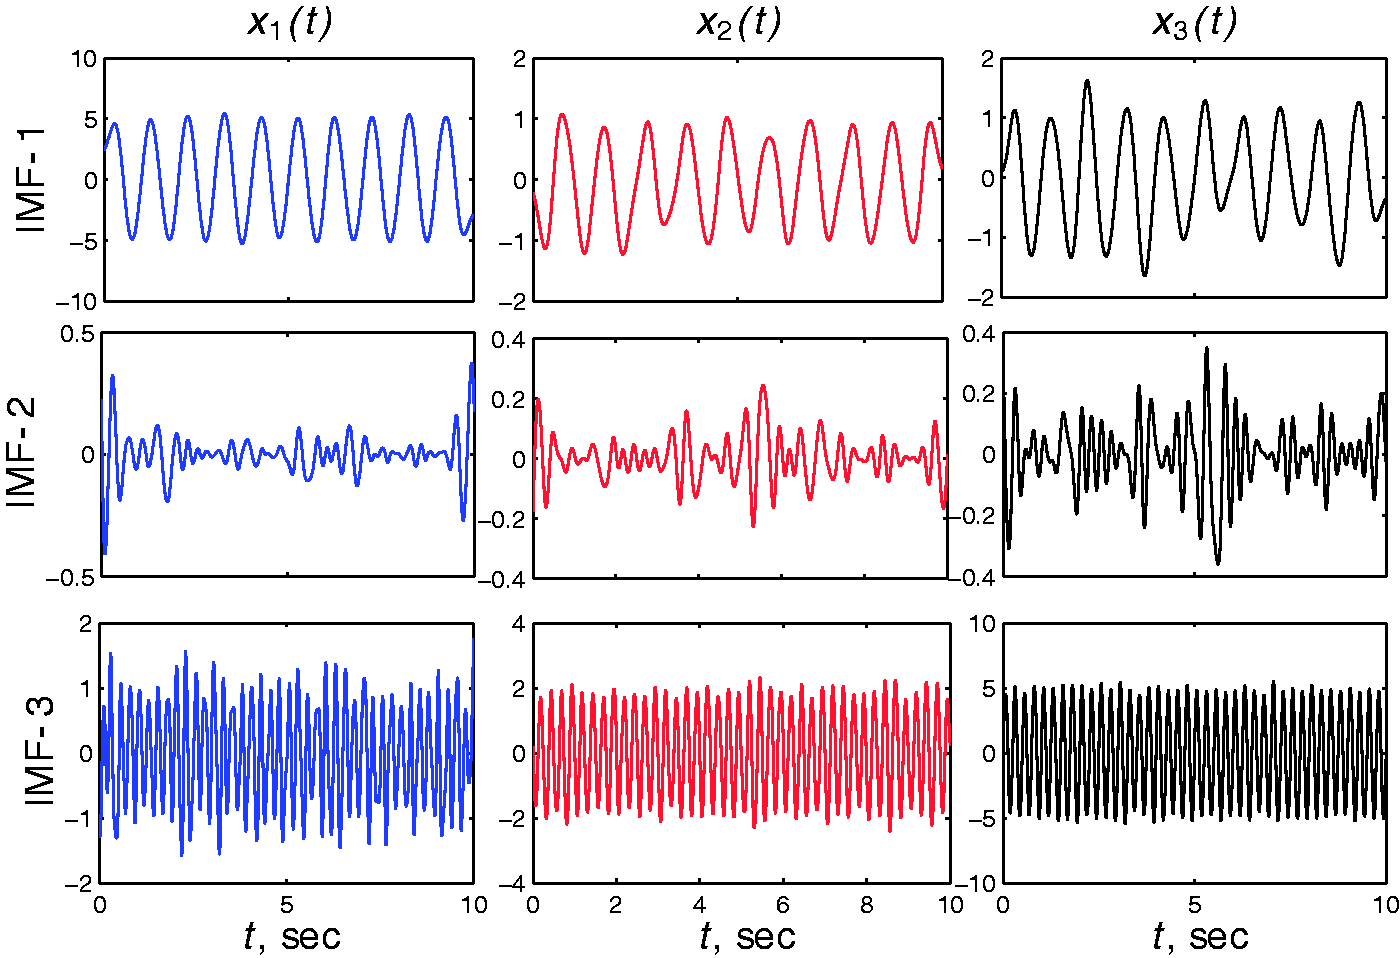
3. Proposed method
Consider a linear, classically damped and lumped-mass n degrees-of-freedom (DOF) structural system, subjected to a wide-band random input force,


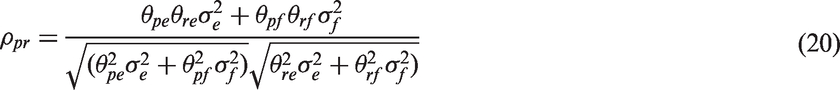
Considering the similarity of equations (10) and (11), we get


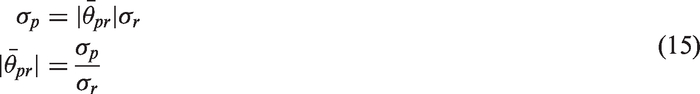


A simple case consisting of a mixture of two sources (j = e, f) present in I
ij
, as in equation (12), can be expressed as


4. Numerical illustration
The relative performances of the MEMD and hybrid MEMD methods are now compared using two different numerical studies comprising of: (a) low energy modes and measurement noise, (b) closely-spaced modes. The choice of such examples resembles perfect real-life cases of flexible civil structures.
4.1. 5-DOF building
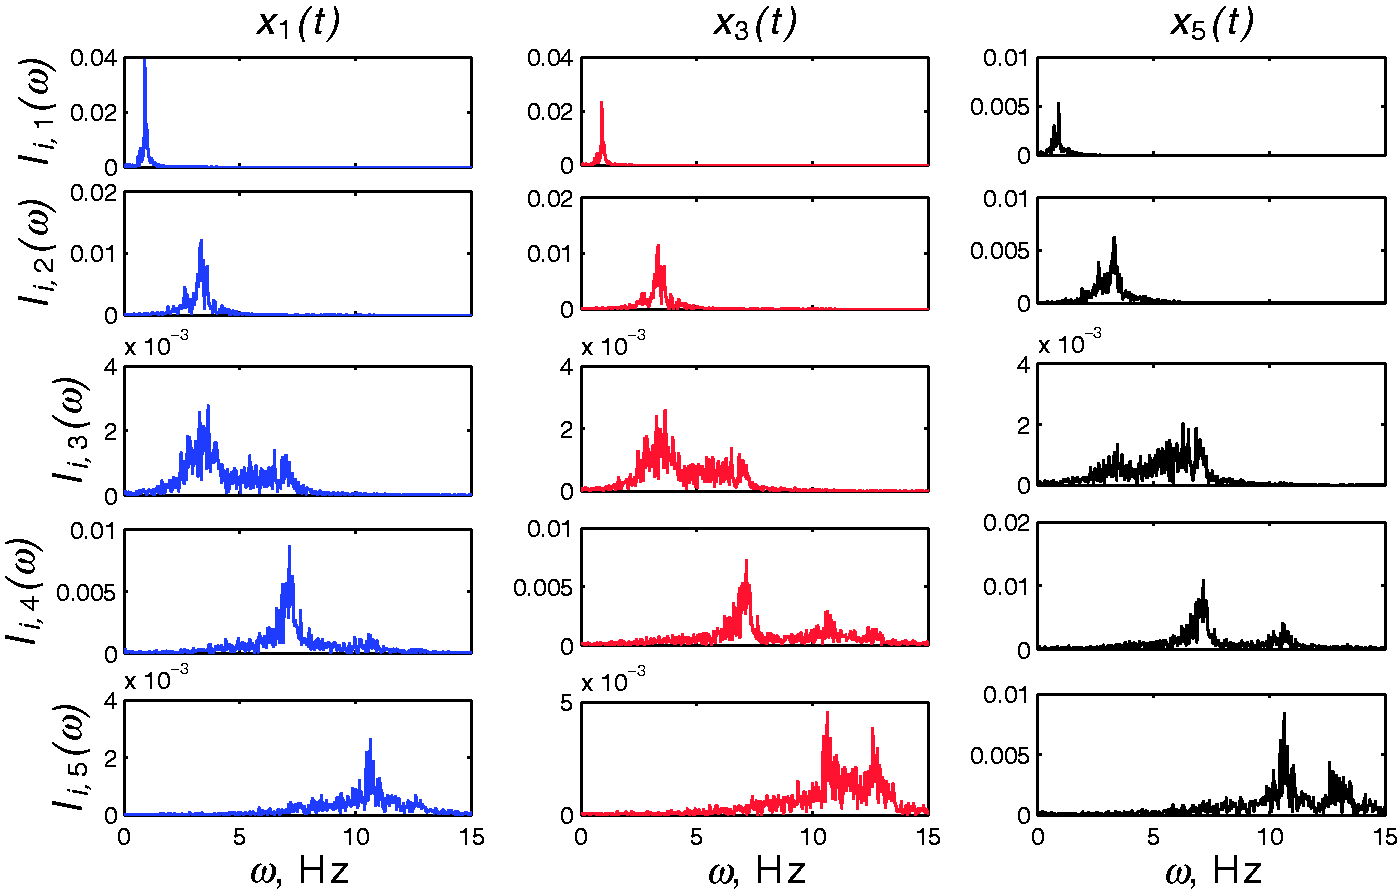
First, a 5-storey shear-beam structure model (Sadhu, 2013) is considered. The lumped weight of each floor is assumed to be 19.2 kN, and the damping is assumed to be 2% critical in all modes. The natural frequencies are 0.91, 3.37, 7.11, 10.66 and 12.73 Hz. White Gaussian noise is used to excite the building at all its floor locations. Fourier spectra of the floor measurements are shown in Figure 4, which reveals extremely low energy in the 2nd and 5th mode compared to other modes. The MEMD method is now undertaken, utilizing all vibration measurements. The resulting IMFs for x1(t), x3(t) and x5(t) are shown in Figure 5. It can be seen that, due to the low energy content of the 2nd and 5th modes, they are mixed with the other IMFs, resulting in mode mixing. As shown in Table 1, the correlation coefficients of the IMFs (using equation (16)) are successively used to detect the mode mixing. When ρ is close to 1.0, the IMFs are considered mono-component and they are treated as modal responses. Then the mode shape coefficients are computed based on equation (17) and are tabulated for Ii1 and Ii2 in Table 1. For example, Fourier spectra of floor vibration measurements of the 5-DOF building. MEMD method: Presence of mode mixing. Details of identification results of the MEMD method.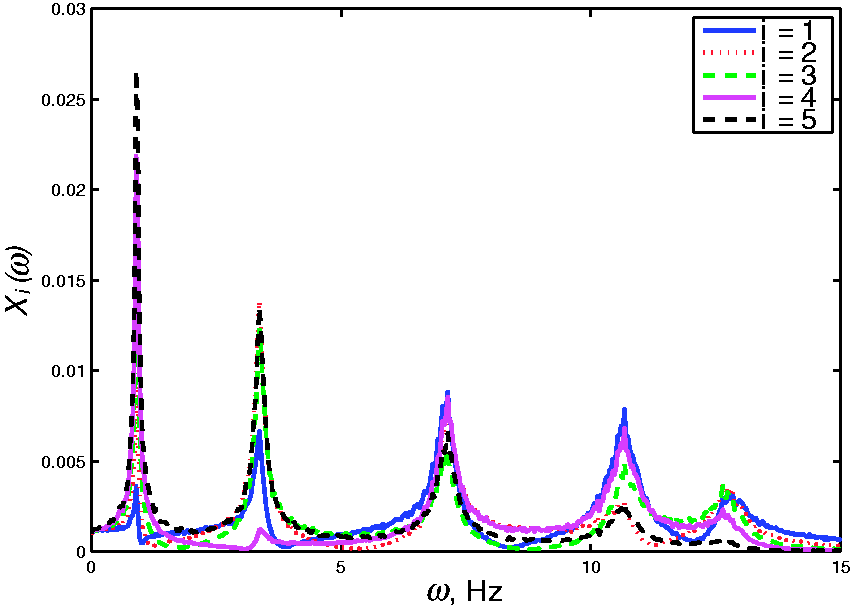
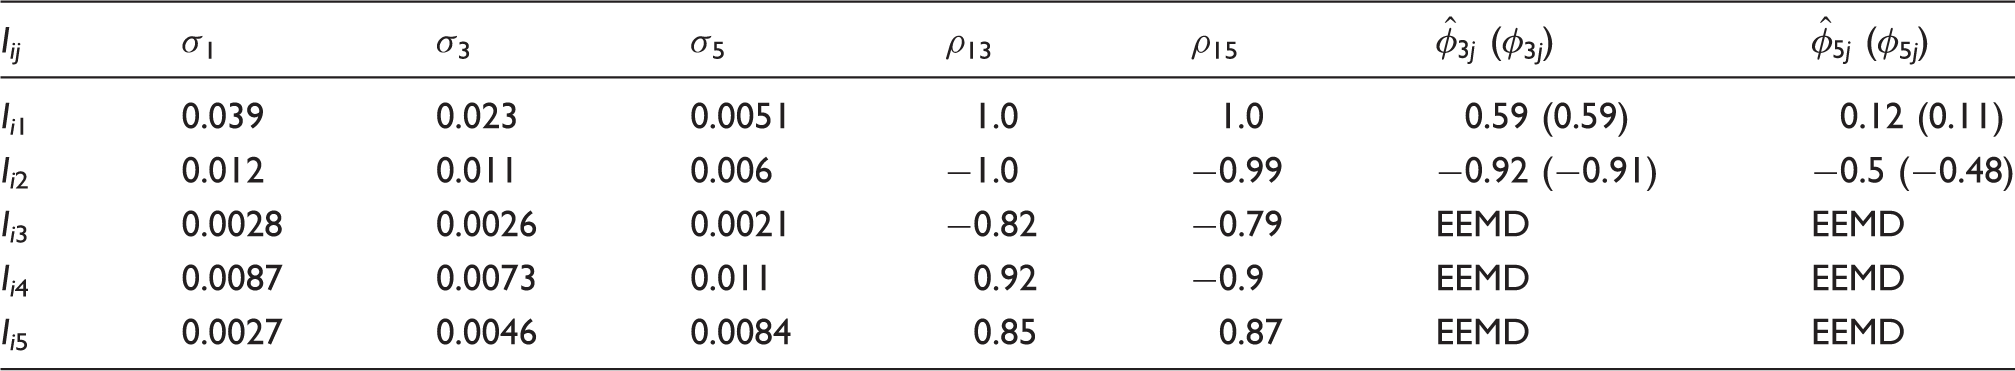
Identification results of the 5-DOF model using the proposed method.
4.2. 3-DOF building with multiple TMDs
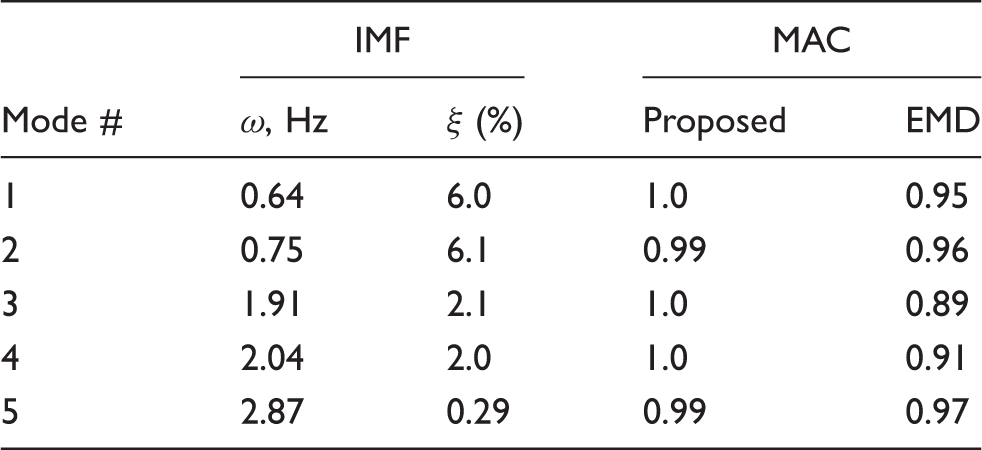
In this example, an attempt has been made to explore the capability of closely-spaced frequency separation using the proposed method. This example illustrates an interesting application for a flexible structure equipped with tuned-mass dampers (TMDs). A 3-DOF model (Rana and Soong, 1998) with multiple TMDs (MTMDs) is considered as a test-bed. The natural frequencies of the 3-DOF model are 0.71, 1.98 and 2.87 Hz, and the associated damping is assumed to be 2.0%, 0.5% and 0.3%, respectively. The model is excited by white Gaussian noise at all floor locations. With the introduction of two optimally tuned TMDs (Rana and Soong, 1998), the resulting frequencies are 0.64, 0.75, 1.91, 2.04 and 2.87 Hz, with damping ratios of 6.3%, 5.8%, 2.2%, 2.1% and 0.3%, respective to the corresponding modes. The frequency separations for two consecutive modes are 14.7% and 6.4%, which are relatively small values. Figure 7 shows the Fourier spectrum of the top floor response of 3-DOF model with MTMDs.
3-DOF model with multiple TMDs. Fourier spectrum of top floor response.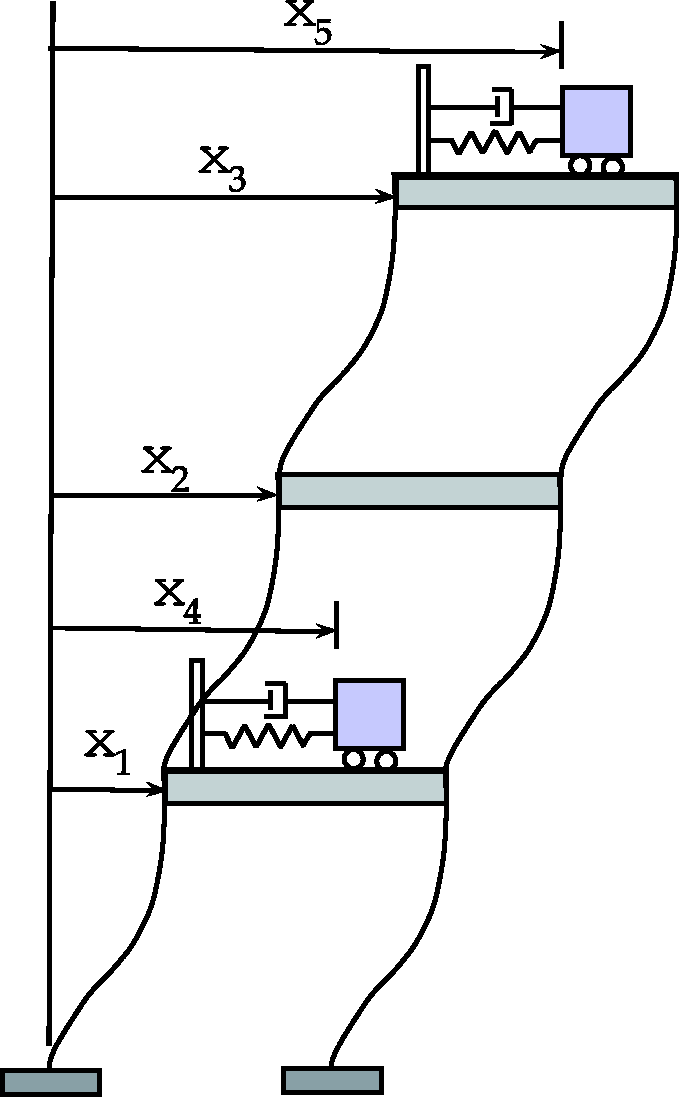
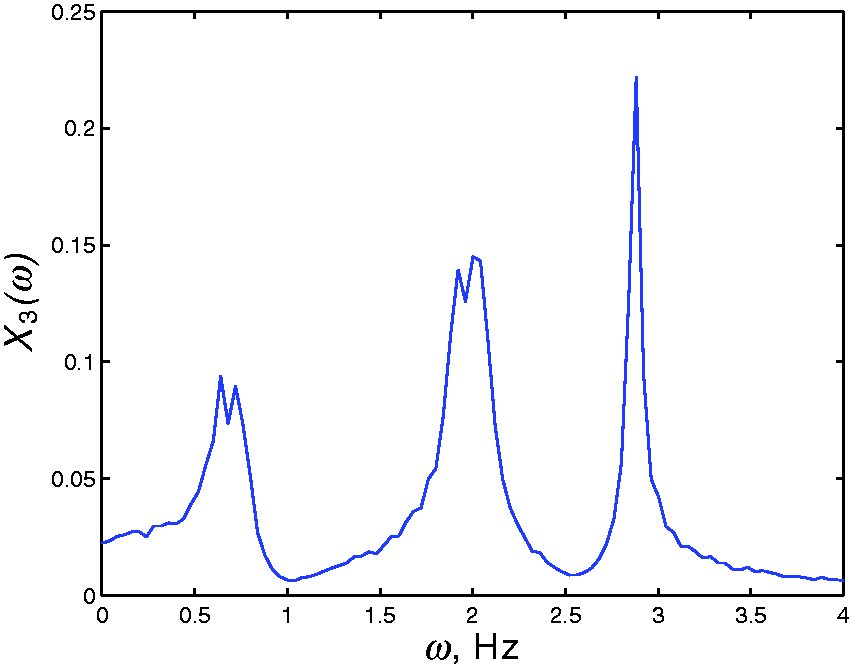
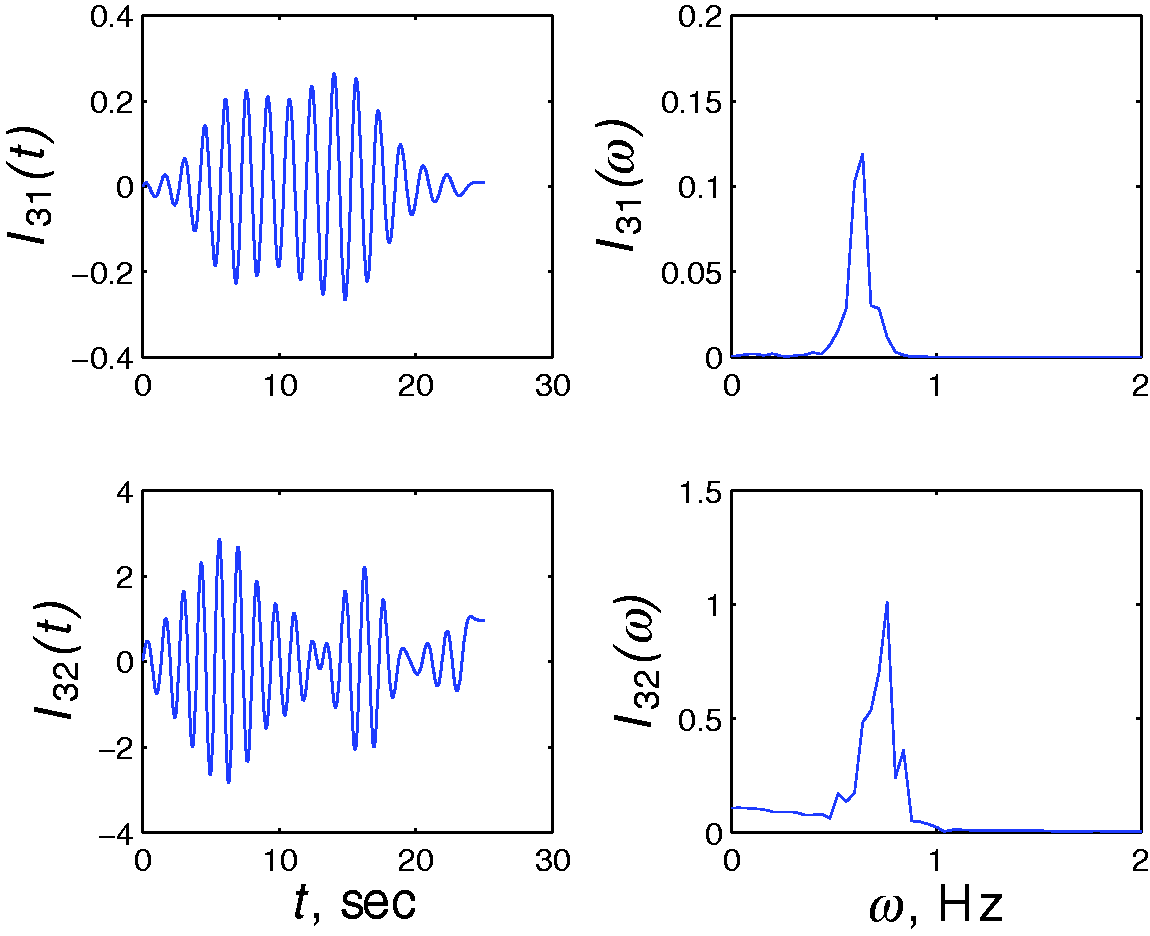
The MEMD is now performed using five response measurements (three floor vibration measurements and two TMD responses). The Fourier spectra of the resulting IMFs of the 3rd floor measurement are shown in Figure 8. It is seen that the presence of two successive pairs of closely-spaced modes with low-frequency resolution ( Typical IMFs of top floor response using the MEMD. Separated IMFs using the proposed method (ω = 0.64 Hz and ω = 0.75 Hz). Identification results of the proposed method.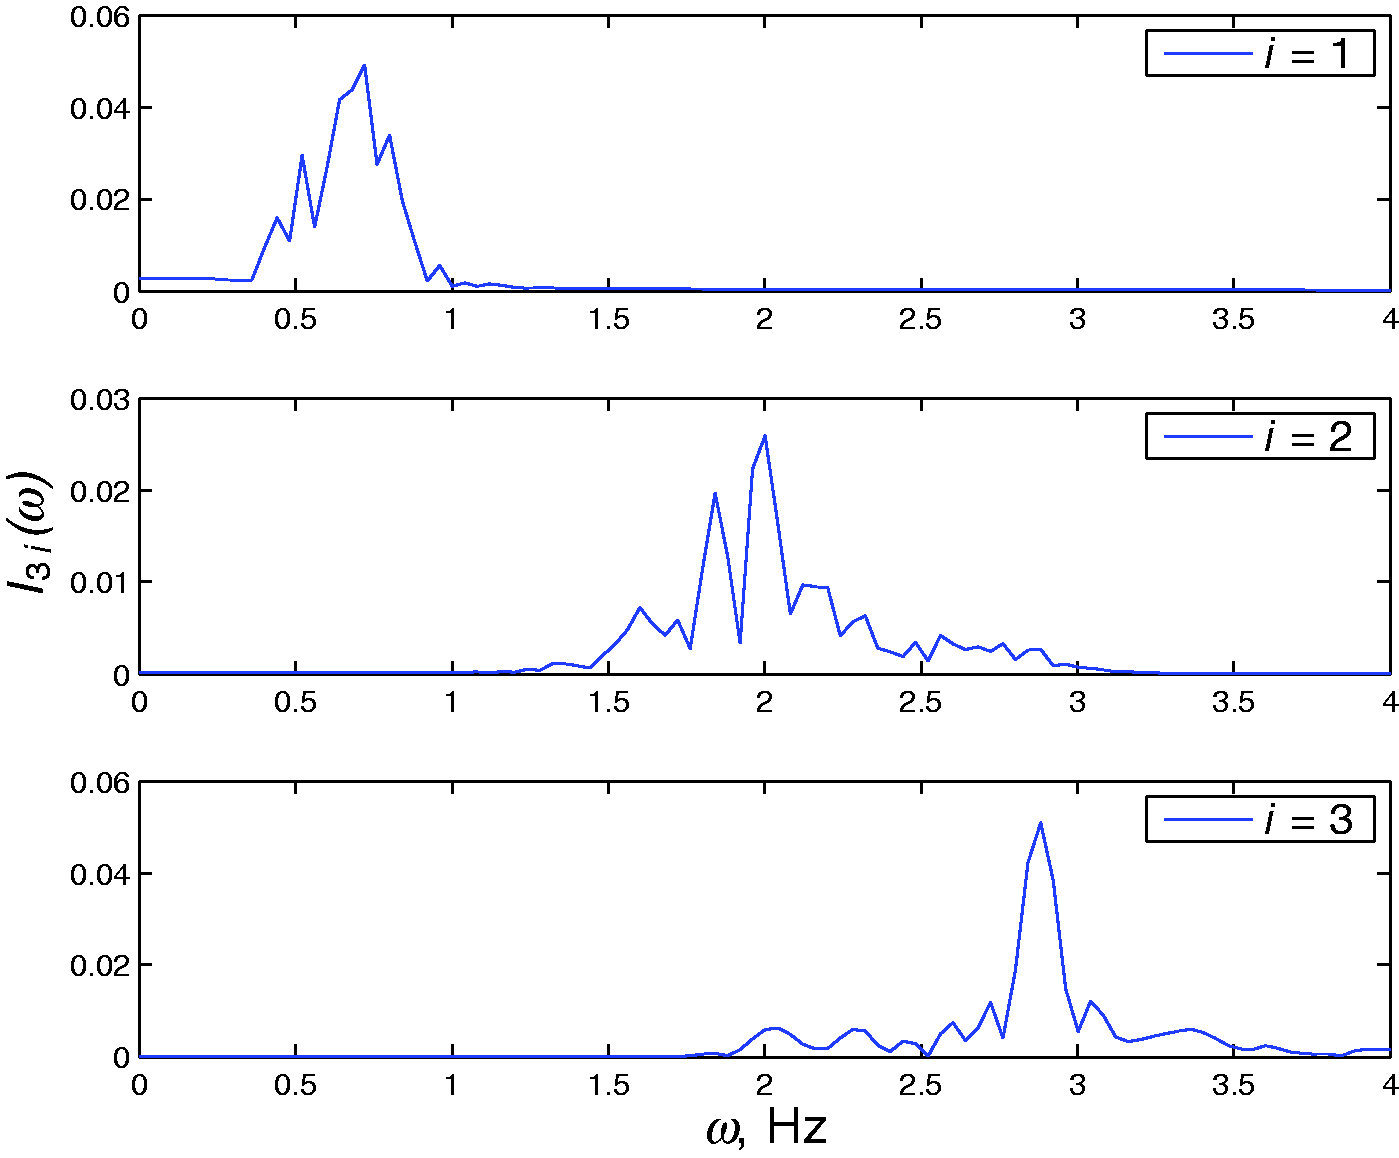
5. Experimental studies
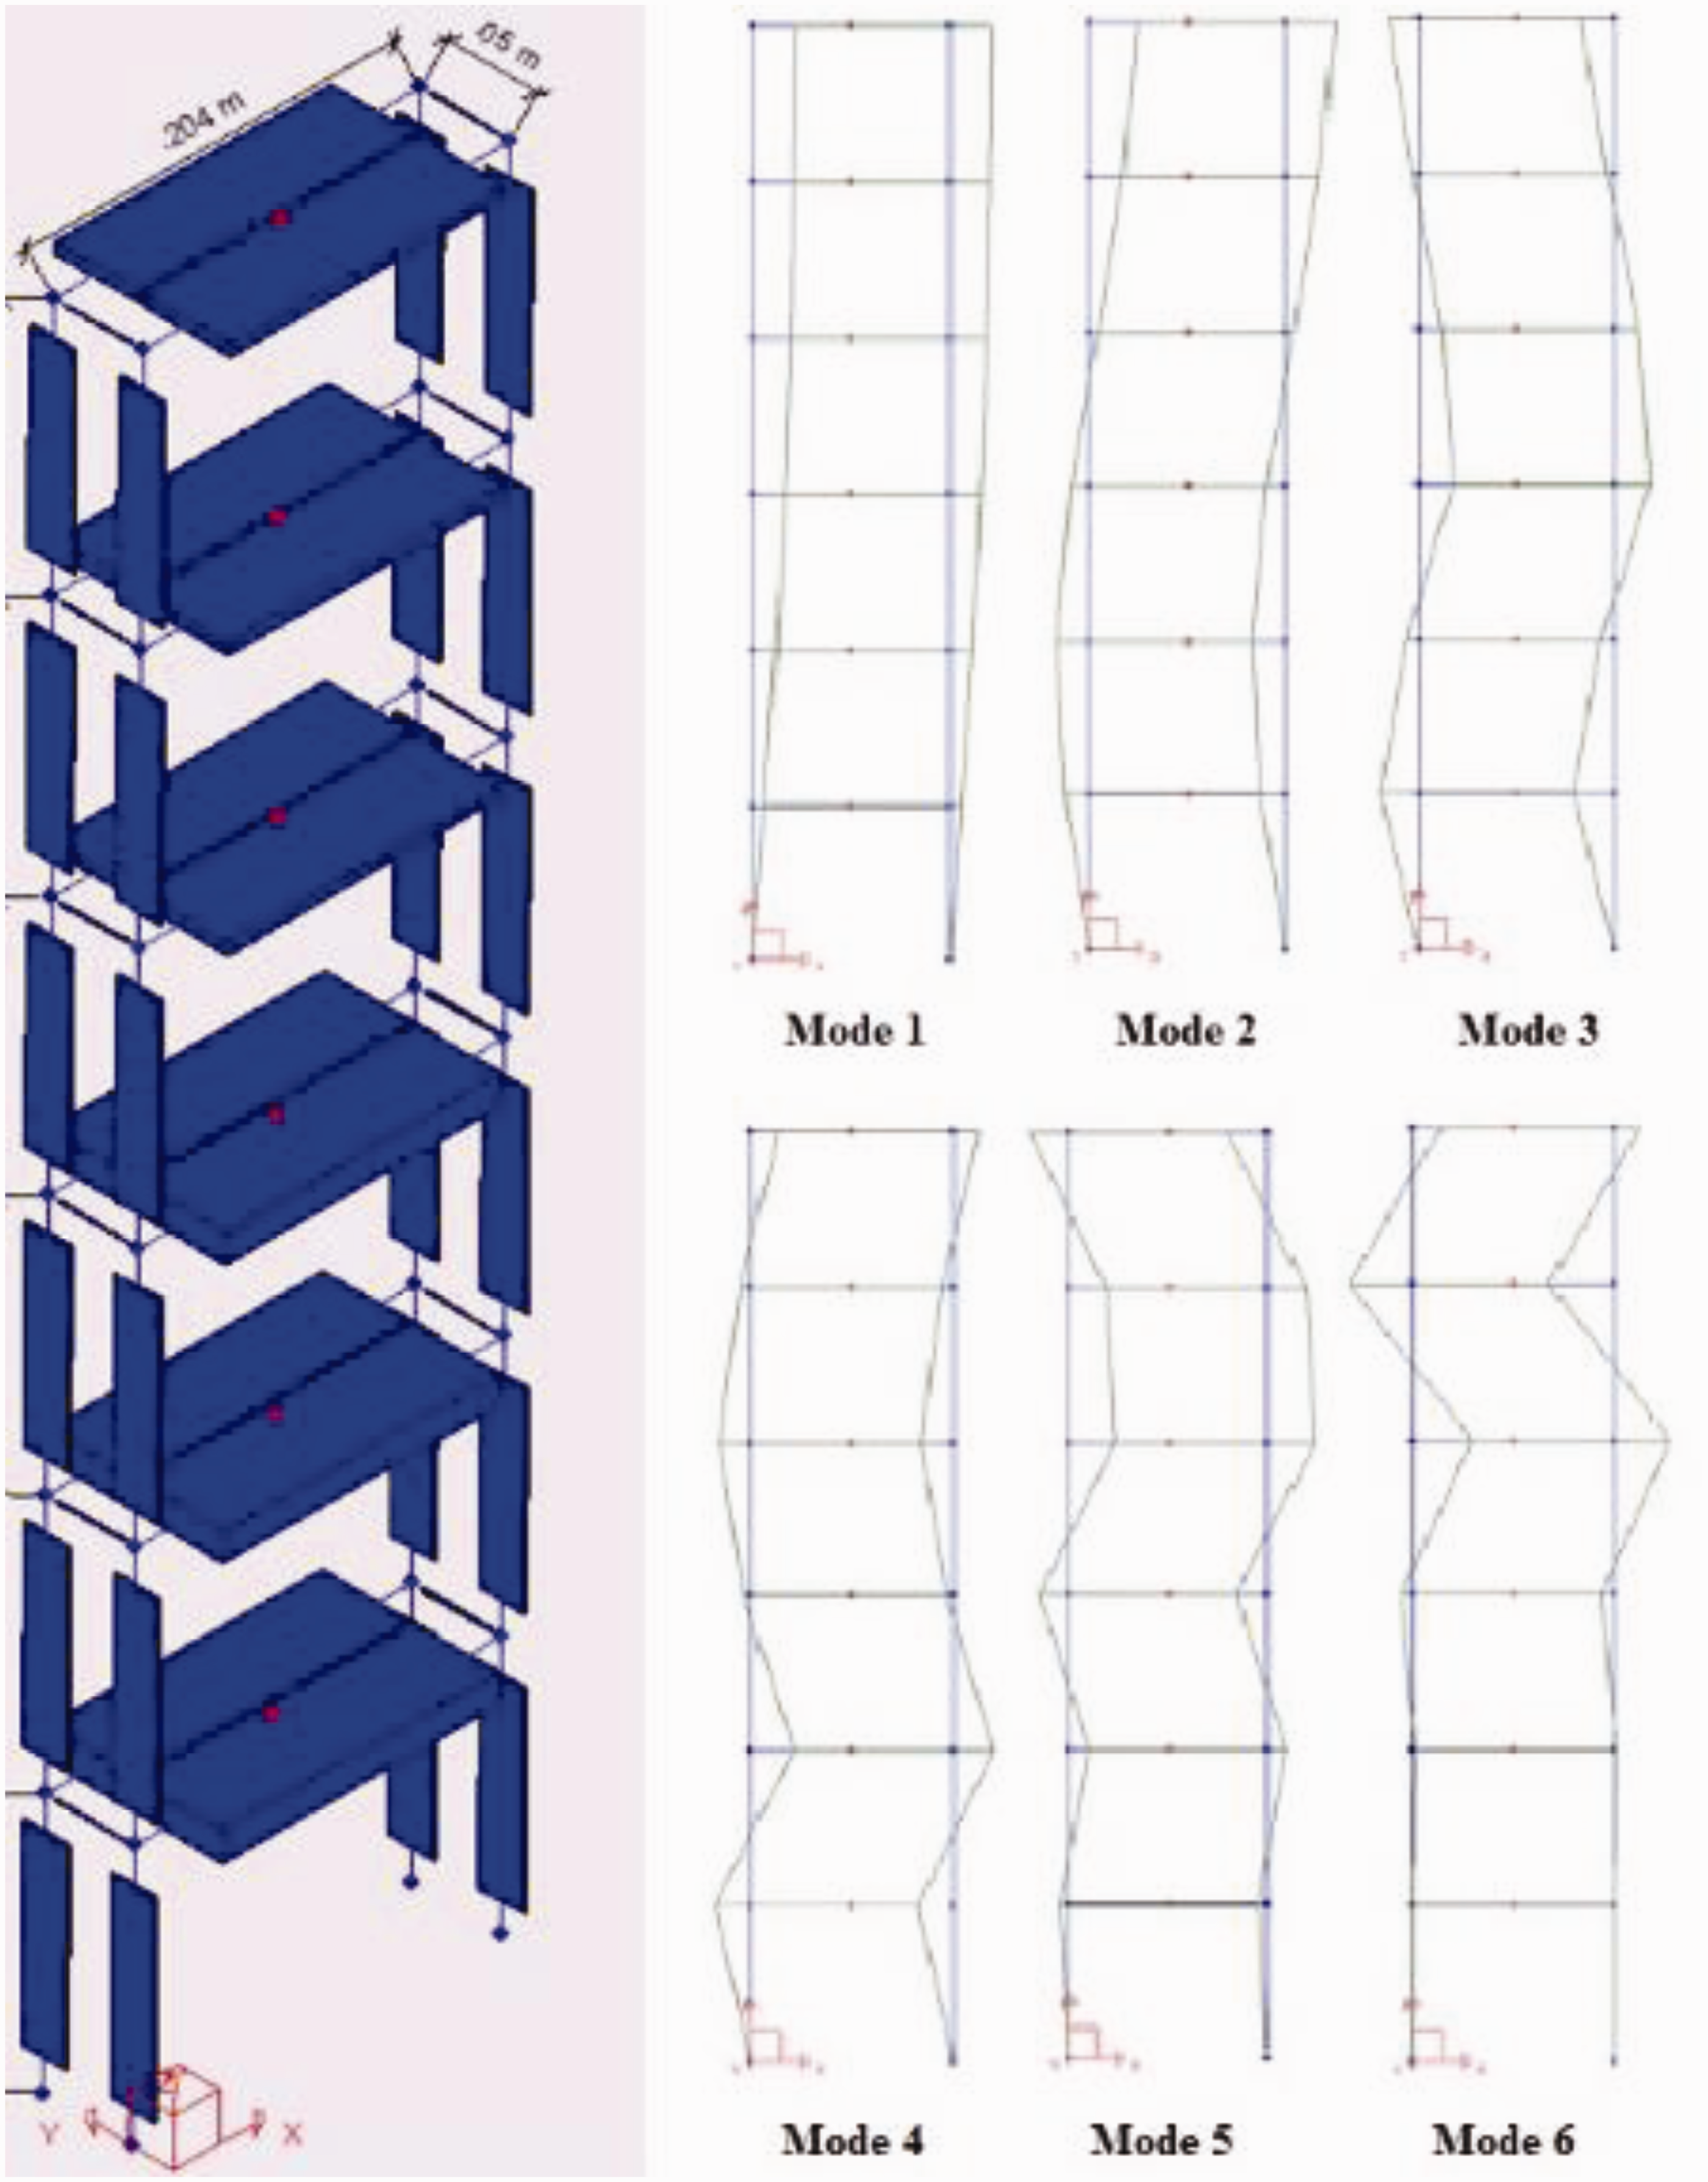
In order to demonstrate the proposed method, a six-storey experimental model is constructed as shown in Figure 10(a). The base of the model is fixed to restrict movement during testing, and each storey consists of a steel plate bolted to two columns on each side. The top three floors have masses of 1.12 kg and the bottom three floors have masses of 2.47 kg. As shown in Figure 10(b), the uniaxial sensors are placed at the side of each floor of the model, and are attached to the data acquisition system through a computer. The model is then excited using an impact hammer and the vibration data is collected from the six sensors (which are used for modal identification using the proposed algorithm).
(a) Experimental model, (b) sensors attached to the model.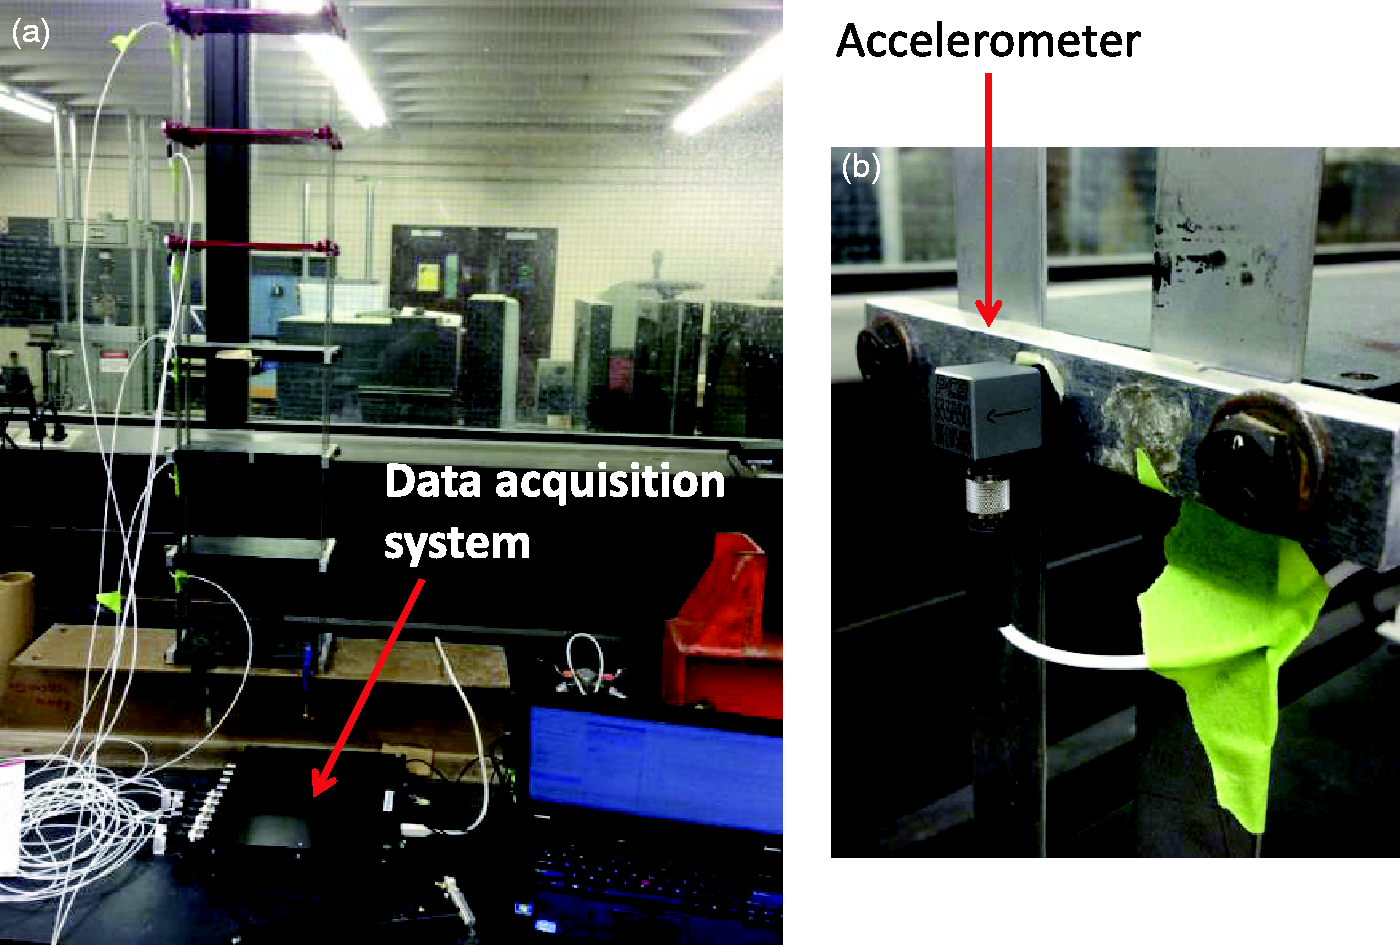
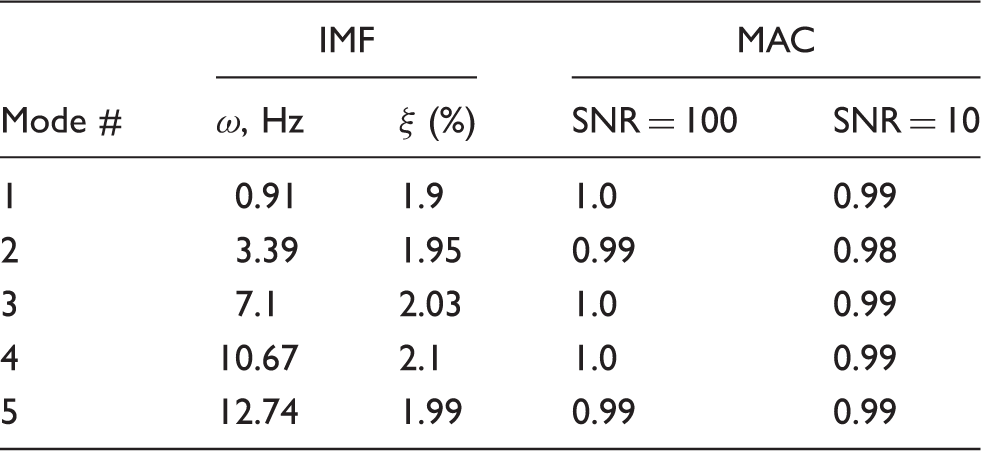
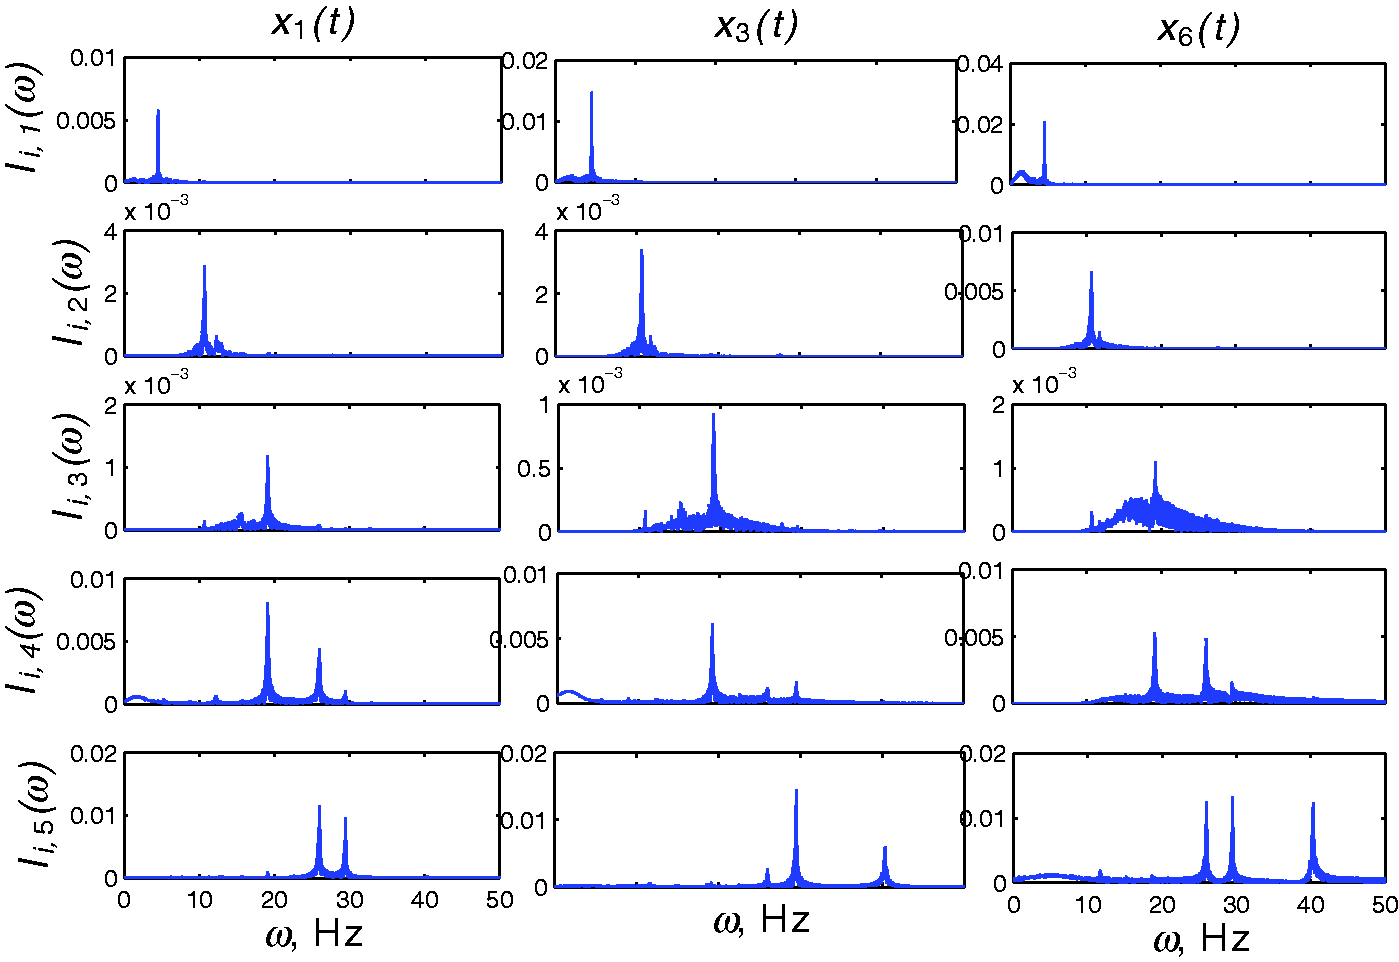
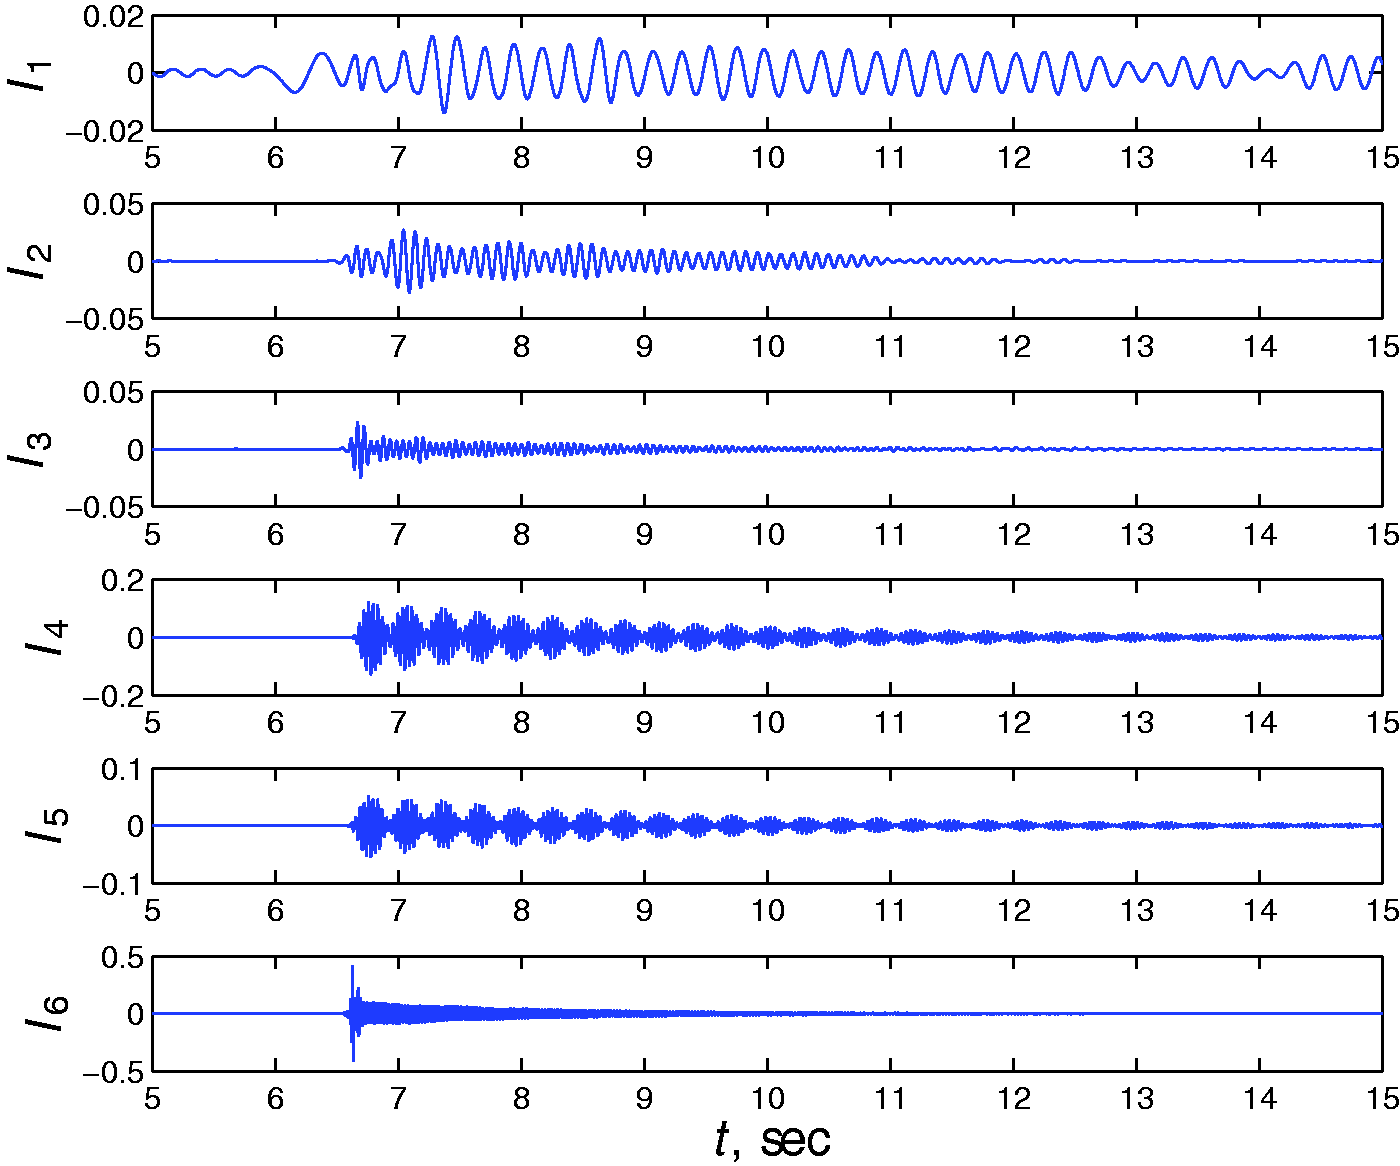
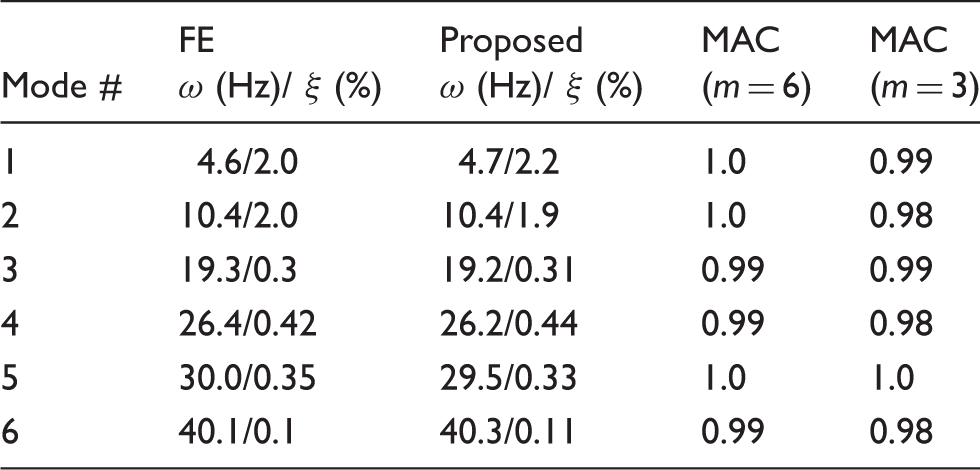
Figure 11 shows the Fourier spectrum of the top floor response of the model, which indicates significant modal participation of all modes. The MEMD is then undertaken using all six measurements, and the resulting IMFs for three typical measurements (i = 1,3,5) are shown in Figure 12. It should be noted that the first three IMFs in all measurements are accurately extracted, and the resulting mode shape coefficients are readily obtained. However, the remaining IMFs have mode mixing, and therefore EEMD is used to separate the modal responses. Figure 13 shows the modal responses of the building model extracted using the proposed method, from which the complete modal information (i.e. natural frequencies, damping and mode shapes) is estimated. In order to validate the accuracy of the proposed method, a finite element (FE) model of this building is constructed in S-Frame software as shown in Figure 14. The identified frequencies and mode shapes are compared with the FE modal parameters in Table 4. MAC numbers of greater than 0.99 indicate the accuracy of the proposed method. The theoretical damping is obtained based on the Rayleigh damping approximation, and is compared with the identified damping. The analysis is then repeated for a reduced number of measurements and partial mode shapes are compared with the FE results. As shown in Table 4, the MAC values of all modes obtained are more than 0.98, indicating the efficacy of the proposed method in the context of system identification even when using fewer sensors.
Fourier spectrum of the top floor response. IMFs of the top, middle and bottom floor measurements. Identified modal responses using the proposed method. Finite element (FE) model and the modal parameters. Identification results of the proposed method.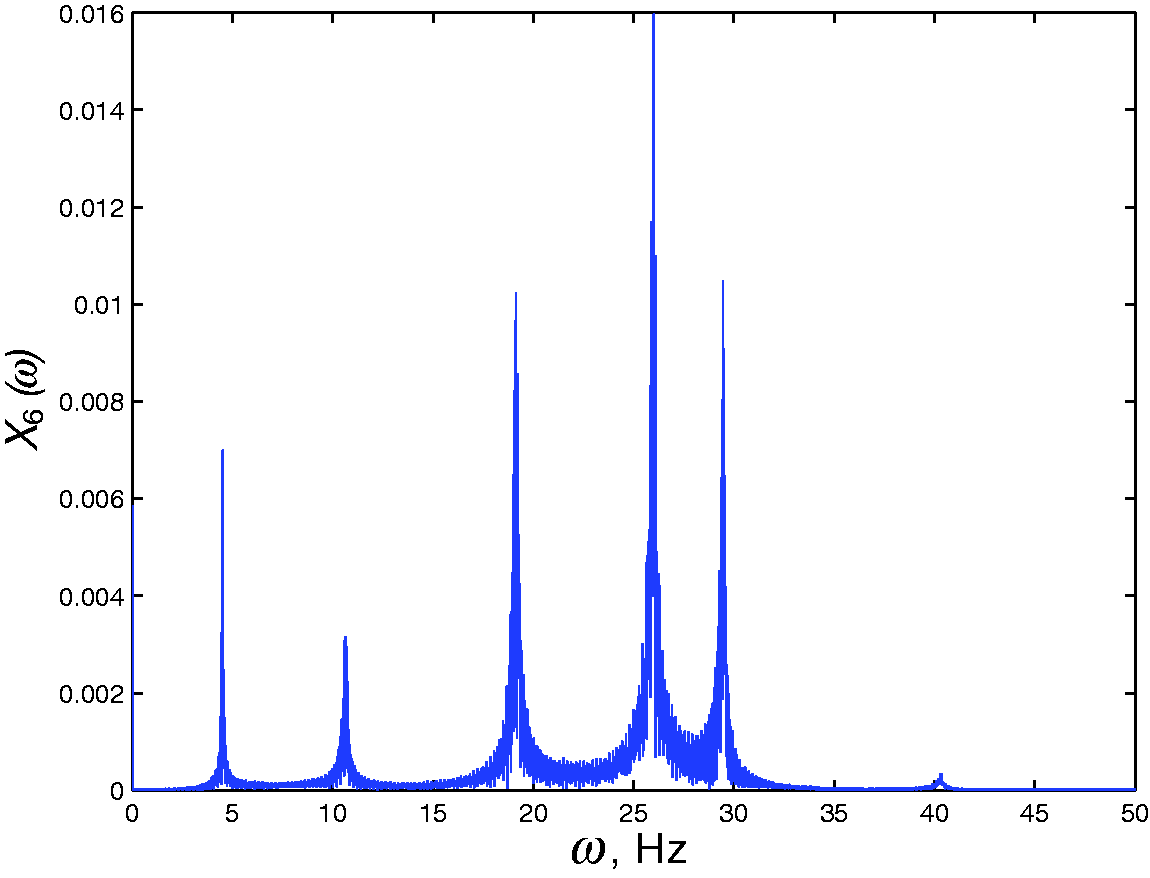
6. Conclusions
The MEMD method is explored for the first time as a possible candidate for a modal identification method employing multichannel vibration measurements. It has been seen that IMFs resulting from the MEMD are prone to mode mixing, which is then alleviated using the EEMD. In this way, a hybrid MEMD method is developed by combining the relative merits of MEMD (i.e. employing multiple sensors) and EEMD (i.e. resolving mode mixing issues). The proposed modal identification is then illustrated using a suite of numerical studies, including the cases containing measurement noise, low energy and closely-spaced modes. The result reveals that MEMD could be used as a modal identification tool when using full and fewer sensor measurements of structures.
Footnotes
Acknowledgments
The author thanks the undergraduate students (including Jacob Lean, Adam Quibell and Cody Tomiuck) who conducted the FE analysis of the experimental model used in this paper during their final year degree projects. The author thanks all the anonymous reviewers for providing valuable feedback and constructive criticism to improve the overall quality of the paper.
Declaration of Conflicting Interests
The author(s) declared no potential conflicts of interest with respect to the research, authorship, and/or publication of this article.
Funding
The author(s) disclosed receipt of the following financial support for the research, authorship, and/or publication of this article: This work was supported by the Natural Sciences Engineering Research Council of Canada (NSERC).