
Abstract
Development of condition monitoring approaches has played a key role in the stability and safety of frequency-varying machinery operations. Conventional time–frequency analysis methods suffer problems such as analysis results being too complex to realize highly intelligent and automated condition monitoring systems. Blind source separation is an attractive tool due to its excellent performance in separating defect source signals from their mixtures without detailed knowledge of sources and mixing processes; however, it can only be applied under some strict conditions. In this paper, a nonuniform sampling model is built and a new processing algorithm of frequency-varying signal is proposed. The relationship between the power spectral density (PSD) of the vibration signal of frequency-varying machinery and frequencies at different rotational speeds is derived. The proposed method can adaptively eliminate the influence of the varying rotational speed in the revised PSD. Some classical signal analysis methods are implemented to compare with the proposed approach by simulations. An experiment has been conducted by using a JD-1 wheel/rail simulation facility to illustrate the effectiveness of the proposed method.
Keywords
1. Introduction
Condition monitoring of rotating machinery has been a subject of intense academic and practical research for many years (Kankar et al., 2011; Zhang et al., 2015). Many techniques such as acoustics, magnetic fields, eddy currents, and thermal fields have been utilized in the past. Vibration analysis is a common approach for condition monitoring. It is based on the idea that the rotating machinery has a specific vibration signature under standard conditions, and this signature changes with the development of damage (Dong and Wei, 2014; Rohit et al., 2015).
Many solutions proposed in the literature require a constant frequency rotation since the characteristic fault frequencies are directly proportional to the rotating speed. In early studies, the main techniques used for condition monitoring were probability distribution characteristics such as skewness, kurtosis, and Fourier spectrum (Antoni, 2006). These methods have been proven under conditions including steady rotating frequency.
However, general operation of rotating machinery often involves varying motor speed, and in a frequency-varying application the fault characteristic frequencies change as instantaneously as the rotational frequency does (Blodt et al., 2008). Therefore, the Fourier spectrum cannot be used since it simply expands a signal as a linear combination of single frequencies that exist over time. This drawback is the motivation for greater focus on the rapidly developing approaches, time–frequency analysis and blind source separation (BSS), for condition monitoring of rotating machinery.
Each of the time–frequency analysis methods, such as short time Fourier transform (STFT; Djurović and Stanković, 2012), Wigner–Ville distribution (WVD; Stankovic et al., 2014), empirical mode decomposition (EMD; Masoud and Ali, 2012), and wavelet transform (Mckay et al., 2013), has some problems. STFT is only suitable for quasi-stationary signal analysis, and since there is no orthogonal base for STFT, it is difficult to find a fast algorithm to calculate STFT. WVD has good concentration in the time–frequency plane. However, even if support areas of the signal do not overlap each other, interference terms will appear on the time–frequency plane which will mislead the signal analysis. Many improved methods have been proposed to overcome the disadvantages of WVD, such as the Choi–Williams distribution (Wang et al., 2015) and S transform (Jaya et al., 2013), but their algorithms are highly inefficient. EMD is considered an unstable technique, since mode mixing can cause perturbation and result in a set of distorted intrinsic mode functions (IMFs), as reported by Antoniadou et al. (2013). The choice of mother wavelets might influence the results of the wavelet transform. In addition, the complexity of time–frequency analysis results needs human intervention to find the fault features from huge amounts of data. It is difficult to create highly intelligent and automated condition monitoring.
BSS is an attractive tool for condition monitoring due to its excellent performance in separating defective source signals from their mixtures without detailed knowledge of sources and mixing processes (Arnaut and Obiekezie, 2014; Acharjee et al., 2015; Bertrand, 2015; Gu et al., 2015; Zhang et al., 2016). However, BSS is limited to one source with a Gaussian distribution, and sometimes this is incompatible in actual condition monitoring cases. This is due to the central limit theorem which states that the Fourier coefficients quickly tend to Gaussian distribution even if the source signals are non-Gaussian.
It is difficult to state all the advantages and disadvantages of these analysis methods because of their different theoretical backgrounds. It is also reasonable to claim that for different situations different methods might work better than the others. The object of this paper is to propose a simple, fast, and accurate method to deal with condition monitoring problems of frequency-varying rotating machinery.
In Section 2, a nonuniform sampling model is built for deriving the relation between the rotational speed of the machinery and the statistical character of the vibration signal. From this a new processing algorithm of a frequency-varying signal is proposed. The validity of formulas is demonstrated by numeric simulations. The conventional time–frequency signal analysis methods, i.e. Choi–Williams time–frequency distribution and EMD, are implemented to compare with the proposed approach.
In Section 3, an experiment is described using a JD-1 wheel/rail simulation facility (Wang et al., 2011) to illustrate the effectiveness of the proposed method. The experiment’s data analysis results show that the proposed method is effective and obtains better condition monitoring results than conventional signal processing methods.
2. A new processing algorithm for a frequency-varying signal
2.1. Nonuniform sampling model
Define the nonuniform sampling times Nonuniform sampling model.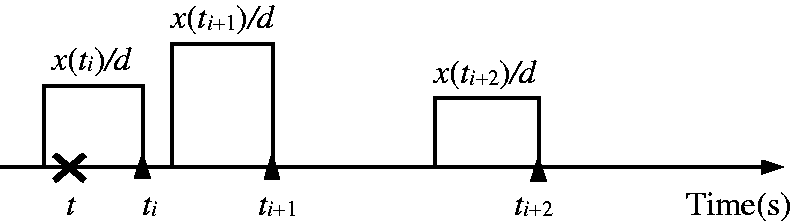
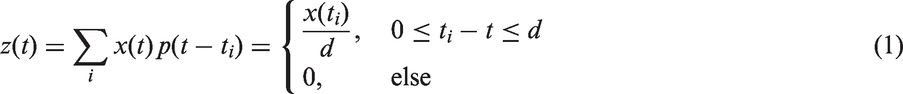
Define the nonuniform sampled signal model as follows:
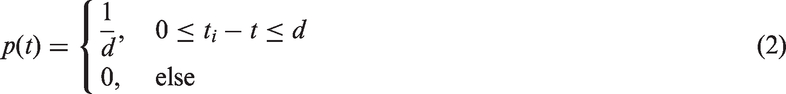
In practical applications the width of sampling pulse

The length of the n th sampling point after time t is Distance distribution of the nonuniform sampling model.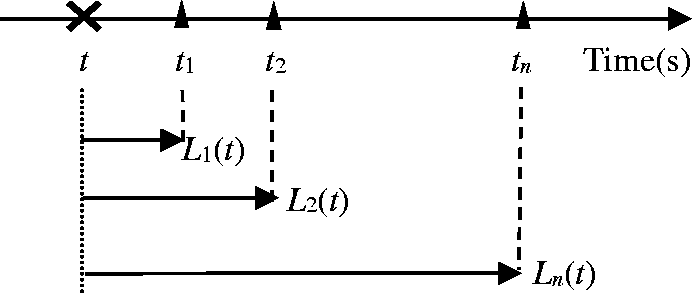
The distribution function of

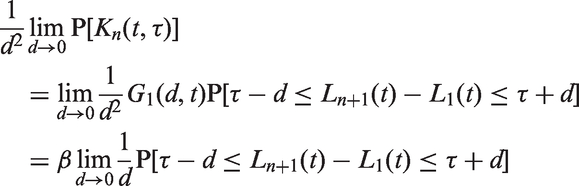
Define β as the average number of the nonuniform sampling points per unit time

Equation (4) means that the average length of n successive sampling intervals is n times the average length of one sampling interval.
In this nonuniform sampling model, the distribution function
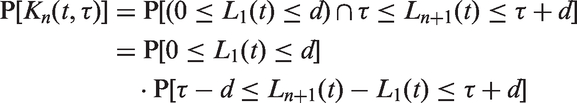
The event
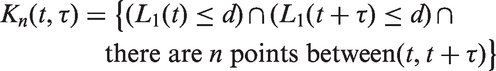
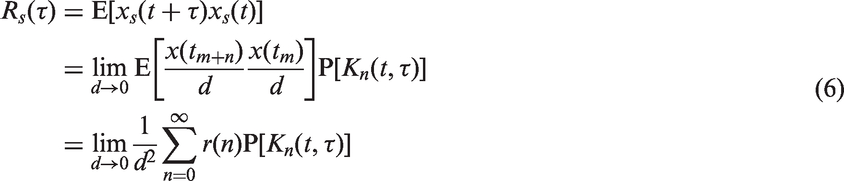
The autocorrelation function of

From equations (3) and (5), the autocorrelation function of the nonuniform sampled sequence is given by
Now we discuss the autocorrelation function according to the value of τ.
While
As far as

Equation (6) can now be written as

Let

From equations (7) and (8), we obtain
While

As far as
Therefore, we have
Defining

Combining equations (9) and (12) with equation (6), the autocorrelation function of the nonuniform sampled signal is given by

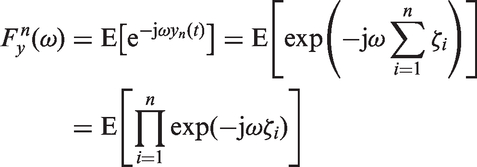
The power spectral density (PSD) is a Fourier transform of the autocorrelation. Performing the Fourier transform of equation (13) and letting

Noticing that
By letting the nonuniform sampling interval

Combining equation (14) with equation (16), the PSD of the nonuniform sampling sequence is as follows
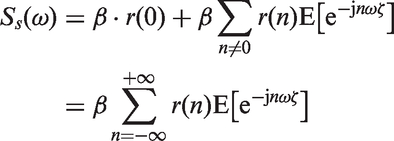
The PSD of the conventional uniform sampling sequence is

A high degree of similarity can be seen by comparing the proposed PSD (equation (17)) of the nonuniform sampling process with the PSD (equation (18)) of the uniform sampling case. In equation (17), if we let

When the sampling interval T equals one second, equation (19) = equation (18), and it is obvious that the proposed PSD of the nonuniform sampling process covers the special case of uniform sampling. Therefore, the accuracy of the proposed PSD is valid.
2.2. Frequency-varying signal processing
In this subsection we propose a new processing algorithm for the frequency-varying signal based on the nonuniform sampling model.
Let

In order to eliminate the spectrum distortion caused by variable frequency of the rotating machine, the sampling interval ζ should decrease with the increment of rotating speed v. That is to say, ζ is inversed to v,
Let
Therefore, equation (20) can be rewritten as follows

Then calculate the probability density function

The estimate is related to the number of speed sections divided by K. Our studies show that the optimal estimation results can be obtained if the value of K makes each section possess instantaneous rotating speed data.
Combining equation (17) with equation (21), we propose a novel, simple, and fast algorithm for the revised PSD to deal with real-time vibration analysis of frequency-varying machinery

As far as the vibration condition monitoring system, the energy centrobaric spectrum is used as the indicator to reflect the machinery condition, which is defined as follows
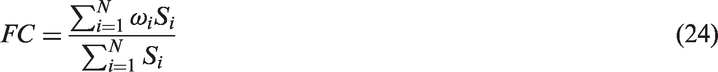
Corresponding to different wear conditions, rotating machinery has different vibration signatures that largely affect the spectrum centrobaric. Therefore, the energy centrobaric spectrum can be calculated by the proposed method to supply a rapid alert in condition monitoring of rotating machinery.
2.3. Simulation
In this subsection, the conventional signal analysis methods and the proposed algorithm are used to analyze the frequency-varying signal as follows

Frequency-varying signal 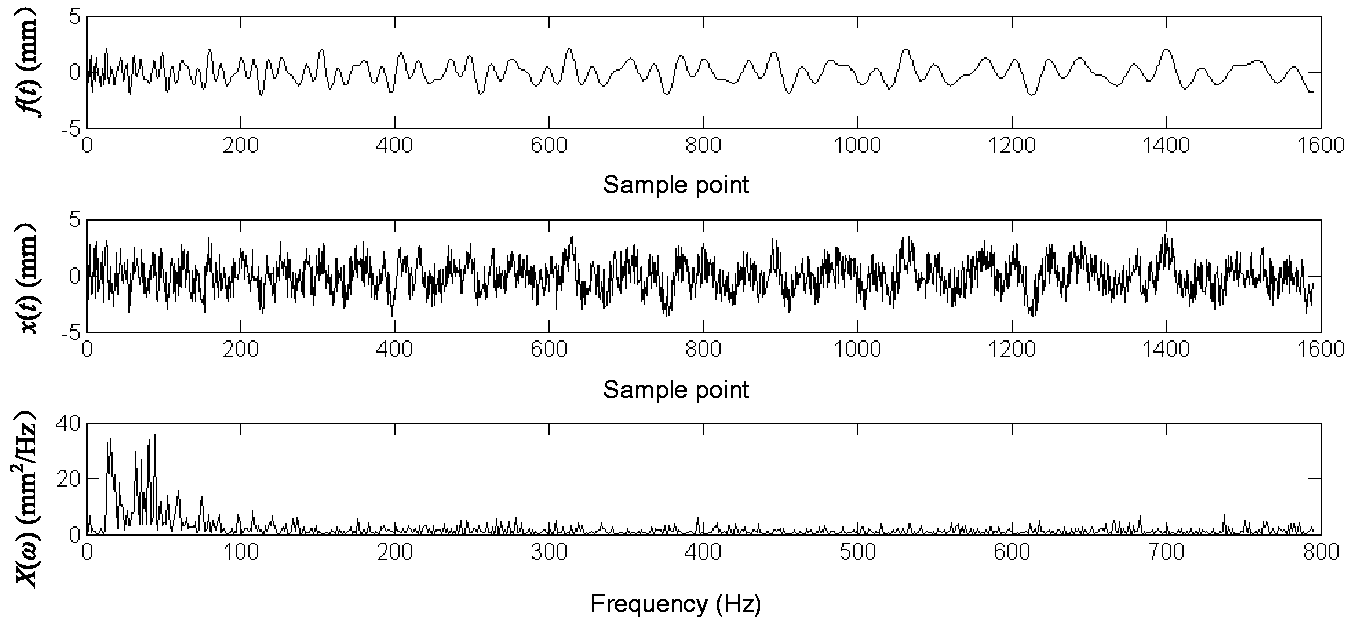
Then, the EMD of the frequency-varying signal Processing result of signal 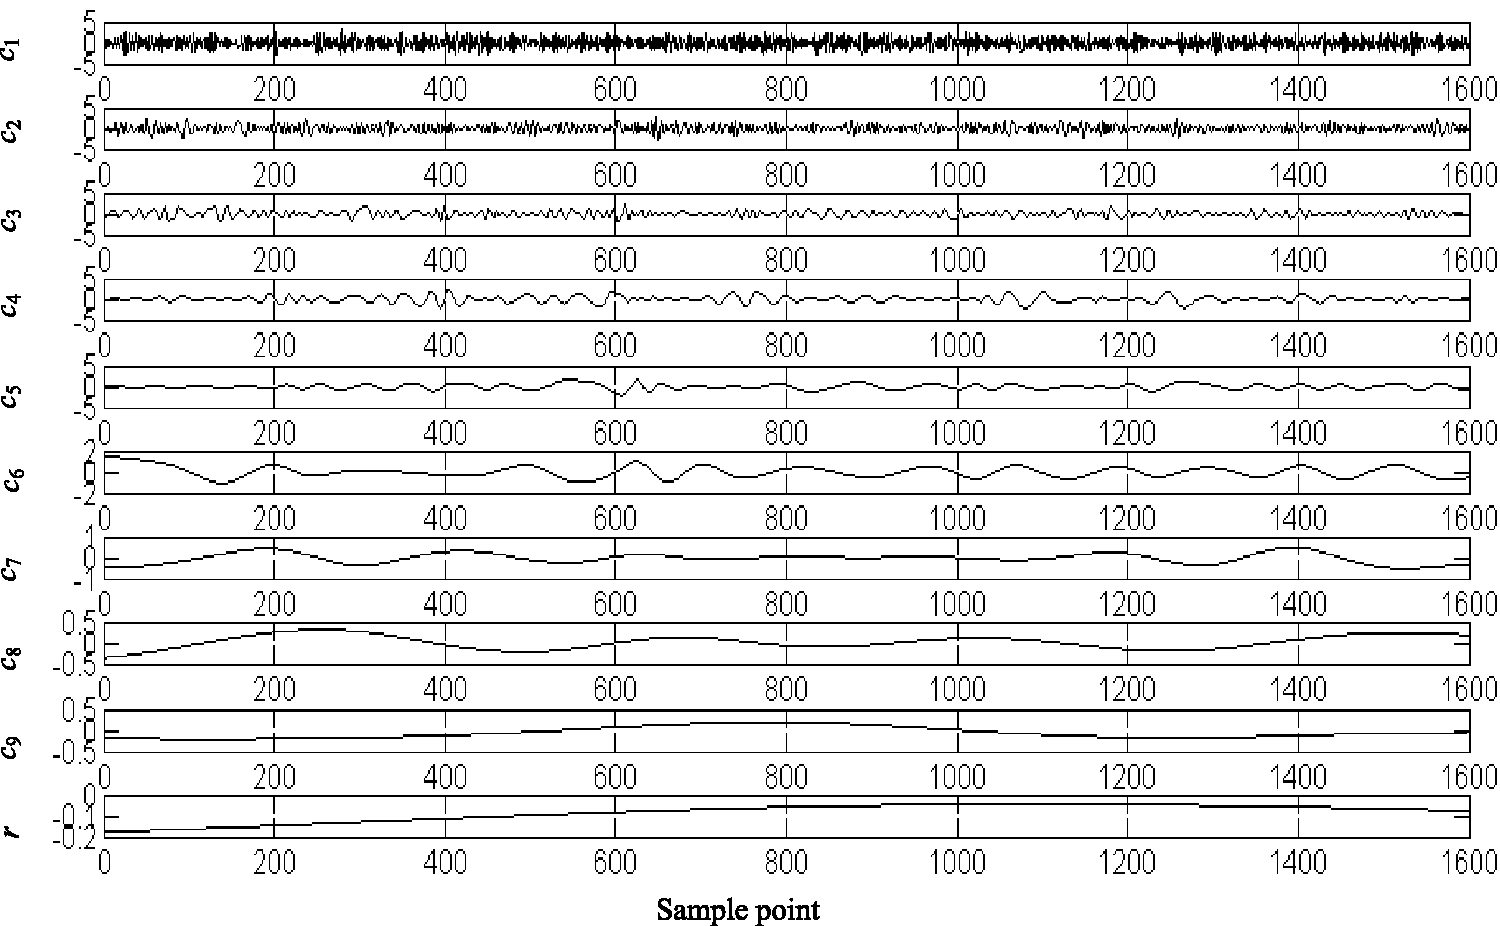
Next, the performance results of the Choi–Williams time–frequency analysis for the frequency-varying signal Choi–Williams time–frequency distribution of signal 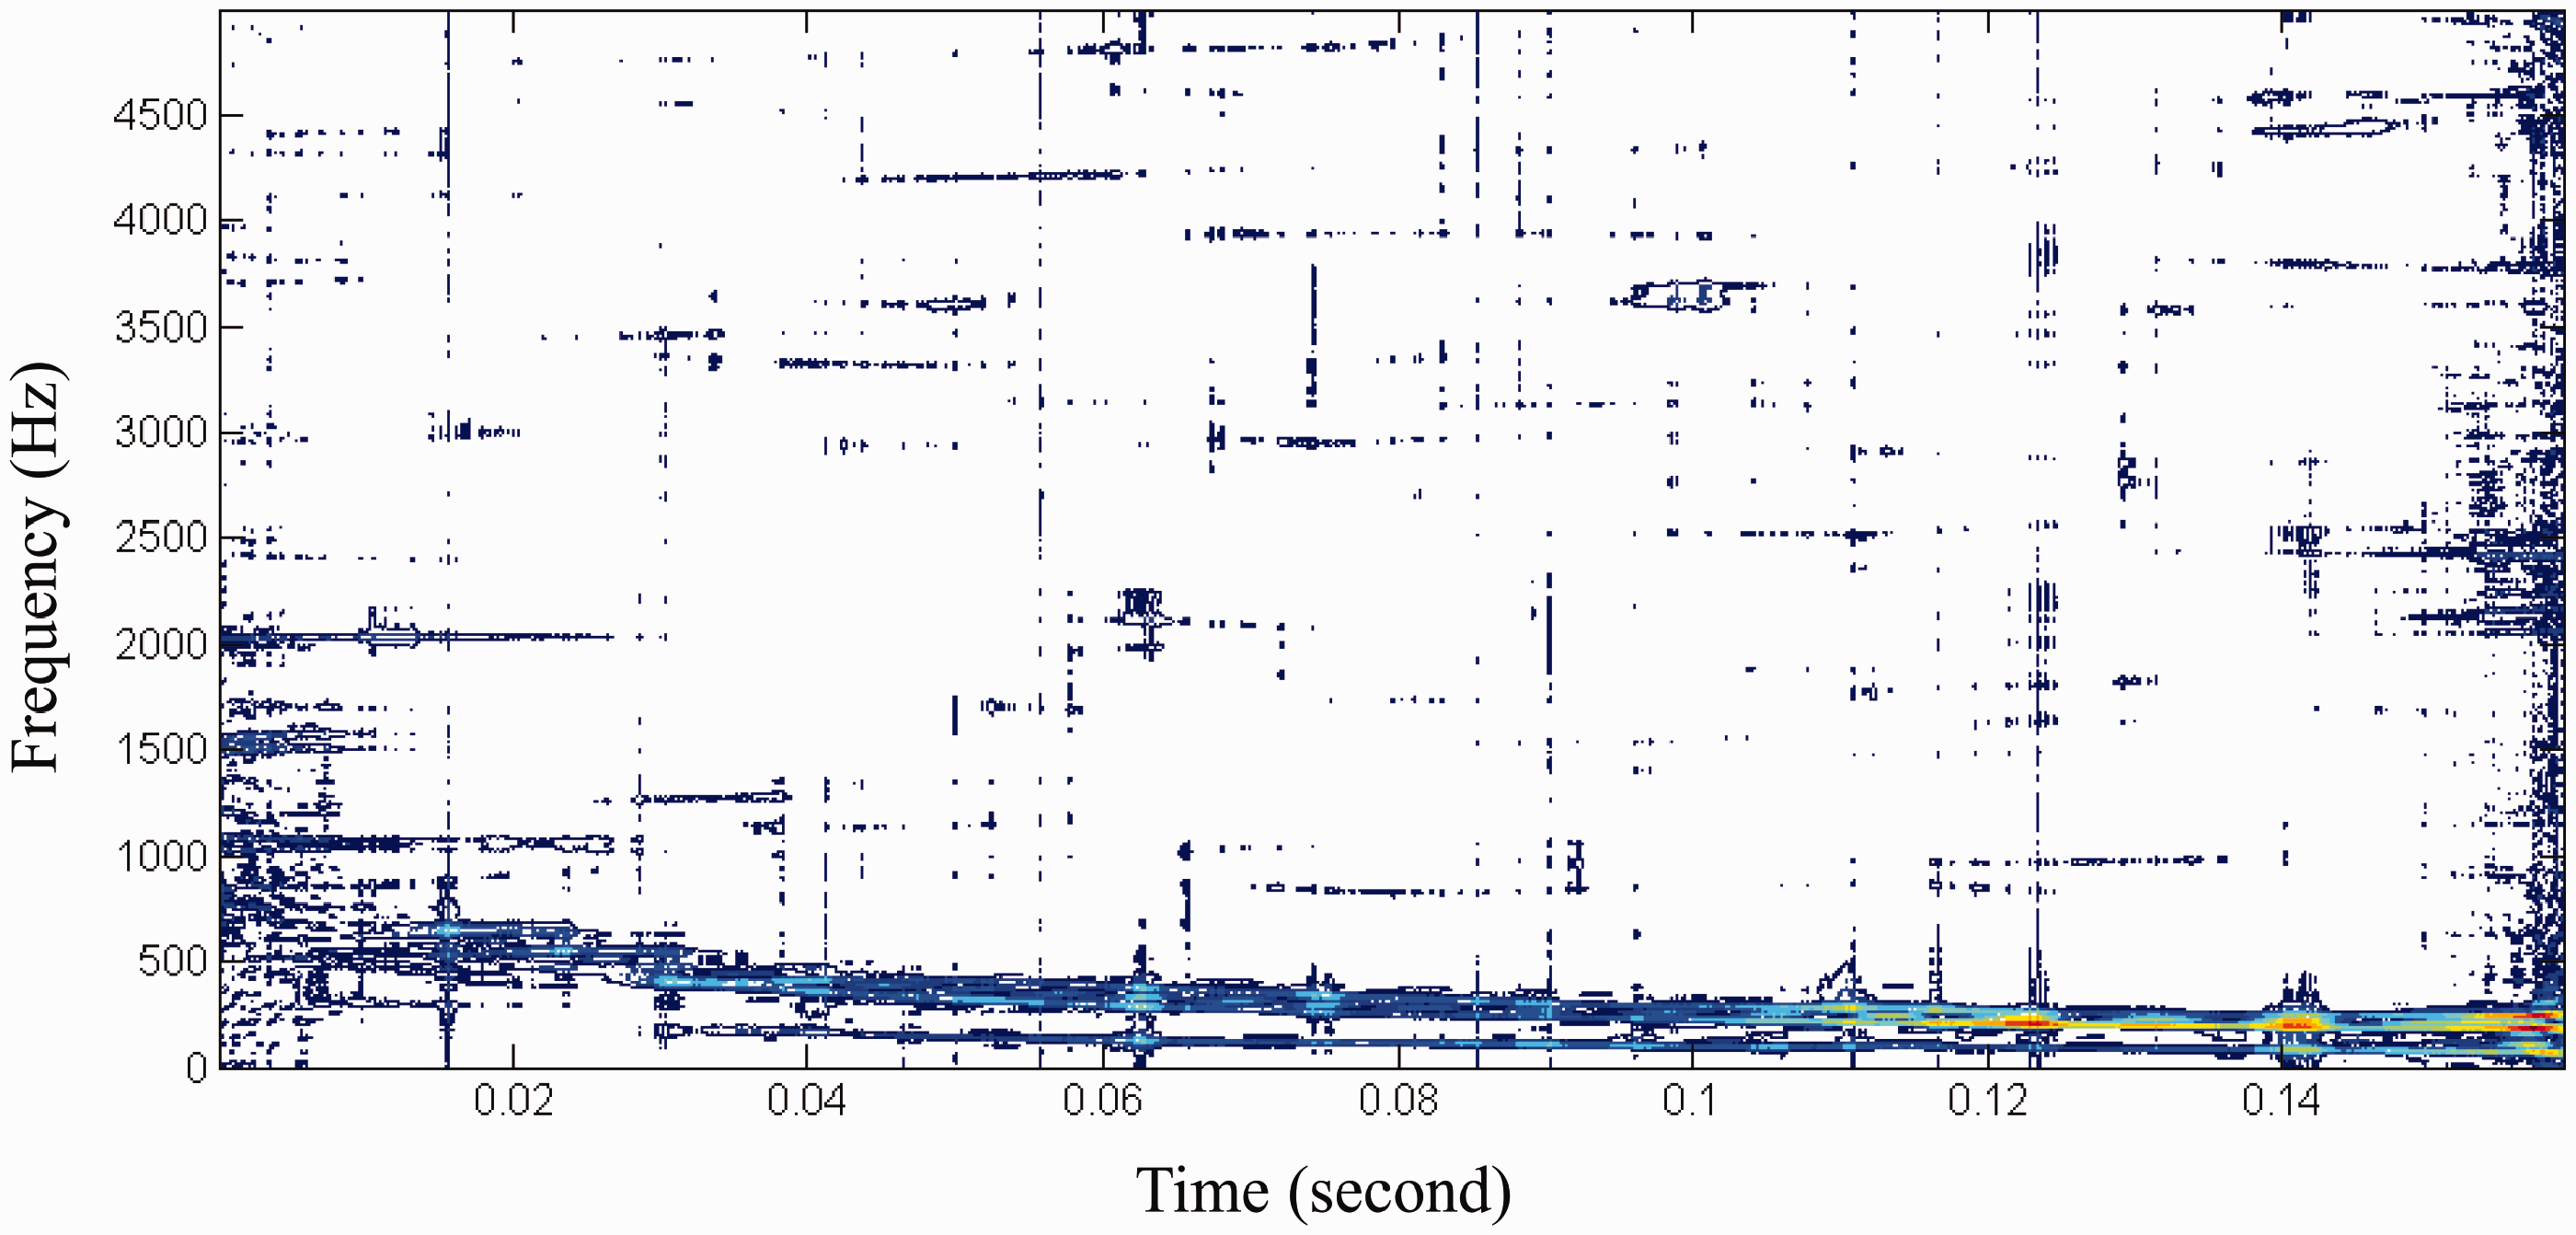
Finally, the proposed algorithm is used to analyze the frequency-varying signal Processing result of signal 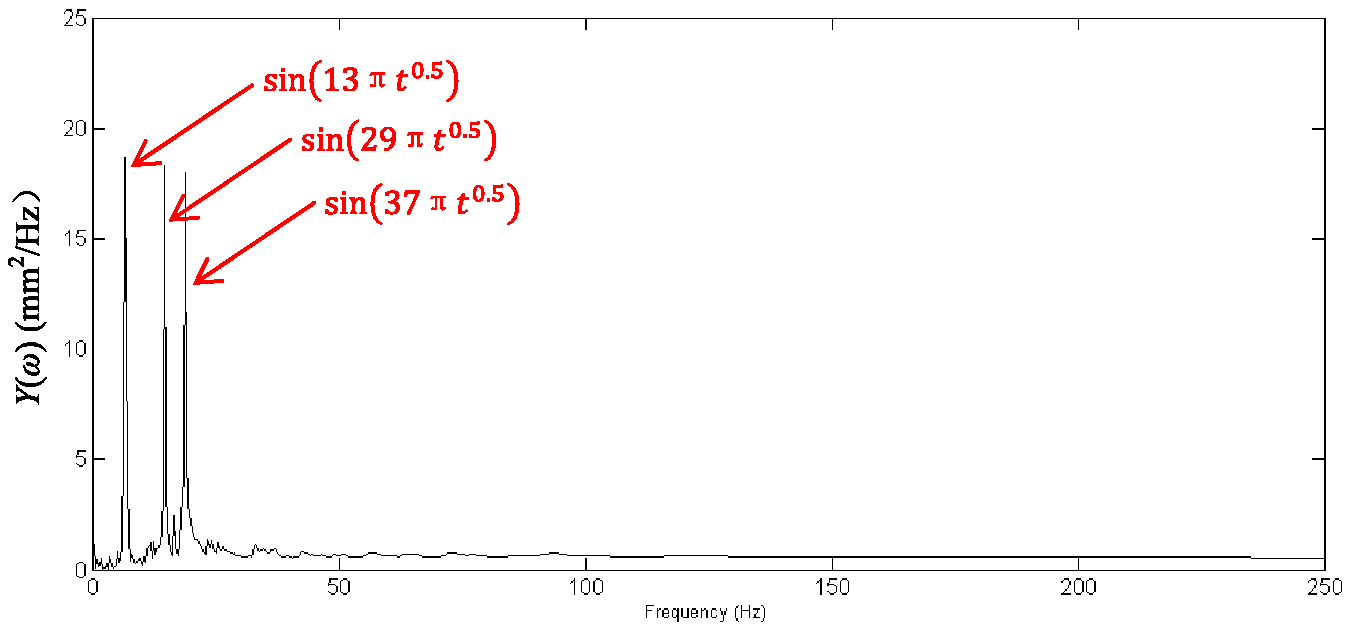
3. Experiments
All experiments for condition monitoring of rotating machinery with varying frequency are conducted on a JD-1 wheel/rail simulation facility (Wang et al., 2011), as shown in Figure 7.
JD-1 wheel/rail simulation facility.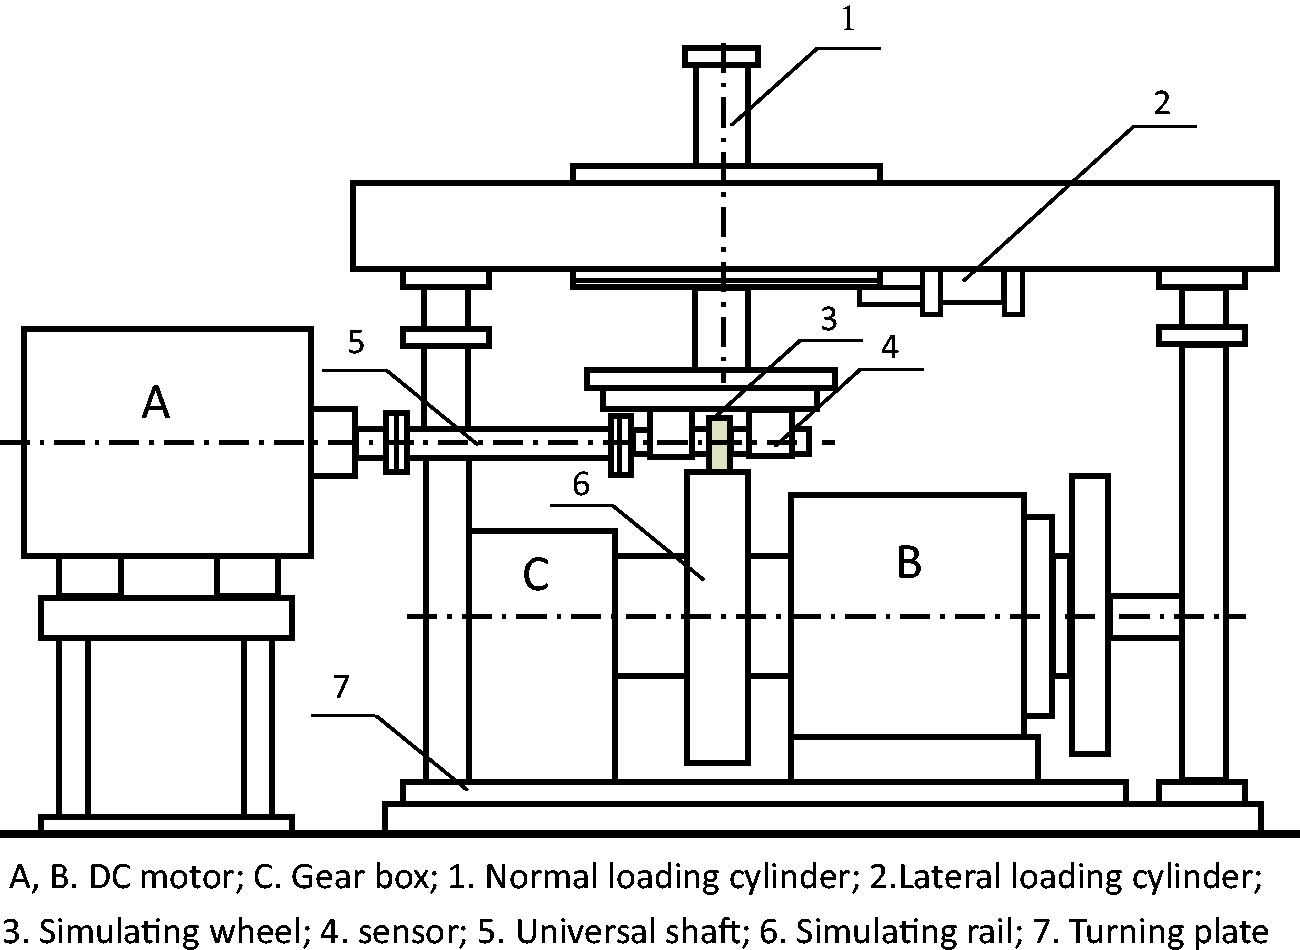
The tester is composed of a small wheel roller and a large wheel roller which are driven by DC motors A and B, respectively. Motor speed imposed on the rollers can be controlled accurately.
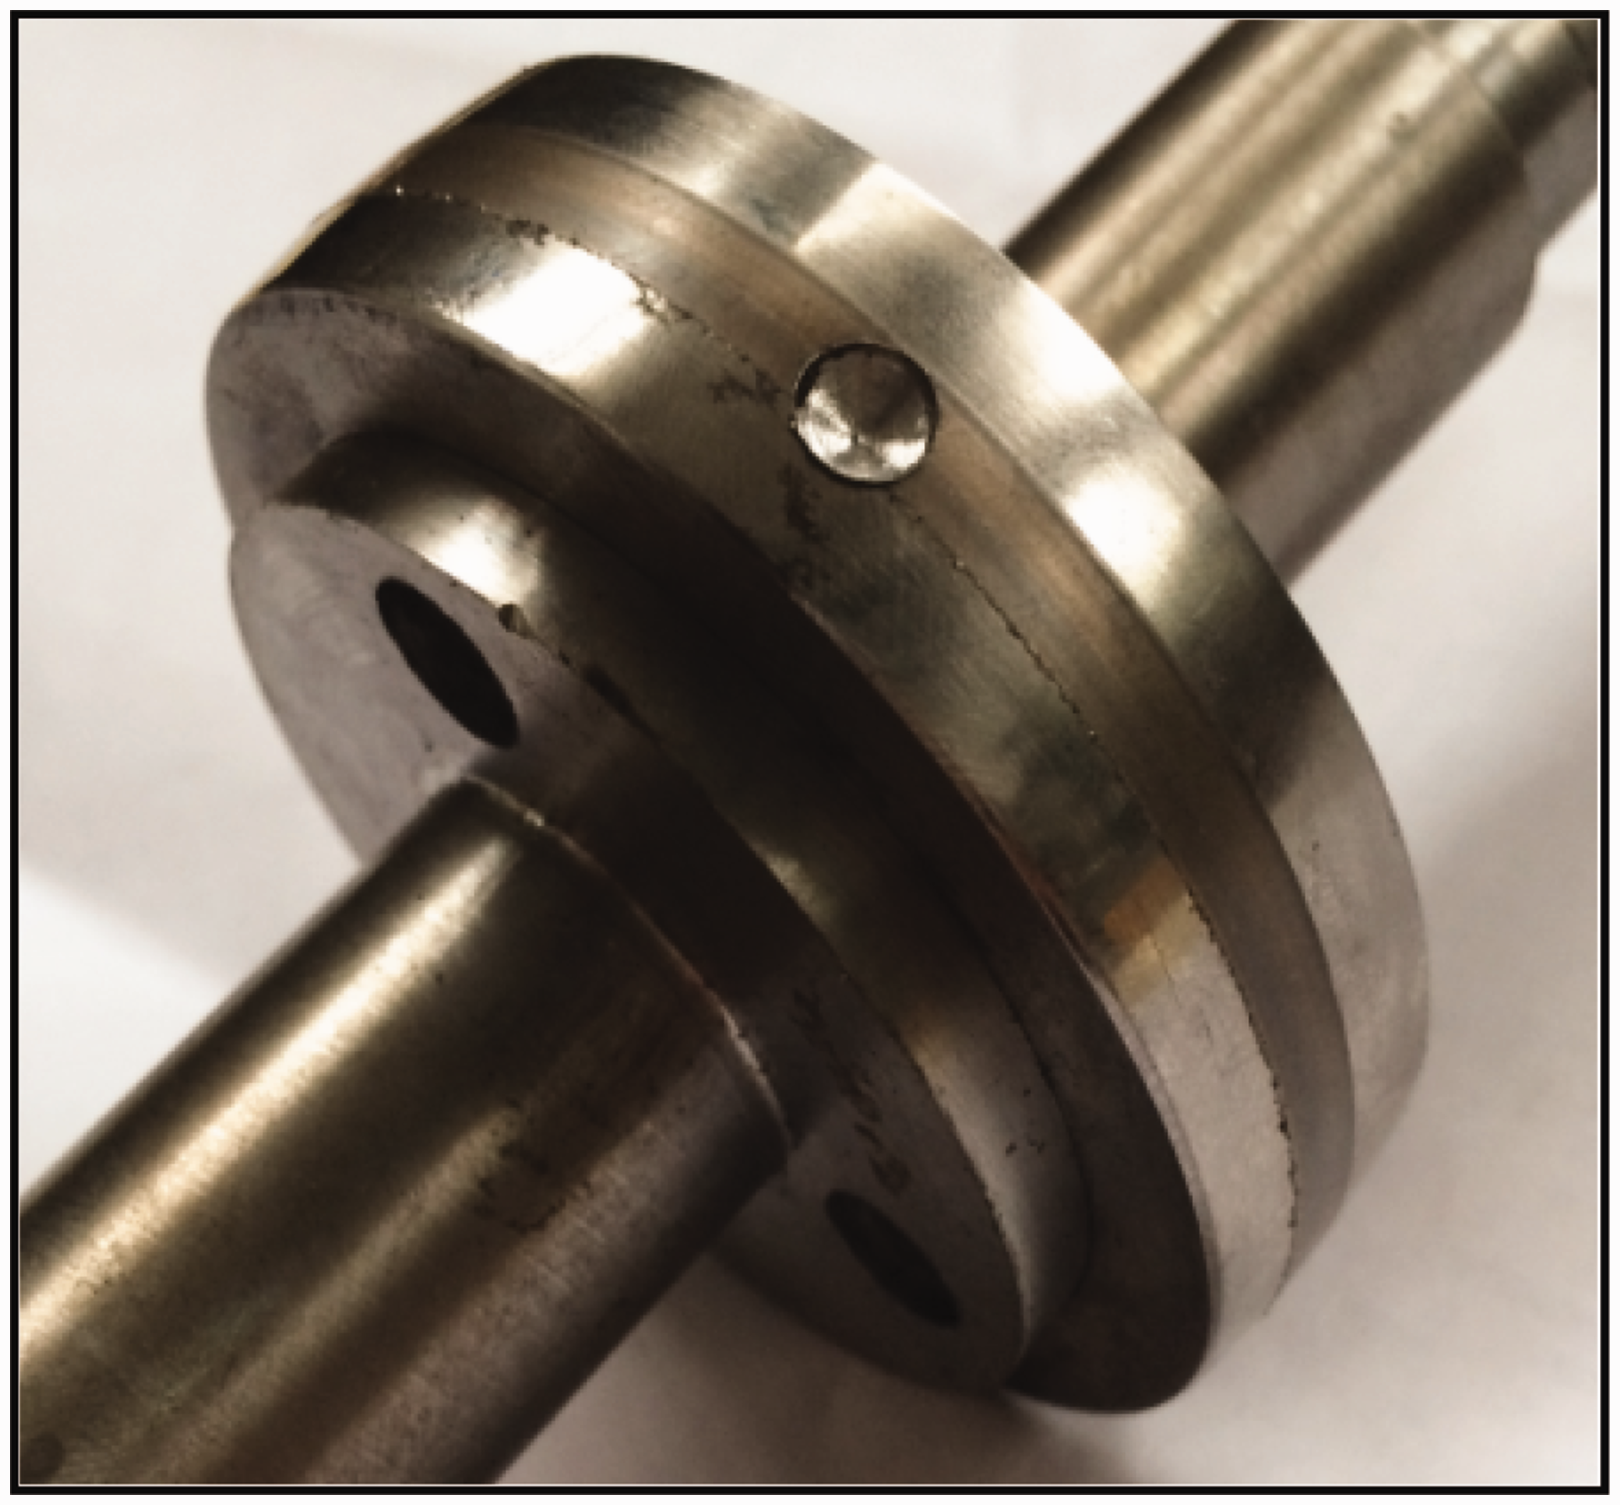
The experimental purpose is vibration monitoring and signal analysis when the small wheel rotates in uniform and varying speed, respectively. An acceleration sensor is used to measure longitudinal vibration signals. The small wheel is made as shown in Figure 8, and a cavity is machined on this wheel, as shown in Figure 9.
Small wheel. Wheel cavity.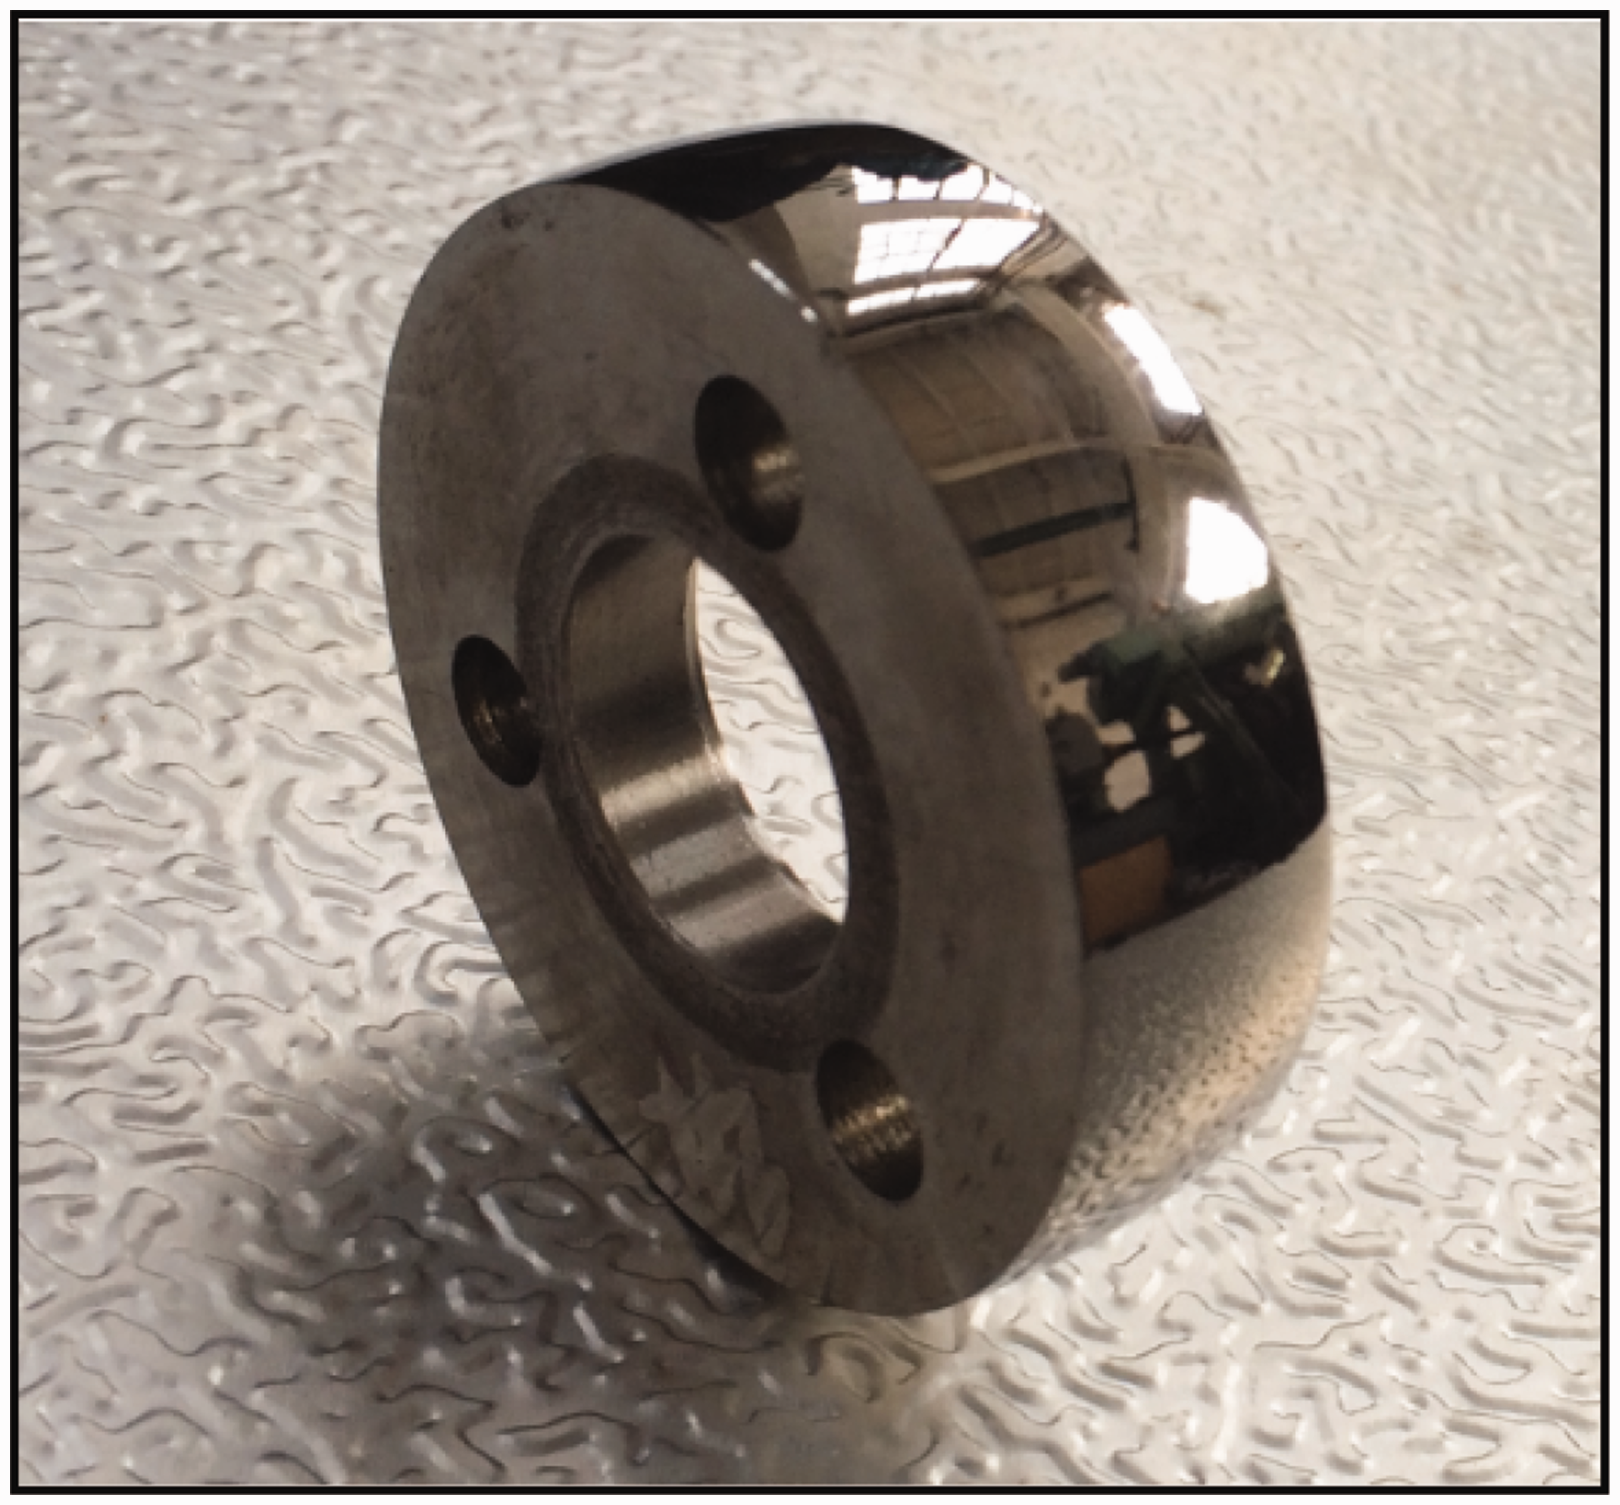
First, normal and faulty wheels rotate at a uniform speed of 35 r/min. The vibration signals Vibration signal PSD 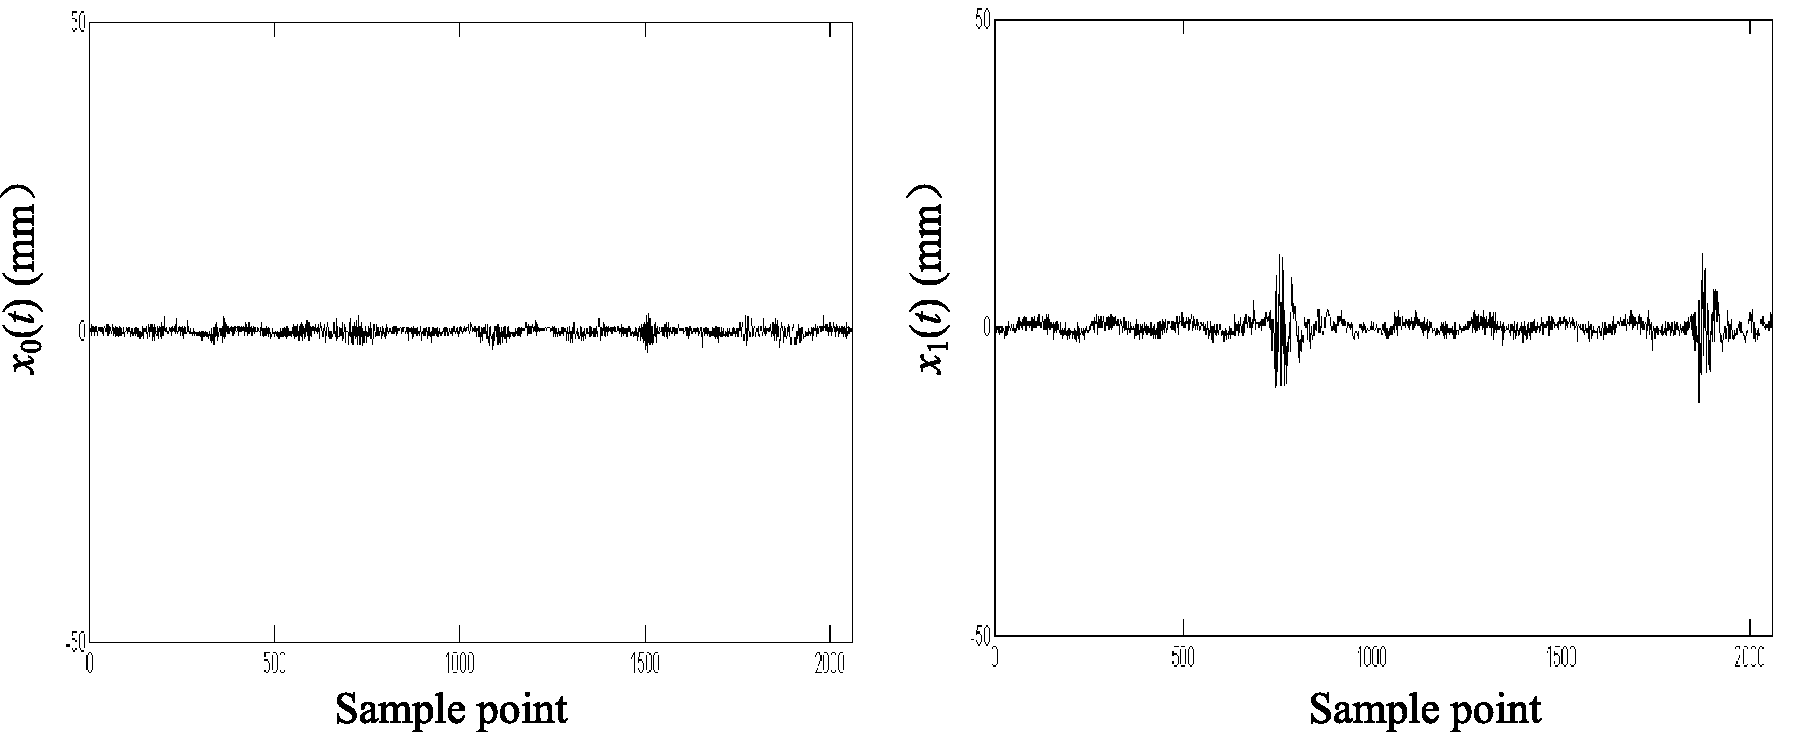
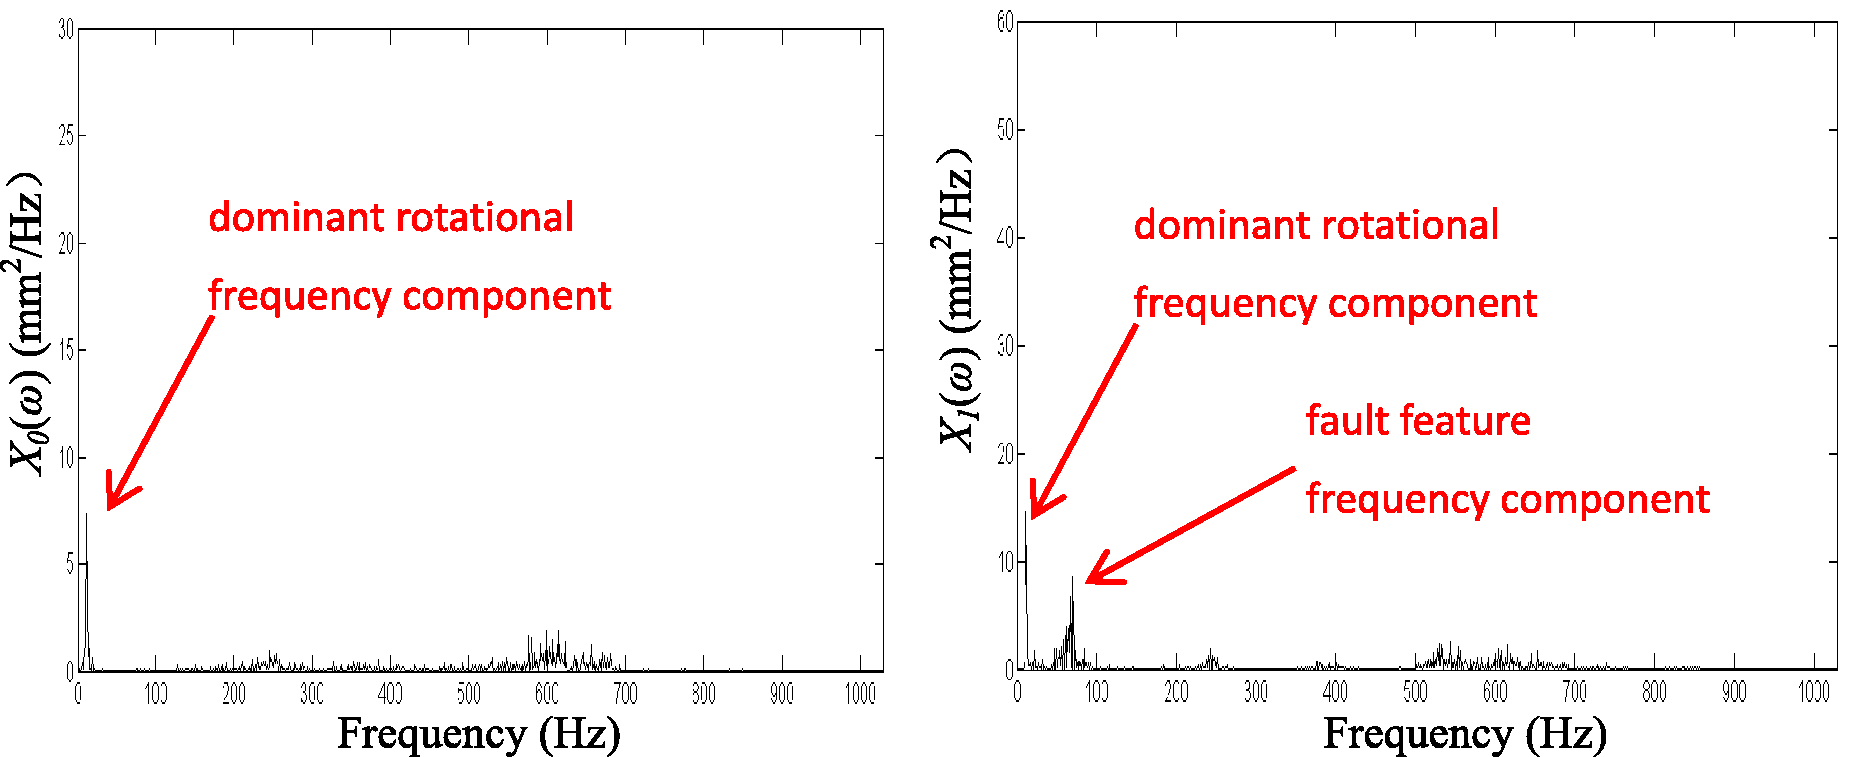
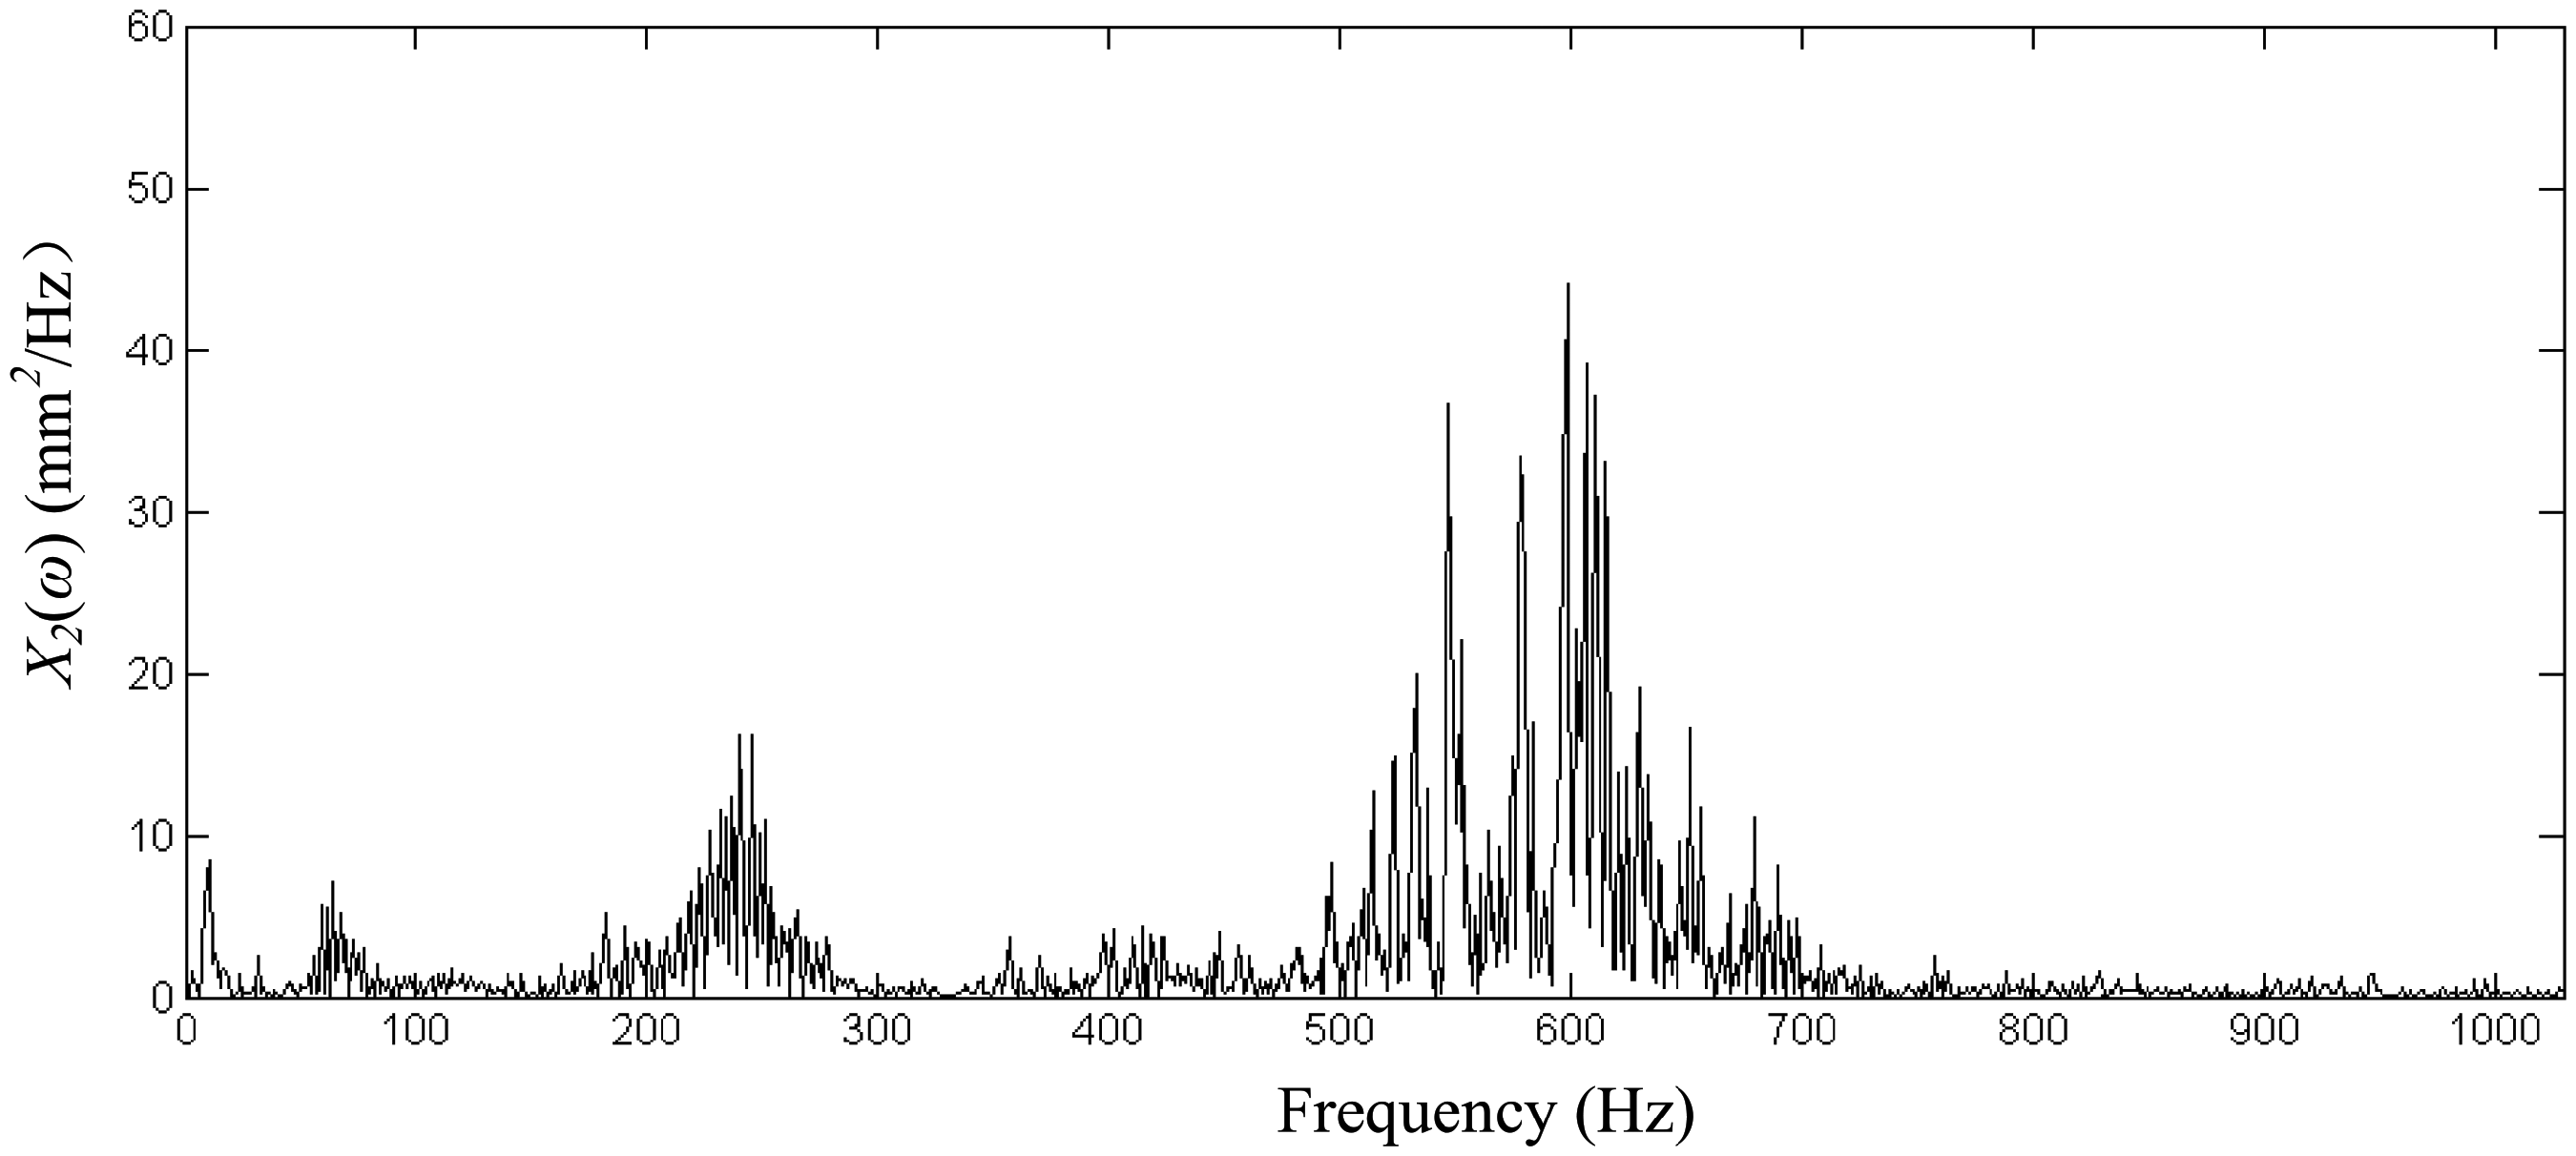
Then the faculty wheel rotates with varying speeds of 35 r/min, 56 r/min, and 98 r/min, sequentially. The vibration signal Vibration signal PSD 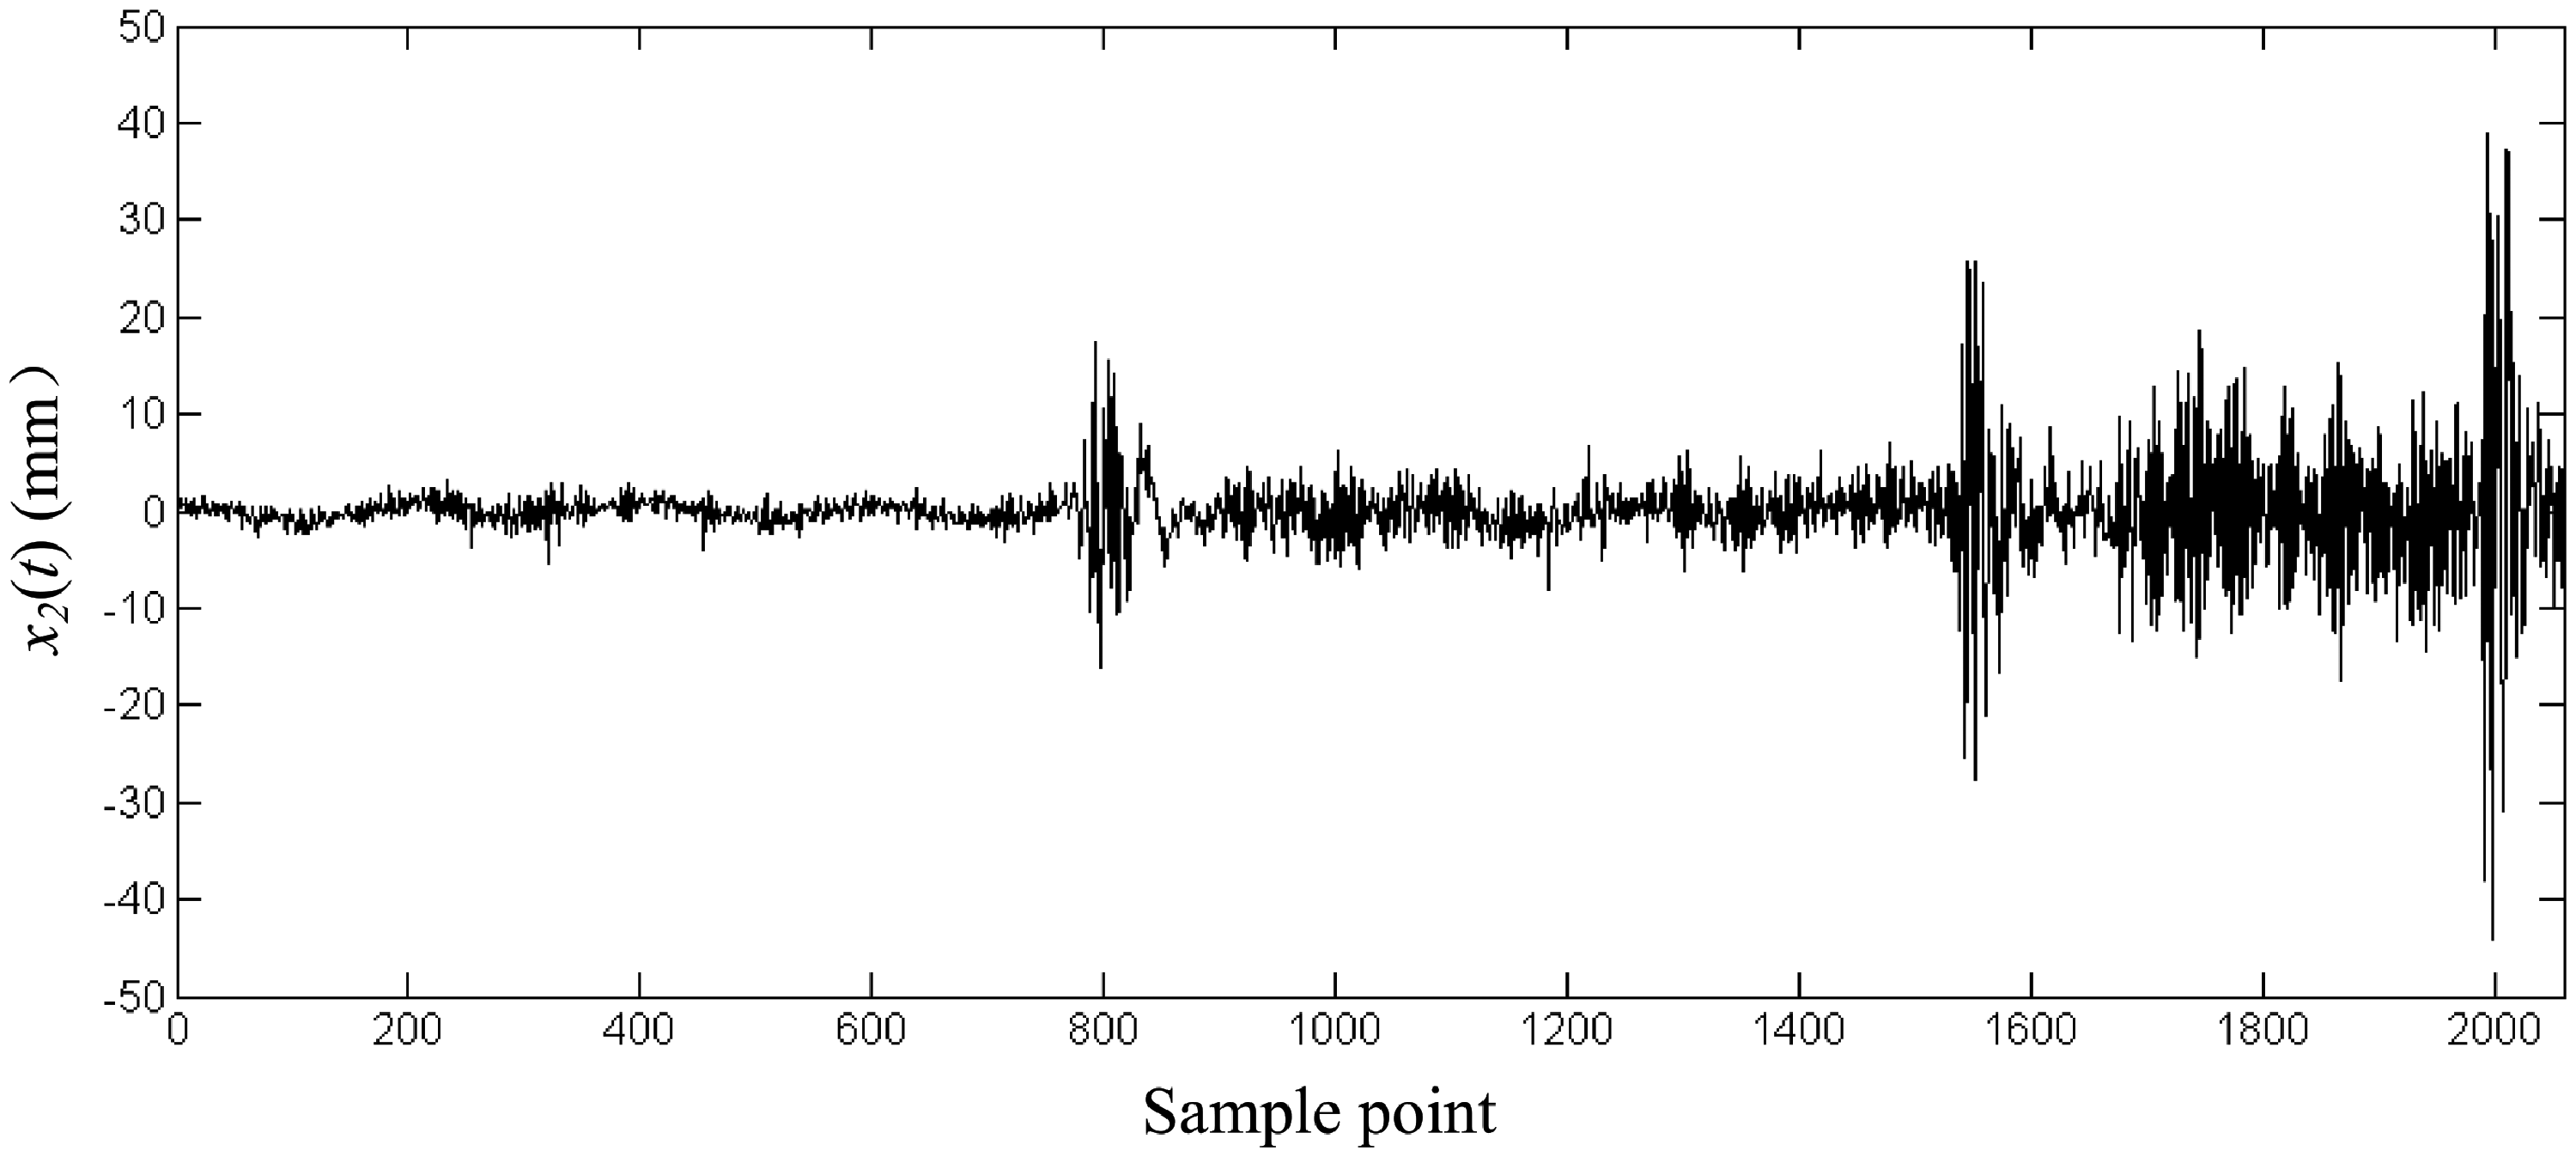
Finally, the proposed algorithm is used to analyze the frequency-varying vibration signal Revised PSD 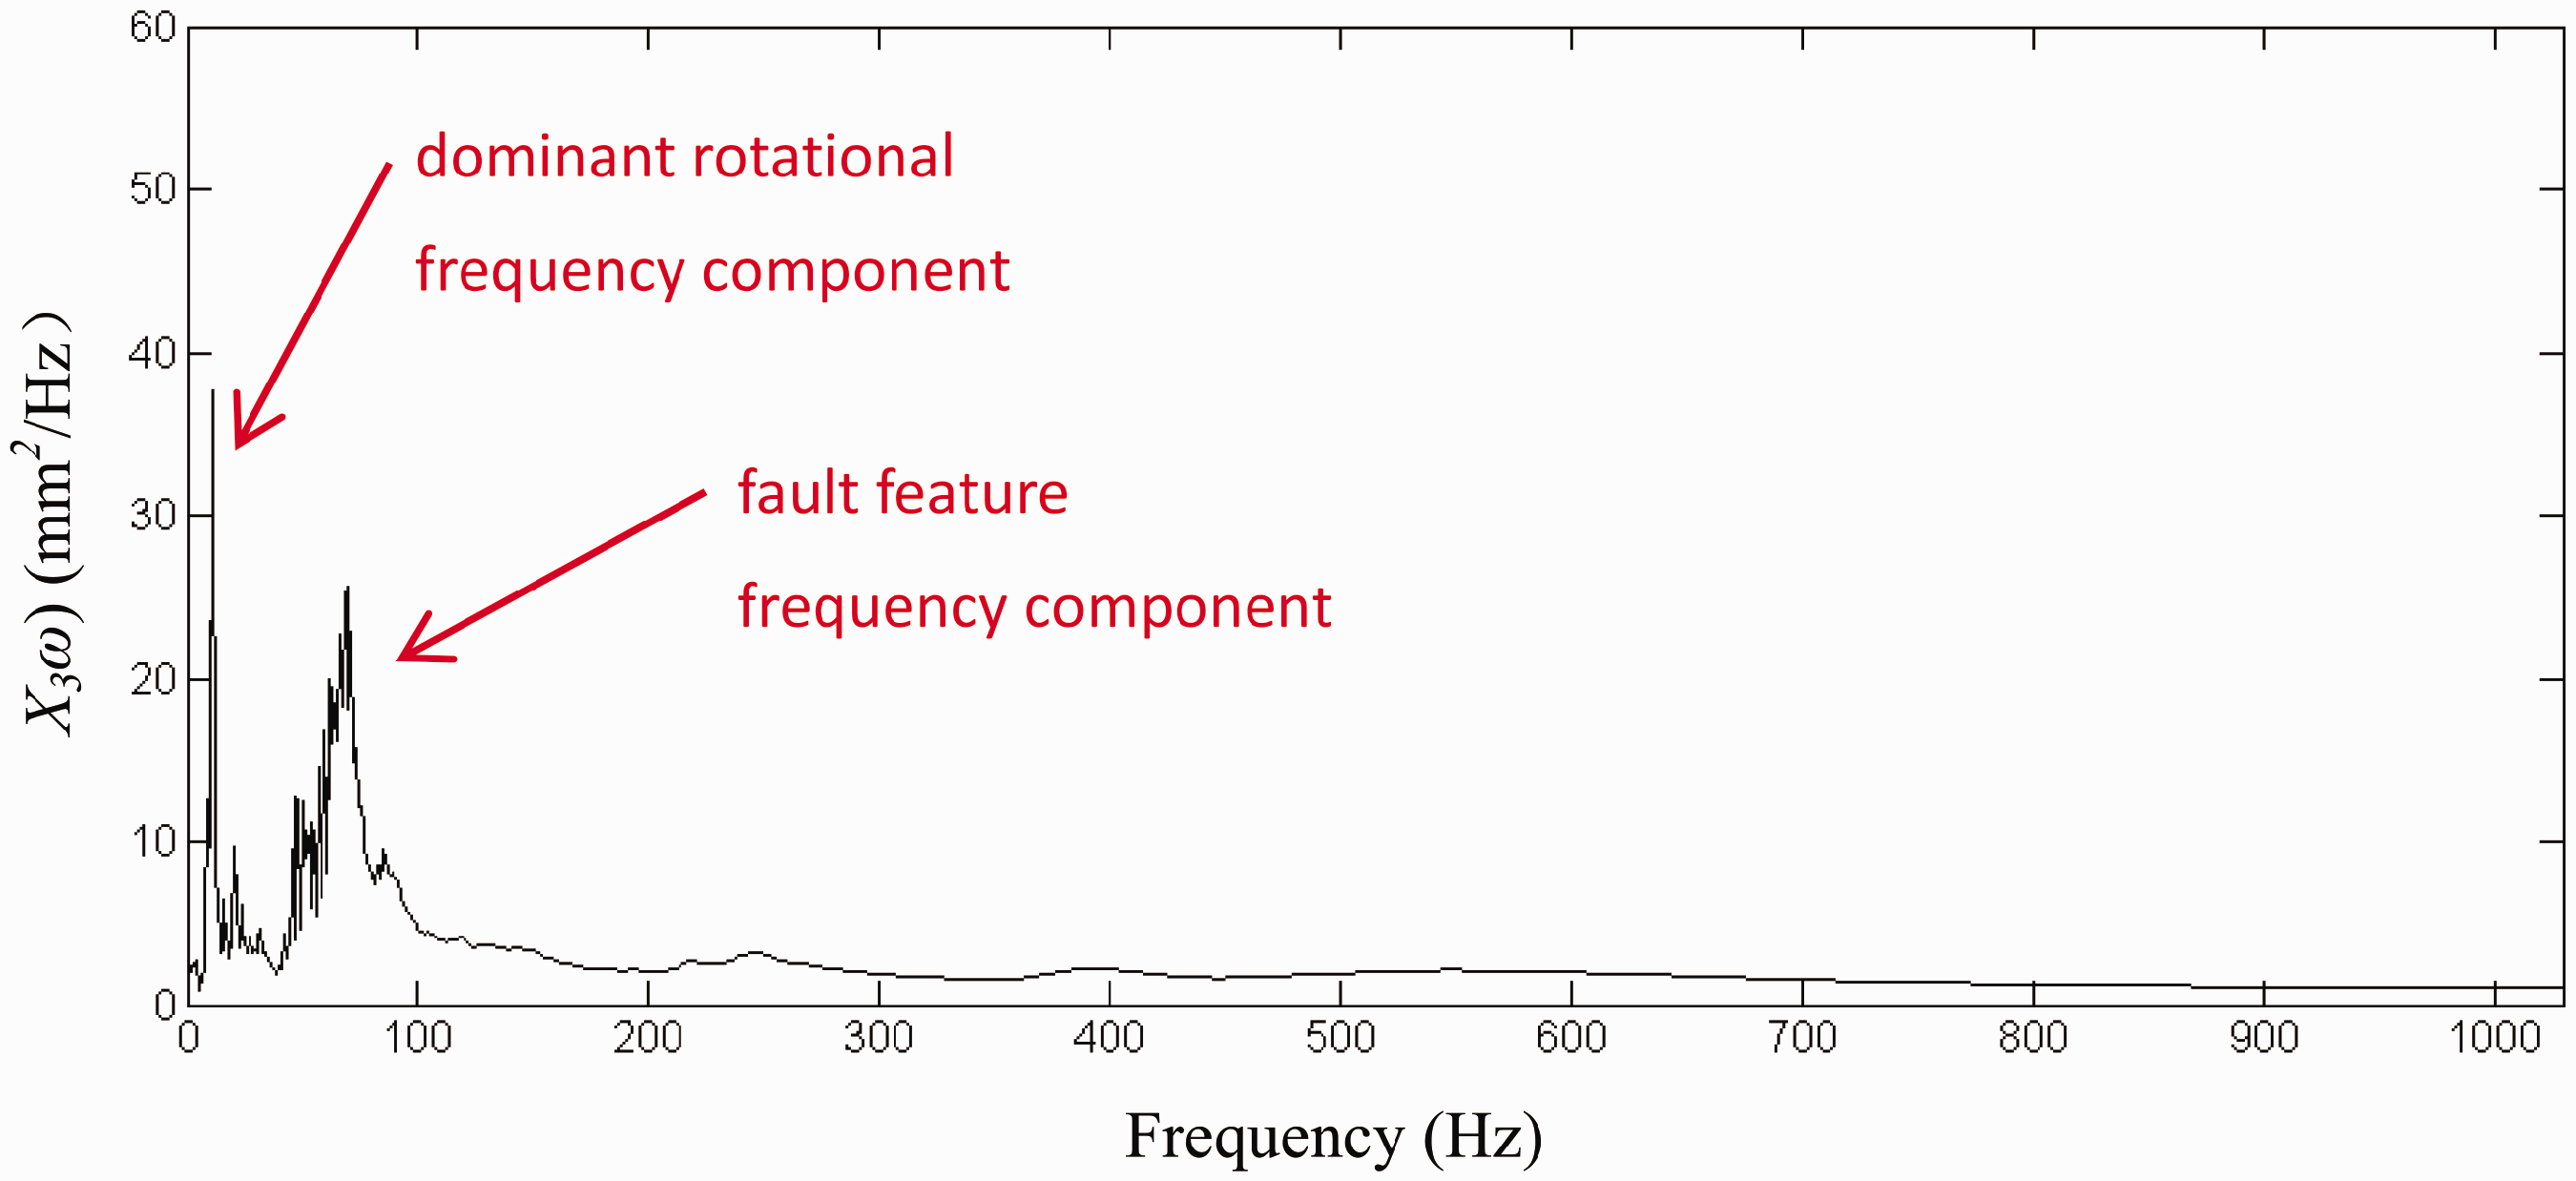
4. Conclusion
Vibration monitoring and real-time calculation of machinery condition are beneficial to the stable operation of machinery and personal safety of operators. As far as frequency-varying machinery is concerned, the conventional signal analysis methods experience problems. At a constant rotational speed, the PSD can reflect the true defect characteristic of machinery. When the rotational speed is varying, the nonstationary signal in time domain generates adequate frequency components in frequency domain.
This paper presents a nonuniform sampling model and derives a revised PSD algorithm. The relationship between the PSD of vibration signal of frequency-varying machinery and frequencies at different rotational speed is derived. The proposed revised PSD expression is essentially a type of adaptive filter algorithm, which can adaptively eliminate the influence of the varying rotational speed in revised PSD. Simulations illustrate the applicability of our approach.
Vibration monitoring experiments of varying frequencies are conducted using a JD-1 wheel/rail simulation facility. The condition monitoring performance of the proposed method is successfully tested. The experimental data analysis results illustrate the effectiveness of the proposed method. The proposed method can simply and quickly determine if a fault exists, and accurately reflect the true defect characteristic.
Footnotes
Declaration of Conflicting Interests
The author(s) declared no potential conflicts of interest with respect to the research, authorship, and/or publication of this article.
Funding
The author(s) disclosed receipt of the following financial support for the research, authorship, and/or publication of this article: This work was supported by the National Natural Science Foundation of China (Grant numbers 51205323, 51275426, and 51475393) and the State Scholarship Fund of China.