
Abstract
It remains a major issue to assess health condition and degree of vibration damage of flood discharge structure by working features in recent years. In the process of acquisition and transmission, because vibration signals are susceptible to interference from high-frequency white noise and low-frequency water flow noise, they are usually shown in the form of nonstationary random signals with low signal to noise ratio. Modal information is hard to be precisely recognized as the character of structural vibration is drowned into the strong noise. In order to remove the noise and preserve structural characteristic information, a new characteristic information extraction method based on complete ensemble empirical mode decomposition with adaptive noise (CEEMDAN) entropy (CEEMDAN-PE) is proposed. Firstly, the vibration signal is decomposed into a series of intrinsic mode functions (IMFs) by CEEMDAN, and then low-frequency water flow noise can be filtered out through spectrum analysis of each IMF component. Secondly, the noise degree of each IMF is determined by permutation entropy and high-frequency noise in IMFs is filtered out by singular value decomposition. Finally, the noise elimination IMFs are reconstructed to obtain the operating characteristic information of flood discharge structure. The effectiveness of the proposed method on characteristic information extraction is validated by a simulation experiment. Furthermore, the proposed method was applied to the 5th overflow section of Three Gorges Dam and the analysis results show that the CEEMDAN-PE method can effectively remove the noise and extract dominant frequencies of flood discharge structure, which provides foundation for health monitoring and damage identification of flood discharge structure with a strong engineering practicability.
Keywords
1. Introduction
Recently, the construction of hydraulic structure with high-head, large discharge and high flow velocity has developed rapidly. Due to the lightweight trend of structural materials and the complexity of the interaction between high velocity flow and flood discharge structure, strong turbulent flow can easily cause violent vibration even destruction of structures, which greatly affects the safe operation of flood discharge structure. The safety problem of flood discharge structure stands as one of the prominent technical problems which need to be solved in the construction of water conservancy and hydropower engineering (Lian et al., 2016; Zhang et al., 2016).
The vibration signal of flood discharge structure is nonlinear and nonstationary signal with low signal to noise ratio (SNR). Operating characteristic information is often submerged by high-frequency white noise and low-frequency water flow noise, which affects the evaluation precision of structural health condition. Therefore, it is necessary to take an effective information extraction method to remove the noise and then obtain dominant characteristic information.
Fourier transform (Djurovic et al., 2014), widely used in vibration signal analysis, can-not only clearly reflect spectrum characteristics of vibration signal, but also present the accurate resolution ability. It is a valid tool to analyze stationary signals; however, it is unable to calibrate and measure the local distortions of signals, as well as time domain information. Therefore, it has great limitations in dealing with nonstationary signals. Digital filter (Hu, 1997) as an improved de-noising method based on Fourier transform conducts a mathematical operation to difference equation for discrete data of signal to realize noise reduction, which requires the pre-definition of some technical indicators (such as the passband cut-off frequency, stopband cut-off frequency, passband fluctuation coefficient, stopband fluctuation coefficient and filter order number, etc.). This method still has great limitations in dealing with nonstationary and nonlinear signals. As an improved version of digital filter, wavelet transform (Chen et al., 2006) can achieve the local transformation of time and frequency. However, there is no defined criterion which can be used for the selection of wavelet basis functions.
With the rapid development of arithmetic speed, great progress has been made in signal analysis technology in recent years. Empirical mode decomposition (EMD) is an adaptive signal analysis method proposed by Huang (Huang et al., 1998, 1999), which is suitable for dealing with nonlinear and nonstationary signals. This method has a high time–frequency resolution and has been widely used in signal de-noising, characteristic information extraction, mechanical fault diagnosis, and other fields. Besides, EMD does not require the pre-definition of basis functions, and it overcomes the shortcomings of other signal processing methods, such as wavelet transform which relies on subjective experience. However, EMD will cause endpoint effect and mode mixing (Bolaers et al., 2011; Gai, 2006; Huang et al., 1998) in the process of decomposition due to the defect of its own calculation theory.
In spite of disadvantages, EMD has greatly promoted the development of adaptive signal analysis methods, such as ensemble empirical mode decomposition (EEMD), empirical wavelet transform (EWT) and variational mode decomposition (VMD). EEMD (Wu and Huang, 2009) adds the white noise series to the original signal to eliminate mode mixing, which is an improvement to EMD. Wu et al. (2012) proposed a looseness identification approach for rotating machinery based on post-processing of ensemble empirical mode decomposition and autoregressive modeling. Zhang et al. (2016) combined EEMD and wavelet-threshold to realize the modal parameter identification of hydraulic structure. However, EEMD requires a high computational cost, and its decomposition results rely on integration times and the amplitude of added white noise (Zheng et al., 2013). If the above-mentioned parameters are selected improperly, mode mixing cannot be alleviated and the IMFs can be affected as well. As an adaptive signal analysis method, EWT (Gilles, 2013) uses an adaptive wavelet basis to process signals, presenting the characteristic of high computational efficiency. Chen et al. (2016) used EWT method to realize the generator bearing fault diagnosis of wind turbine. Merainani et al. (2017) combined EWT and Hilbert transform to detect the tooth crack damage of a gearbox. However, the binary band allocation of EWT may result in characteristic information being divided into different modes (Chen et al., 2016). VMD is a newly developed signal analysis method, which can nonrecursively separate the signal into several IMFs. This method effectively solves the mode mixing problem caused by fix band allocation. Li et al. (2017) used independence-oriented VMD to identify the wheel set bearing fault of a high-speed locomotive and obtained good results. However, the mode number of VMD is hard to be predefined due to heavy background noise, which will result in the loss of useful information. In order to overcome the problem above, complete ensemble empirical mode decomposition with adaptive noise (CEEMDAN) was proposed. The method adds the adaptive white noise at each stage of decomposition and calculates the only residual signal to obtain each modal component, achieving a negligible reconstruction error (Lei et al., 2017). Compared with other adaptive signal analysis methods, CEEMDAN can reconstruct the signal more accurately with a higher computational efficiency, without mode mixing. For the vibration signal of flood discharge structure, CEEMDAN can effectively filter out low-frequency water flow noise, but partial high-frequency white noise cannot be accurately separated because of the interference of heavy background noise.
Based on the research above, a new characteristic information extraction method based on CEEMDAN and PE is proposed in this paper. CEEMDAN separates low-frequency water flow noise and partial high-frequency white noise, laying groundwork for PE and singular value decomposition (SVD). PE and SVD further separate high-frequency white noise, which improves the accuracy of characteristic information extraction. The proposed method provides a new direction for operating characteristic information extraction of flood discharge structure under the strong noise.
2. Theoretical aspects
2.1. CEEMDAN algorithm
The core of EMD is to self-adaptively decompose the complex original signal into a series of IMFs with different instantaneous frequencies according to its local time scale characteristic, whose essence is to smooth the signal. EMD is endowed with a good adaptability to the signal. However, EMD will cause mode mixing in the process of decomposition, which results in the loss of useful IMF components (Sweeney et al., 2013).
To overcome the drawbacks of EMD, Wu and Huang (2009) proposed EEMD. EEMD adds white noise of standard normal distribution into the original signal, through averaging the IMFs produced by the multiple EMD decomposition to obtain the final IMFs. EEMD reduces the noise by multiple test and numerical average, which leads to low computational efficiency and large computation costs (Jiang et al., 2013).
Compared with EMD and EEMD, CEEMDAN can effectively eliminate mode mixing and reduce computational cost. This algorithm adds adaptive white noise at each stage of decomposition and calculates the only residual signal to obtain each modal component to achieve a negligible reconstruction error.
The process of CEEMDAN decomposition is described as follows:
Add a white noise series Decompose Compute the first residue Decompose For Repeat step 4 until the residue is a monotonic function. Finally, the signal
where Ek (·) is the kth IMF decomposed with EMD.
Thus, any signal


2.2. PE
Permutation entropy is a dynamic analysis method proposed by Bandt and Pompe (2002), which is used to describe the complexity of one-dimensional time series. It can effectively detect dynamic mutation and the randomness of time series, presenting the characteristics of rapid calculating speed, strong anti-noise ability, and high sensitivity to time (Vakharia et al., 2015).
The calculation procedure of PE is described as follows:
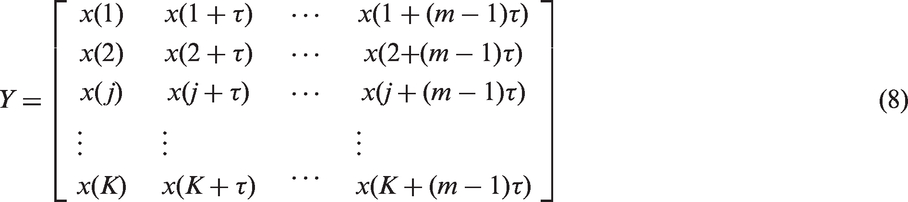
For a given time series Arrange each component in Check whether there are two equal elements in the reconstructed vectors. If Obtain a symbol series according to the value of element in each vector Construct the series PE for
where τ is the delay time. m is the embedding dimension. K is the number of reconstructed vectors,
where
When


where: the value of HP ranges from 0 to 1, which reflects the randomness and complexity of the time series. The larger the HP value is, the greater the randomness of the time series is.
According to Equation (8), the delay time τ and the embedding dimension m are two main parameters which require pre-definition while reconstructing phase space. If the selected parameters are different, the value of PE will be different. Bandt and Pompe (2002) suggested that the value of m is set from 3 to 7. If the value of m is too small, the reconstructed vector will contain few states, and PE will lose its meaning and effectiveness. Besides, the dynamic mutation of time series cannot be detected. However, if the value of m is too large, the phase space reconstruction will make the time series more uniform, which will lead to high computational cost. Therefore, subtle variation of the time series cannot be reflected (Cao et al., 2004). Mutual information and false nearest neighbor methods are used to determine the values of m and τ respectively in this paper (Rao et al., 2014).
2.3. SVD
Singular value decomposition, as a classical orthogonal decomposition de-noising method, can effectively filter out high-frequency noise in signals. The essence of SVD noise reduction is that the singular value of signals is numerically unique. The singular value of noise is set to 0, and the value of valid signal is preserved. Finally, the reconstructed signal can be obtained by the inverse operation of SVD. Since many researchers (Cong et al., 2015; Liu et al., 2015) have made a detailed study on SVD theory, its theoretical part is not reiterated here.
2.4. CEEMDAN-PE method
The vibration signal of flood discharge structure is a nonlinear and nonstationary signal, which contains high-frequency white noise and low-frequency water flow noise. CEEMDAN can effectively filter out low-frequency water flow noise, but partial high-frequency white noise cannot be accurately separated because of the interference of heavy background noise. In order to ensure the precision of extracted characteristic information, the further process of the vibration signal is necessary.
After filtering out low-frequency water flow noise with CEEMDAN, the key step of improving de-nosing precision is to remove high-frequency white noise. PE can quantitatively estimate the noise degree of each IMF, thus determining the IMFs which need to be de-noised. After CEEMDAN decomposition, make further process to IMFs by PE and calculate the PE value of each IMF. The IMFs with larger PE values are de-noised by SVD to further remove high-frequency white noise.
Based on the fact that vibration characteristic information of flood discharge structure is drowned into the heavy noise, the CEEMDAN-PE method is proposed. The essence of CEEMDAN-PE is to preserve the valid information and remove the noise, which decomposes the vibration signal into the IMFs with different amplitudes to achieve the separation of signal and noise effectively.
The realization flow of CEEMDAN-PE is presented in Figure 1.
CEEMDAN-PE method.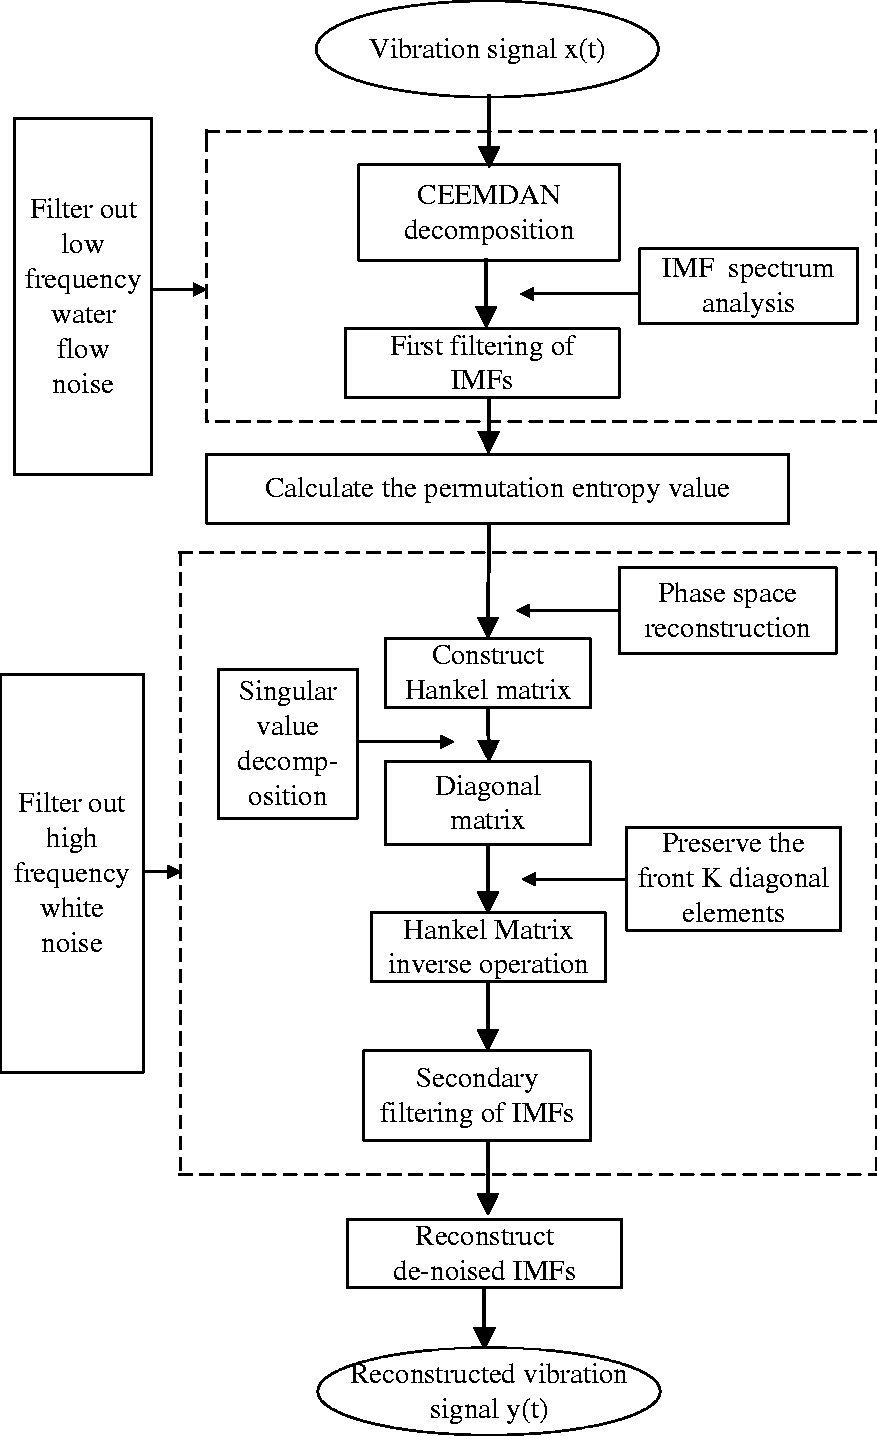
3. Simulation analysis
3.1. Simulation signal construction
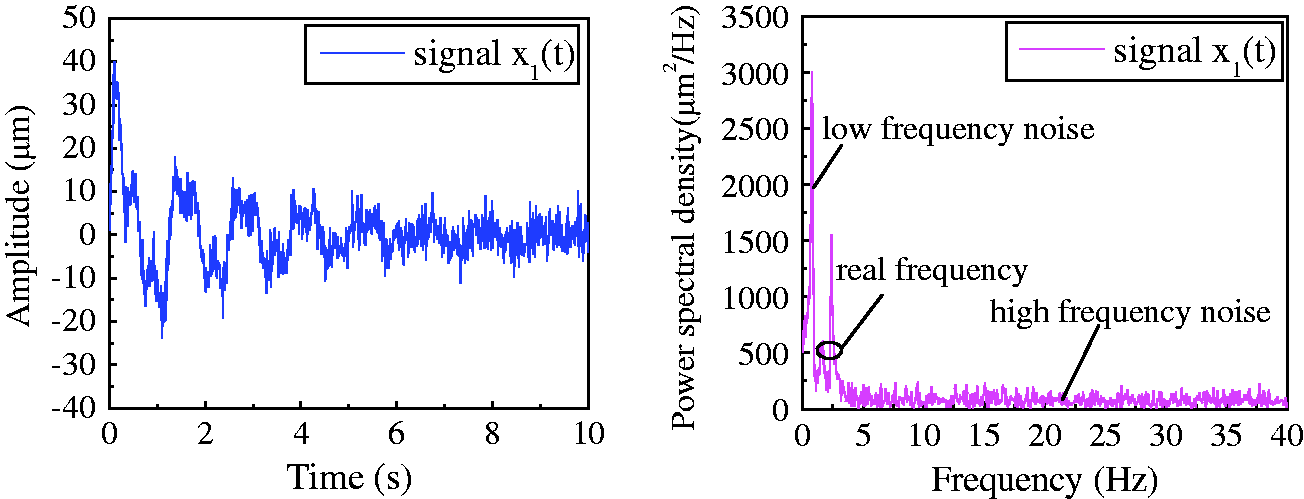
In order to access the noise reduction performance of CEEMDAN-PE, construct simulation signal

The noise signal Time history curve and power spectral density plot of signal x(t). Time history curve and power spectral density plot of signal x(t).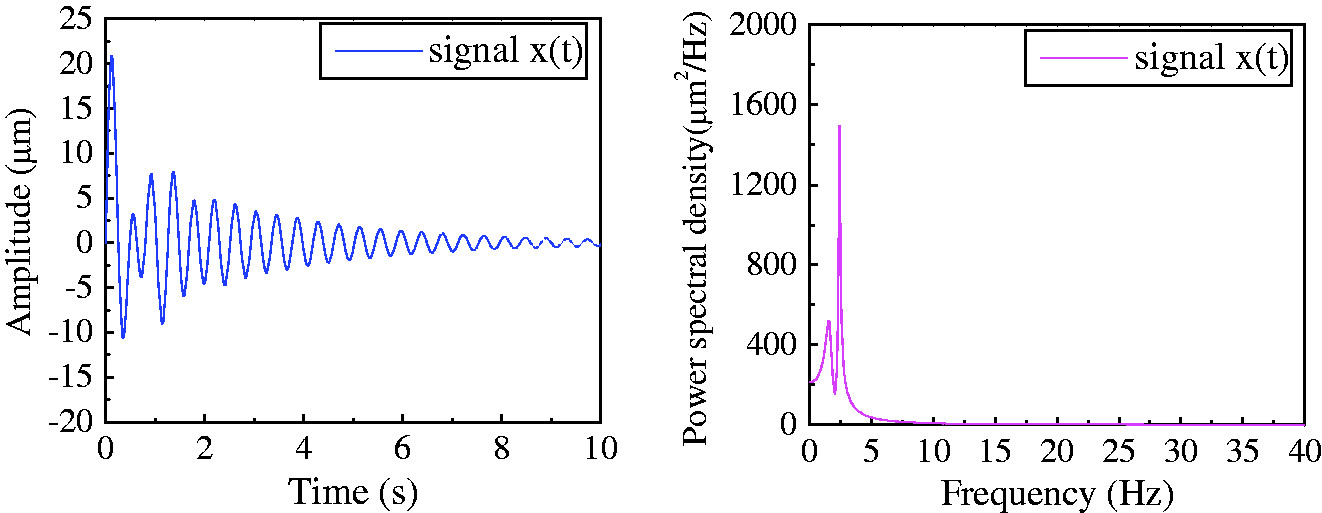

3.2. Comparison between different de-noising methods


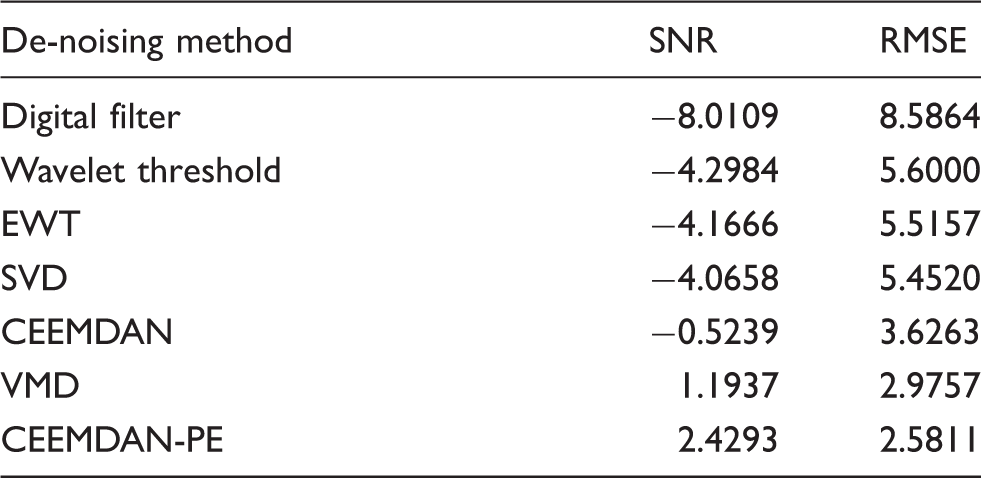
Signal to noise ratio (SNR) and root mean square error (RMSE) results comparison of seven de-noising methods.
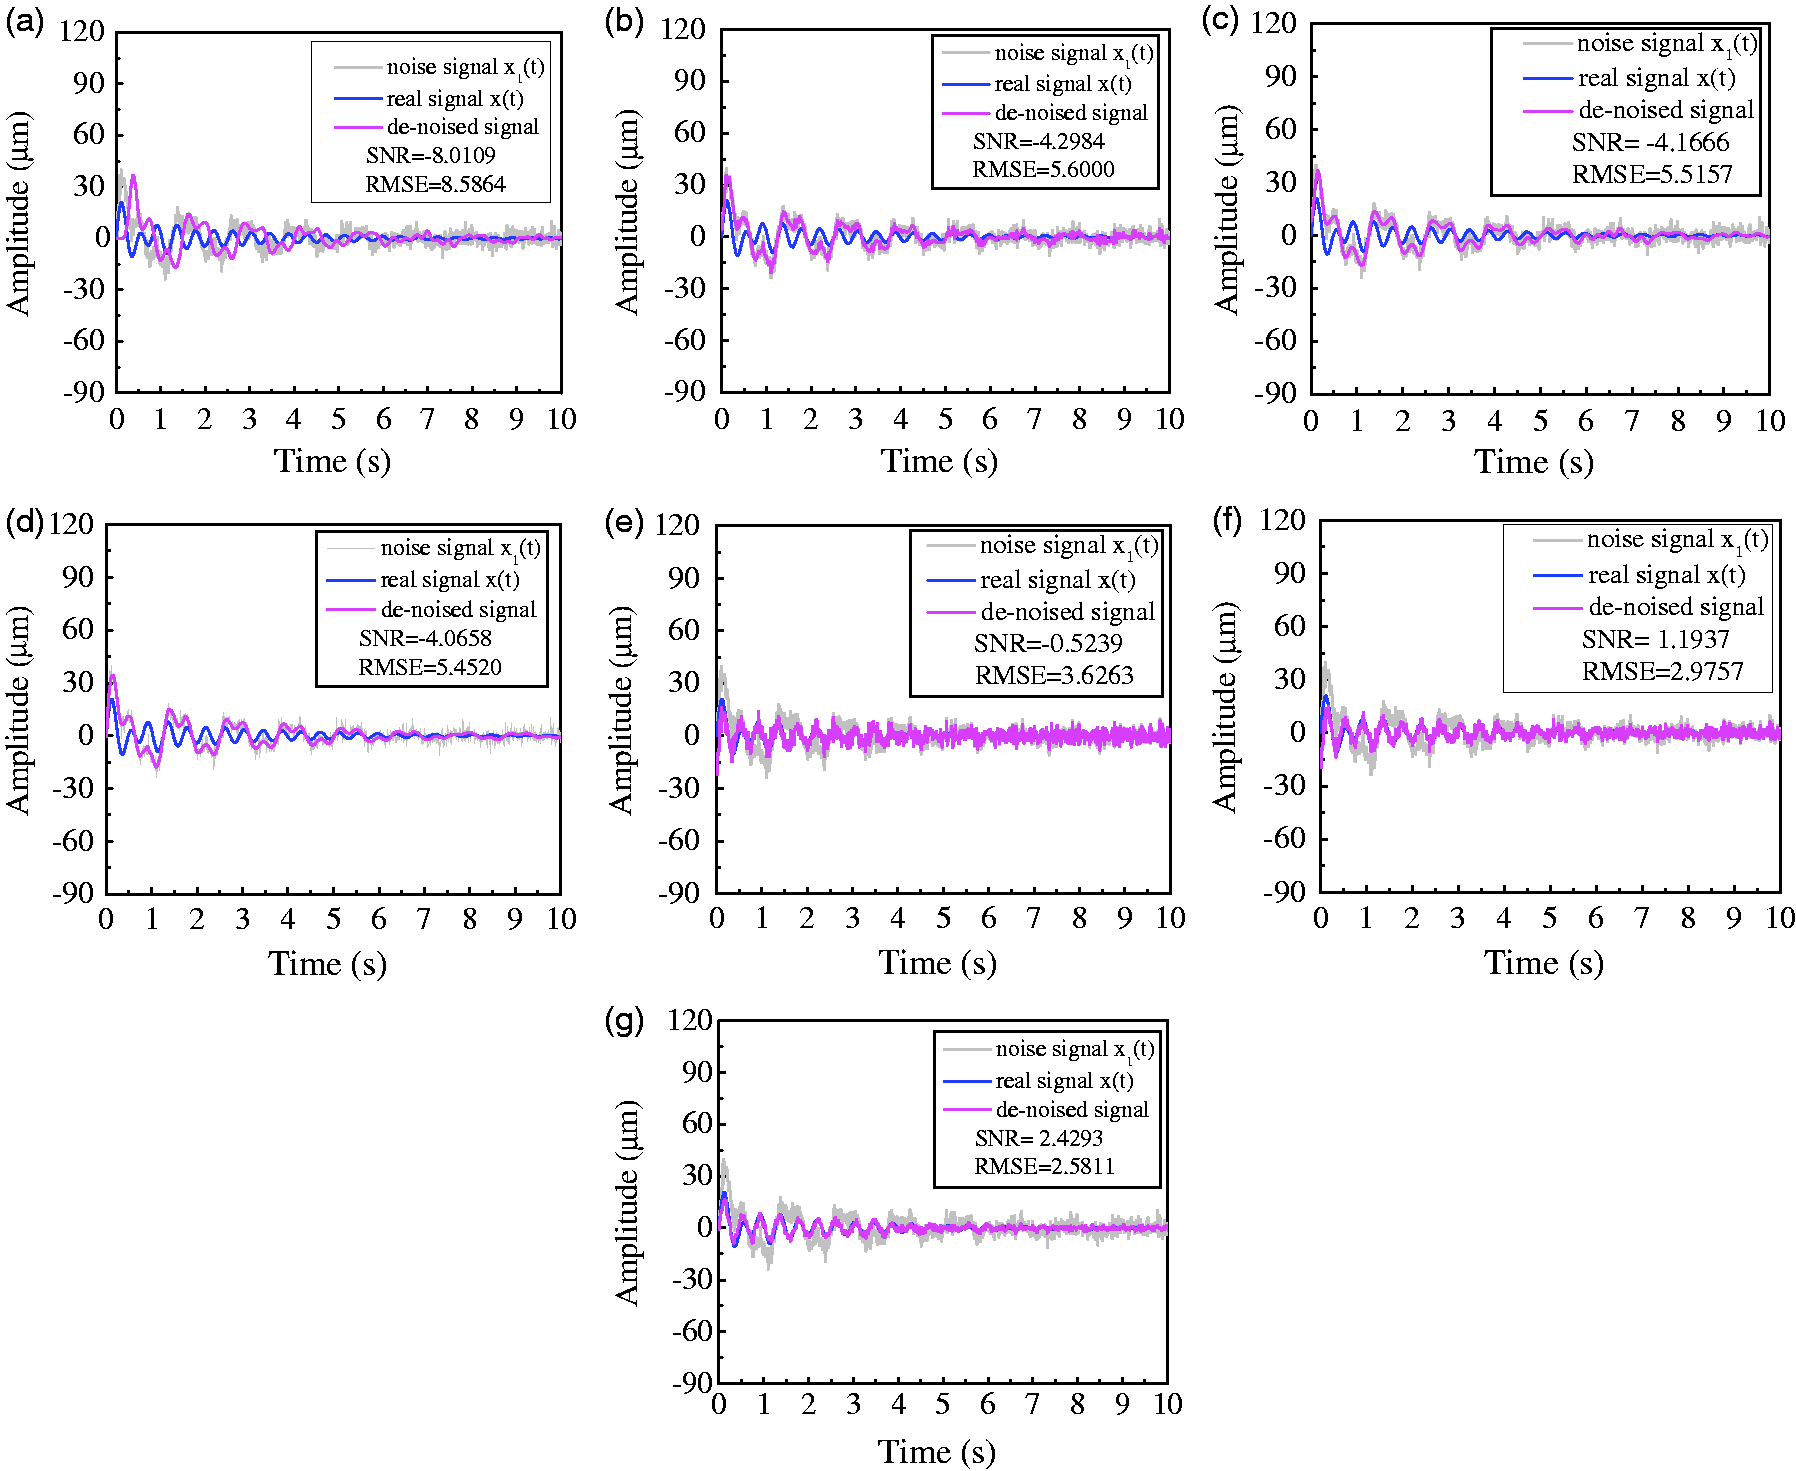
Performance comparison of seven de-noising methods for signal x(t). (a) Result of Digital filter, (b) Result of Wavelet threshold, (c) Result of EWT (d) Result of SVD, (e) Result of CEEMDAN, (f) Result of VMD and (g) Result of CEEMDAN-PE.
3.3. Results analysis
A larger SNR and a smaller RMSE indicate a better de-noising effect. As can be seen from Table 1 and Figure 4, the CEEMDAN-PE method has a better de-noising effect with a larger SNR and a smaller RMSE, which outperforms the other six de-noising methods. For low SNR signal, digital filter, wavelet threshold, EWT, SVD and CEEMDAN only filter out noises partially and many details may be destroyed. VMD shows a good de-noising effect, but partial high-frequency white noise cannot be accurately separated. However, the CEEMDAN-PE method cannot only filter out high-frequency and low-frequency noise, but also effectively preserve dominant frequencies of original signal. Therefore, CEEMDAN-PE is a superior de-noising method with good practicability.
4. Engineering application
4.1. Engineering situation
The overflow section of the Three Gorge dam adopts trajectory energy dissipation, which will result in the vibration of structures with the effect of highly turbulent flow. The 5th overflow section is employed to analyze the vibration response of the Three Gorge dam under discharge condition in this study. Measured points 1# and 2# are arranged at upstream about 3.6 m away from the parapet wall. Measured points 3# and 4# are arranged at downstream about 1.8 m away from crest corridor inside. Place horizontal and vertical dynamic displacement sensors at measured points 1# and 3#. Only place horizontal dynamic displacement sensors at measured points 2# and 4#. Test sampling frequency is 100Hz, and sampling time is 40 seconds. The channel number of horizontal dynamic displacement sensor at measured points 1#, 2#, 3# and 4# is 1, 2, 3 and 4 respectively. The channel number of vertical dynamic displacement sensor at measured points 1# and 3# is 5 and 6. The arrangement plan of measured points is shown in Figure 5.
Measured points arrangement plan of 5th overflow section.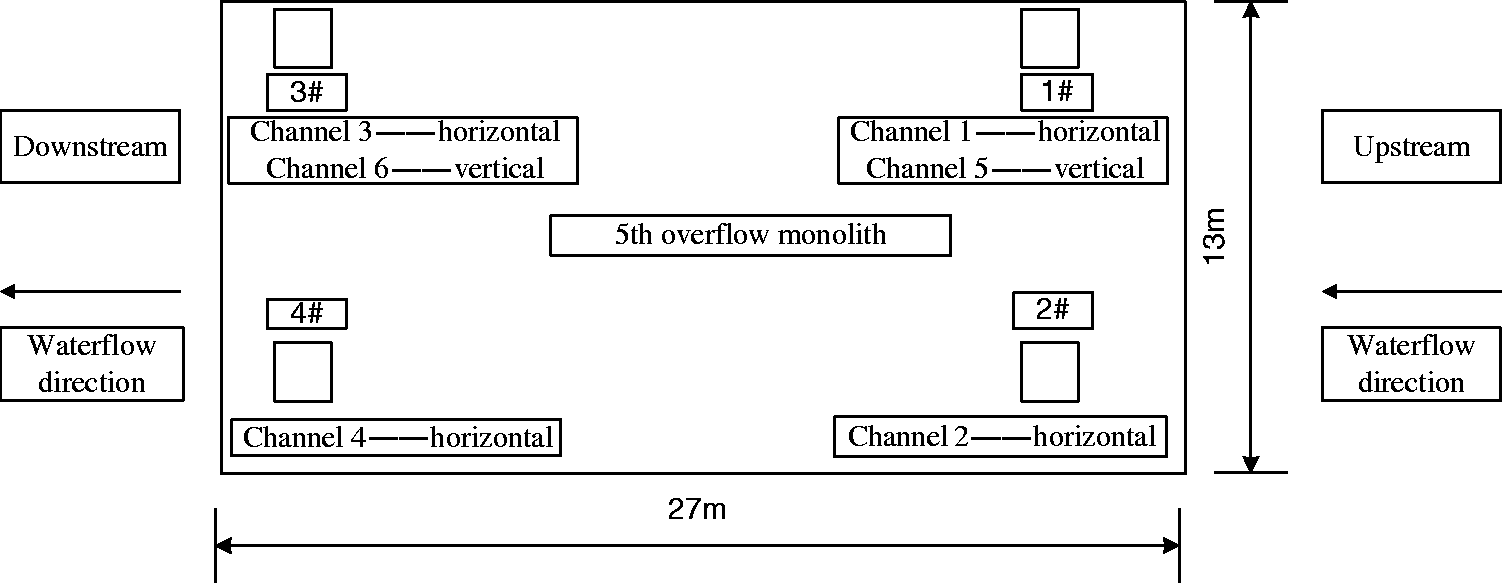
4.2. Operating characteristic information extraction
In order to verify the effectiveness of the CEEMDAN-PE method, the proposed method is used to process the vibration data of measured point 3# in the horizontal direction (channel 3) and the vertical direction (channel 6) to extract operating characteristic information. As space is limited, only the processing of horizontal data collected from channel 3 is described. The time history curve and PSD plot of the original data at channel 3 are shown in Figure 6, which reveals that the original vibration signal is affected by low-frequency water flow noise and high-frequency white noise, so the valid vibration information is submerged.
Time history curve and power spectral density plot of original signal at channel 3.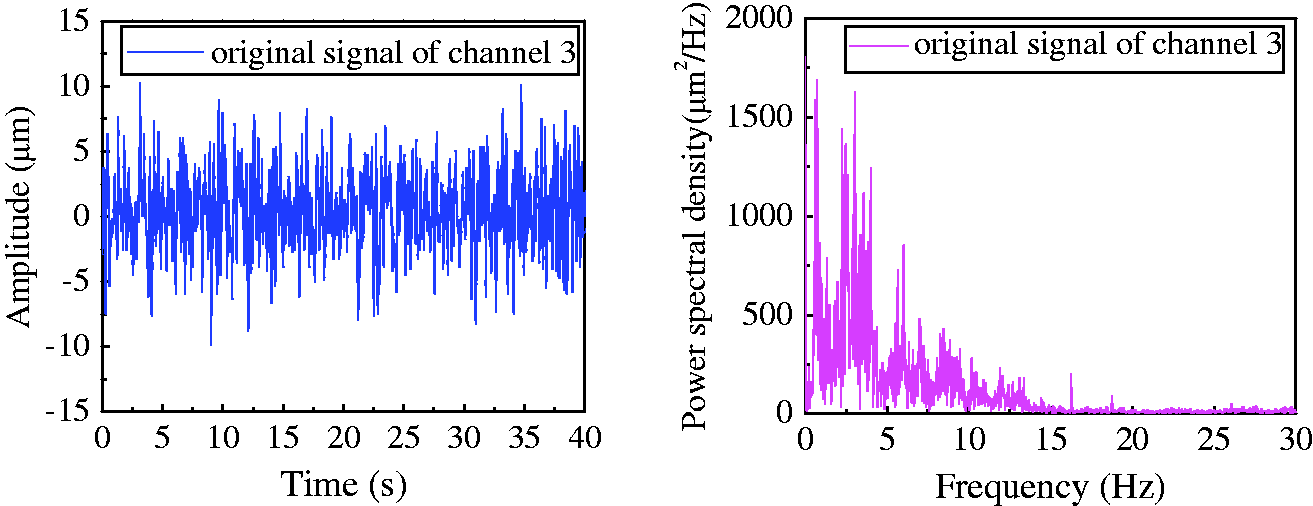
Firstly, decompose the original vibration signal of channel 3 into 10 IMF components with different amplitudes from IMF1 to IMF10 with CEEMDAN and filter out low-frequency water flow noise by spectral analysis. The dominant frequencies of IMF1–IMF4 mainly concentrate in the area between 2 Hz and 10 Hz, and the dominant frequencies of IMF5–IMF10 are below 1 Hz. The IMFs, whose dominant frequencies are smaller than 1Hz, belong to low-frequency water flow noise and should be filtered out (Lian et al., 2009; Zhang, 2008), therefore, IMF5–IMF10 should be filtered out.
Secondly, estimate the noise degree of each IMF by PE to determine the IMFs which need to be de-noised, and filter out high-frequency noise in IMFs by SVD to preserve valid information. A larger HP value indicates that more noise is contained in IMFs. Zheng et al. (2013) proposed that the IMFs, whose HP values are larger than 0.5, should be de-noised by SVD. The HP values of IMF1–IMF4 are 0.8903, 0.7234, 0.6763 and 0.4992 respectively. Therefore, IMF1, IMF2 and IMF3 need to be de-noised by SVD.
Finally, reconstruct IMF4 and de-noised IMF1, IMF2 and IMF3 to obtain the reconstructed signal. The PSD plot of the reconstructed signal at channel 3 is presented in Figure 7. It shows that the horizontal vibration frequencies of 5th overflow section are 2.3 Hz, 3.0 Hz, 3.9 Hz and 5.8 Hz.
Power spectral density plot of reconstructed signal at channel 3 by CEEMDAN-PE.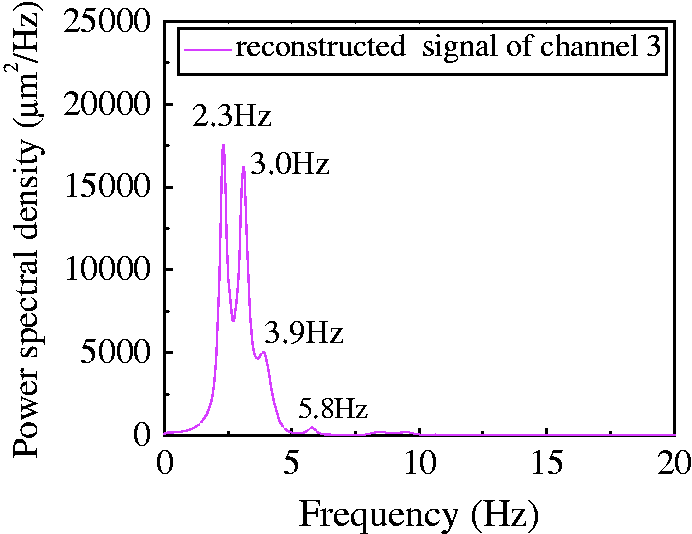
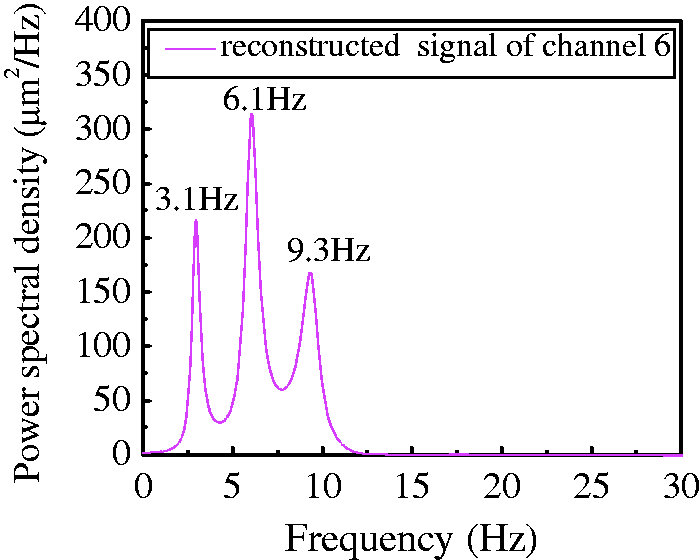
The time history curve and PSD plot of the original signal at channel 6 are shown in Figure 8, and the de-noised curve of the reconstructed signal are shown in Figure 9. Figure 9 indicates that the vertical vibration frequencies of 5th overflow section are 3.1 Hz, 6.1 Hz and 9.3 Hz. The identification results are consistent with the results identified by the modal parameters in Reference Research on inverse problems of hydraulic structure in dynamics based on flow discharge excitation, which indicates that the proposed method can effectively extract the characteristic information of flood discharge structure.
Time history curve and power spectral density plot of original signal at channel 6. Power spectral density plot of reconstructed signal at channel 6 by CEEMDAN-PE.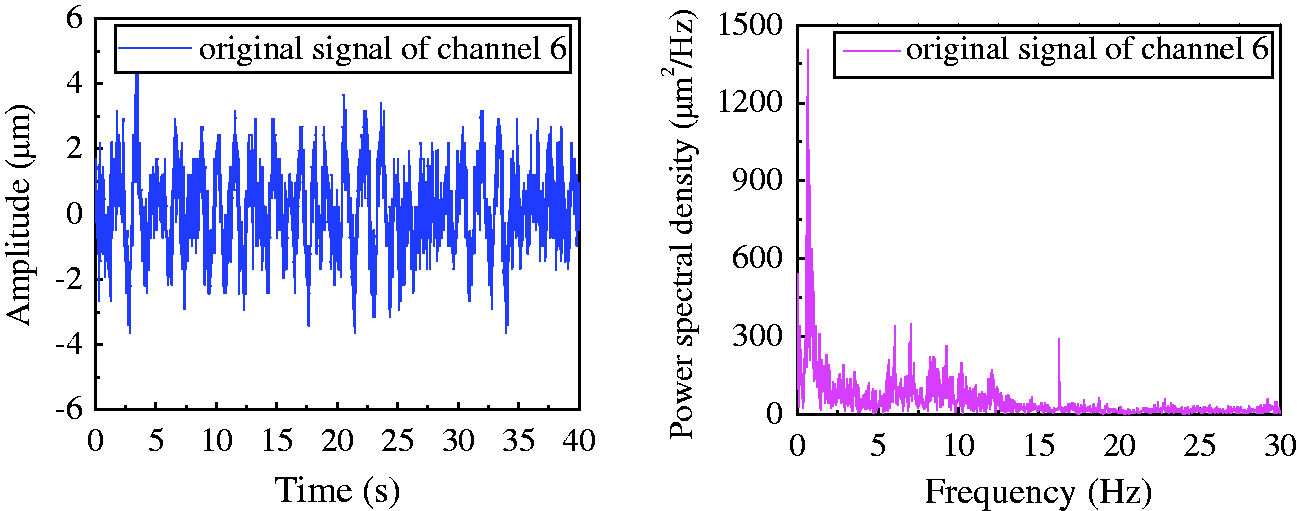
To further verify the superiority of the CEEMDAN-PE method, EWT and VMD are also used to analyze the vibration signal of measured point 3# for comparison and the corresponding results are shown in Figure 10. The comparison results of CEEMDAN-PE, EWT and VMD are shown in Table 2.
Power spectral density (PSD) plots of reconstructed signal by empirical wavelet transform (EWT) and variational mode decomposition (VMD). (a) PSD plots of reconstructed signal by EWT and (b) PSD plots of reconstructed signal by VMD. Results comparison of CEEMDAN-PE, EWT and VMD.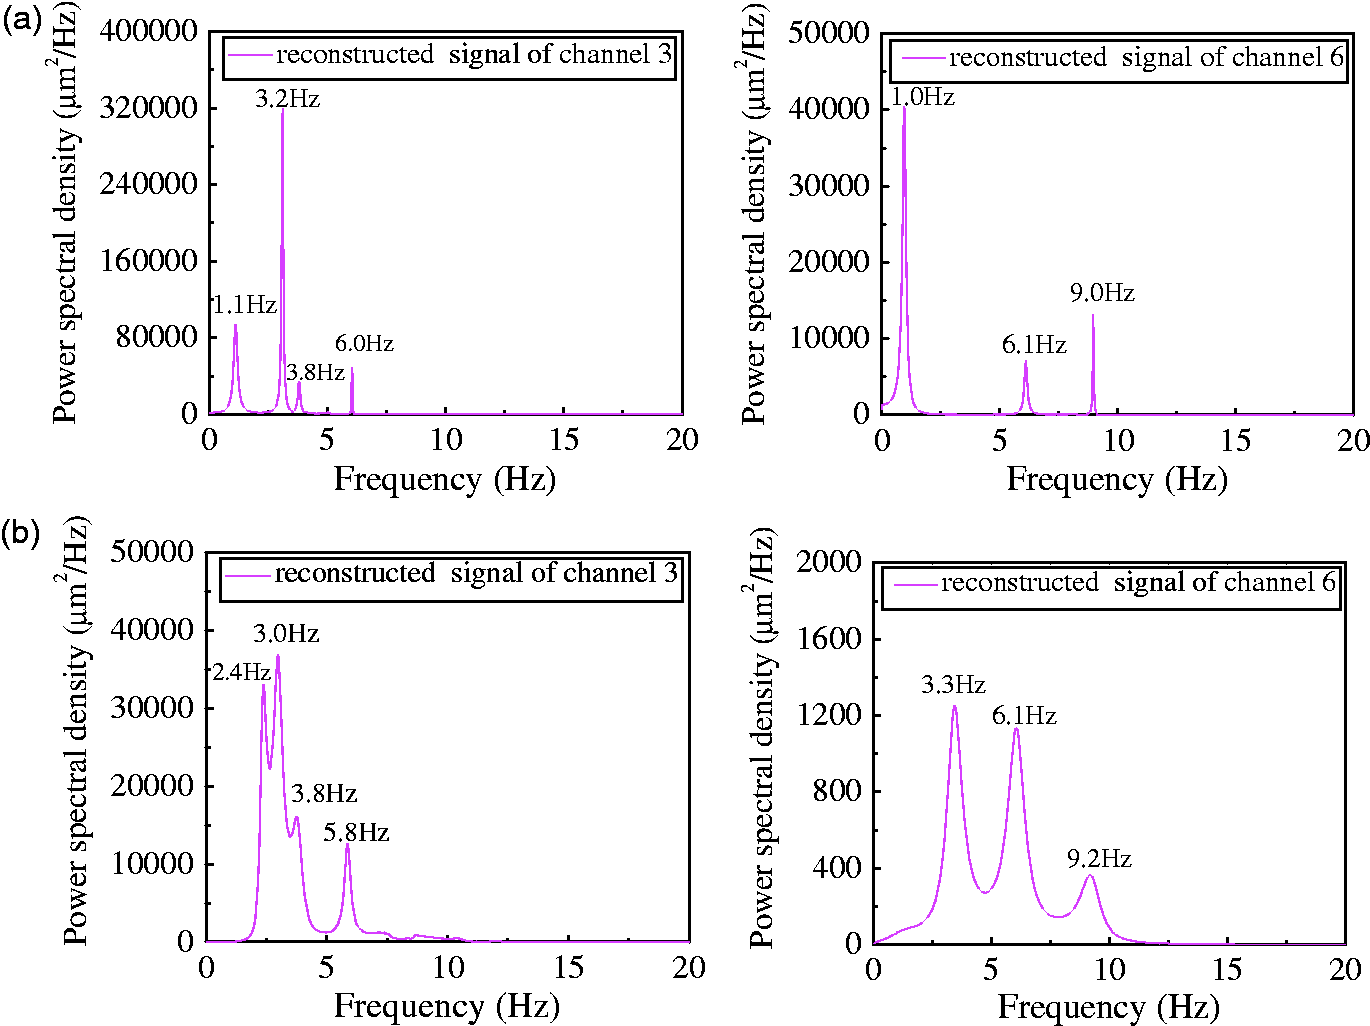
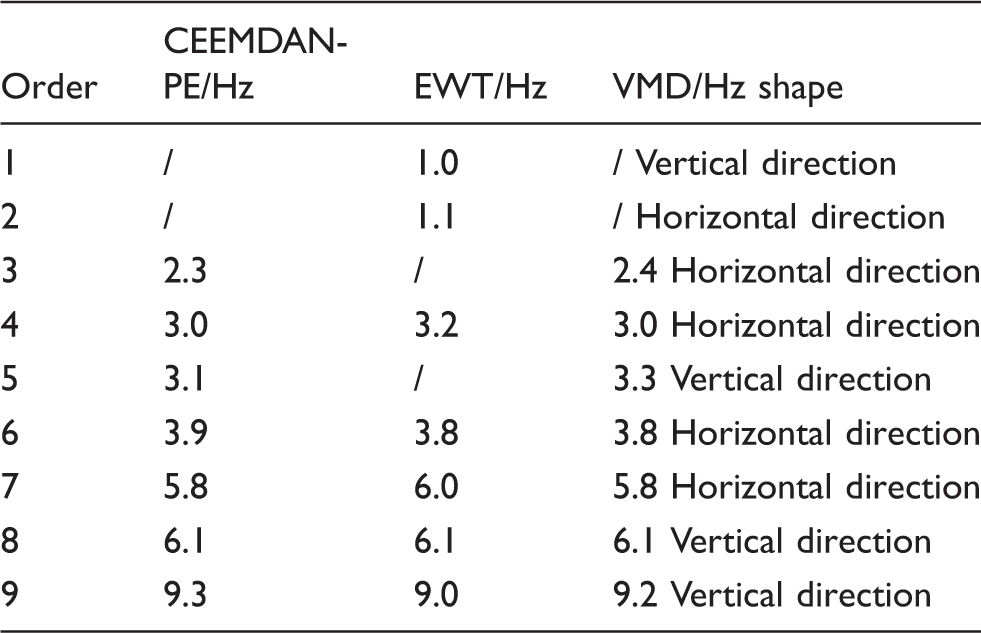
As can be seen from Figure 10 and Table 2, EWT cannot accurately extract the operating characteristic information of flood discharge structure because of the interference of heavy background noise, and several dominant frequencies are submerged. The vibration components of 1.0 Hz and 1.1 Hz belong to low-frequency water flow noise, which cannot be accurately identified by the EWT method. The dominant frequency identification results of CEEMDAN-PE are basically consistent with those of VMD, but the CEEMDAN-PE method has higher identification precision. The CEEMNAN-PE method can reflect the vibration characteristic of flood discharge structure accurately and comprehensively. Therefore, CEEMDAN-PE is a superior characteristic information extraction method, with preferable engineering practicability.
5. Conclusions
In this paper, a new characteristic information extraction method CEEMDAN-PE is proposed. The essence of CEEMDAN-PE is to preserve valid information and remove the noise, which decomposes the vibration signal into the IMFs with different amplitudes to achieve the separation of signal and noise effectively. Through simulation analysis and Three Gorges project analysis, the important conclusions are enumerated as follows:
The CEEMDAN-PE method can effectively solve the problems of traditional methods, such as mode mixing, greater reconstruction error, high computational cost, etc. to improve the identification precision of valid information. The comparison of seven de-noising methods shows that the CEEMDAN-PE method can effectively remove the noise and preserve dominant characteristic frequencies. Therefore, it is a superior de-noising method. The CEEMDAN-PE method is applied to the Three Gorges Dam and the analysis results are compared with EWT and VMD methods. This study shows that, for nonlinear and nonstationary vibration signal with low SNR, the CEEMDAN-PE method can effectively extract the operating characteristic information of flood discharge structure, with high identification precision and strong anti-noise ability. In addition, the CEEMDAN-PE method has broad prospects in application, which can provide some guidance for health monitoring and damage identification of flood discharge structure.
In the future, we will pay attention to combining the CEEMDAN-PE and advanced nonuniform embedding method, further improving the precision of characteristic information extraction.
Footnotes
Declaration of Conflicting Interests
The author(s) declared no potential conflicts of interest with respect to the research, authorship, and/or publication of this article.
Funding
The author(s) disclosed receipt of the following financial support for the research, authorship, and/or publication of this article: The authors disclosed receipt of the following financial support for the research, authorship, and/or publication of this article:This work was supported by the National Natural Science Foundation of China under Grant No.51679091, the State Key Laboratory of Hydraulic Engineering Simulation and Safety of Tianjin University under Grant NO.HESS-1312, and the Program for Science & Technology Innovation Talents in Universities of Henan Province under Grant NO. 18HASTIT012.