
Abstract
Rolling bearings are present ubiquitously in industrial fields; timely fault diagnosis is of crucial significance in avoiding serious catastrophe. The extraction of ideal fault feature is a challenging task in vibration-based bearing fault detection. In this article, a novel method called class-information–incorporated kernel entropy component analysis is proposed for bearing fault diagnosis. The method is developed based on the Hebbian learning theory of neural network and the kernel entropy component analysis which attempts to compress the most Renyi quadratic entropy of input dataset after dimension reduction and presents a good performance for nonlinear feature extraction. Class-information–incorporated kernel entropy component analysis can take advantage of the label information of training samples to guide dimensional reduction and still follow the same simple mathematical formulation as kernel entropy component analysis. The high-dimensional feature dataset including time-domain, frequency-domain, and time–frequency domain characteristic parameters is first derived from the vibration signals. Then, the intrinsic geometric features are extracted by class-information–incorporated kernel entropy component analysis, and a classification strategy based on fusion information is applied to recognize different operating conditions of bearings. The experimental results demonstrated the feasibility and effectiveness of the proposed method.
Keywords
1. Introduction
Rolling element bearings are prevalent, important, and fragile parts in equipment, which account for almost 45–55% of rotating machinery failures (Rai and Upadhyay, 2016). The safety and stability of rolling bearings are the key to ensure the normal operations of machines; unexpected failures may cause massive economic losses and even lead to casualties (Ahmed et al., 2018; Cerrada et al., 2018; Rai and Upadhyay, 2016). Once the fault occurs, accurate condition monitoring technique allows beforehand the detection of faults and correct recognition of the type of faults. Vibration-based bearing condition monitoring has received extensive studies and become a well-accepted technique of many planned maintenance managements (Ahmed, 2019; Alamelu Manghai and Jegadeeshwaran, 2019). The major challenge for bearing condition monitoring lies on how to extract reliable and sensitive features from the original signals. The vibration signals of defective bearings derived from rotating machines are usually complicated, including some useful information and noises. To obtain more fault information to reflect the conditions of bearings, a high-dimensional feature set including time-domain, frequency-domain, and time–frequency domain characteristic parameters is often used for diagnosis (Gan et al., 2015; Lei et al., 2007; Shao et al., 2018). However, the features obtained by traditional feature extraction methods may not contain all the diagnostic information, and the sensitivity of diagnostic features from the vibration signals may vary with load conditions because of nonlinear effect and nonstationary noise (Chen et al., 2017). Moreover, the computation of high-dimensional feature set constructed by all extracted features is a cumbersome process (Bull et al., 2019; Chen et al., 2017; Su et al., 2019). Thus, it is essential to develop effective dimension reduction and feature extraction techniques.
Various feature extraction methods associated with dimension reduction have been developed, such as principal component analysis (PCA) (Jolliffe, 2011), linear discriminant analysis (Belhumeur et al., 1997), locally linear embedding (Roweis and Saul, 2000), local tangent space alignment (Zhang and Zha, 2004), to name a few. Among these robust algorithms, PCA based on the data correlation matrix is the most widely used method for its simplicity and effectiveness (Huang et al., 2019). It is a linear and unsupervised transformation method, which aims to ensure that the original feature set is uncorrelated and maximizes the second-order statistics of original features (Guo et al., 2019). However, the performance of linear methods may degenerate for nonlinear data that have the nonlinear manifolds (such as nonlinear curves and surfaces) in the underlying low-dimensional structure (Li and Zhang, 2011). Kernel methods are a promising approach because they can constitute a framework to formulate nonlinear versions from linear algorithms (Gómez-Chova et al., 2011). A very influential method is kernel principal component analysis (KPCA) (Schölkopf et al., 1998), which is an extension of traditional linear PCA by using kernel trick. The key of KPCA is to implicitly find the nonlinear relationship between input dataset and the kernel feature space with kernel matrix that is derived from a positive semidefinite kernel function of computing inner products (Ji and Huang, 2018). KPCA overcomes the limitation of PCA in dealing with nonlinear problems and has been widely used in fault diagnosis (Cheng et al., 2016; Liu et al., 2018). However, these methods perform feature extraction and dimension reduction by choosing top eigenvalues and corresponding eigenvectors of kernel matrix without revealing the nature of original feature sets. Therefore, the extraction may select uninformative eigenvectors from the standpoint of information theory (Zhou et al., 2017a).
Kernel entropy component analysis (KECA) is a novel information theory–based nonlinear feature extraction method associated with dimension reduction, which has been proposed and used in pattern recognition by Jenssen (2009b). Unlike the methods depending on the second-order statistics of the input dataset, KECA is developed based on information theory and can compress the most Renyi quadratic entropy of input dataset instead of depending on top eigenvalues (Gao et al., 2014; Jenssen, 2009b; Zhou et al., 2017b). KECA has been applied to face recognition, process monitoring, data clustering, and so on, which showed the unique superiority in terms of feature extraction (Jenssen, 2013; Qi et al., 2019; Yang et al., 2015; Yuan et al., 2017; Zhang et al., 2015). KECA can greatly reserve the raw data information by several main kernel entropy scores with clear physical meanings, and it is an effective tool to extract the fatigue evolution information of rolling bearing (Wang et al., 2018).
However, KECA is an unsupervised method without considering scatter information of class, which may discard represent discriminant classification information for recognition. To take full use of the tagged information and improve the performance of fault identification, this article presents a supervised method called class-information–incorporated kernel entropy component analysis (CIKECA) based on the Hebbian learning theory of neural network. In the implementation process of bearing fault diagnosis, CIKECA can take advantage of the label information of training samples to guide dimensional reduction and feature extraction of high-dimensional feature dataset. CIKECA is presented in two objectives: one is to make full use of tagged information of the given data and the other is to still follow the same simple mathematical formulation as KECA. The experimental results indicate that CIKECA has better performance in bearing fault diagnosis compared with other three manifold learning methods, especially when the vibration signals are contaminated by strong background noise.
The rest of the article is organized as follows. In Section 2, the principle of KECA is introduced, and an improved KECA method based on the Hebbian learning theory of neural network is proposed. In Section 3, the fault diagnosis method based on the CIKECA algorithm is proposed. In Section 4, experiments with the proposed method were implemented, and the experimental results show the effectiveness and advantage of CIKECA compared with the PCA, KPCA, and KECA. Finally, the conclusions are drawn in Section 5.
2. Principle of the proposed method
2.1. Brief review of KECA
Assuming p(
Using the sample mean approximation of the expectation operator
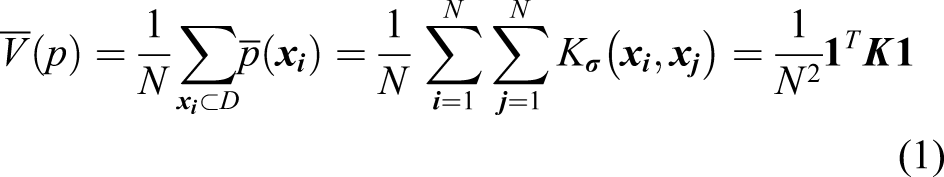
The Renyi entropy could be expressed by the eigenvalues and eigenvectors of the kernel matrix, which could be eigen-decomposed as
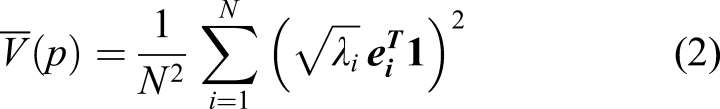
Each term in this equation will contribute to the entropy estimate. This means that some eigenvalues and corresponding eigenvectors can contribute more to the entropy estimate than others that depend on largest d eigenvalues and eigenvectors. The eigenvalues and eigenvectors in KECA are selected based on the first d largest contributions to the entropy estimate so that the cumulative contribution rate of the selected Renyi entropy reaches 95% of all the Renyi entropy.
2.2. Introduction of CIKECA
Given a set of c-class training sample patterns
The training samples
Constructed the kernel matrix
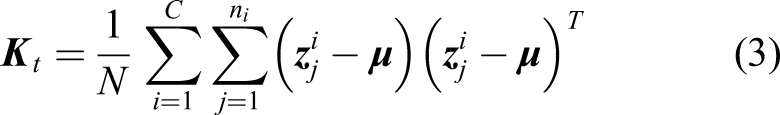
Here,
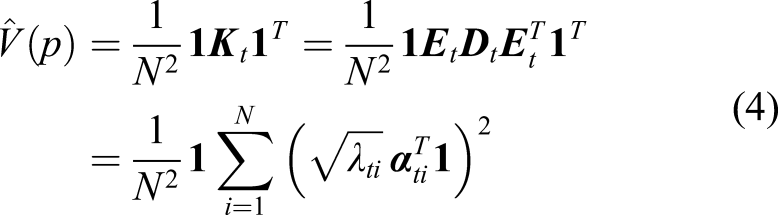
For a pattern to be classified, we cannot directly use
For the testing sample

Here,
As seen, CIKECA provides class estimation for each testing samples distinctly different from KECA where we cannot conduct the estimate.
2.3. Classification strategy based on fusion information
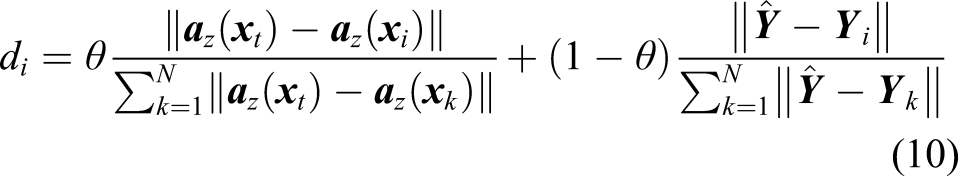
Although the estimated information


Here, θ (0 ≤ θ ≤ 1) is fused coefficient, which can determine the proportion of low-dimensional feature information and category label information in classification.
Because of the dimensional difference of the two feature information, there may be a big difference in the quantitative relationship between the two features, which would affect the final state recognition effect. To achieve better fusion effect, the numerical nonequilibrium of different feature information is eliminated as follows
According to the principle of nearest neighbor classifier, the classification rules can be defined as: if
3. Fault diagnosis based on CIKECA
CIKECA introduces the tag information of samples based on KECA algorithm mainly which is inspired by the Hebbian learning method of neural network. The information extraction process of rolling bearing fatigue evolution stage based on the improved KECA is given as follows: The high-dimensional feature set, which can represent well the operating condition of machines, should be first extracted from the raw vibration signals. The feature set is constructed by 11 time-domain statistical characteristics, 13 frequency-domain statistical characteristics, and the first six relative empirical mode decomposition (EMD) energy entropies according to reference Lei et al. (2008). CIKECA is used to extract the low-dimensional manifold features az and the estimated value of category tag information in the high-dimensional feature dataset, according to equations (5)–(7). Using the nearest neighbor classifier based on fusion information to recognize the running state of rolling bearing.
And the flowchart of the proposed method is shown in Figure 1. Fault diagnosis based on class-information–incorporated kernel entropy component analysis method.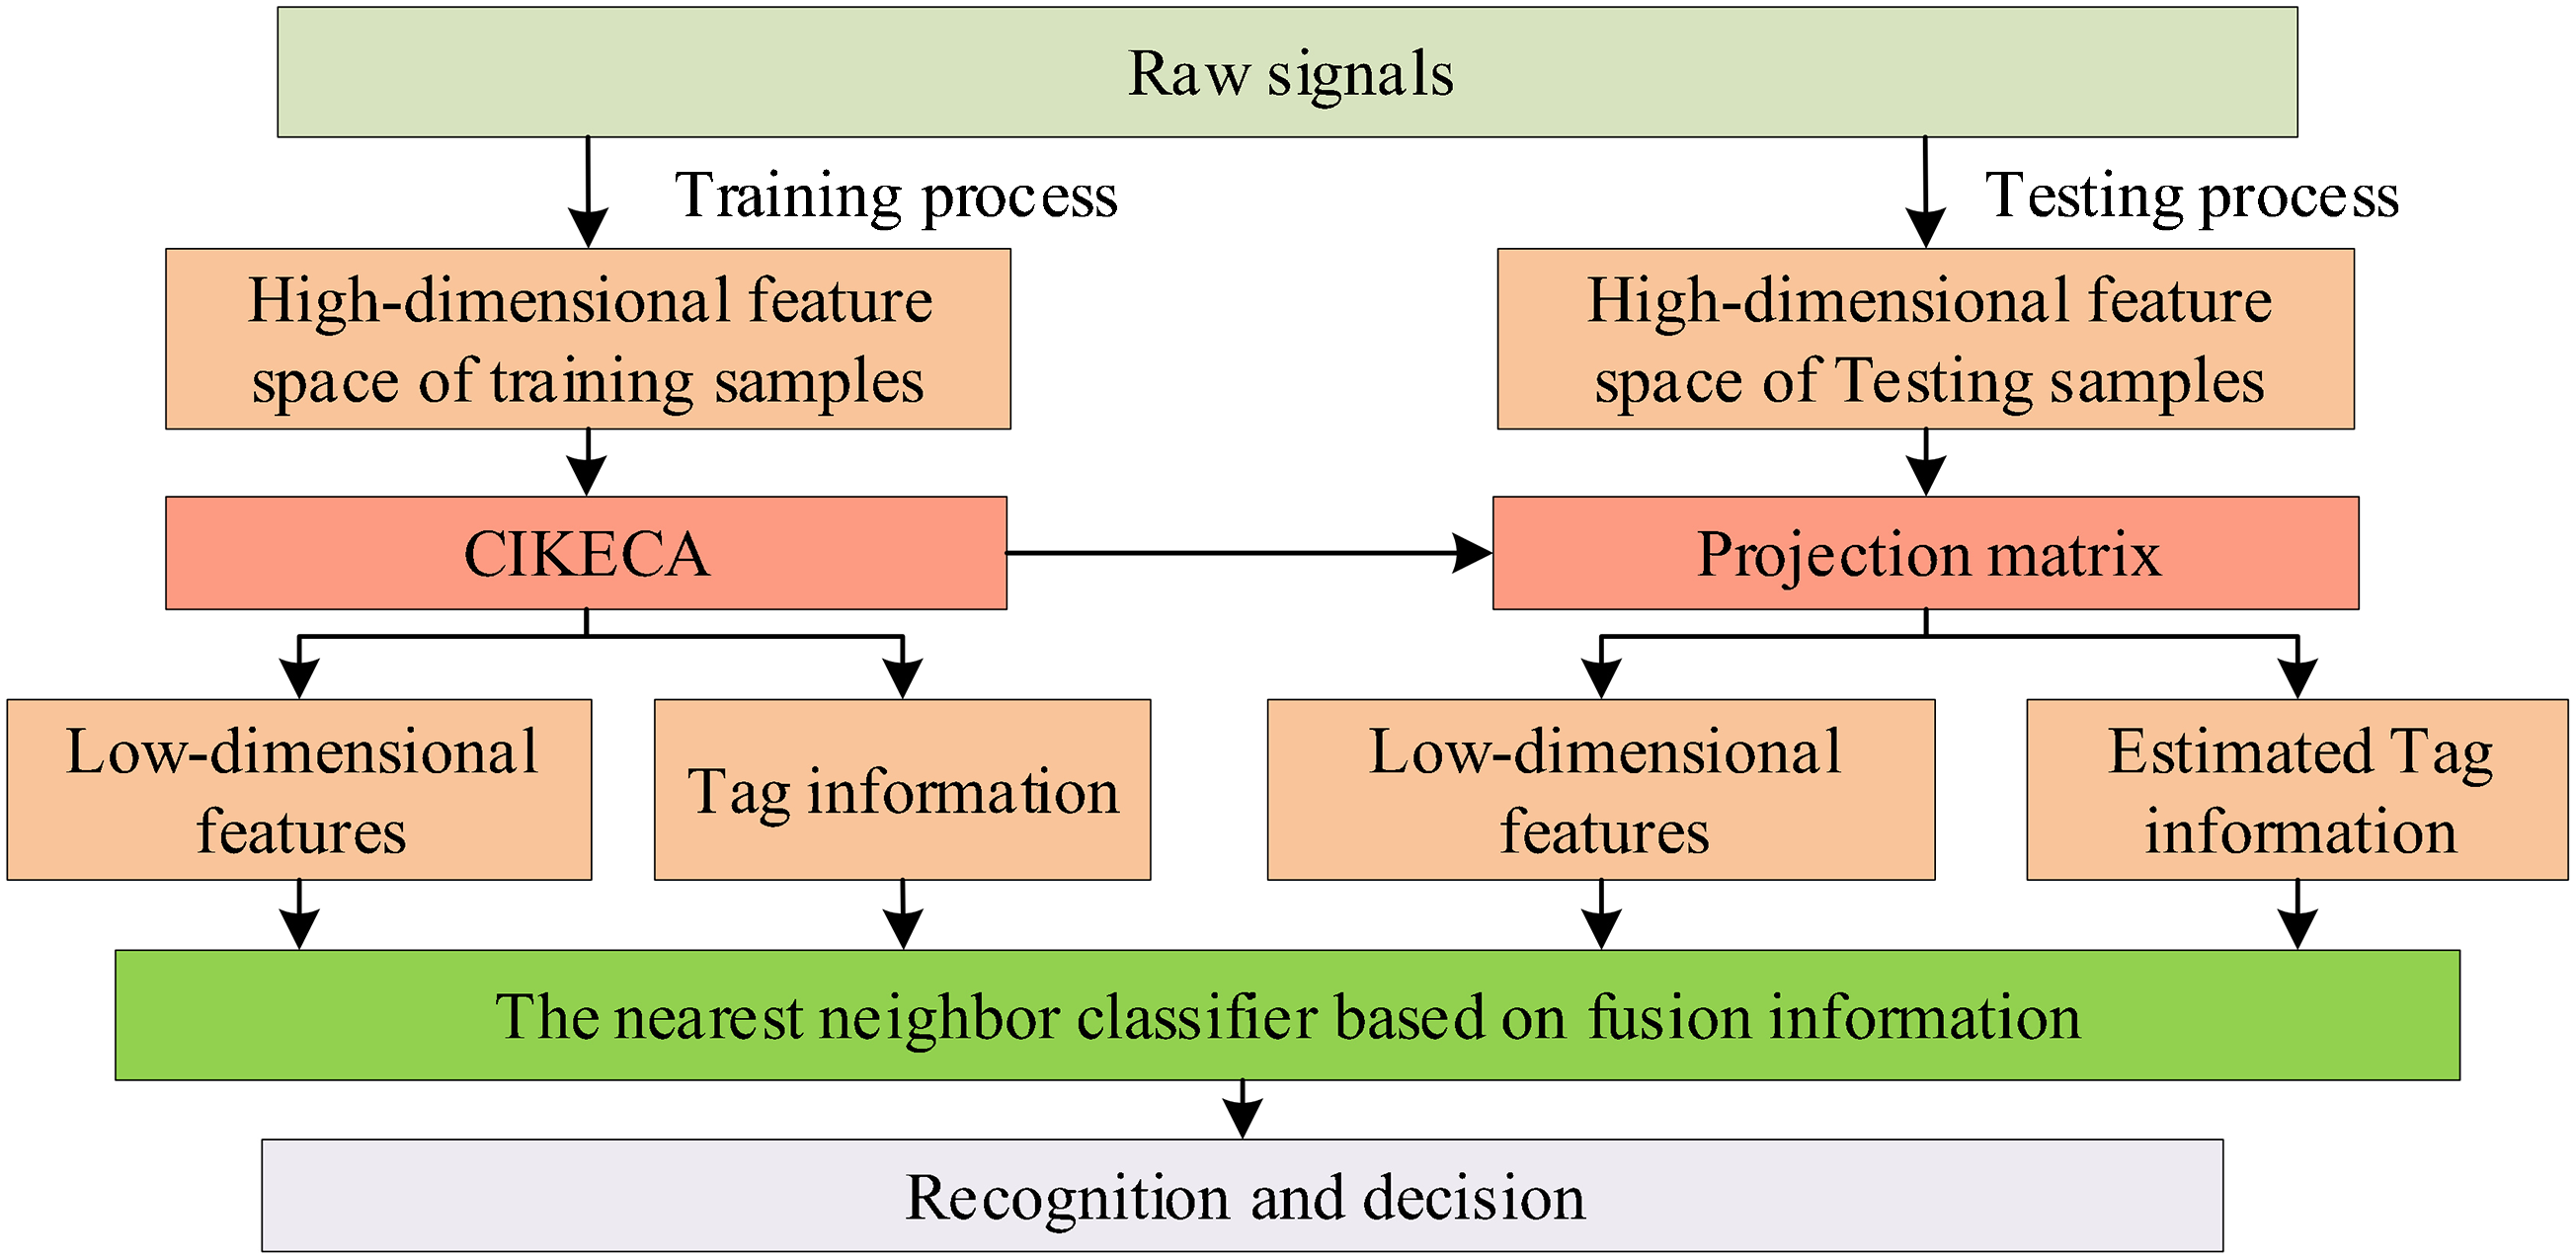
4. Experimental and results
To verify the effectiveness of CIKECA algorithm, two experimental studies on fault diagnosis of rolling bearings were carried out, and details of the setup are described as follows. Where Experiment 1 is mainly aimed at different types of rolling bearing state recognition. And Experiment 2 mainly studies the influence of different noises (i.e. the distance from the fault vibration source) on the state identification rate of rolling bearing.
4.1. Experiment 1
The vibration measuring system is mainly composed of hardware and software part, and the schematic of load devices of machinery system and the actual experimental system are shown in Figure 2(a) and (b), respectively. Deep groove ball bearings (6328-2RZ) are applied as the test bearing. The geometric parameters of the bearings are listed as follows: inner ring diameter (Di) = 28 mm, outer ring diameter (Do) = 28 mm, ball diameter (Db) = 11.509 mm, pitch diameter (Pd) = 48.5 mm, number of balls (Z) = 8, and the contact angle (α) = 0.274 rad. The inner ring rotates uniformly with the shaft driven by the driving device, whereas the outer ring maintains a static state under the central axial load. The single-point radial vibration signal at the 1/2 width of the outer ring is collected by the acceleration sensor (YD-1) and amplified by a charge amplifier (DHF-2). The charge sensitivity and frequency response of the sensor are 6–10 pC/ms−2 and 1–10 kHz ± 1 dB, respectively, and the frequency range of the amplifier is 0.3 Hz − 100 kHz. Then, the signals are converted to voltage signals by an A/D converter (PCI-9114) and sent to a computer for further processing. The sampling frequency is 25 kHz, and the rotational speed of the driving motor is 1500 r/min. Radial load of 0 kN and axial load of 1.0 kN were added to the shaft and bearings by the cylinder. Test rig. (a) Schematic of load devices of machinery system and (b) actual experimental system.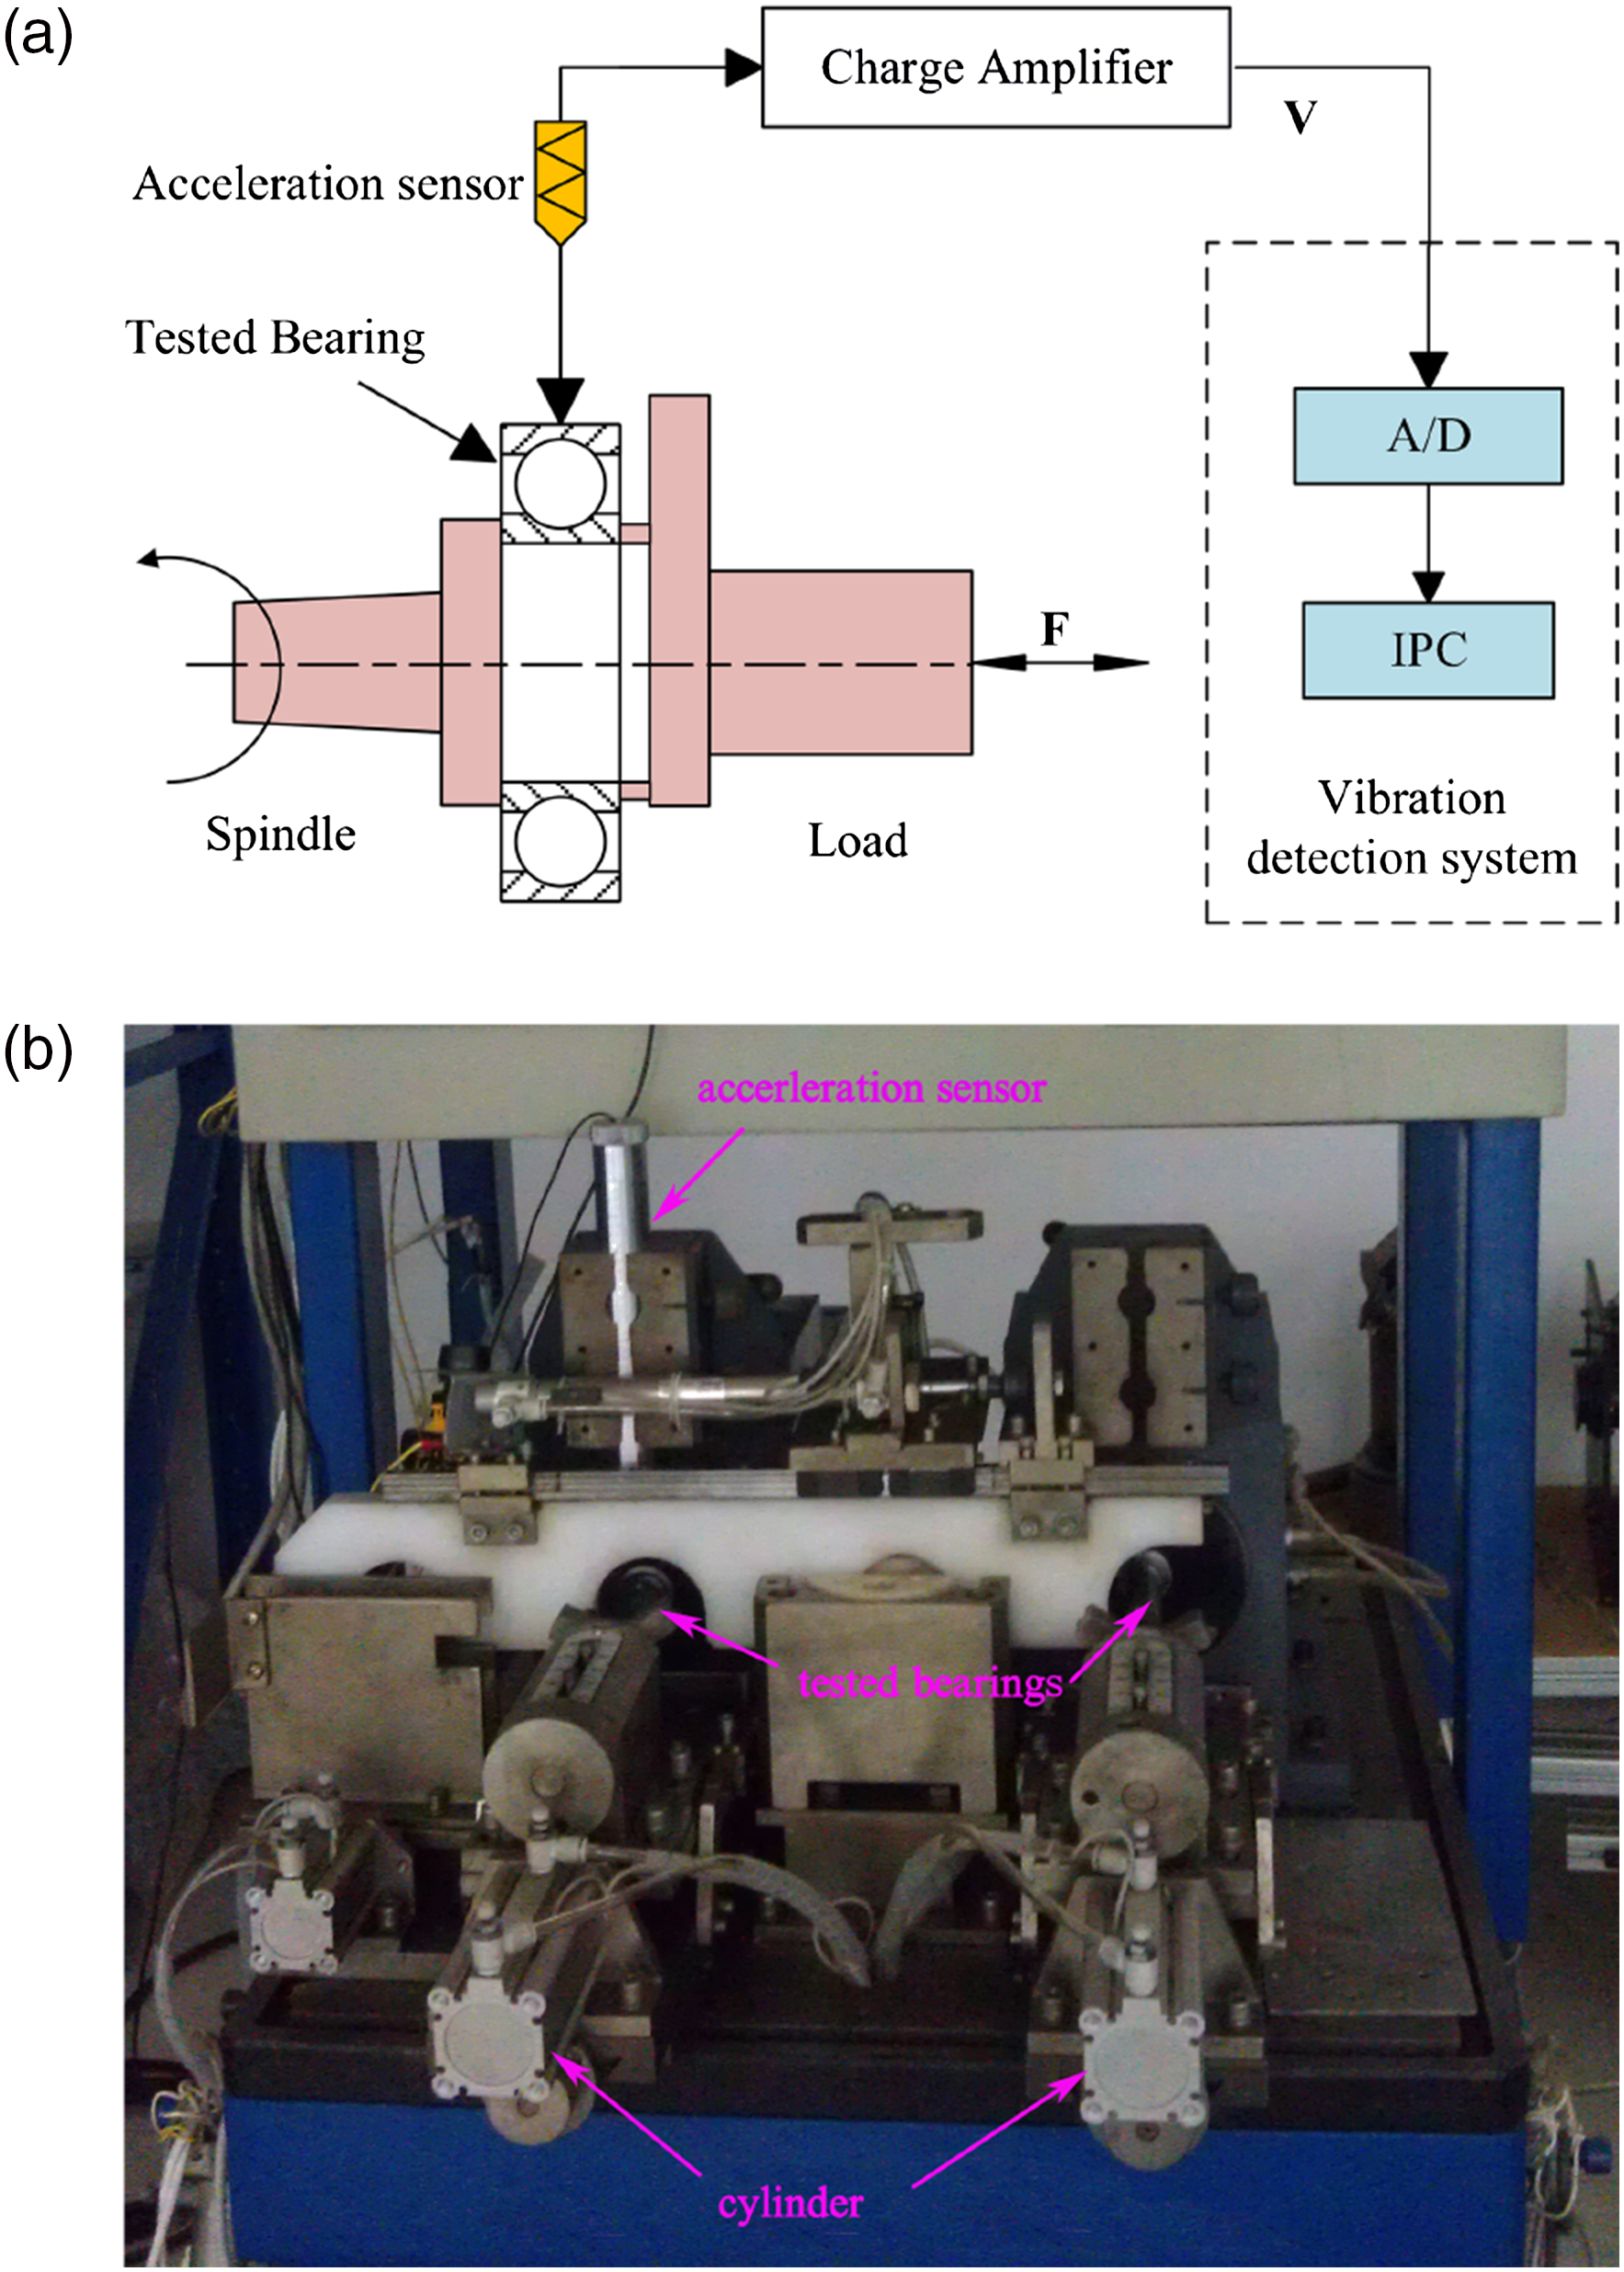
Four different operating conditions were introduced, including inner race fault, outer race fault, ball fault, and normal condition. The scratch defects of the bearings were introduced by electric engraving pen, and the width of the scratch defects of the inner race, outer race, and ball was 65 ± 22 μm, 70 ± 20 μm, and 70 ± 20 μm, respectively, and the depths of the scratch defects were 0.2 ± 0.05 mm. According to the kinematic parameters and the rotational speed, the characteristic bearing defect frequencies of the inner race, outer race, and ball are 121.75 Hz, 78.25 Hz, and 55 Hz, respectively. Four different vibration signal waveforms in the time domain together with the amplitude spectrums are shown in Figure 3. It is difficult to distinguish different faults only from Figure 3 because of the effects of the noise. The vibration signals under those four conditions are selected as samples, and 100 bearings for each state were tested. Thus, 400 data can be obtained, and each containing 25,000 sample points. The training dataset is half samples of the original dataset in the experiment. Time domain and frequency domain figures of vibration signals for the four bearing conditions: (a) normal condition, (b) inner race fault, (c) outer race fault, and (d) ball fault.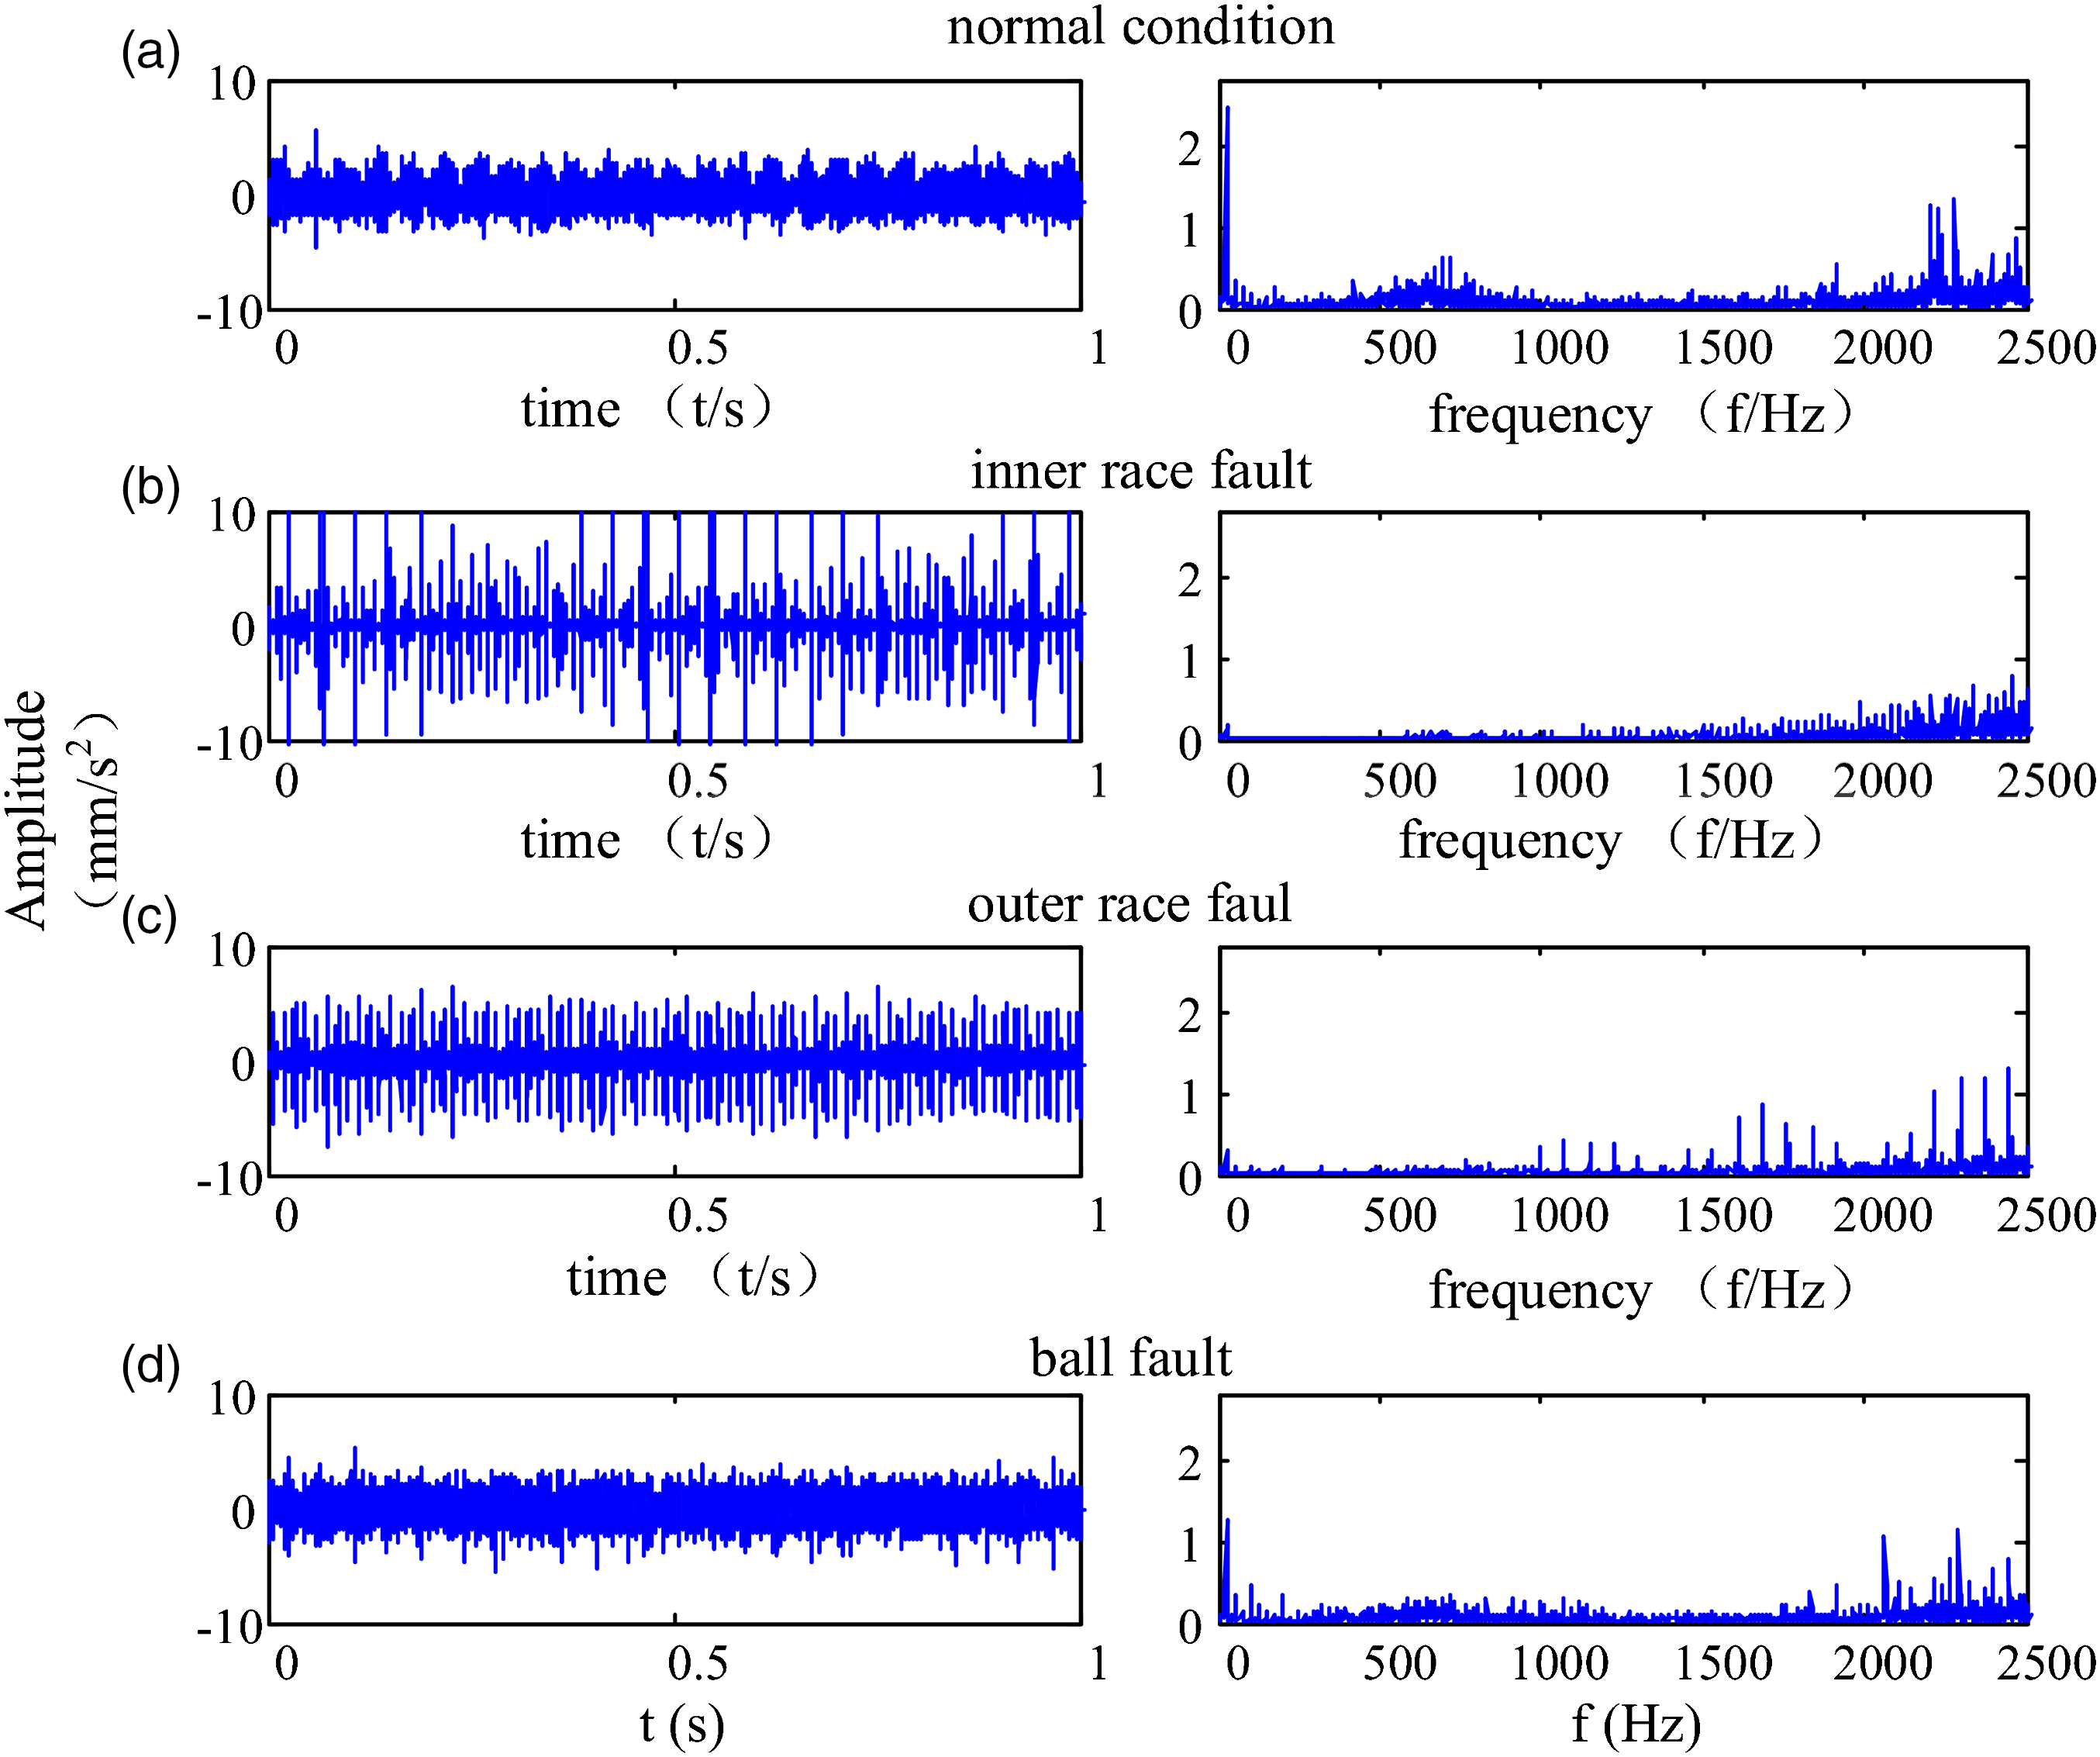
After the high-dimensional feature set is constructed, it is input into CIKECA for eliminating redundant and extracting low-dimensional features, and the first six relative EMD energy entropies of different operating conditions are shown in Figure 4. To examine whether such an introduction of class label to KECA is helpful for recognition, similar methods including PCA, KPCA, and KECA are conducted for comparison. The target dimension for each method is set to a certain number so that the cumulative variance contribution rate is more than 95%. The Gaussian kernel function is selected for all the kernel functions, and the five-fold cross-validation is applied to decide parameter First six relative empirical mode decomposition energy entropies of different operating conditions. Clustering results with principal component analysis: (a) training results and (b) testing results. Clustering results with kernel principal component analysis: (a) training results and (b) testing results. Clustering results with kernel entropy component analysis: (a) training results and (b) testing results. Clustering results with class-information–incorporated kernel entropy component analysis (1): (a) training results and (b) testing results. Clustering results with class-information–incorporated kernel entropy component analysis (0): (a) training results and (b) testing results.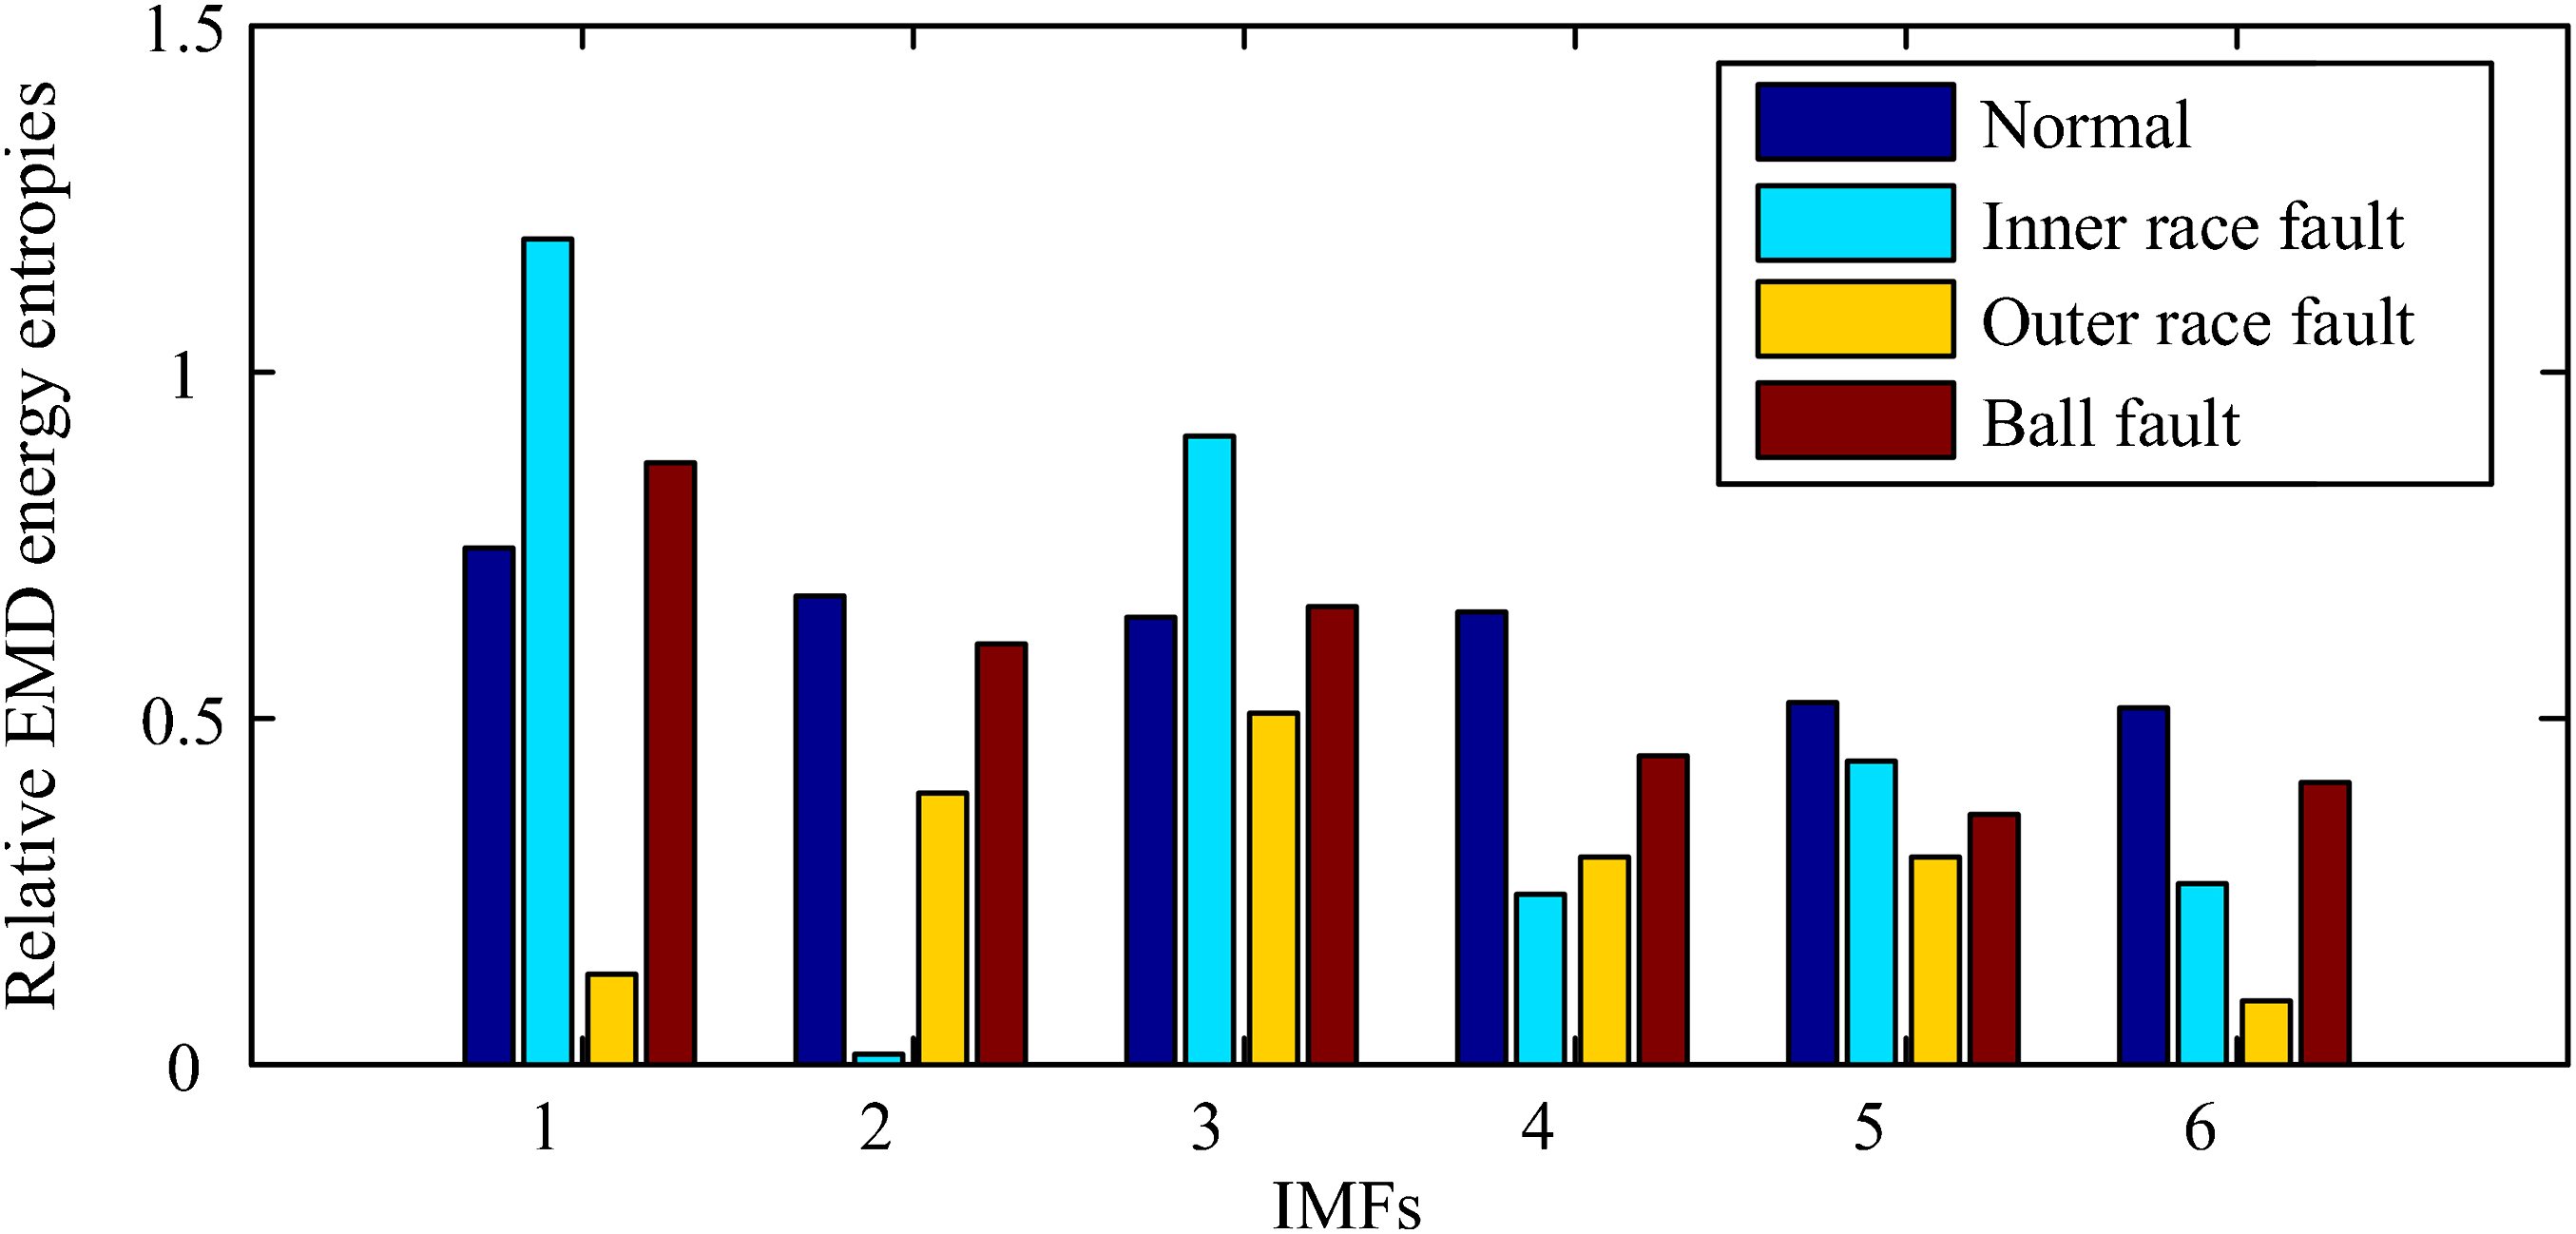
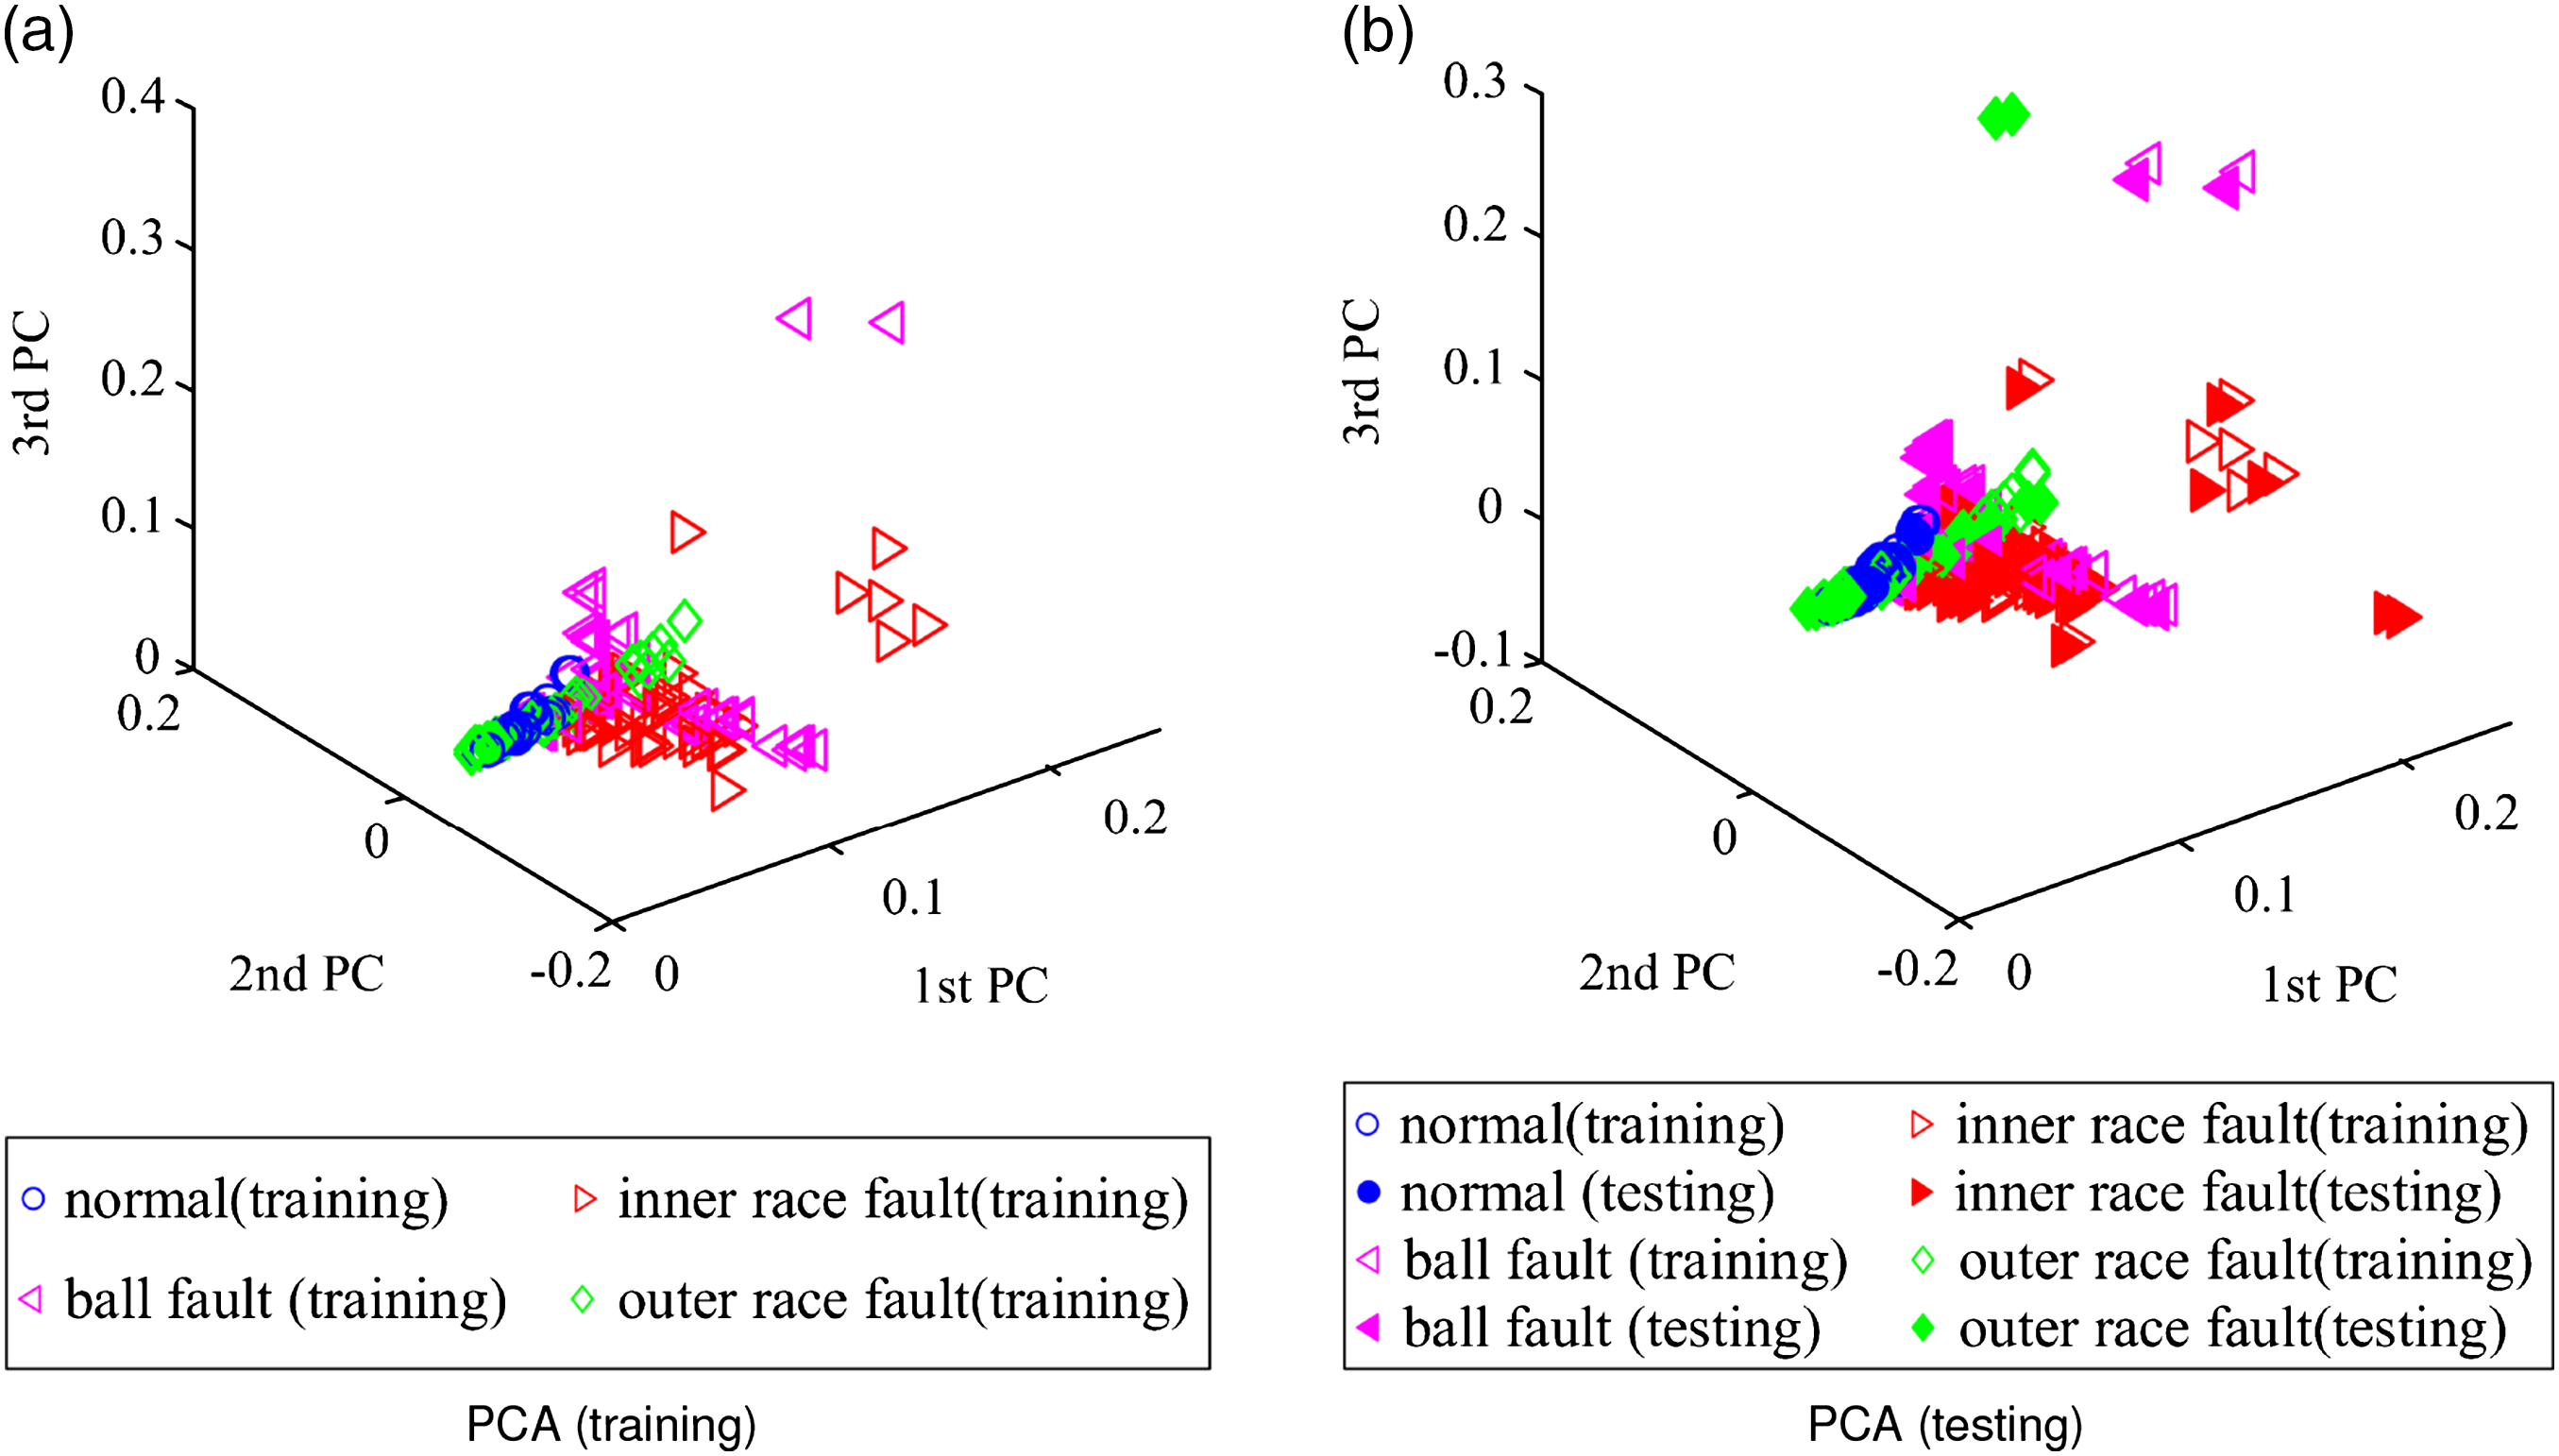
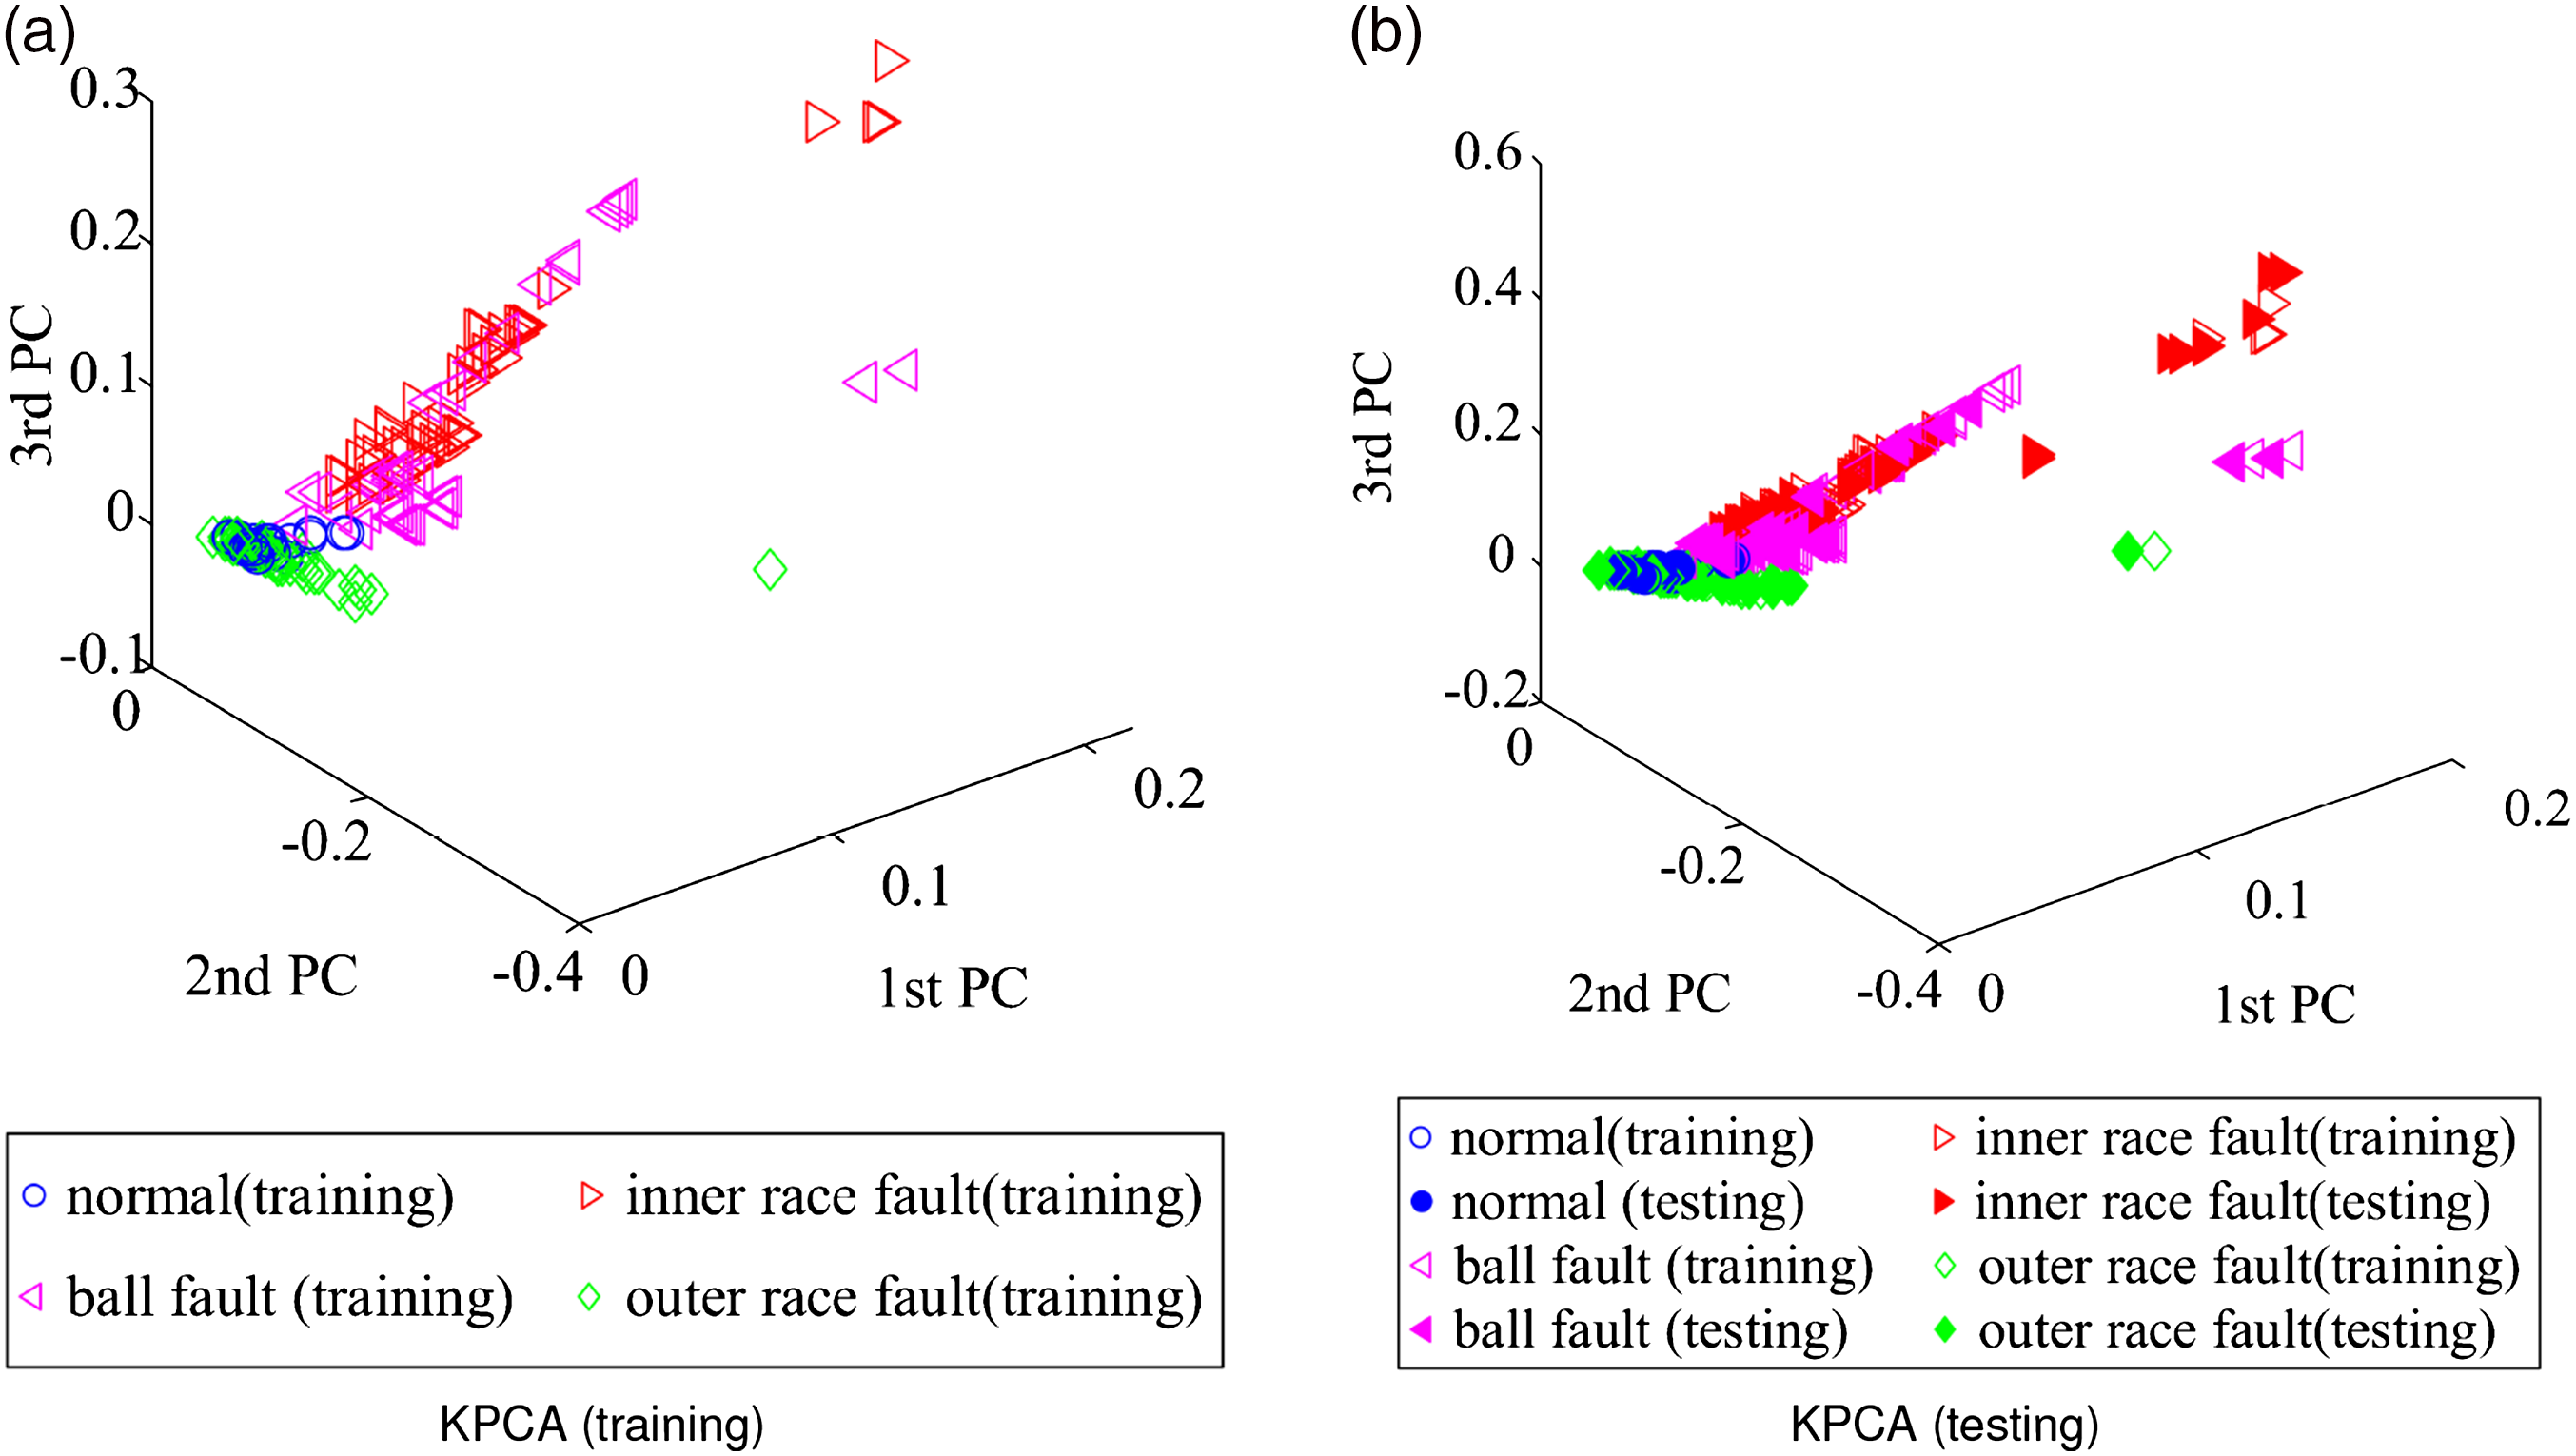

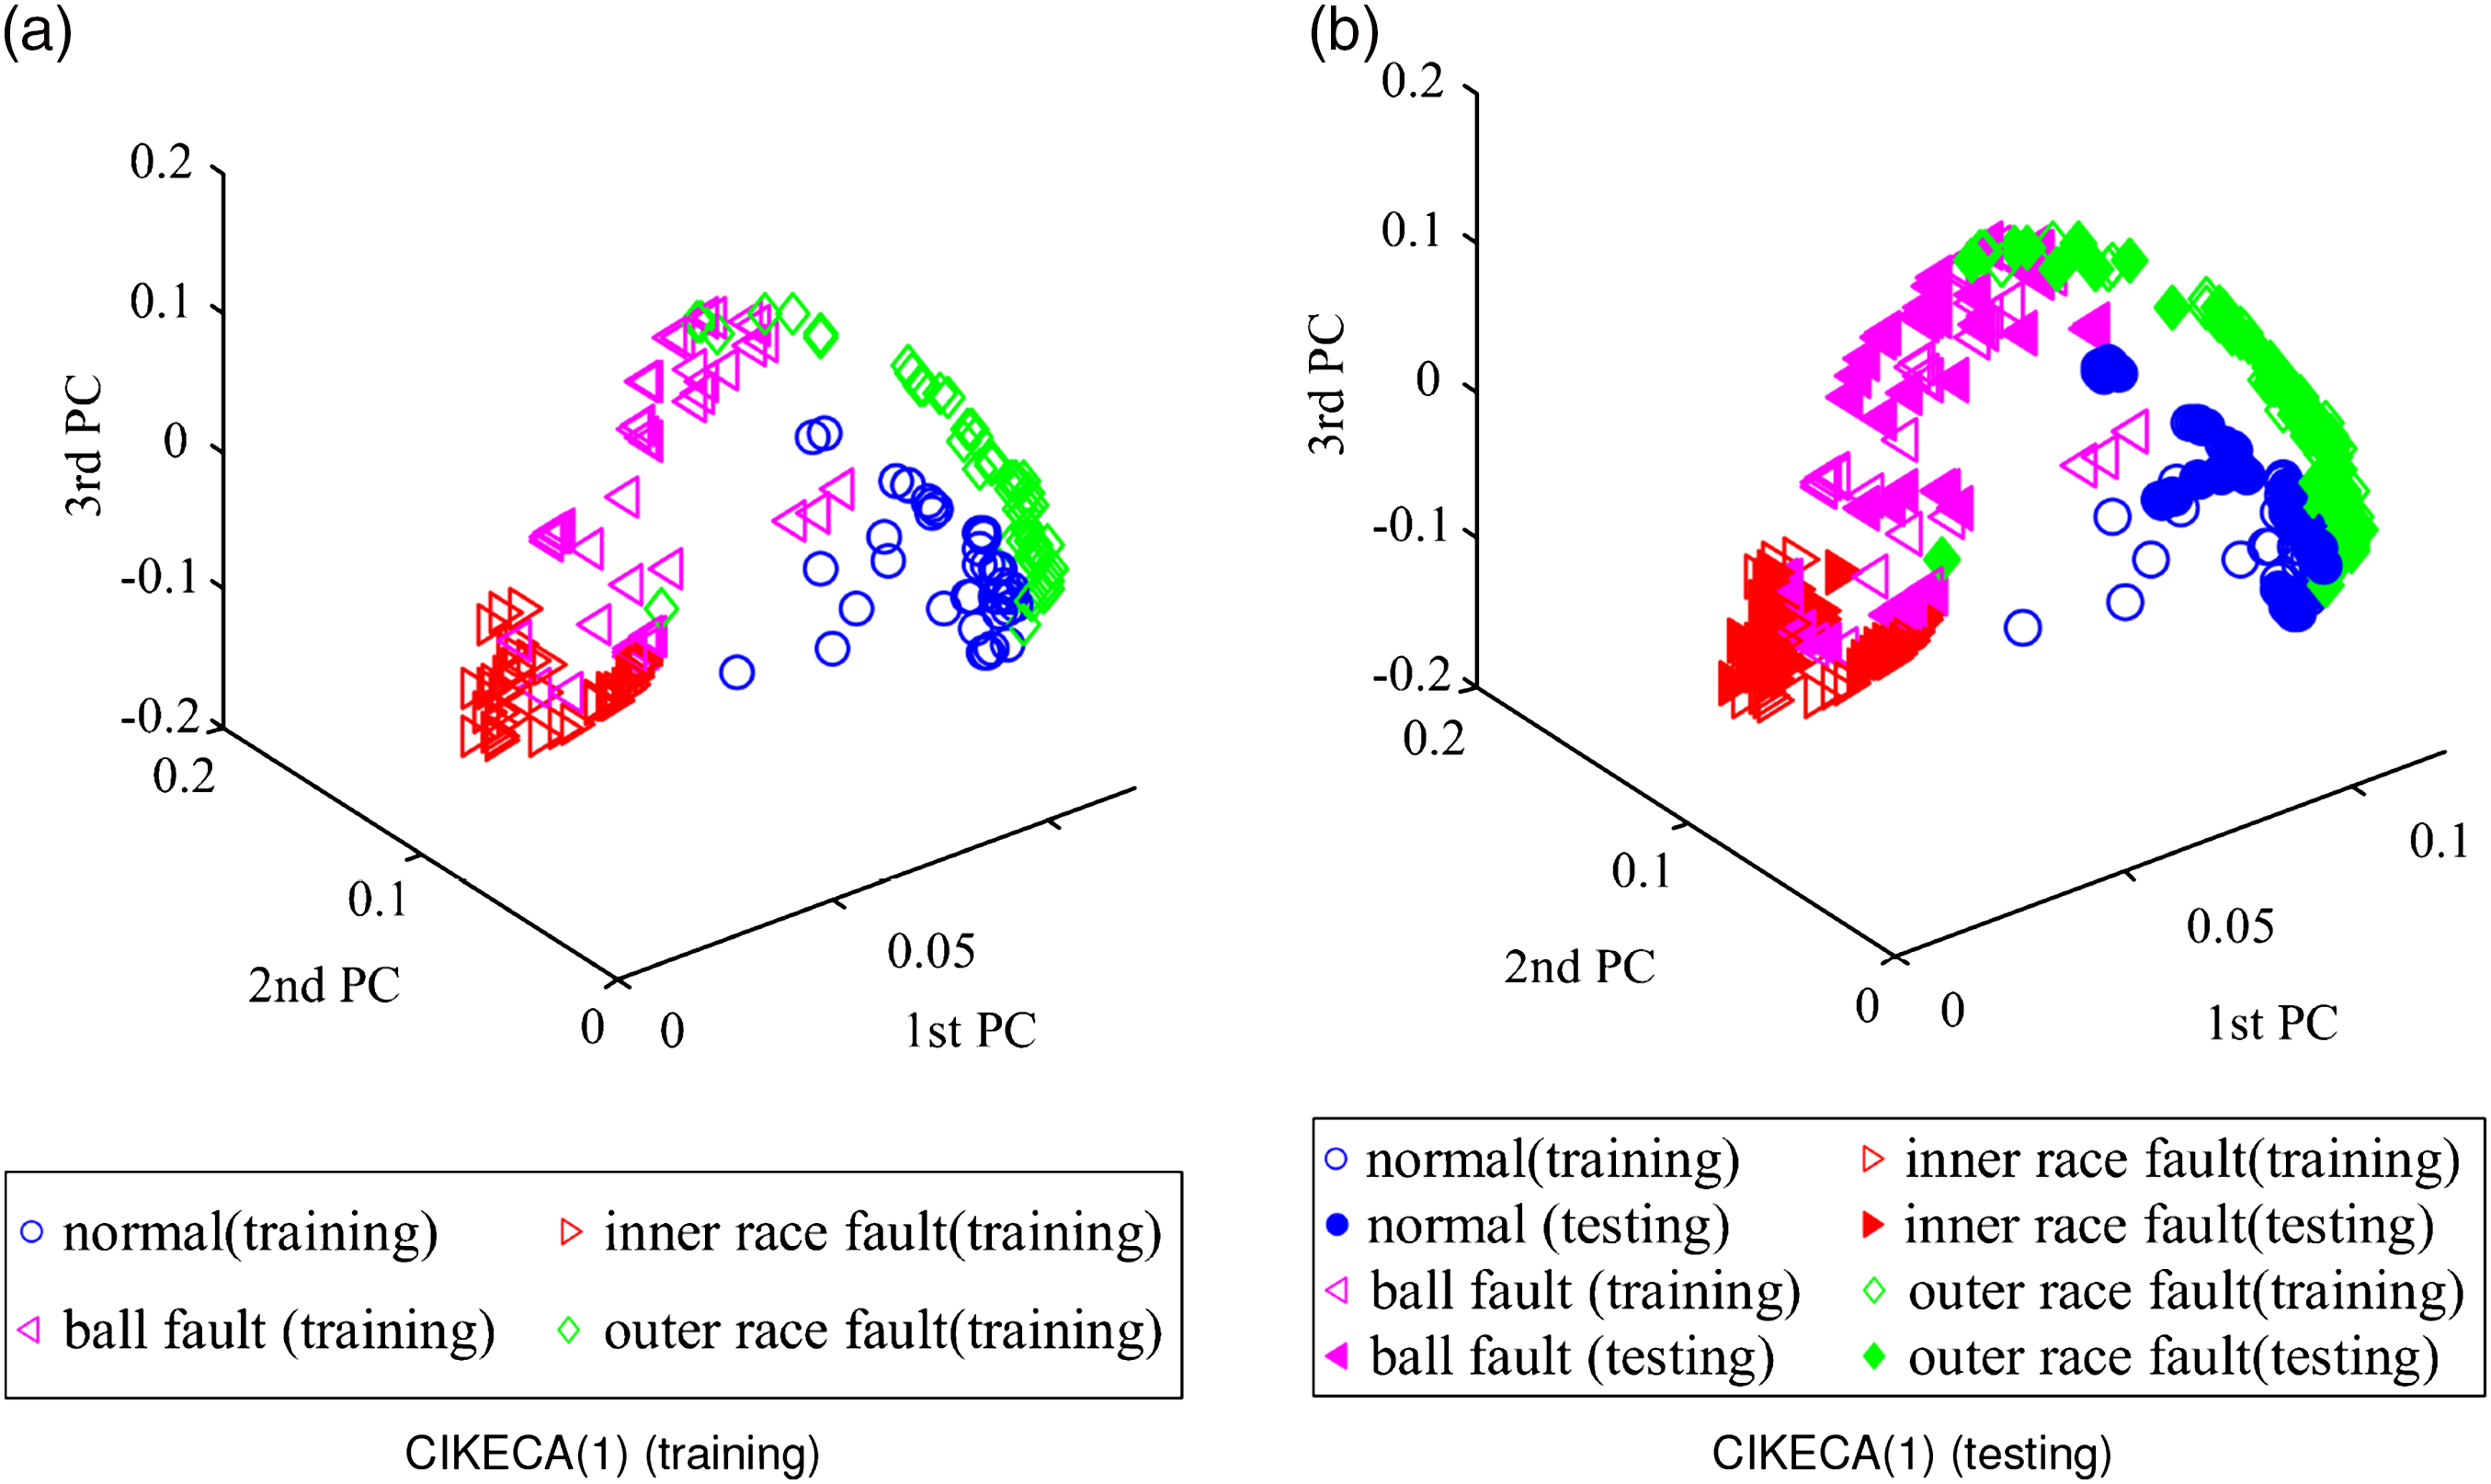
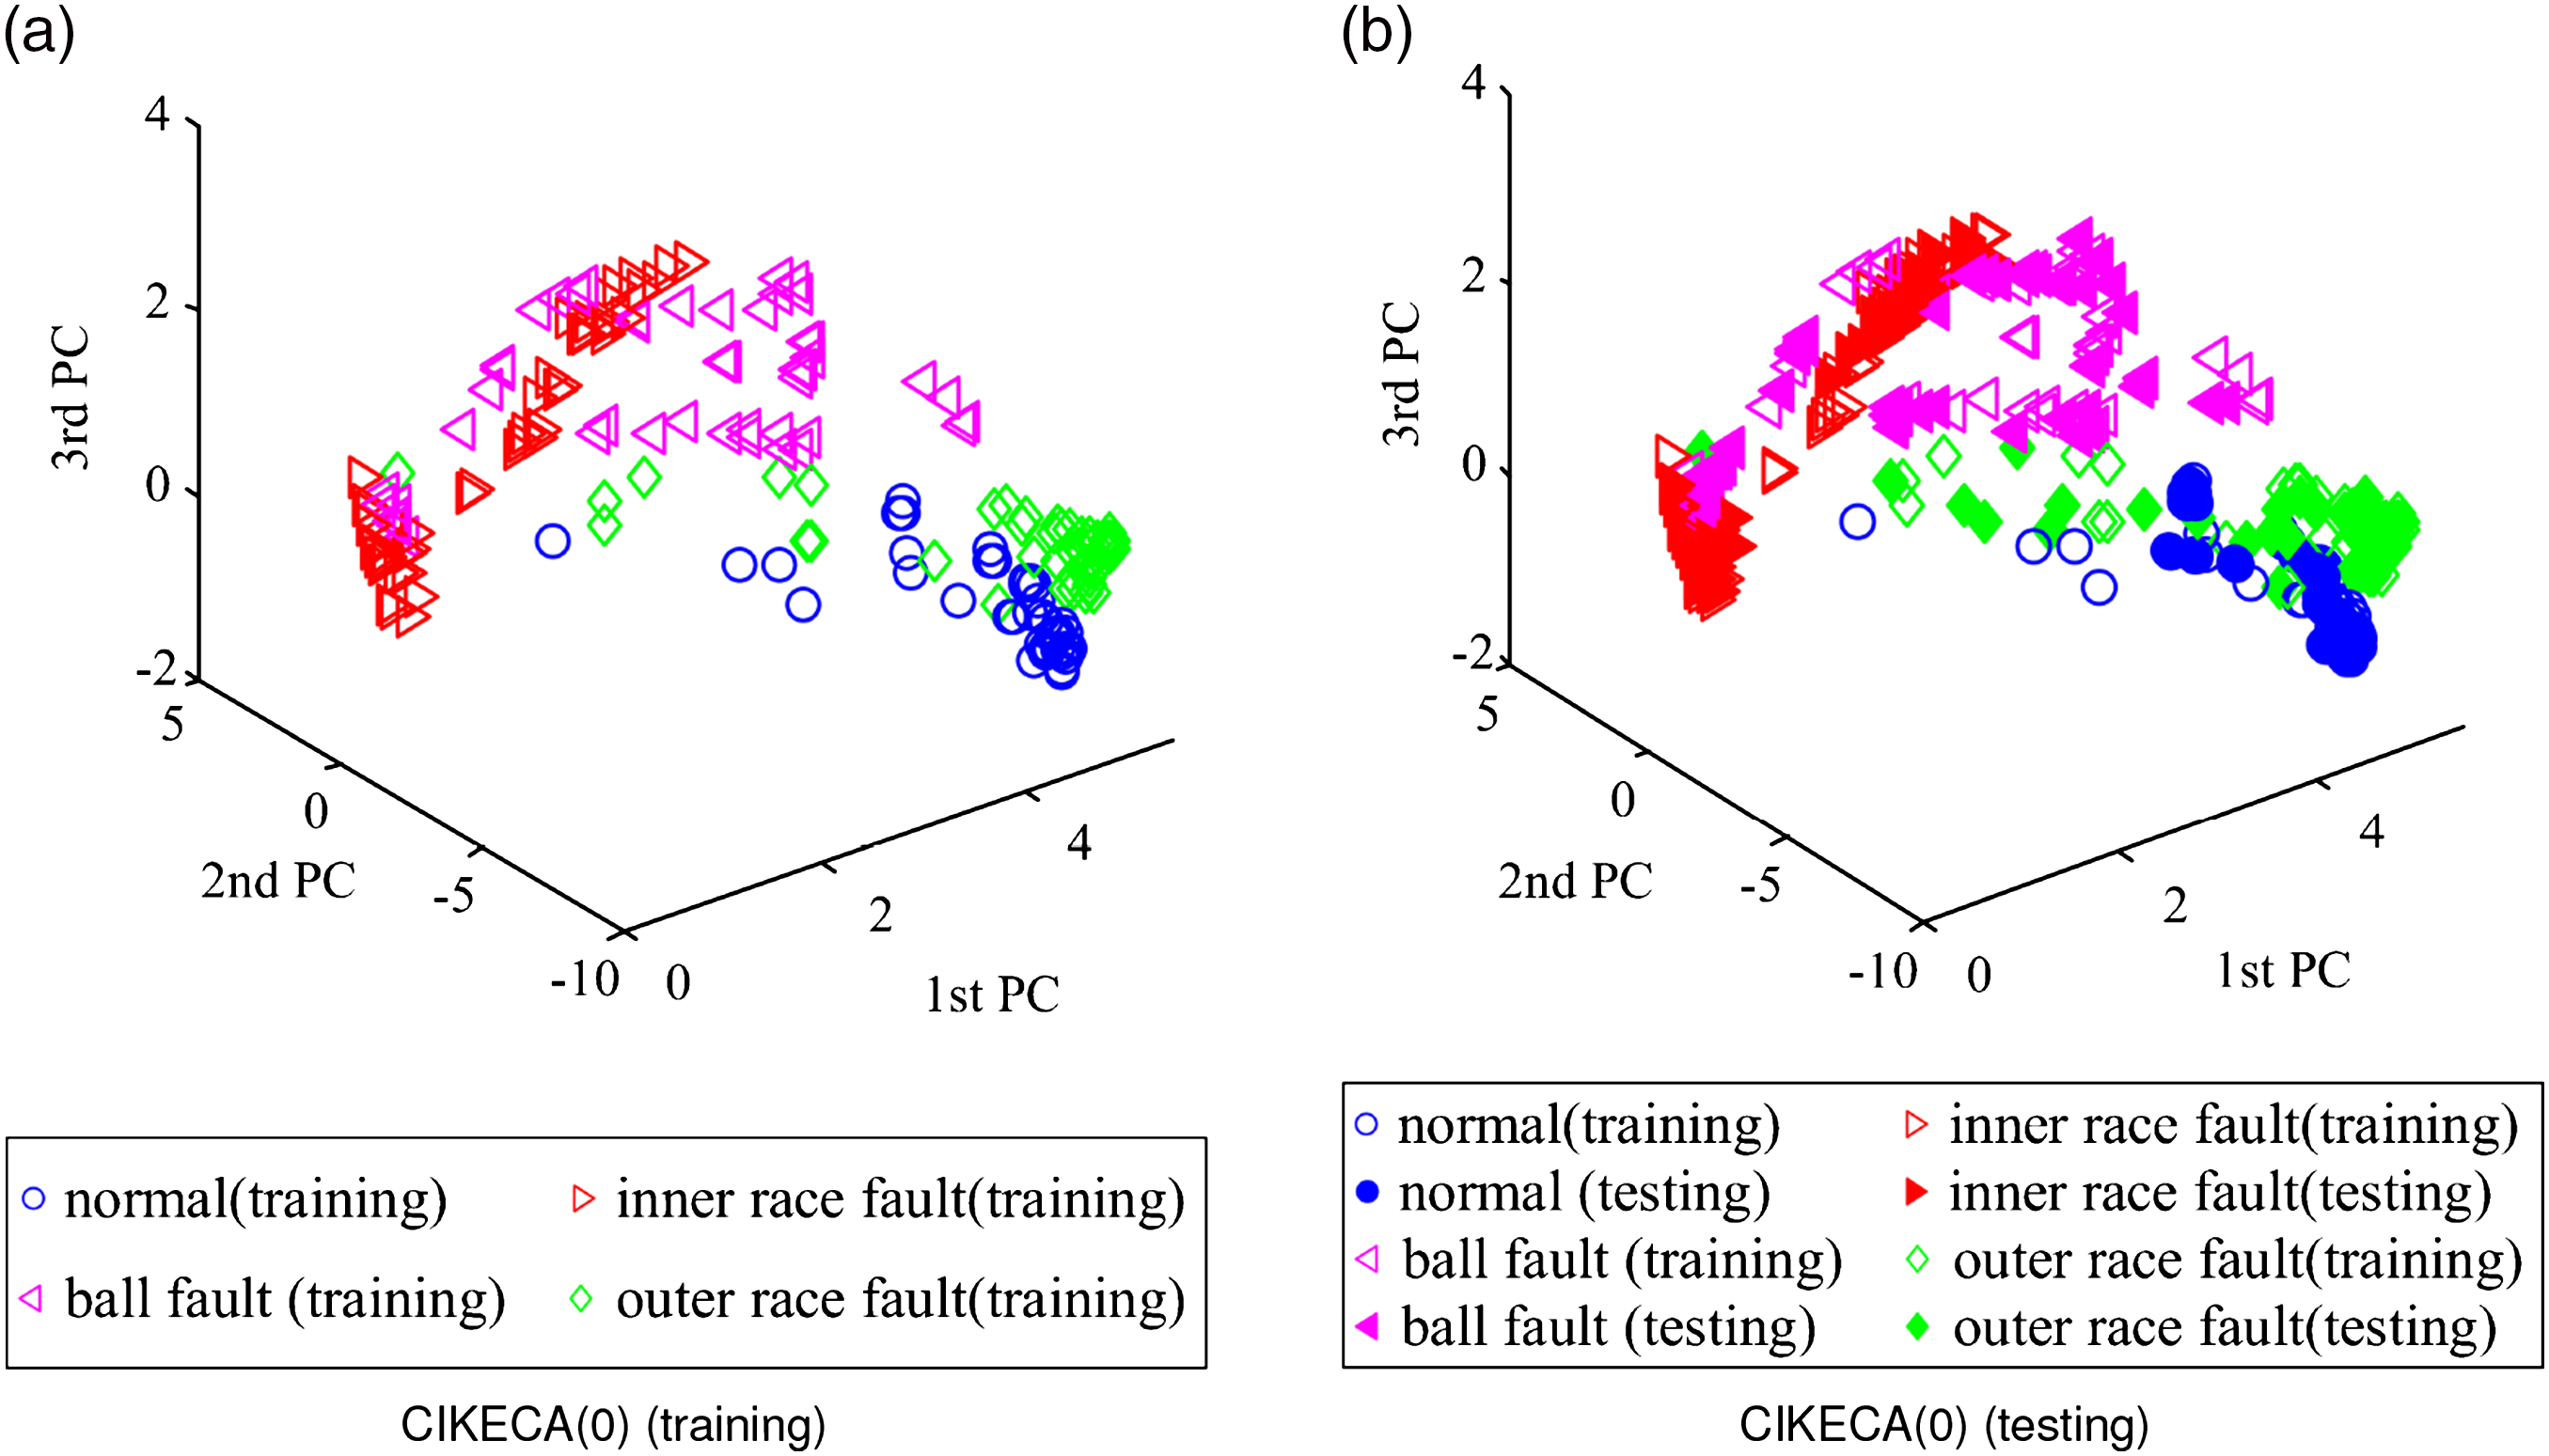
It is evident that the low-dimensional feature dataset of PCA is mostly overlapped, which means that PCA has certain limitations in the extraction of low-dimensional sensitive features of rolling bearings. From Figure 6, most of the low-dimensional feature dataset of KPCA is overlapped, only partial inner race fault and outer race fault samples can be distinguished. As seen in Figure 7, the ball fault and inner race fault in low-dimensional feature dataset of KECA can be recognized, whereas the normal condition and outer race fault samples are overlapped. Figure 8 shows the clustering results of CIKECA (1), where only the extracted feature is used for classification. As seen, the low-dimensional feature dataset of CIKECA (1) separates from each other in three-dimensional space, only a few data points are overlapped. Figure 9 shows the clustering results of CIKECA (0), where the single estimated label is used for recognition. Most of the low-dimensional feature dataset of CIKECA (0) is parted from each other in three-dimensional space, especially for the normal state and outer ring fault. The experimental results indicated that CIKECA has better clustering and dimensionality reduction performance than the other methods. The low-dimensional sensitive features and estimate label information extracted by CIKECA can both represent the running state of rolling bearings; the fusion information may improve the rolling bearing fault identification.
Classification results (%) of each method with KNN classifier.
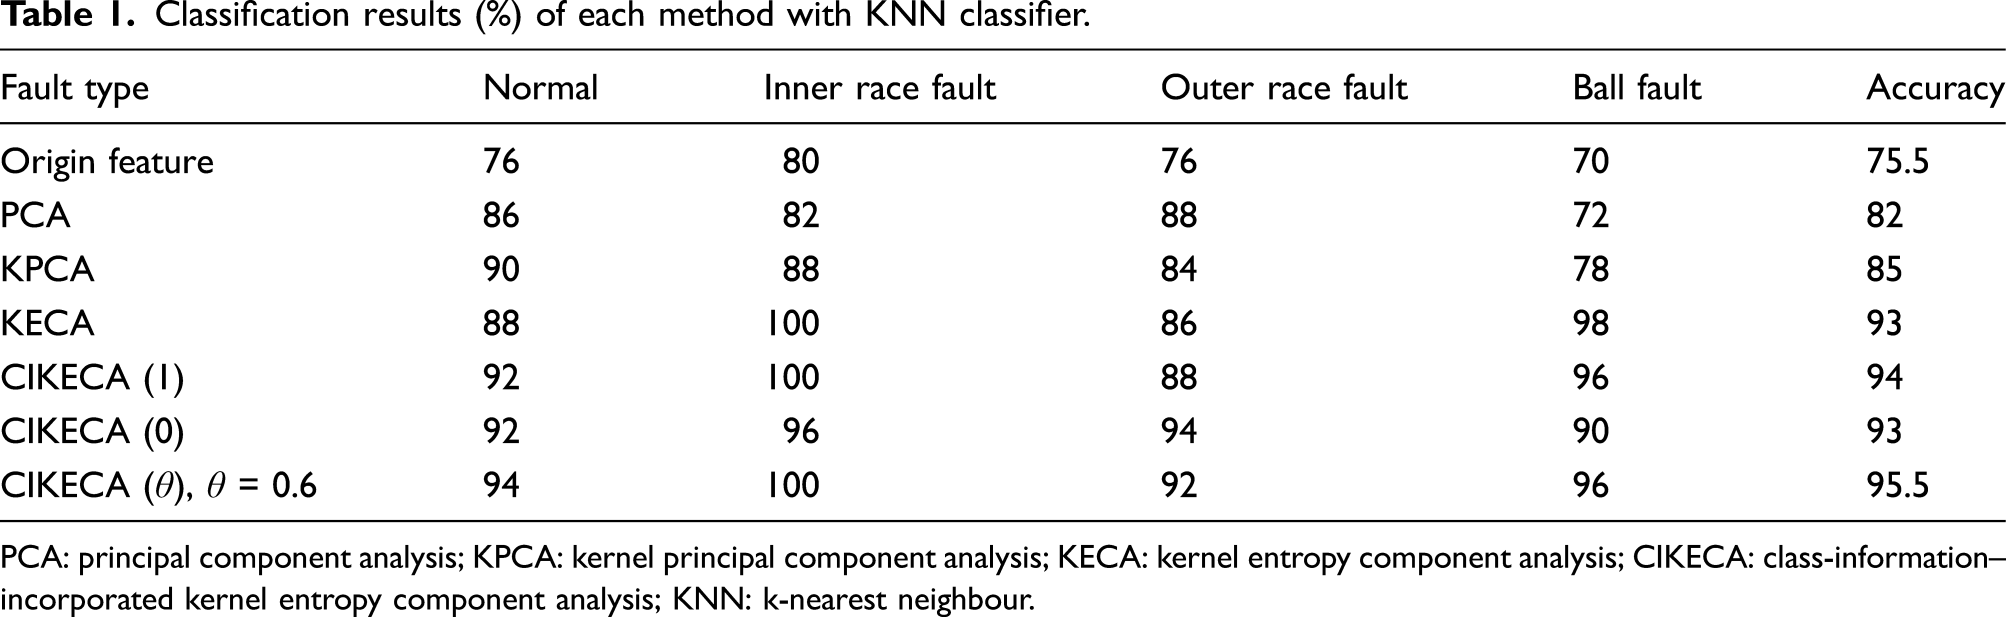
PCA: principal component analysis; KPCA: kernel principal component analysis; KECA: kernel entropy component analysis; CIKECA: class-information–incorporated kernel entropy component analysis; KNN: k-nearest neighbour.
θ (0 ≤ θ ≤ 1) is the fused coefficient, which can determine the proportion of low-dimensional feature information and category label information in classification. Therefore, it is necessary to analyze the relationship between the parameter theta and the final identification accuracy. For different fused coefficient (increased from 0 to 1), the nearest neighbor classifier based on fusion information is used for classification. The quantitative evaluation procedures are repeated for 10 times; the relationship between average accuracy and fused coefficient θ is shown in Figure 10. As seen, the accuracy varies in different fused coefficient, the classification accuracy of CIKECA(θ) features is still higher than that of other algorithms for most θ values. Relationship between accuracy and fused coefficient θ.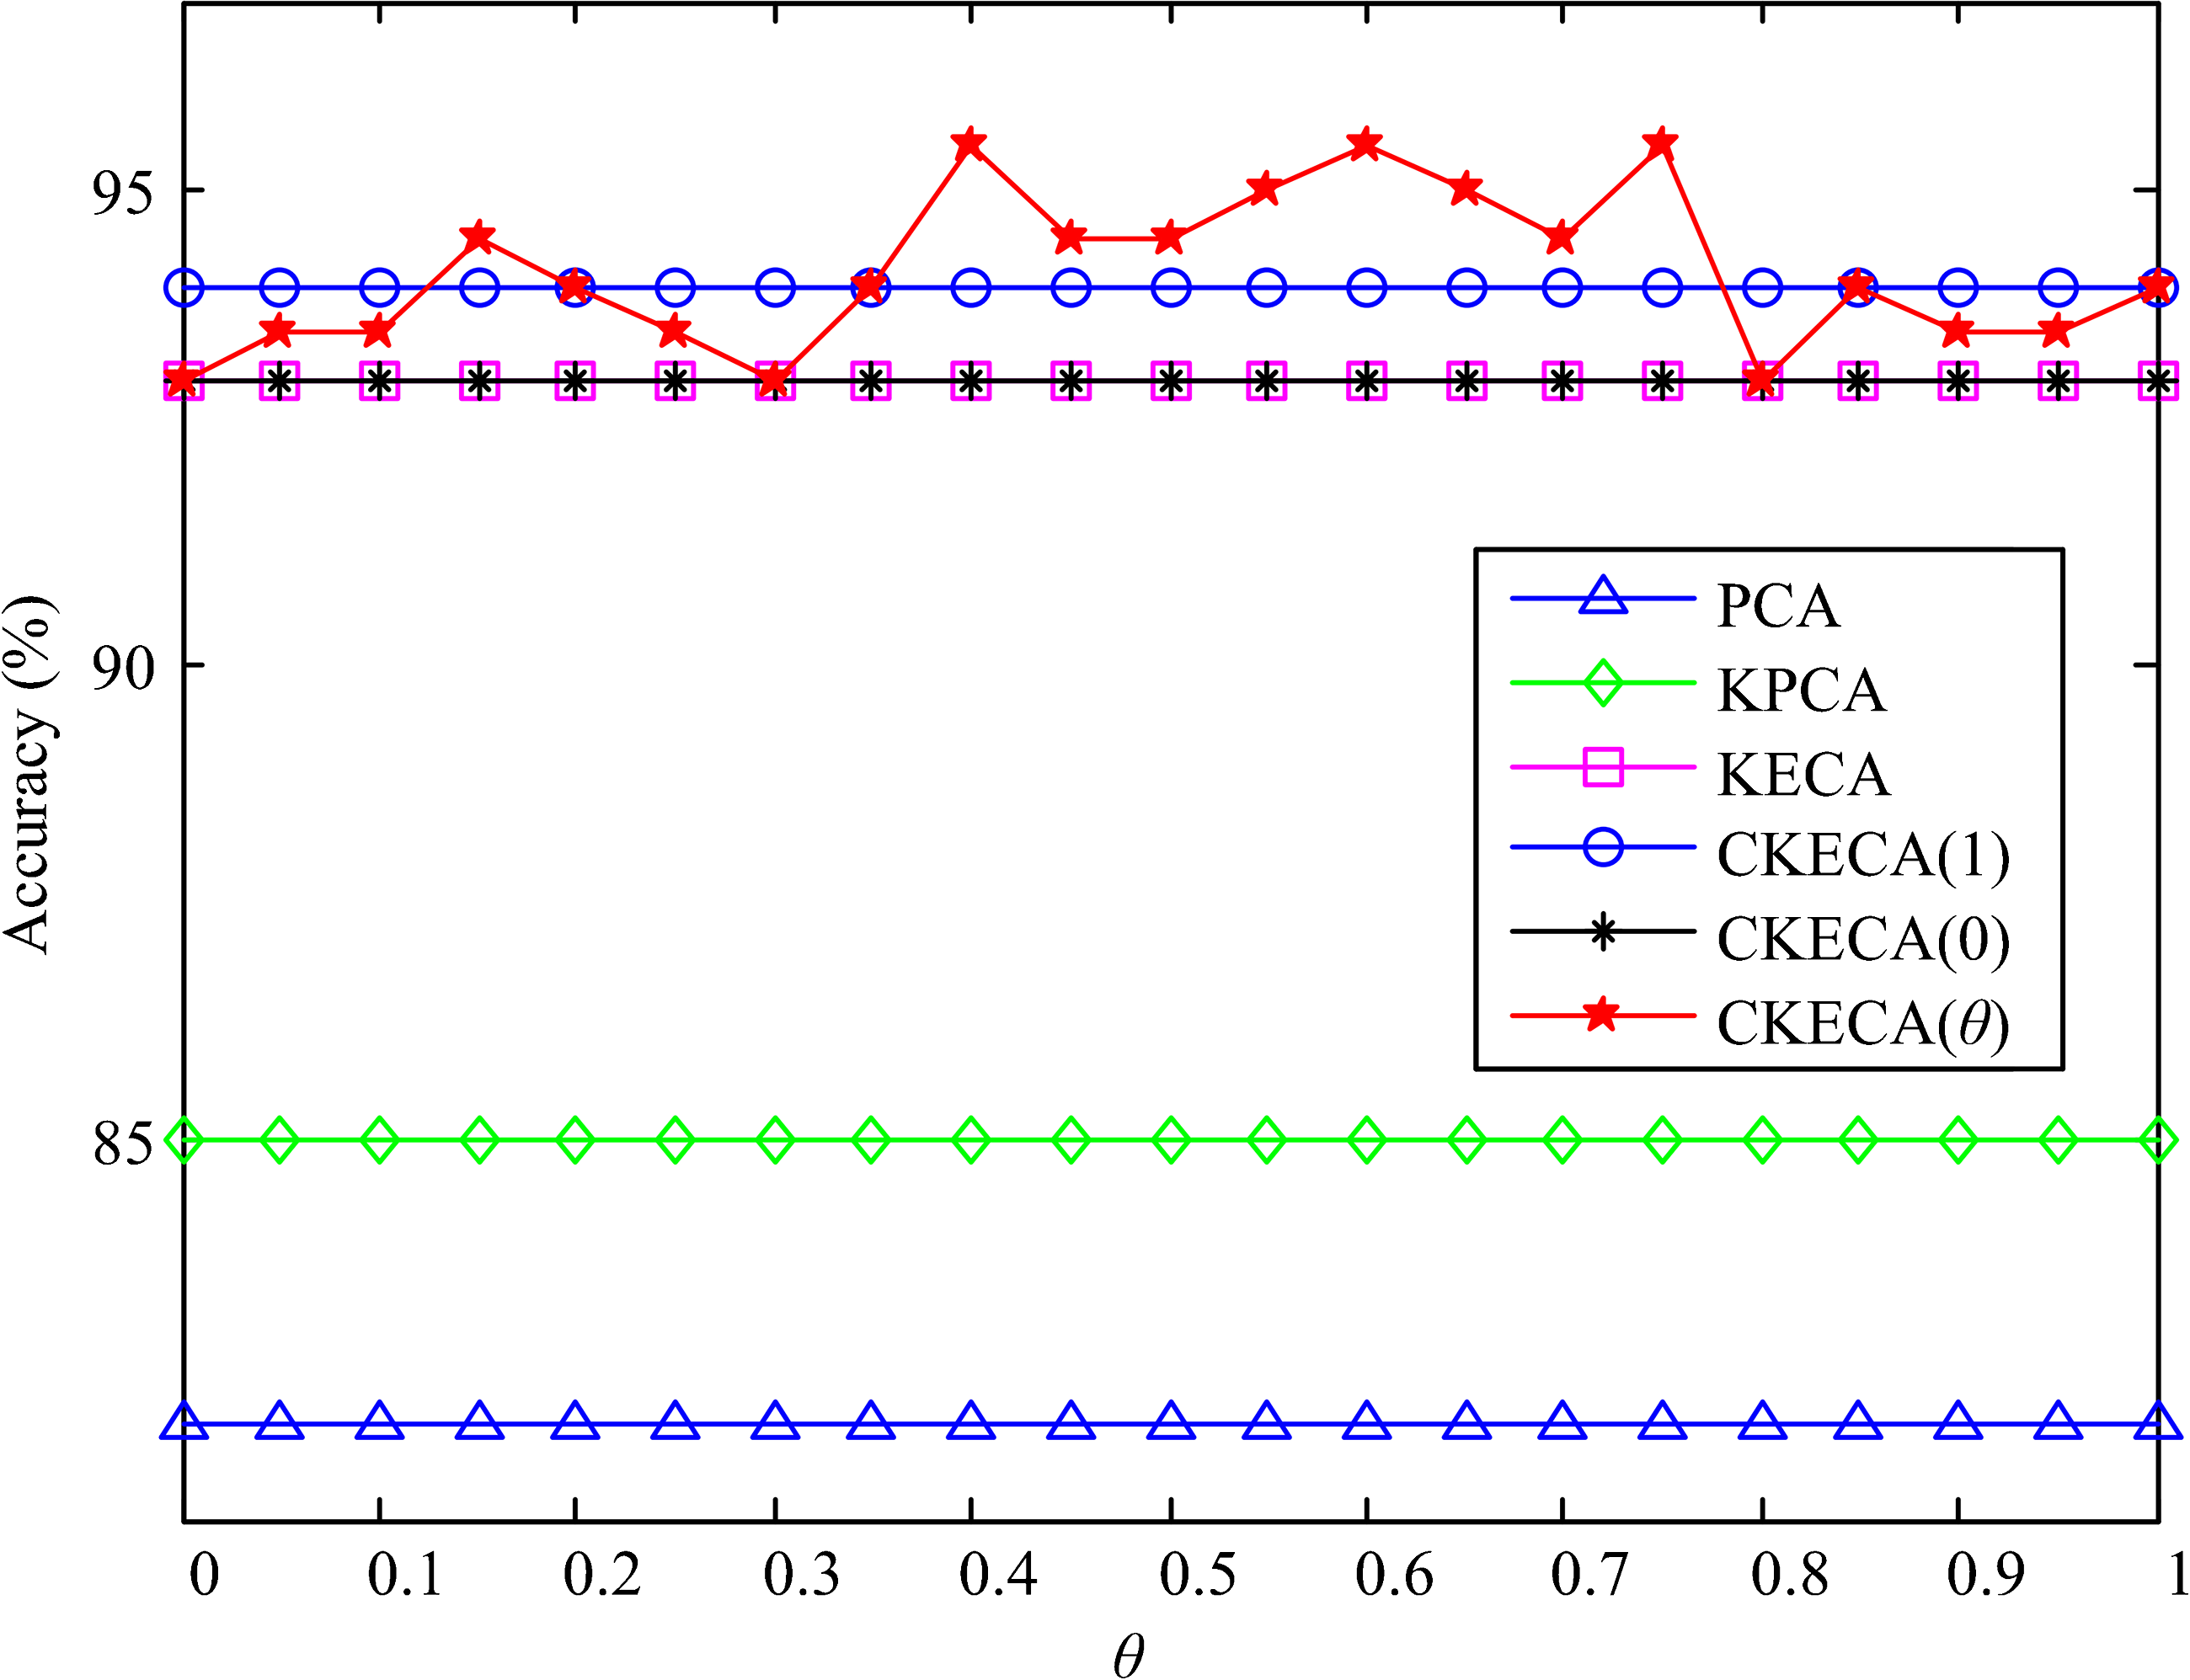
4.2. Experiment 2
The platform includes the induction motor, s shaft coupling to the motor, several bearings supporting the shaft, and an oil-loaded device as a radial loader, the schematic of the platform together with the actual experimental system is shown in Figure 11(a) and (b), and the detailed description can be found in Pan et al. (2016). The type of tested bearing is HRB 6010-2RZ, and the geometric parameters of the bearings are listed as follows: Di = 50 mm, Do = 80 mm, Db = 9 mm, Pd = 65 mm, and Z = 13. Spalls were introduced by wire-cut electro-discharge machining on the inner race and outer race, the width and depth of defects were 0.3 mm and 1 mm, respectively. The signals were collected by B&K3560 system, the sampling frequency was 65,536 Hz, and the rotational speed was kept constant at 1500 r/min. Radial load of 1.0 kN and axial load of 2.0 kN were added to the shaft and bearings by the hydraulic cylinder. The vibration signals under those three conditions are selected as samples, and each state contains 80 samples which contains 65,536 sample points. The training dataset is half samples of the original dataset in the experiment. Test rig. (a) Schematic of the testing machinery system and (b) testing machinery setup.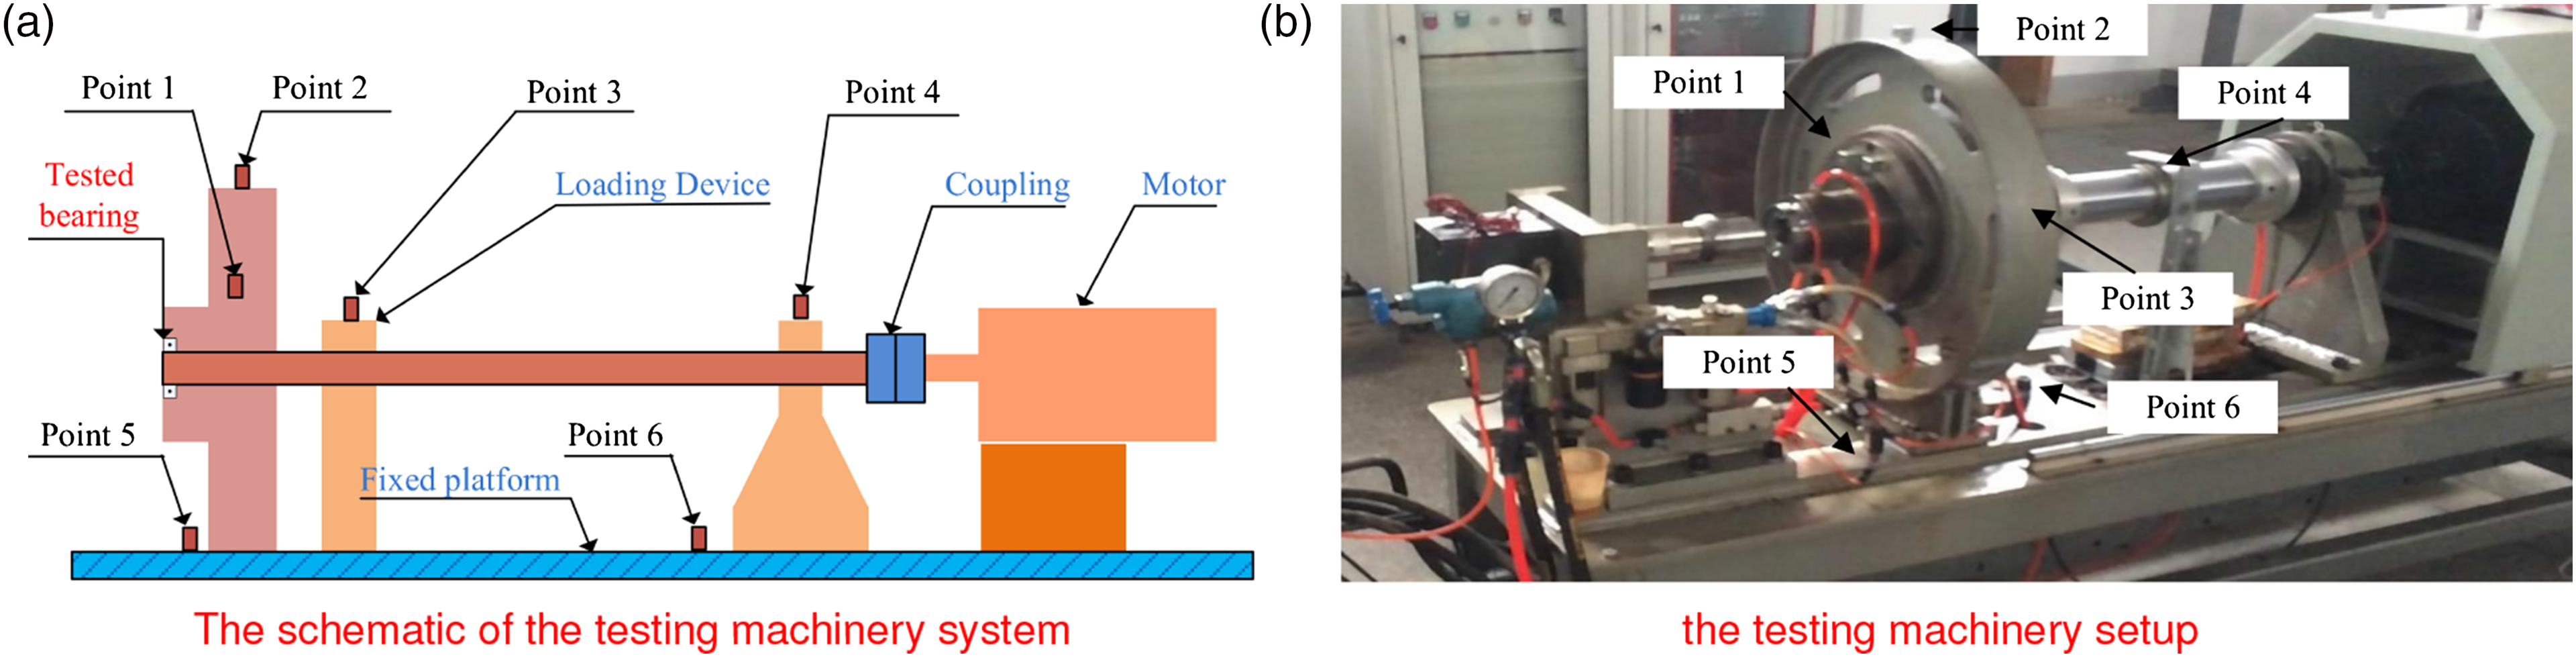
Because of various noise and interfering vibrations, the distance between the fault vibration source and the acceleration sensor can influence the recognition accuracy. As shown in Figure 12, six accelerometers were mounted along the shaft and fixed platform at Point 1, Point 2, Point 3, Point 4, Point 5, and Point 6 to acquire vibration signals, where Point 1–Point 4 were mounted along the shaft and Point 5 and Point 6 were mounted on the fixed platform. The vibration signal waveforms in the time domain of normal condition, outer race fault, and inner race fault at Point 1–Point 6 are illustrated in Figure 12(a)–(c), respectively. The periodic impulse is obvious at Point 1 as shown in Figure 12, and the periodic impulse at Point 2 is partially submerged by noise, whereas the periodic impulse is completely overwhelmed by noise at the remaining points. As the location of sensor gets further and further, the vibration impulse is gradually submerged by noise. Although measuring Point 5 located on the fixed platform of experimental setup is close to tested bearing, it affects by the joint impact of the connecting parts that the characteristic impulse is also drowned by noise. Vibration signal waveforms of Point 1–Point 6 in the time domain: (a) normal condition, (b) outer race fault, and (c) inner race fault.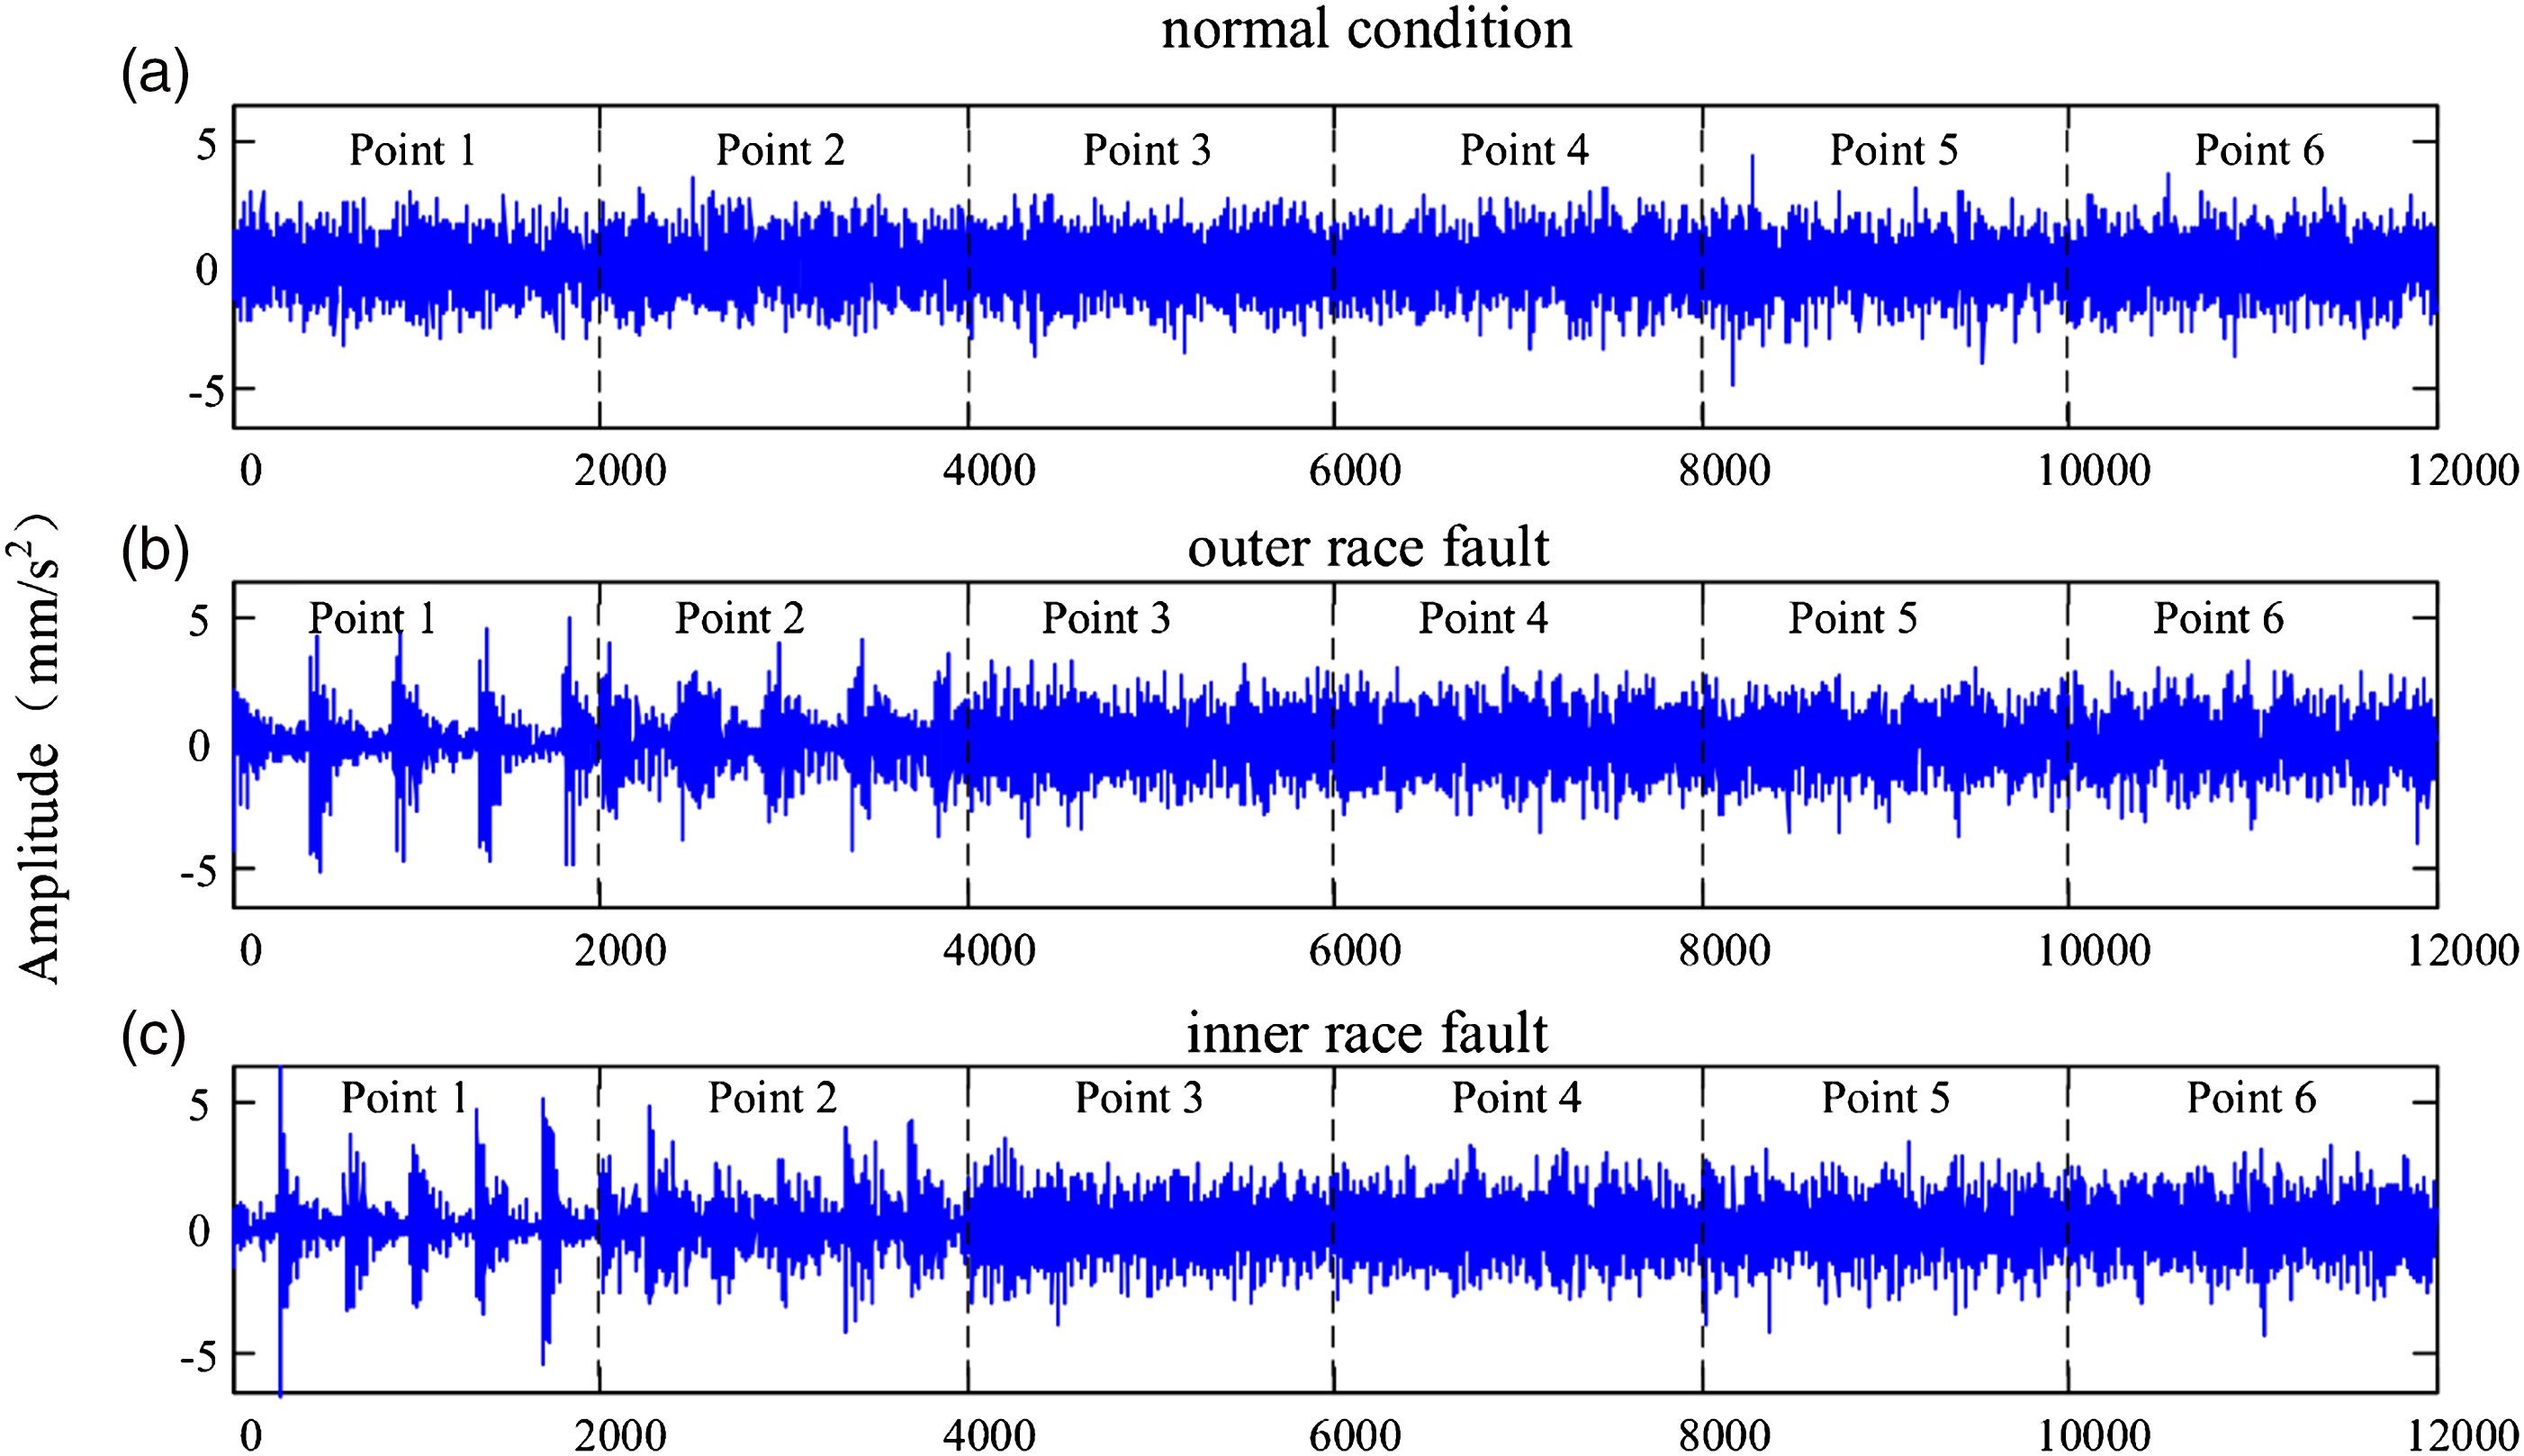
To verify the robustness of the proposed method, Experiment 2 has been performed. High-dimensional features of vibration signals at Point 1–Point 6 are first constructed, PCA, KPCA, KECA, and CIKECA are applied to extract the sensitive features, and the extracted features are directly fed into KNN classifier as the final evaluation criteria, where the nearest neighbor number k is set to 5. 40 samples per class are selected randomly for training, and remaining samples are used for testing. The quantitative evaluation procedures are repeated for 10 times, and the average classification results are shown in Figure 13(a). And a receiver operating characteristic (ROC) curve and area under the ROC curve (AUC) are also used to evaluate the performance of the proposed method (Nayana and Geethanjali, 2017). These AUC-ROC plots are obtained for each class of the classification, and the average AUC-ROC values of all datasets are computed to assist in validating the better performing feature extraction method. Average AUC is presented in Figure 13(b). Experimental results at different measuring points. (a) Average accuracy of different methods at different measuring points and (b) average AUC of datasets by KNN for origin features, PCA, KPCA, KECA, and CIKECA. KNN: k-nearest neighbour; PCA: principal component analysis; KPCA: kernel principal component analysis; KECA: kernel entropy component analysis; and CIKECA: class-information–incorporated kernel entropy component analysis.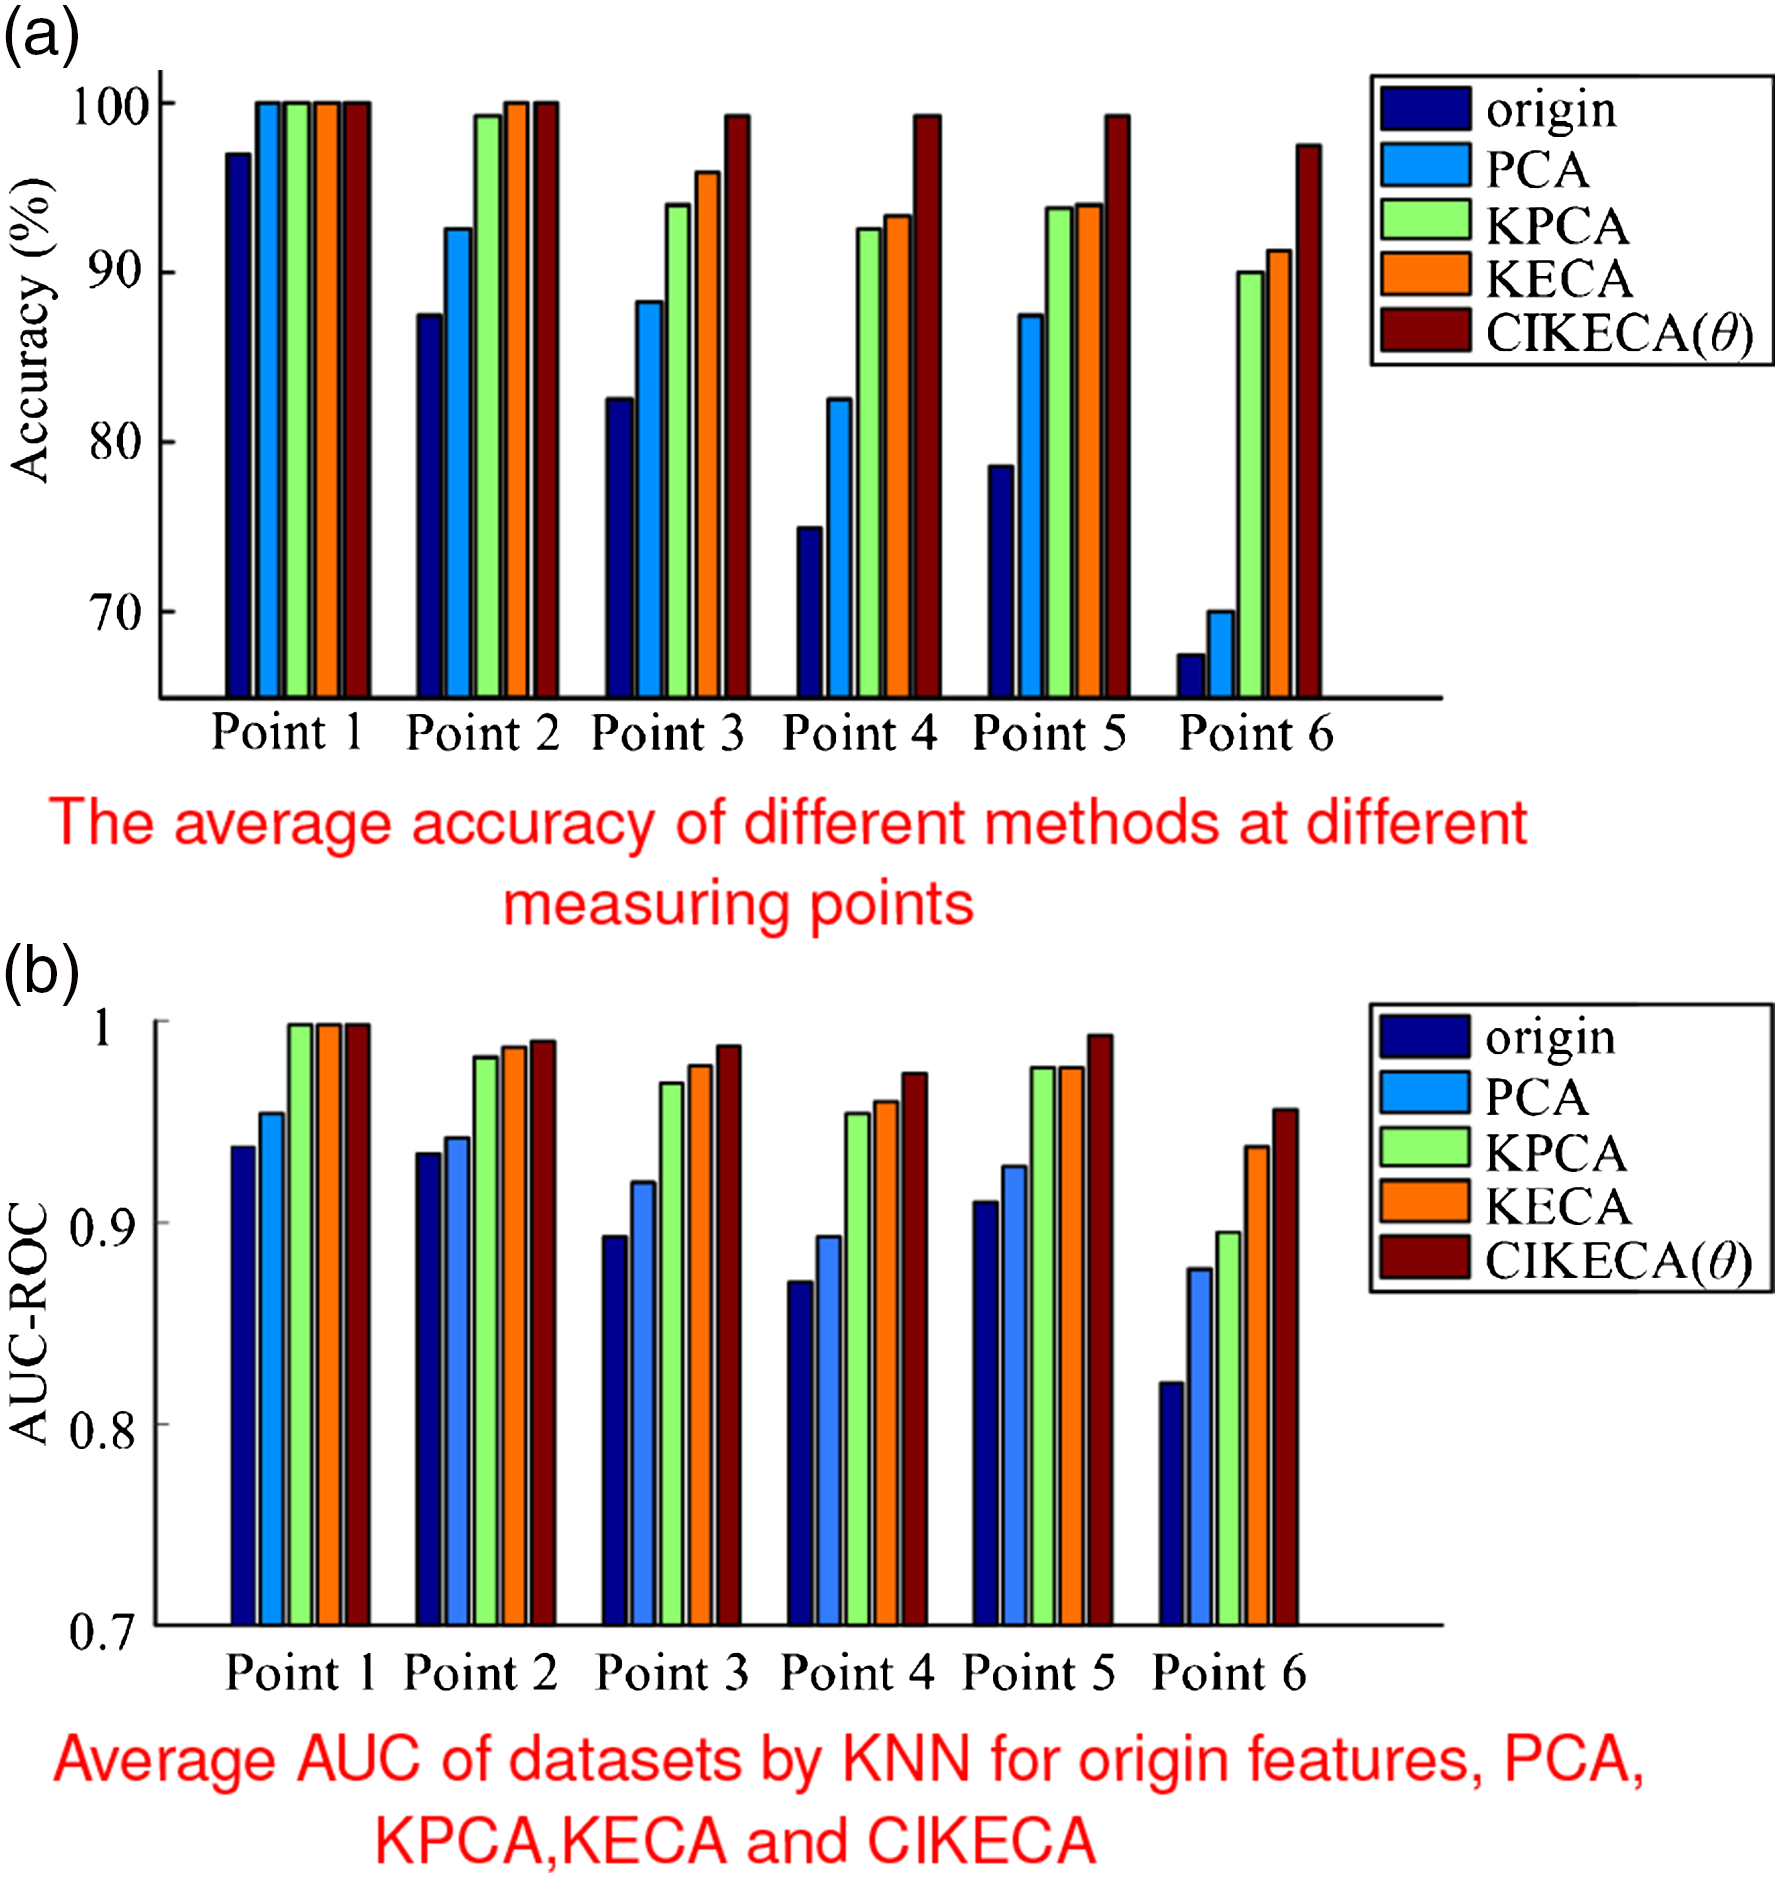
As seen, all the classification accuracy of the extracted features decreases gradually as the distance increases along the shaft (Point 1–Point 4). For the measuring point mounted on the fixed platform, that is Point 5 and Point 6, Point 5 is near the tested bearing, the accuracy at Point 5 is close to Point 3 because it affects by the joint impact of the connecting parts. The accuracy at measuring Point 6 is lower than other points. For all the measuring points, the recognition results of origin features are lowest, which means effective dimension reduction methods can remove redundant information and improve recognition accuracy, and the accuracy of CIKECA (θ) features is obviously higher than other methods, especially at measuring Point 6, the accuracy is high as 97.5%. Above all, compared with other algorithms, the proposed method has better robustness and can effectively extract low-dimensional sensitive characteristic parameters from high noise data, which can improve the state recognition performance of rolling bearings.
5. Conclusions
In this study, a feature extraction method called CIKECA is proposed for fault diagnosis of rolling bearings. CIKECA is presented in two objectives: one is to make full use of tagged information of the given data and the other is to still follow the same simple mathematical formulation as KECA. First, the multidomain features involving time domain, frequency domain, and time–frequency domain are constructed. Then, CIKECA is used to dimension reduction which can extract the intrinsic geometric features and remove the superfluous information. Finally, the extracted features of the feature space derived from the original vibration signals are fed into the KNN classifier to recognize different operating conditions of bearings. The results demonstrated the feasibility and effectiveness of the proposed method for fault diagnosis of rolling bearings.
Footnotes
Declaration of conflicting interests
The author(s) declared no potential conflicts of interest with respect to the research, authorship, and/or publication of this article.
Funding
The author(s) disclosed receipt of the following financial support for the research, authorship, and/or publication of this article: This research was supported by major project for technological innovation of Hubei Province of China (No. 2018AAA026), the Scientific Research Foundation for Doctoral Program of Hubei University of Technology (BSQD2017003), and the Natural Science Foundation of Hubei Province (No. 2019CFB326).