
Abstract
A modified and simplified oscillator device is designed and manufactured to investigate the effects of contact roughness and bolt arrangements on energy dissipation caused by joint damping. Three types of surface roughness and five different bolt arrangements are discussed. Identification of Iwan model based on experimental data is carried out. It is indicated that rough surface dissipates more energy than smooth one. Specimens with more bolts dissipate relatively more energy. When bolt number is consistent, the series type dissipates more energy than the parallel type. Experimental data show a good stability and accuracy of the proposed oscillator device. The identified Iwan model provides a good conformity with the reconstructed hysteresis loop. The four-parameter Iwan model can well describe the damping property of joints with different surface roughness and bolt arrangements.
1. Introduction
Complex structures in engineering practice are commonly assembled by a large number of jointing components. Recent investigations (Ames et al., 2009; Gaul and Schmidt, 2019; Xiao et al., 2014) have shown that micro- and macro-slipping will occur on contact interfaces of jointing components under external loads. These phenomena are responsible for nonlinear contact stiffness and structural damping (Bograd et al., 2011; Gaul and Nitsche, 2001). On the other hand, contact interfaces are also an important source of structural uncertainty (Mignolet et al., 2015). As the contact interfaces are tightened to each other, a direct experimental approach to observe their mechanical processes is often impractical. Therefore, indirect approaches (Ames et al., 2009) using whole joint-level specimens are applied.
Focusing on several types of joints applied in aerospace engineering, Ungar (1973) found that contact slipping caused by external loads is the main reason for joint damping. Hysteresis loop in force–displacement plane was initially applied to calculate dissipated energy of damping by Metherell and Diller (1968). Nonlinear variations of contact stiffness over applied force were also observed. A tangential harmonic oscillator was designed by Gaul and Lenz (1997) to provide sinusoidal excitations with various amplitudes on dumbbell device. The instrument was then deployed to carry out experimental research on jointed structures. Hysteresis loops under different applied loads were obtained. The big mass device (BMD) Ames et al. (2009) designed by Sandia National Laboratory was used in dynamic analysis of three different types of joints including “flat lap,” “stepped lap,” and “curved lap” joints. Power law relationships of energy dissipations versus applied loads were observed, which varied from 2.4 to 3.0. To obtain a precise and reliable description of the transition between micro- and macro-slip, quasi-static experiments of eight different preloads were carried out by Resor and Starr (2008). It showed that tangential contact stiffness during micro-slip stage tended to be linear. Initiation of macro-slip was observed at a length scale of 10−6 m. Hysteresis loops of aluminum and steel joints under different preloads were obtained by Eriten et al. (2011a, 2011b, 2012) from their quasi-static and dynamic experiments. It is indicated that aluminum joints generally dissipated more energy than steel joints.
Different approaches of constitutive modeling for jointed structures are also carried out (Ahmadian and Rajaei, 2014; Li et al., 2019a, 2019b; Miller and Dane Quinn, 2009; Oldfield et al., 2005; Quinn and Segalman, 2005; Rajaei and Ahmadian, 2014; Segalman and Starr, 2008; Wang et al., 2018). These approaches can be generally concluded as two types: (1) a top-down, phenomenological modeling and (2) a bottom-up, physical-based modeling. Examples of the first approach are Segalman’s (2002) four-parameter Iwan model, Song et al.’s (2004) adjusted Iwan model, and the six-parameter Iwan model (Li and Hao, 2016; Li et al., 2017). In the other type of modeling, rough contact theories at micro- or nanoscale are directly applied to establish the constitutive relationship (Argatov and Butcher, 2011). Based on the rough contact theory and zero thickness element (ZTE), a multi-scale constitutive model for contact interface of jointed structures was developed by Balaji et al. (2020). Considering multi-asperity contact and fractal contact theory, Zhang et al. (2019) proposed a multi-scale model for uneven contact interfaces of joints.
Among those modeling approaches, Iwan-type model is widely applied. Identification of Iwan model depends on precise experimental data of jointed structures. Quasi-static experimental investigations (Ames et al., 2009; Eriten et al., 2012; Resor and Starr, 2008; Xu et al., 2020) indicate a weak nonlinearity of contact stiffness during micro-slip stage, which is relatively difficult to capture. Therefore, measuring joint damping through dynamic experiments is often considered. A systematic experimental research by Ames et al. (2009) shows that the BMD is efficient to capture joint damping. A detailed introduction about energy dissipation caused by frictional contacts is given and different joint types and preloads are specifically discussed.
In this article, the BMD device is modified and simplified to an oscillator to measure energy dissipation caused by joint damping is designed and manufactured. Effects of contact roughness and bolt arrangements on energy dissipation are discussed. A calculation formula of energy dissipation represented by equivalent viscous damping is derived in Section 2. An introduction of the oscillator device and its finite element method (FEM) modal analysis is given in Section 3. Detailed experimental procedures are shown in Section 4. Experimental results under different conditions are provided in Section 5. Identifications of Iwan model based on experimental results are carried out in Section 6. Summary and conclusions of this article are given in Section 7.
2. Energy dissipation of equivalent viscous damping
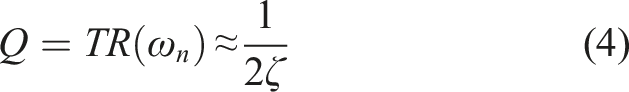
Initiation of macro-slip was observed at a length scale of 10−6 m according to quasi-static experiments of jointed structures (Ames et al., 2009; Resor and Starr, 2008). If hysteresis loops of force displacement relationship were obtained directly in a quasi-static way, the data of interest might be swamped by instrumental measurement errors or noises. The Sandia National Laboratory developed a dynamic experimental device (Ames et al., 2009) to study nonlinear damping properties of joints. Experimental data of high precision were obtained. Inspired by their experimental device, an single degree-of-Freedom (SDOF) oscillator as illustrated in Figure 1 is considered and designed in this study. In Figure 1, A
m
(t) and A
b
(t) represent accelerations of the mass and the base, respectively. An equivalent viscous damping c
eq
is considered to represent structural damping caused by contact friction of joint interfaces. Stiffness of the joint is represented by k. For the proposed SDOF system, energy dissipation of the equivalent viscous damping, ΔE, can be calculated as the integral form of a closed trajectory in phase plane, which can be given as Scheme of a base-excited single degree-of-Freedom oscillator.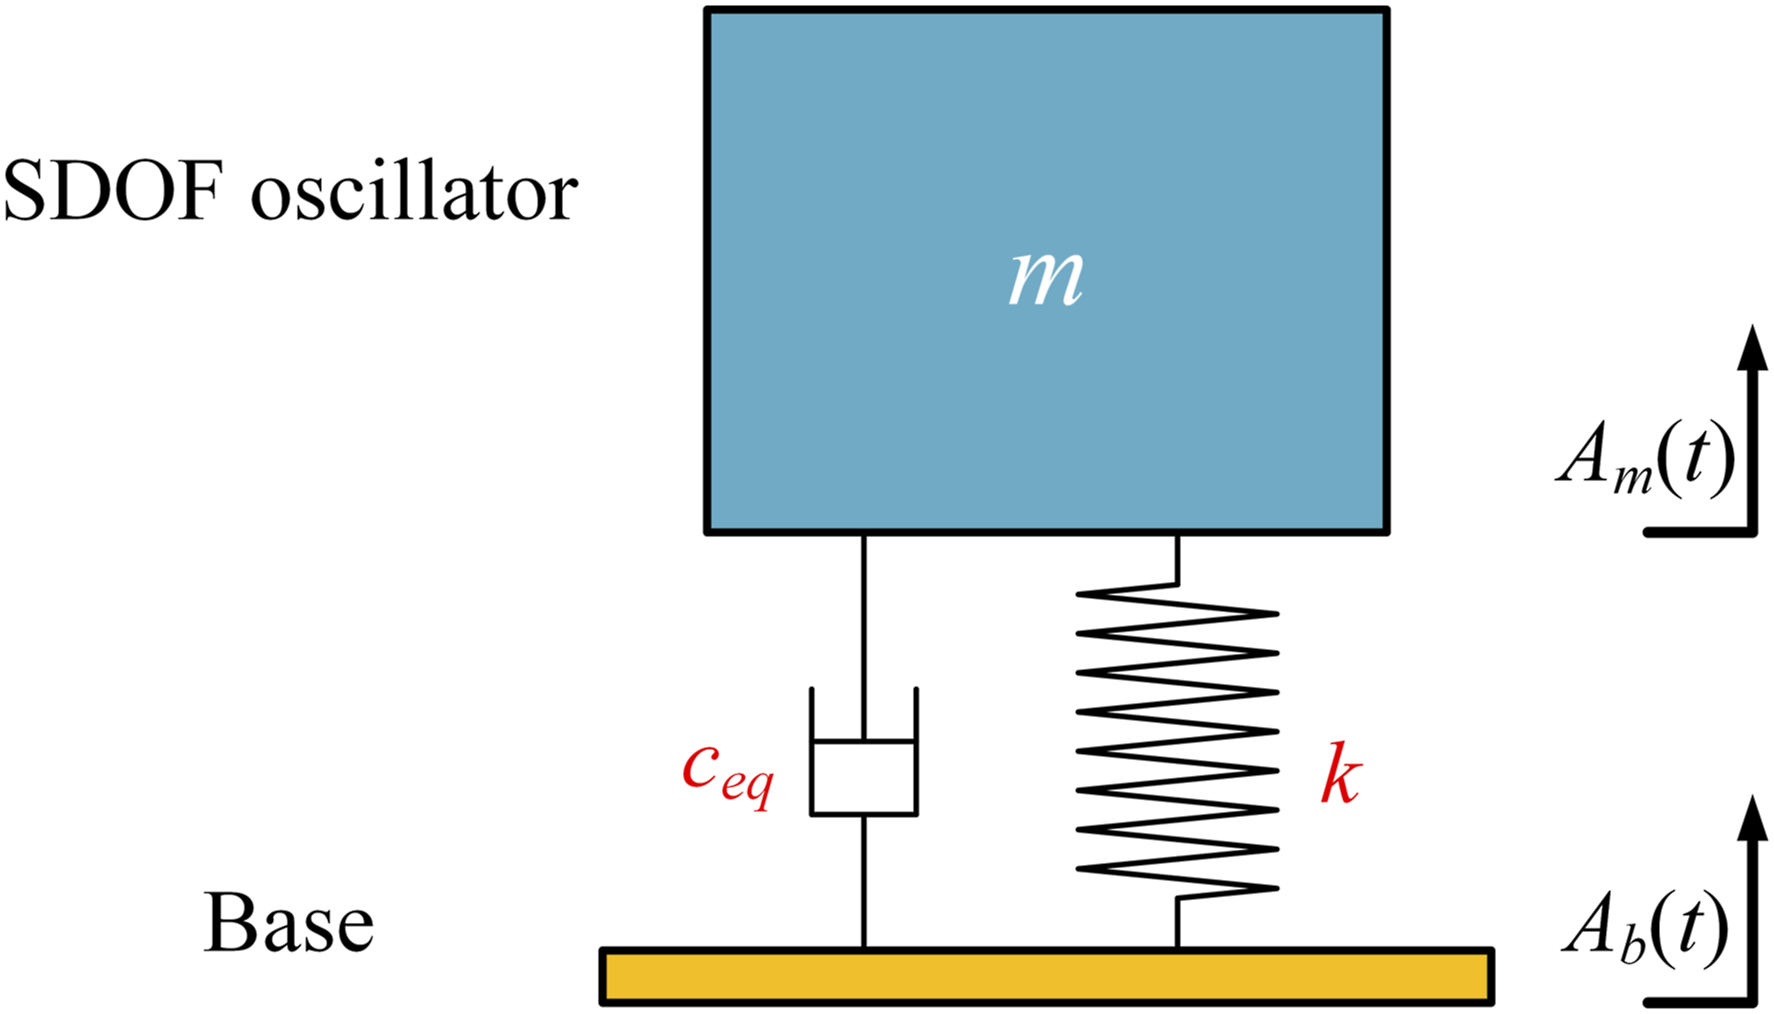
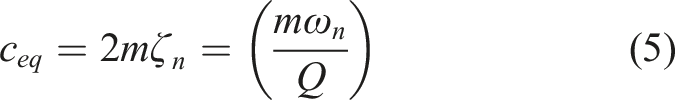
As for a base-excited SDOF oscillator, the ratio of its motion amplitude to that of the base is called the transmissibility, or TR. It can be written as
Therefore, the equivalent viscous damping c
eq
can be derived as
As the quality factor Q can be measured as Q = A
m
/A
b
, substitution of equation (5) into (2) yields
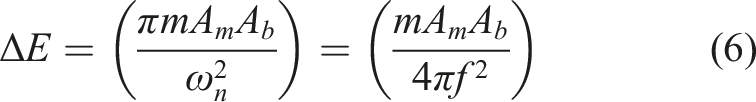
All physical quantities in equation (6) can be determined directly from dynamic testing using the proposed SDOF oscillator. The mass of the oscillator, m, can be measured before testing. A m and A b can be obtained as the acceleration amplitudes of the mass and the base, respectively. For safety and controllability reasons, the chosen excitation frequency f in this experiment is slightly lower than the determined resonant frequency.
3. Design and FEM analysis
The oscillator device in this article is made of 45# Steel. Its dimensions are shown in Figure 2. A centering slot (30.5 mm in wide and 2 mm in deep) is machined at the bottom of the device to locate joint specimens. A groove (190 mm in deep and 30 mm in diameter) is located along the central axis of the device. When the upper piece of the specimen pair is placed in the centering slot, an M8 bolt is then applied to tighten it with the oscillator using a T-type wrench through the groove. Note that the holes of 6 mm are prepared for later tests with flat lap joints. Their preloads are applied by a pair of rollers and two tensioning cables passing through these holes. Dimensions of the oscillator, unit in mm.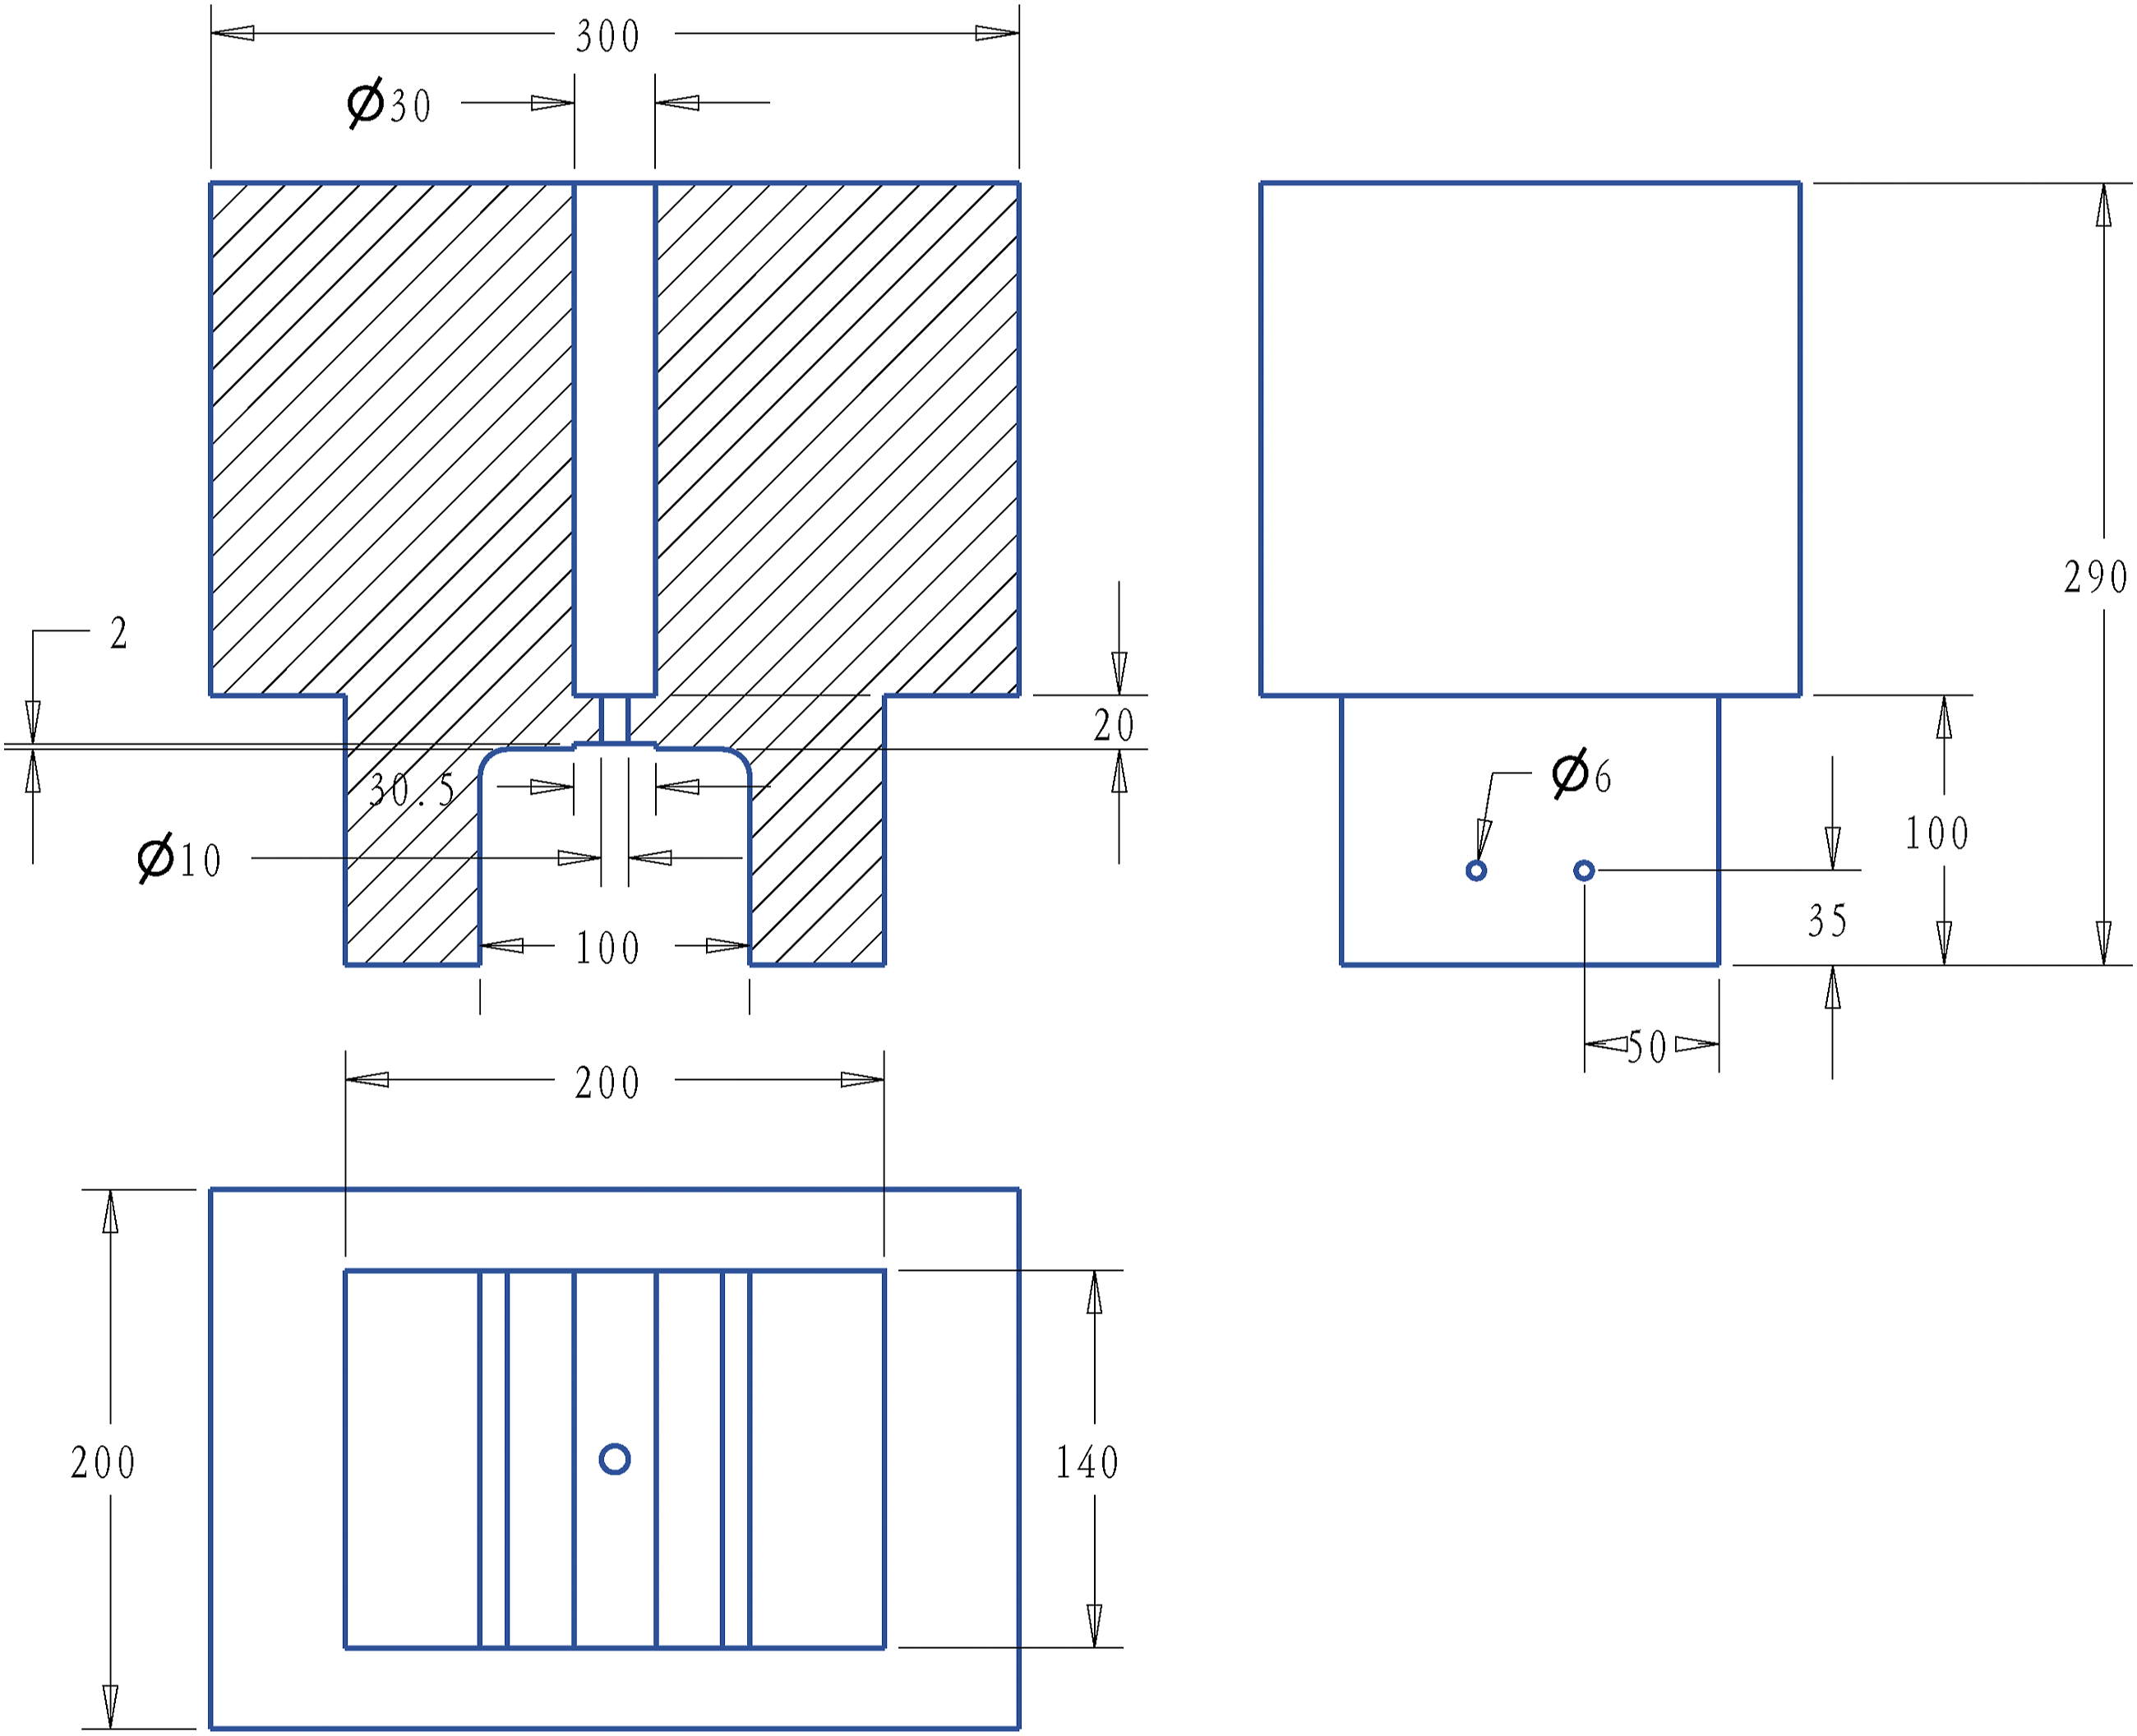
Before the oscillator has been manufactured, a simplified finite element model is established in Abaqus to investigate its dynamical properties. As 45# steel is applied, density of the model is considered as 7.85 × 10³ kg/m3. Young’s modulus is set as 210 GPa and Poisson’s ratio is set as 0.33. Contact interfaces between two specimen pairs and the oscillator are neglected. These interfaces are simplified into binding constraints. Bolts, nuts, washers, and other properties with relatively small size are also neglected. The established FEM model as plotted in Figure 3 contains 24,813 brick elements in total. Meshing of the finite element Method model.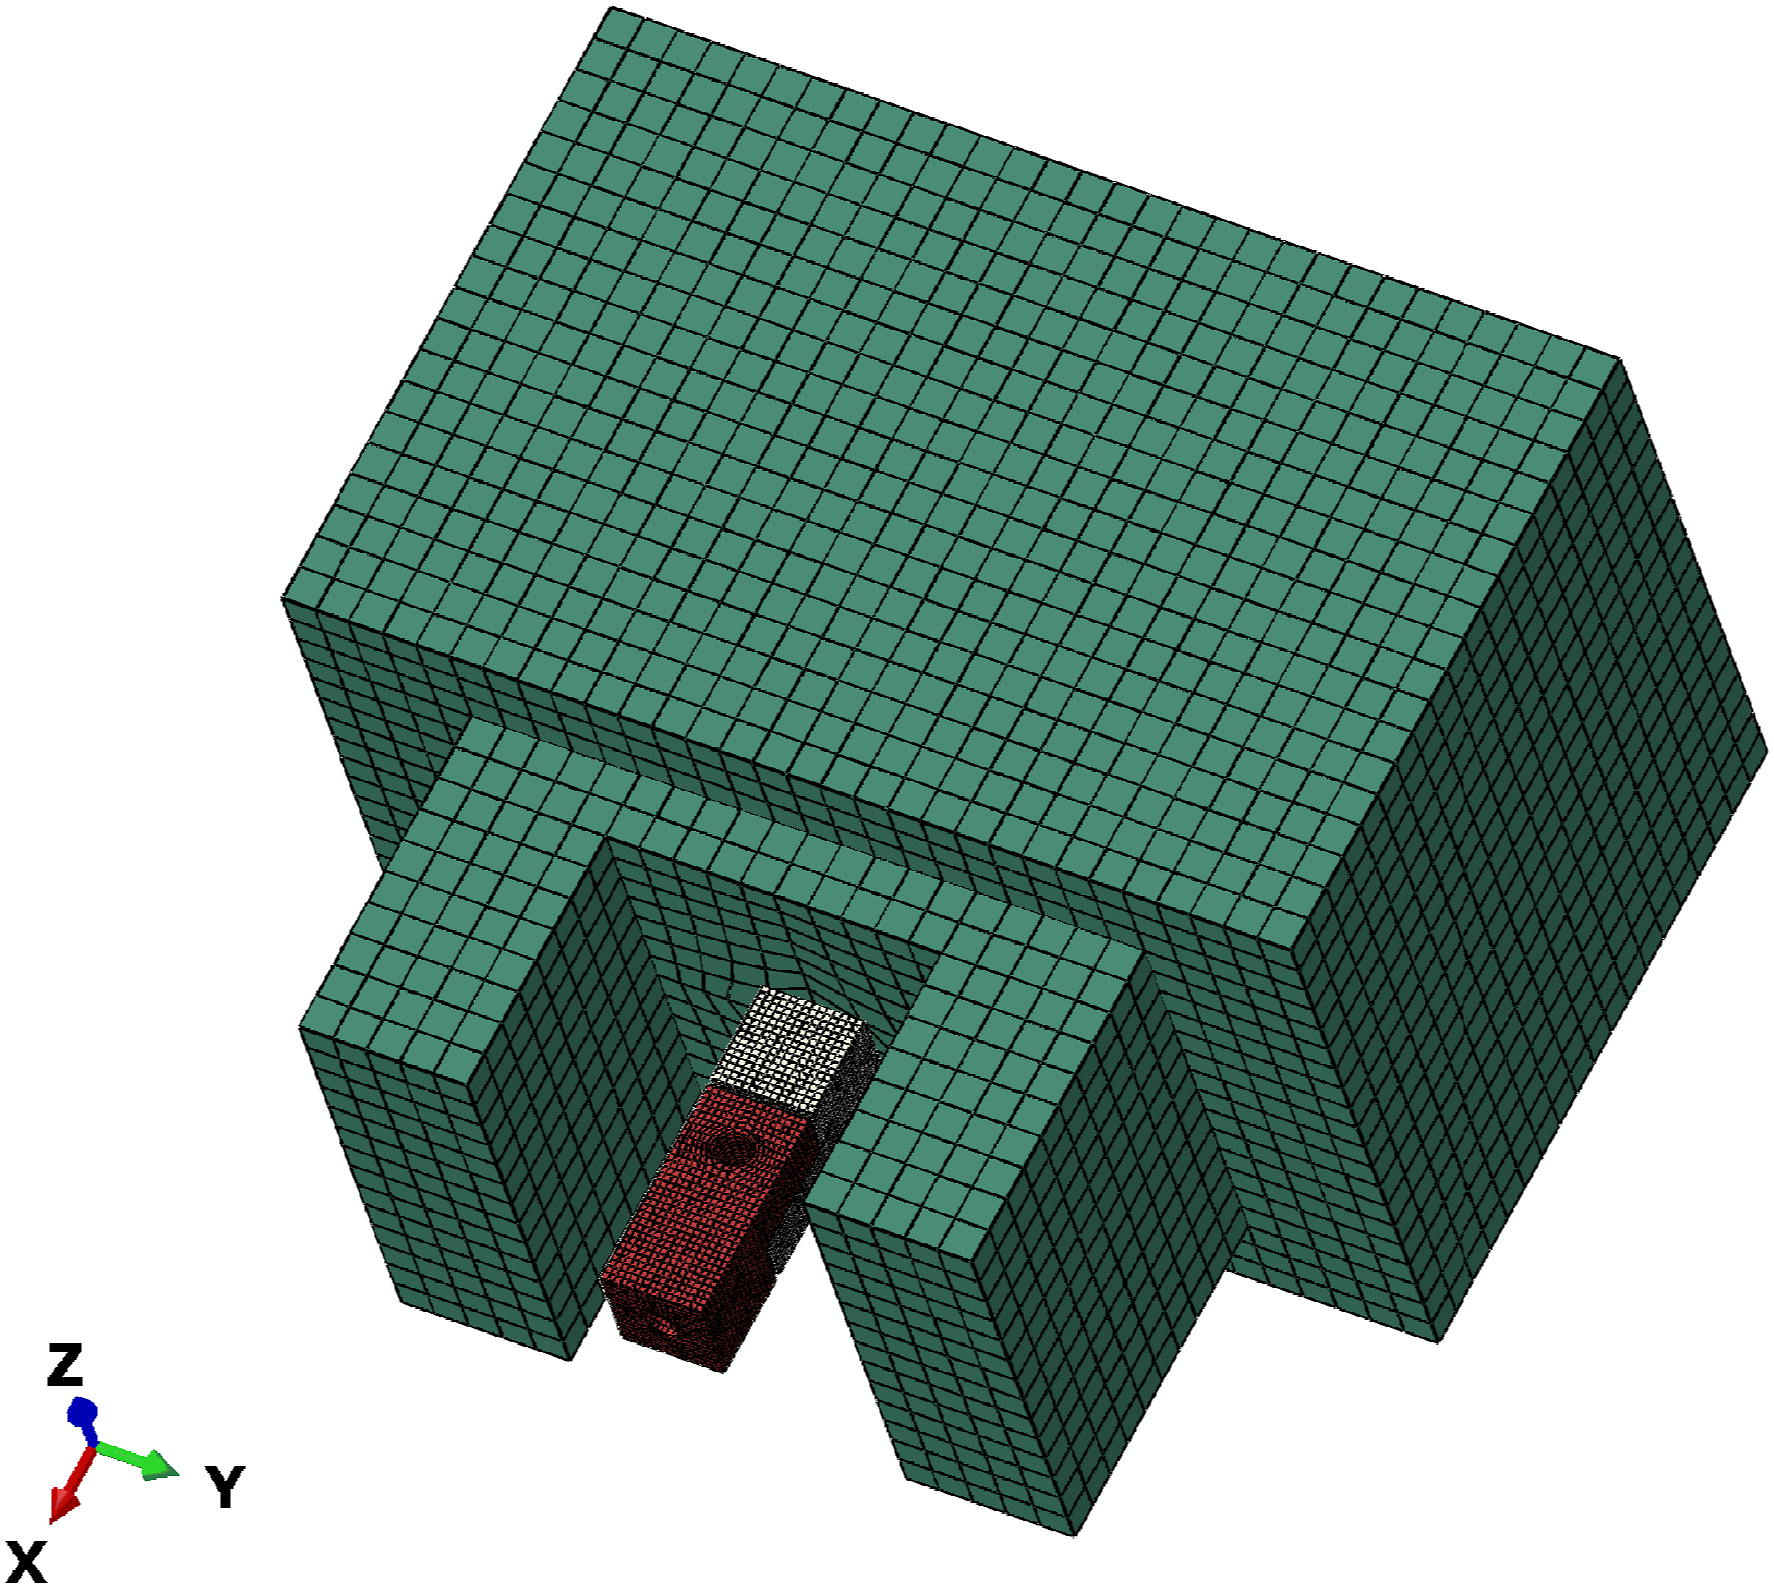
The first six modes and their corresponding frequencies of the oscillator system are obtained from modal analysis as pictured in Figure 4. Mode 1 (18.8 Hz) and Mode 2 (25.8 Hz) seem to be a pair of orthogonal bending modes. The difference in their natural frequencies is resulted by asymmetries of the single bolt specimen. The first two modes have the ability to excite the interface to bend in xz and zy planes. Unlike the responses of dumbbell device (Ames et al., 2009), a torsional mode is observed at 36 Hz. Generally, a torsional mode of dumbbell device is not easily excited by axial inputs. Tangential deformations are observed in Mode 4 and Mode 5 at the frequency of 242.8 Hz and 251 Hz, respectively. These two modes provide the most valuable response for an x-axis input, which is mainly concerned in this study. Beyond the first five modes, a significantly high frequency of 442.9 Hz is obtained as Mode 6 with a high-order, local deformation at the joint specimen. According to the simplified simulation described above, the driving frequency of interest should be around 240–250 Hz. It is sufficiently far from any other structure modes, which assures that testing of the SDOF oscillator is as straightforward as possible, with little influence by other adjacent modes. Mode 1–6 of the oscillator device.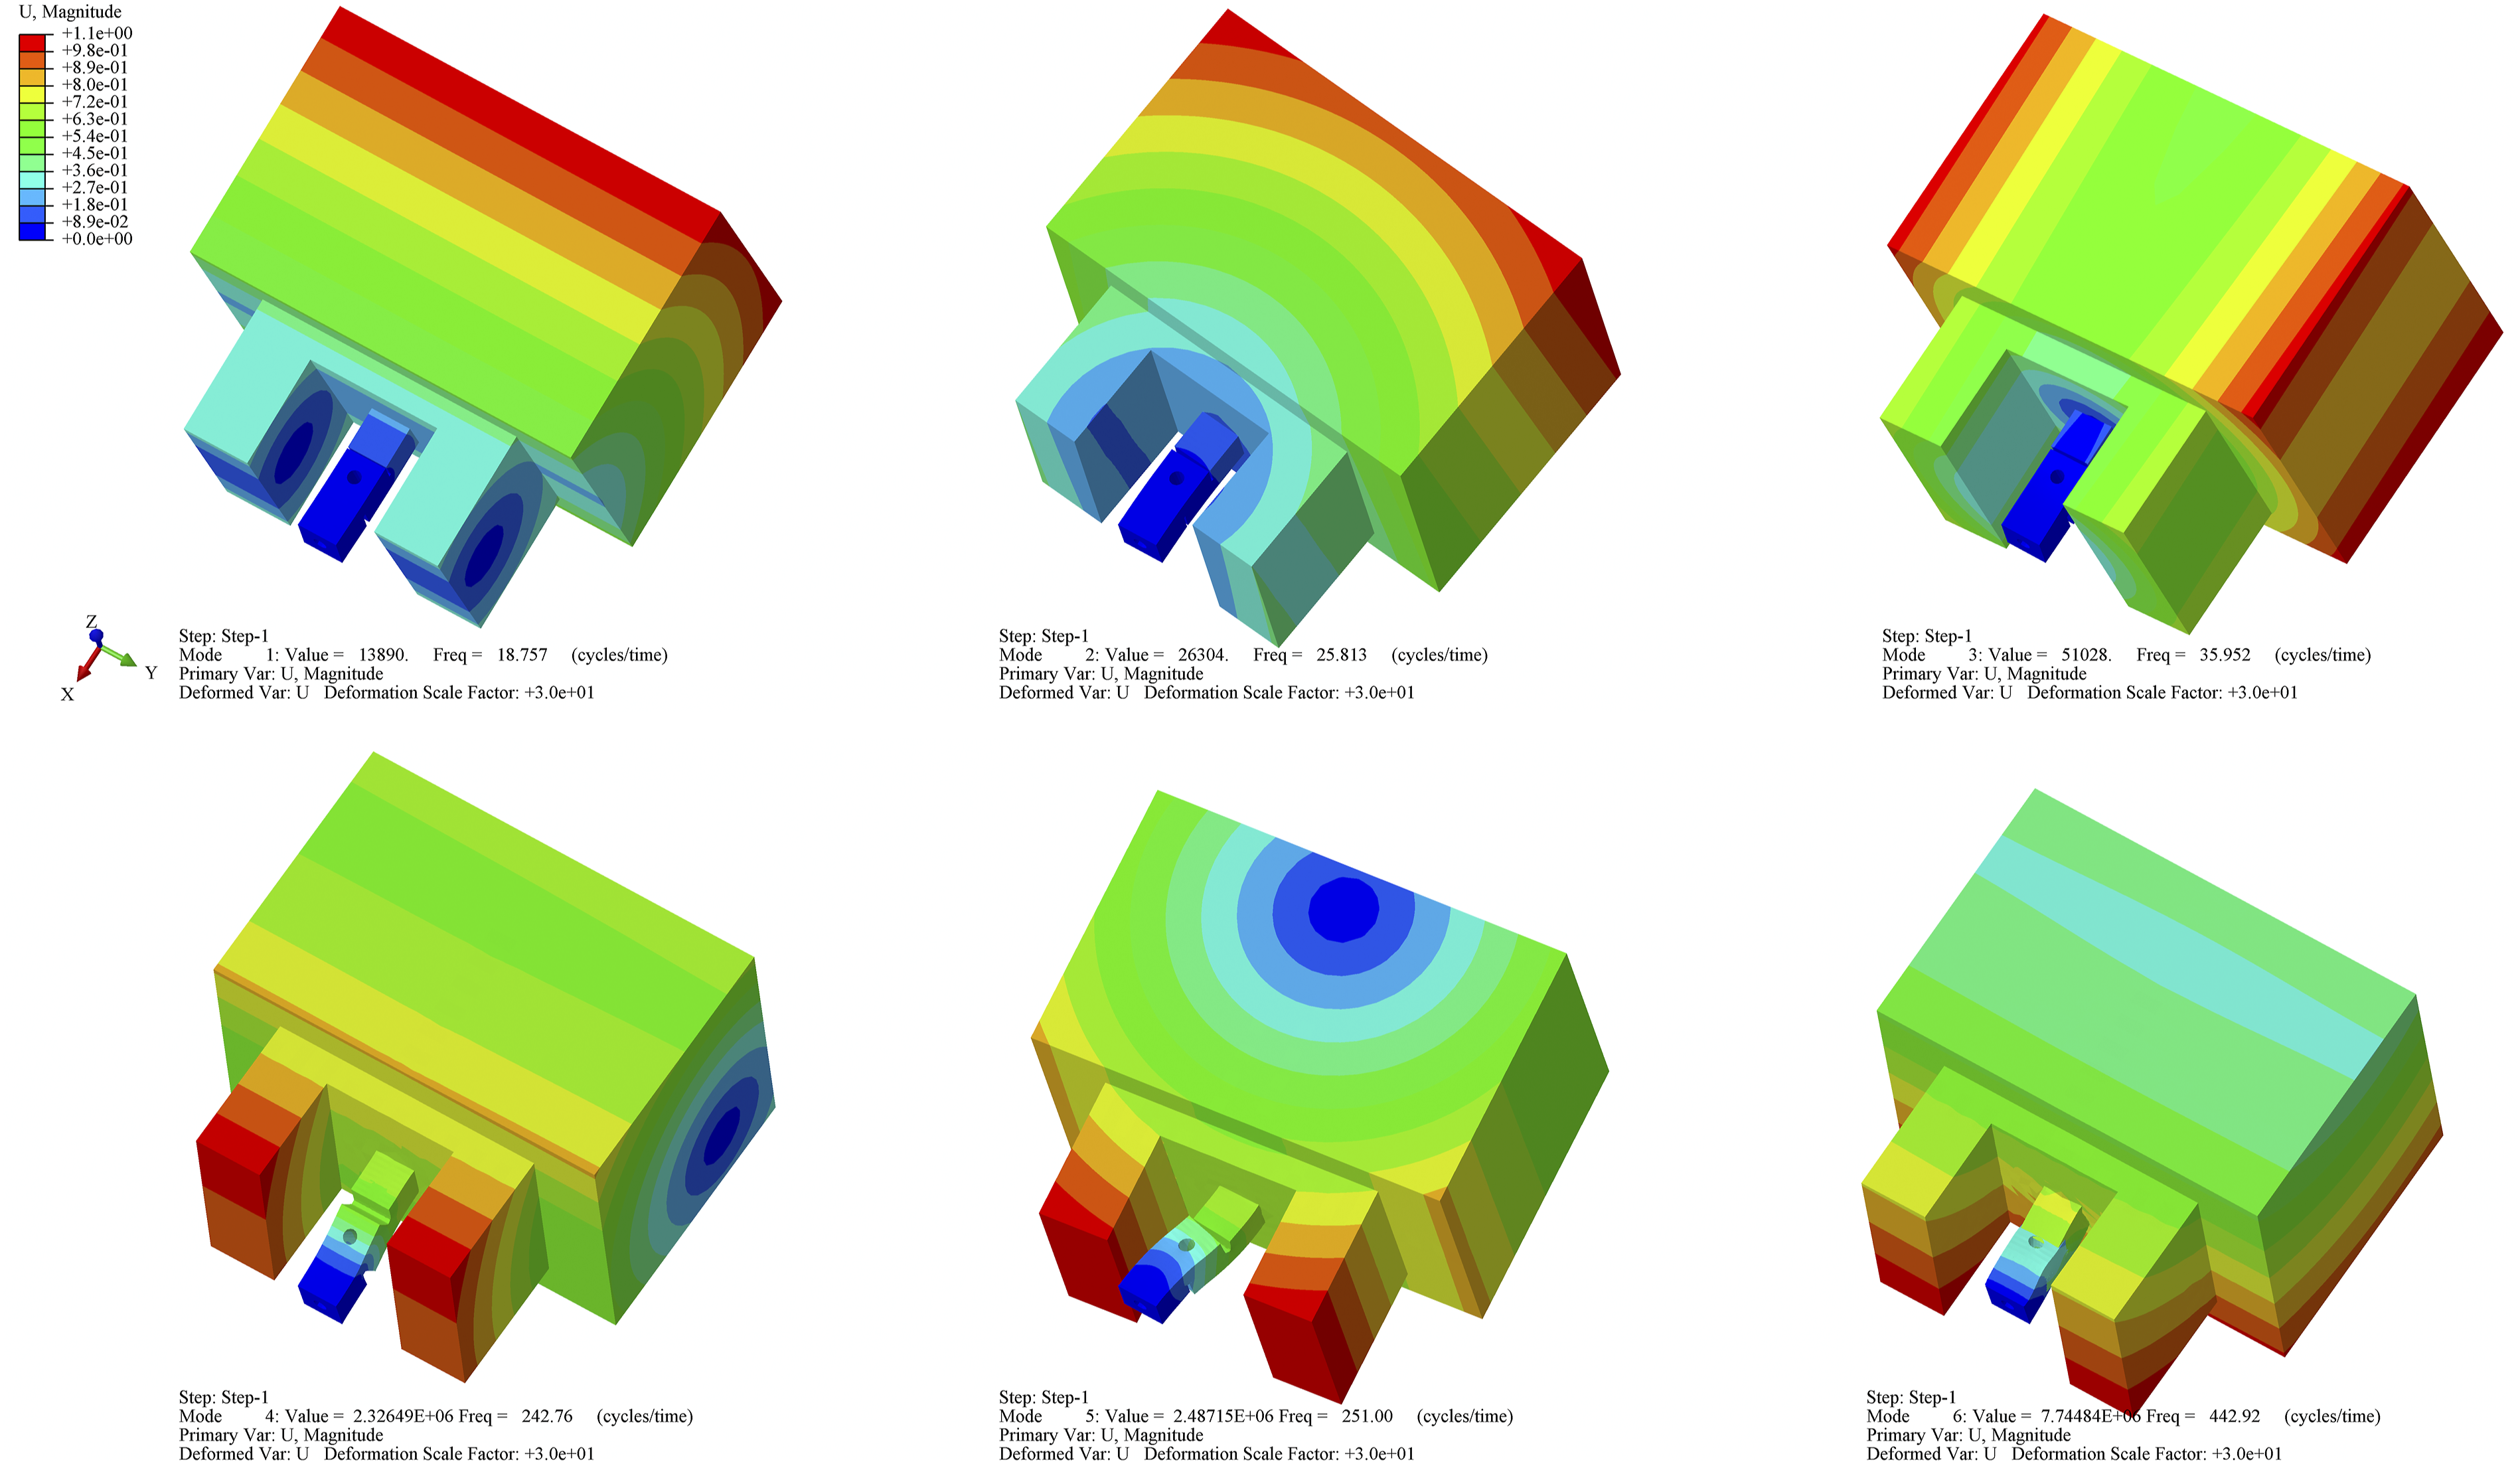
4. Experimental procedures
Joint specimens are made of 45# steel. They are carefully cleaned with compressed air and alcohol before testing. The lower piece of the specimen pair is tightened to a fixture using an M8 bolt. Then, the fixture is tightened on an electrodynamic shaker. When the upper piece of the specimen pair is placed in the centering slot, an M8 bolt is applied to tighten it with the oscillator using a T-type wrench through the machined groove. The oscillator device is then lowered over the specimen attached to the fixture by a crane and rubber wires. Adjustments are performed to make the contact interfaces of the two specimen pieces overlap with each other. When the desired position is achieved, a set of bolt, nut, and washers is applied to tighten the two pieces. A bolt preload of 24 Nm is applied using a digital torque wrench. Three uniaxial acceleration sensors are located at the fixture, the lower, and the upper piece specimen, respectively. They are arranged along the central axis of the shaker to ensure the accuracy of the experiment.
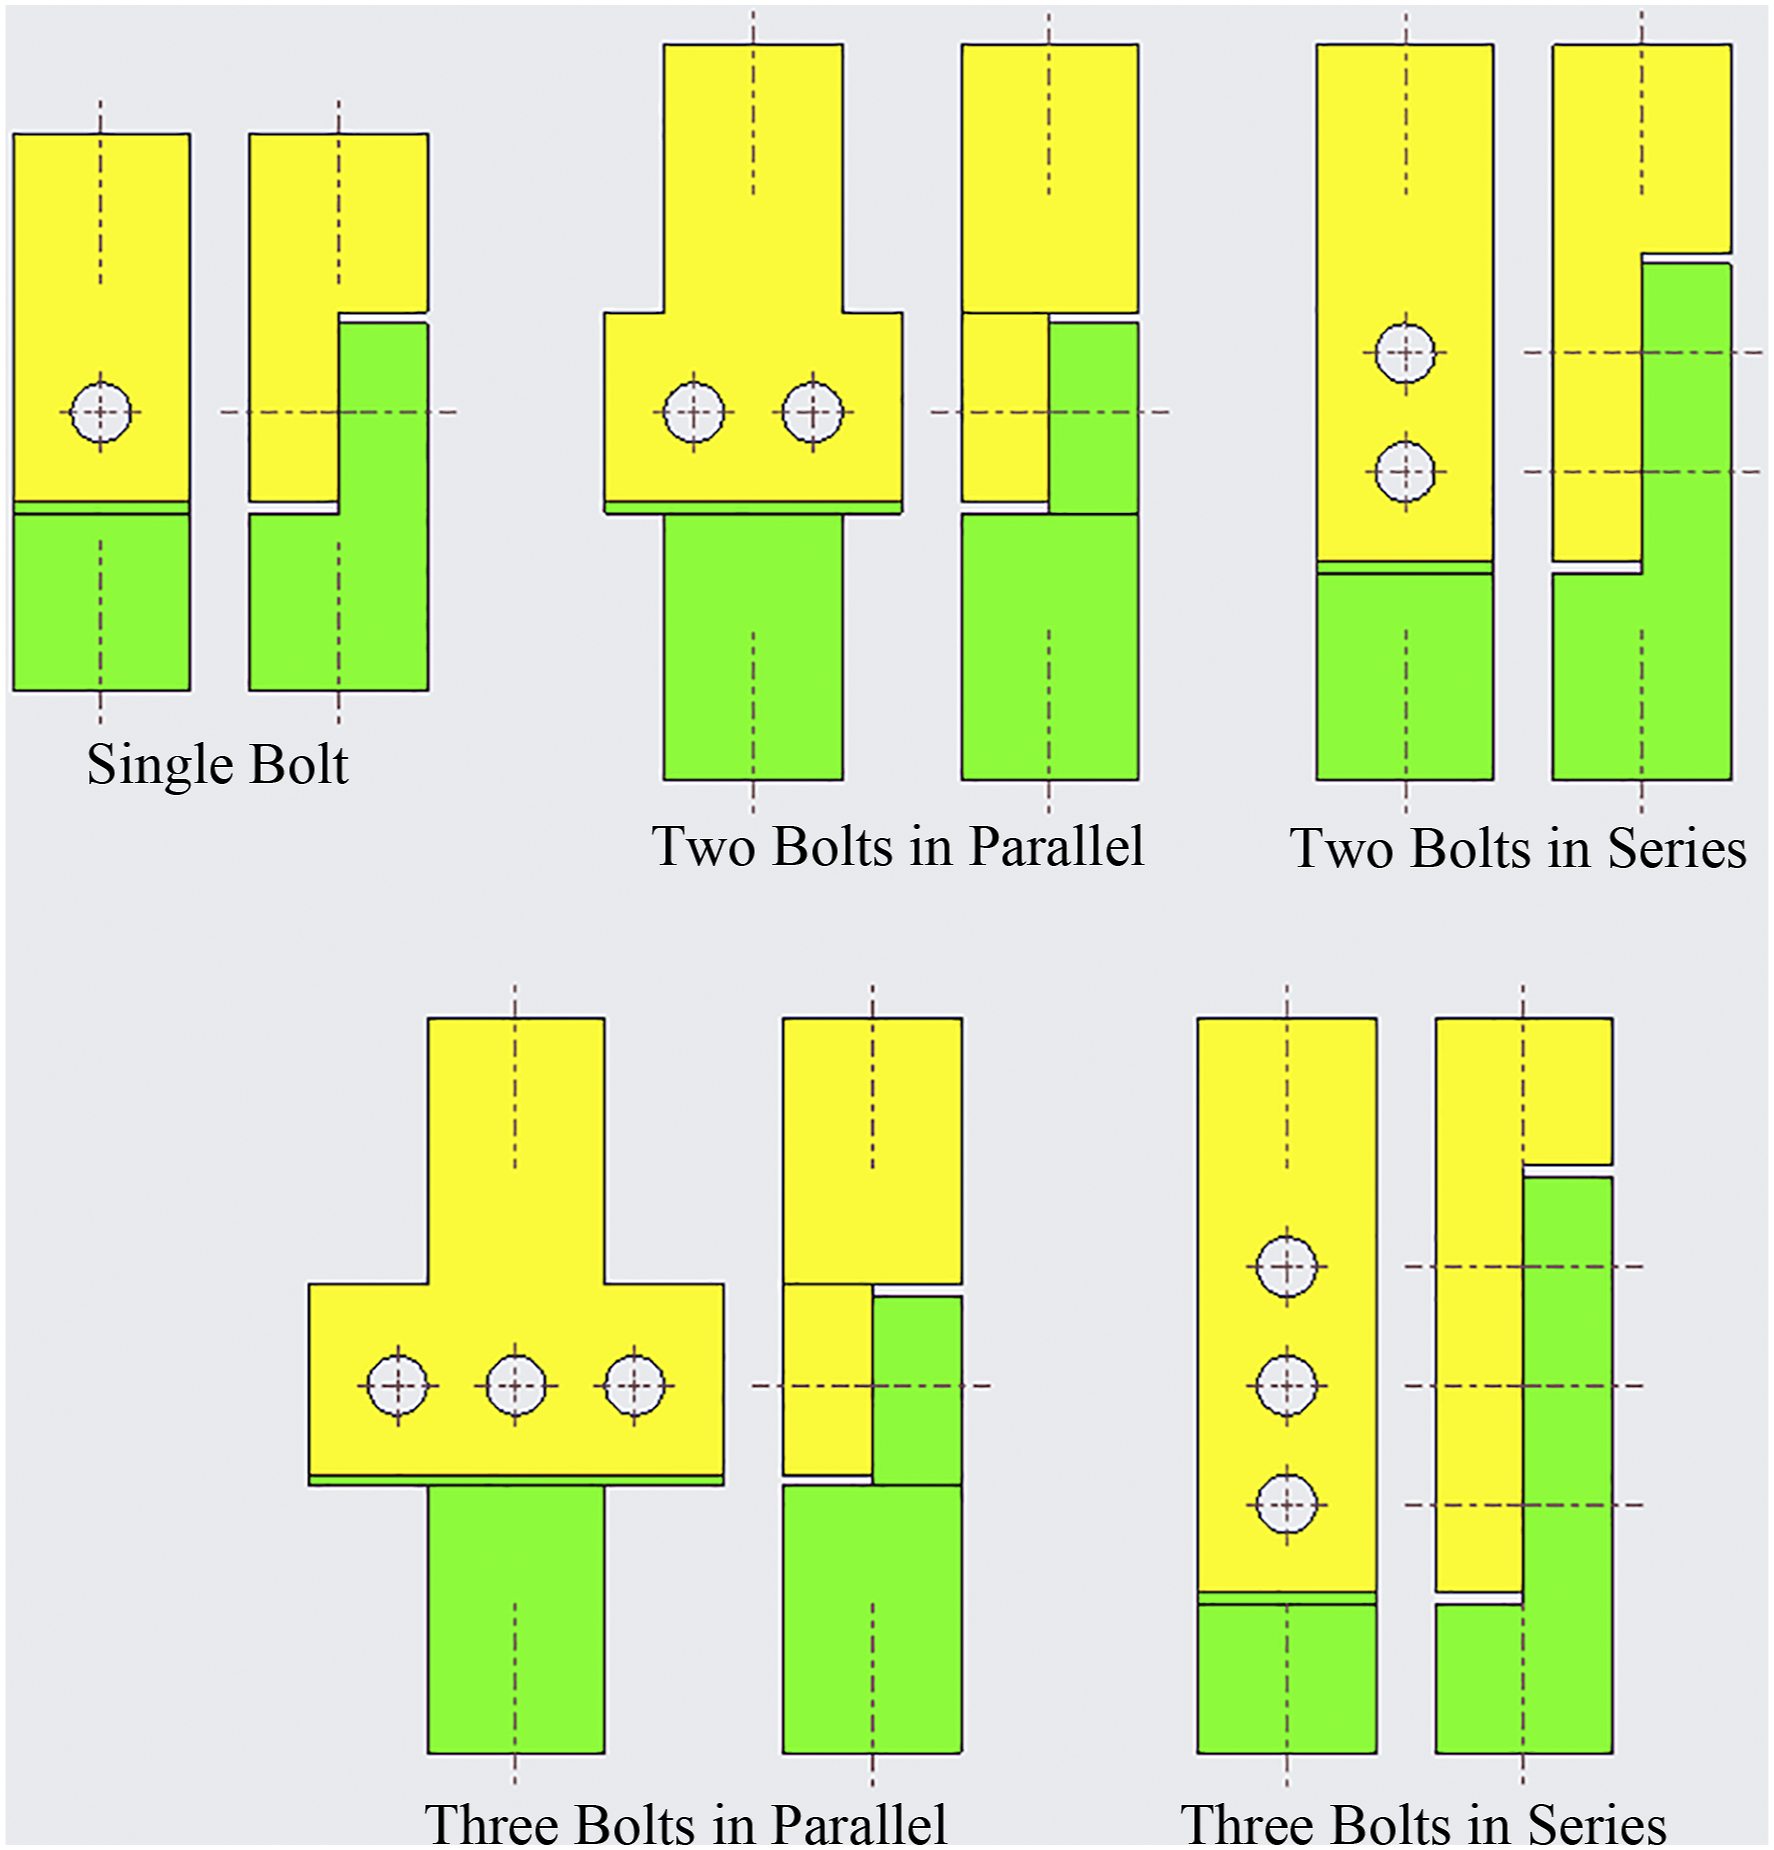
Effects of contact roughness and bolt arrangements on energy dissipation are discussed in this article. Five different arrangements are designed as single bolt, two bolts in series, two bolts in parallel, three bolts in series, and three bolts in parallel. The single bolt specimen is designed with three different contact roughness as smooth, medium, and rough. To verify the repeatability, three identical pairs of specimens are considered for each set. The proposed oscillator device and experiment specimen are shown in Figure 5. Conditions of each set are given in Table 1. A schematic showing both the upper and lower pieces of the specimens are given in Figure 6. (a) The oscillator device with single bolt specimens from the front and back view, respectively. (b) Two bolts and three bolts specimens. (c) A sketch of the complete setup. (d) Detailed dimensions of the specimens. Experiment sets. The upper and lower pieces of specimens.
For each experiment set, sinusoidal sweeps with different amplitudes (0.1–1.2 g) are performed to determine the corresponding resonant frequencies. According to the simulated modal results in Section 3, the sweep range is considered as 100–1000 Hz. Logarithm sweeping of 1 otc/min is applied. When the resonant frequency is obtained, a fixed-frequency excitation can be performed. It should be noted that for safety and controllability reasons, the chosen excitation frequency is slightly lower than the obtained resonant frequency. When a steady state is achieved, the peak value of each acceleration sensor is recorded.
Taking Set 7 (3 bolts in parallel), for example, the acceleration–time curves of sinusoidal sweep, 0.1 g, is plotted in Figure 7. A
c
represents the acceleration of control point on the fixture, A
b
the base, and A
m
the mass. A pre-sweep is carried out at the first 20 s to check the experimental facilities. If no errors were reported during pre-sweep, a sweep from 100 to 1000 Hz then begins. Readings of the three acceleration sensors hardly change with the increase of loading frequency during the first 90 s. The readings increase sharply after 100 s. A peak point is observed around 110 s. Acceleration amplitude of the control point reaches 6 g. Acceleration amplitude of the base reaches 5.8 g and that of the mass reaches 3.5 g. The resonant frequency is determined as 273 Hz. A duration of 0.02 s was intercepted in two different stages. From 25 s to 25.02 s, readings of the three sensors are nearly the same as the input value, 0.1 g, with obvious high-frequency noises. From 106.93 s to 106.95 s, obvious deviation can be observed. The reading of A
m
reaches 1.3 g, which is 13 times of the input value. The curve is smooth and appears to be a linear response. A
b
can be characterized as multi-harmonic. These phenomena agree with the observations by Ames et al. (2009). Results of sinusoidal sweep of Set 7, 0.1 g.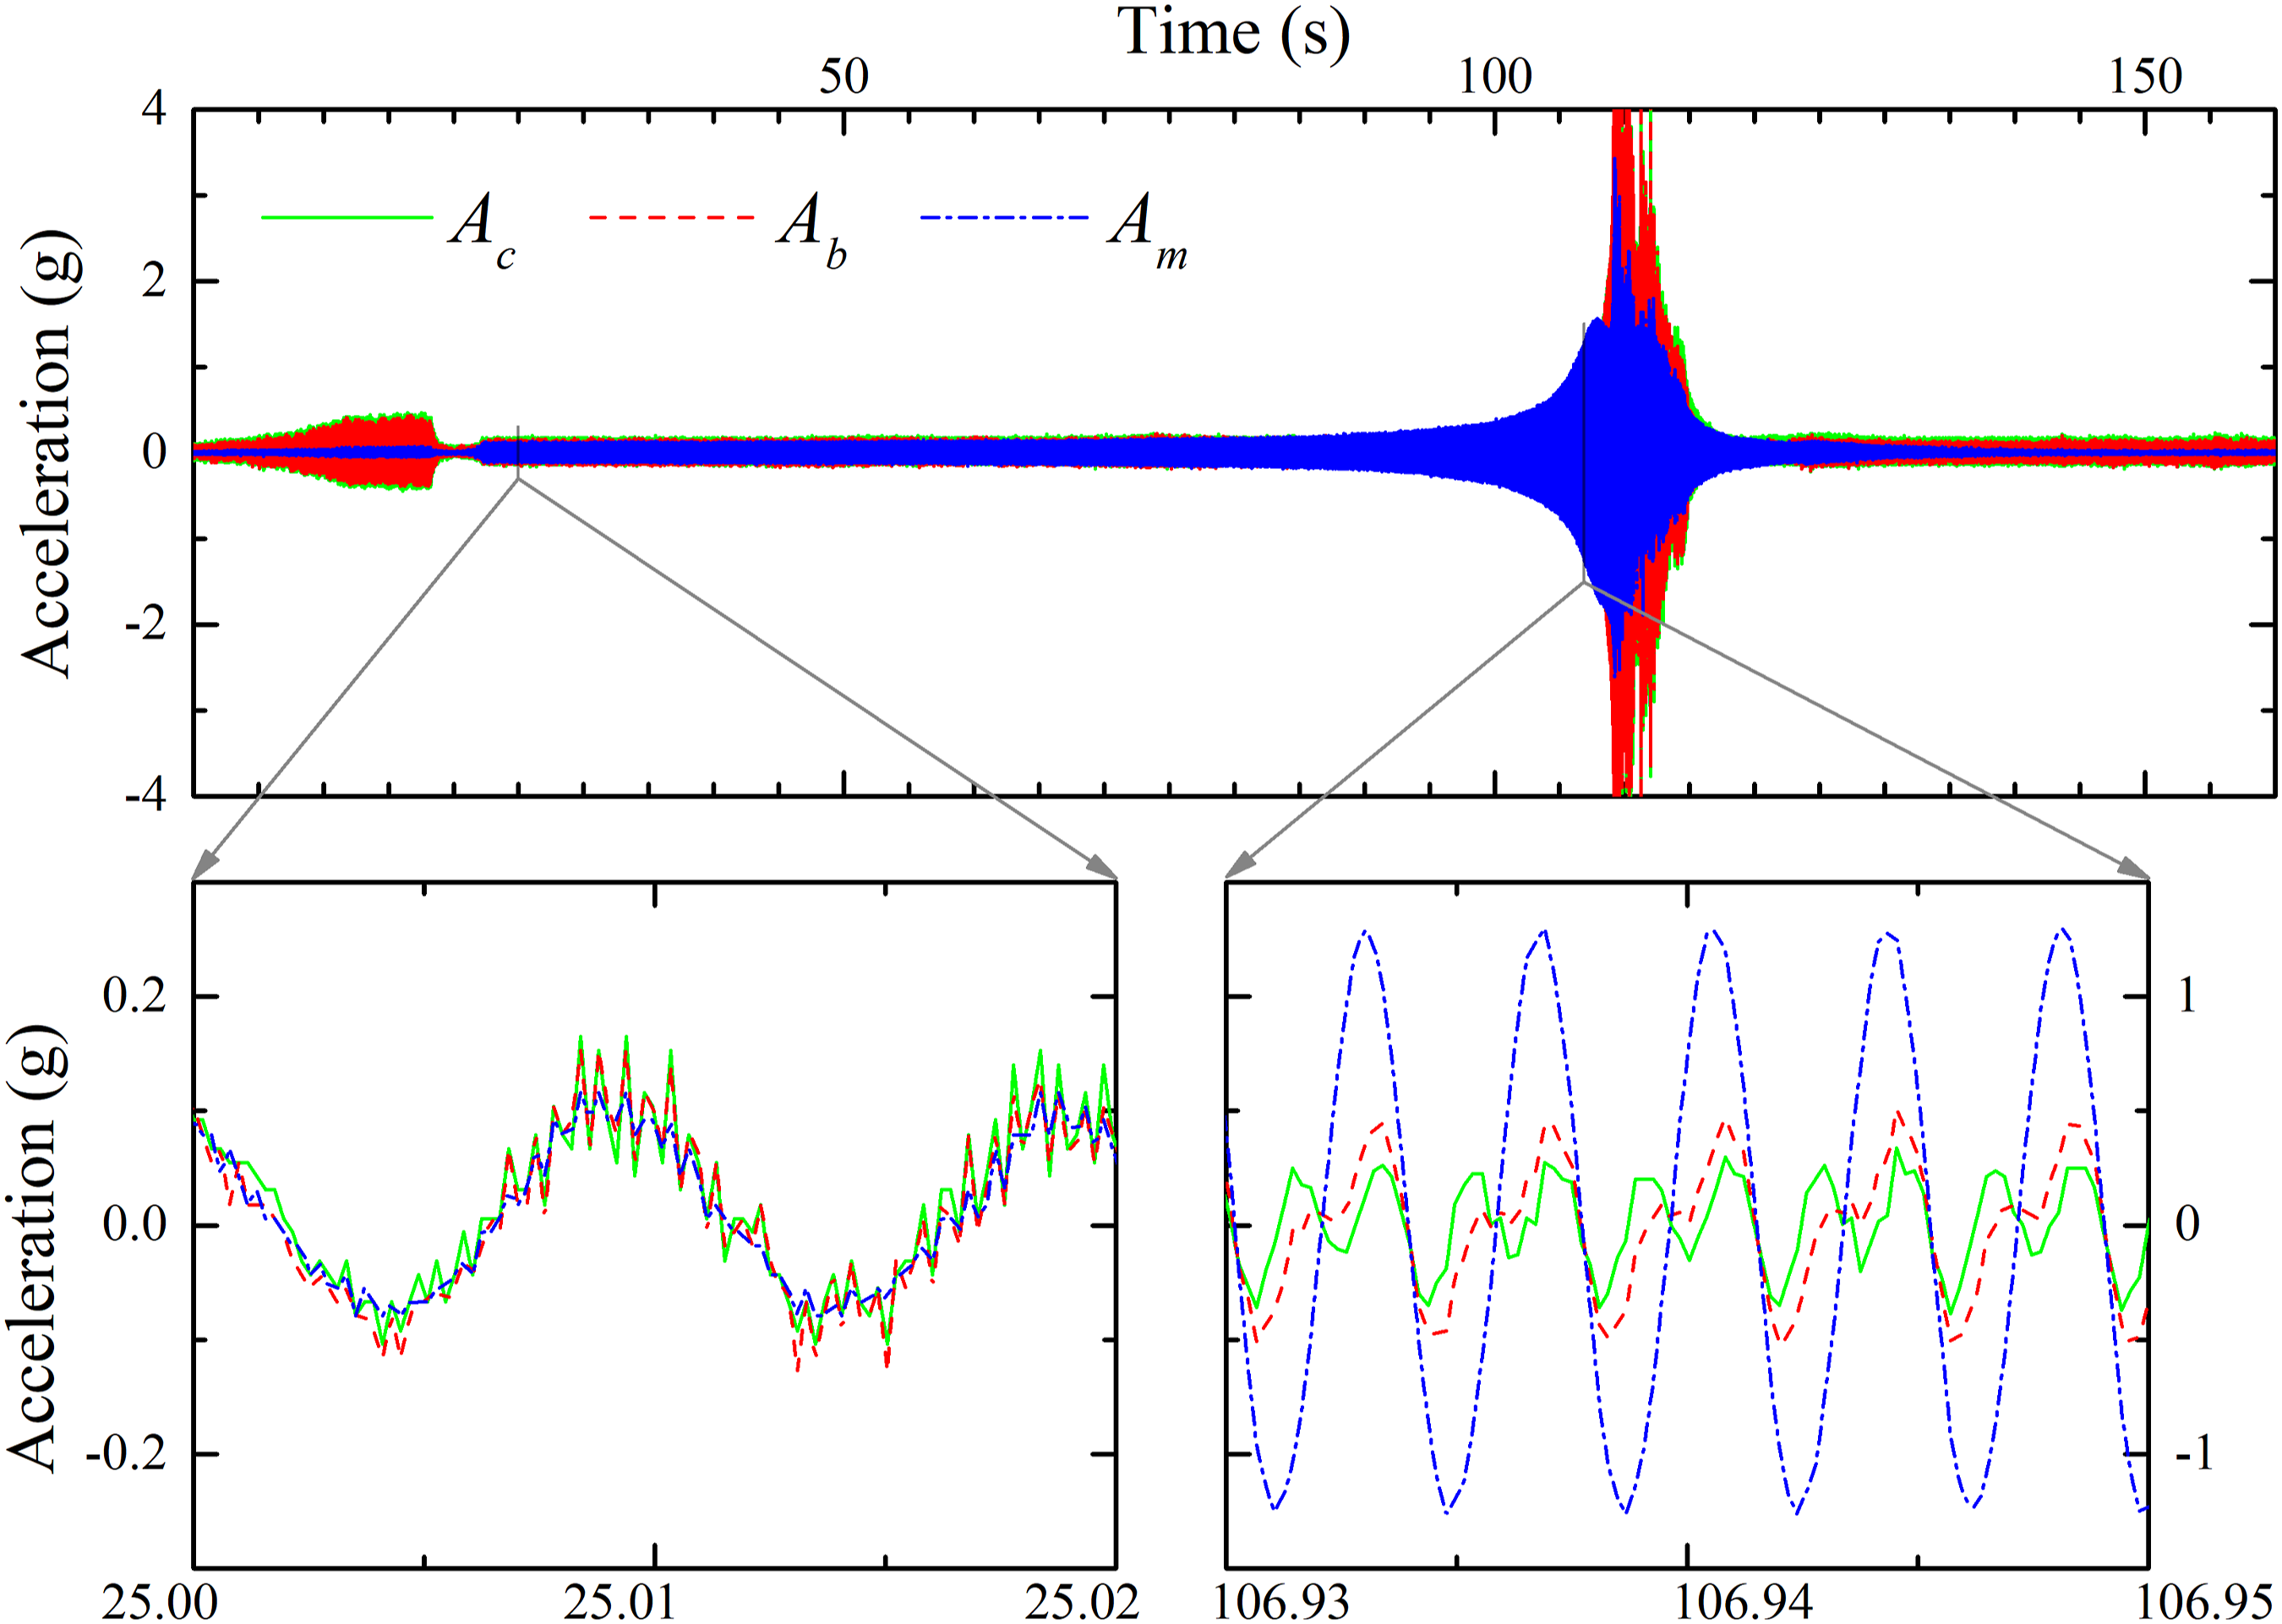
5. Experimental results
5.1. Influence of surface roughness
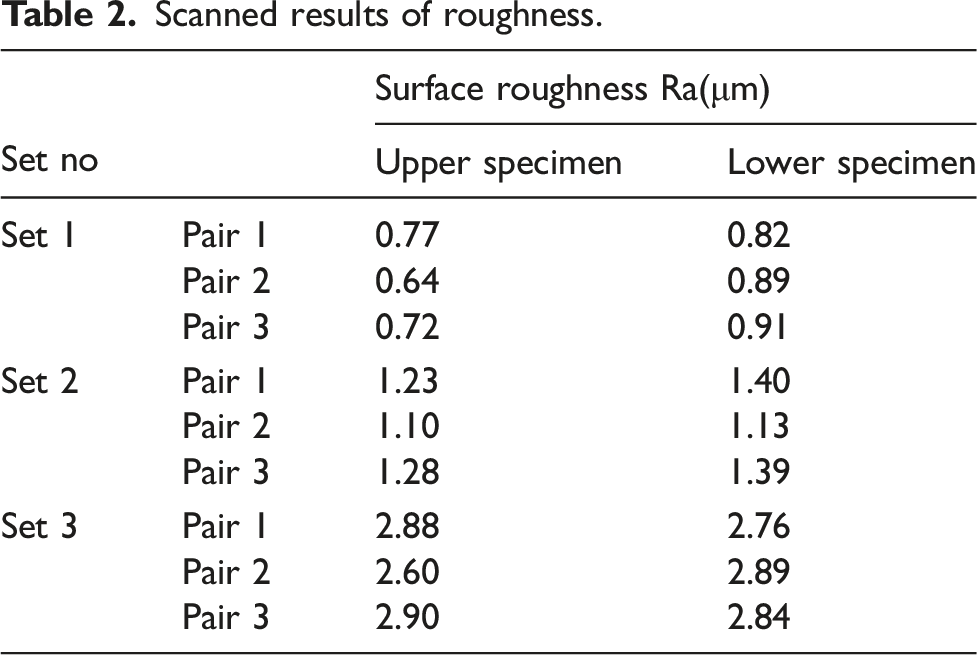
Three different kinds of roughness are considered as smooth, medium, and rough. Surfaces of the specimens are scanned with a range of 500 μm along the direction of relative motion using a 3D profilometer, as illustrated in Figure 8. The tested roughness is shown in Table 2. Scanned results of roughness. Scanned results of roughness.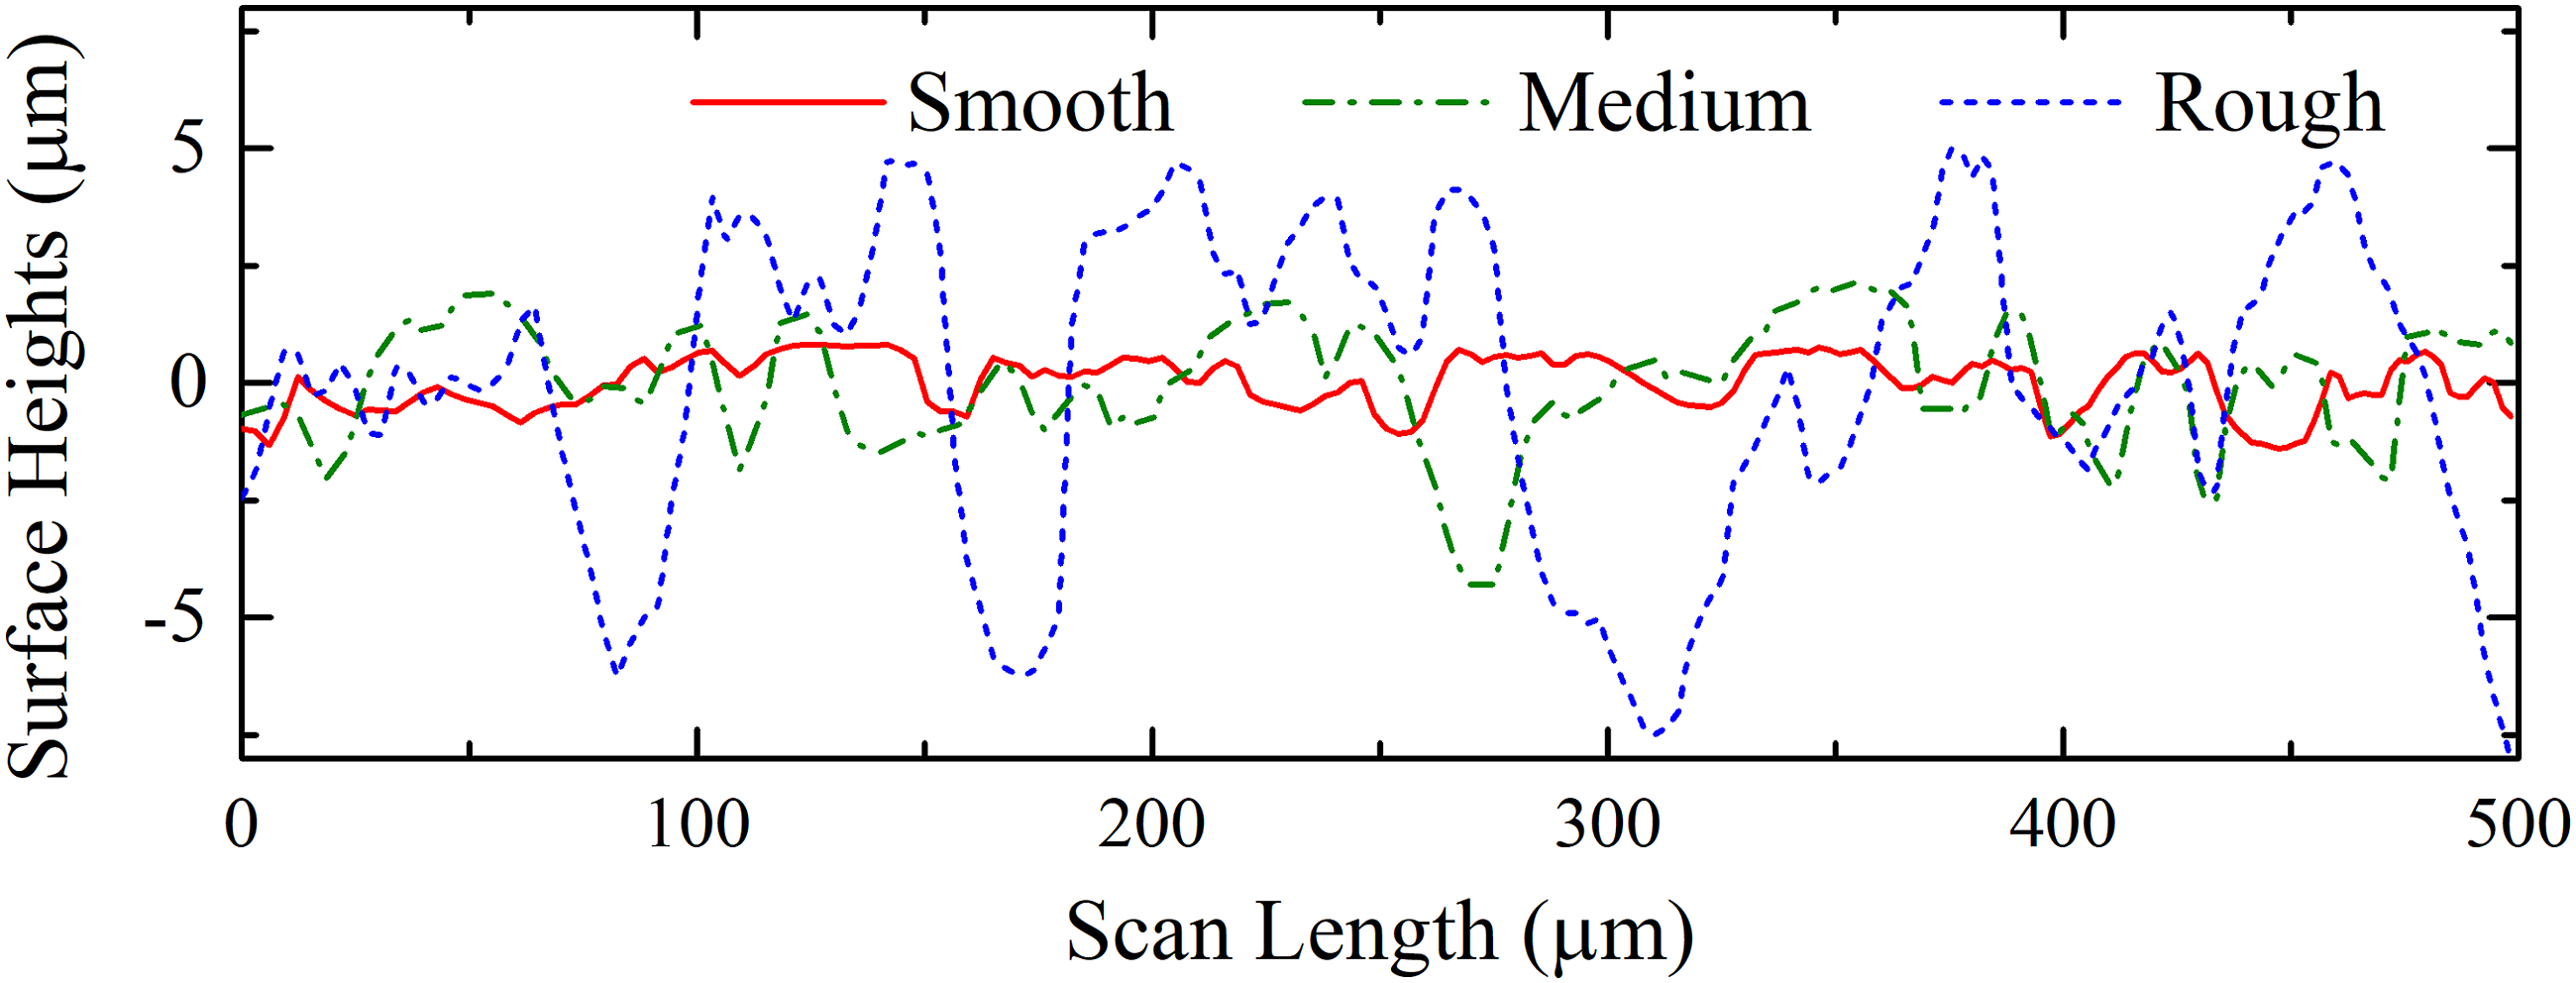
Energy dissipations of joint specimens with different surface roughness are not the same. For Set 1 with smooth surface, the tested roughness ranges from Ra0.64 to Ra0.91. The energy dissipation is relatively large. For Set 2 with medium surface, the tested roughness ranges from Ra1.1 to Ra1.4. Its energy dissipation is slightly lower than that of Set 1. The lowest results are observed in the test with Set 3, Ra2.6 to Ra2.9. These data are illustrated in Figure 9. The abscissa of the figure represents the input force provided by the shaker to the system, which is computed as the mass of the oscillator times its acceleration amplitude A
m
under harmonic motion. Energy dissipation with different surface roughness.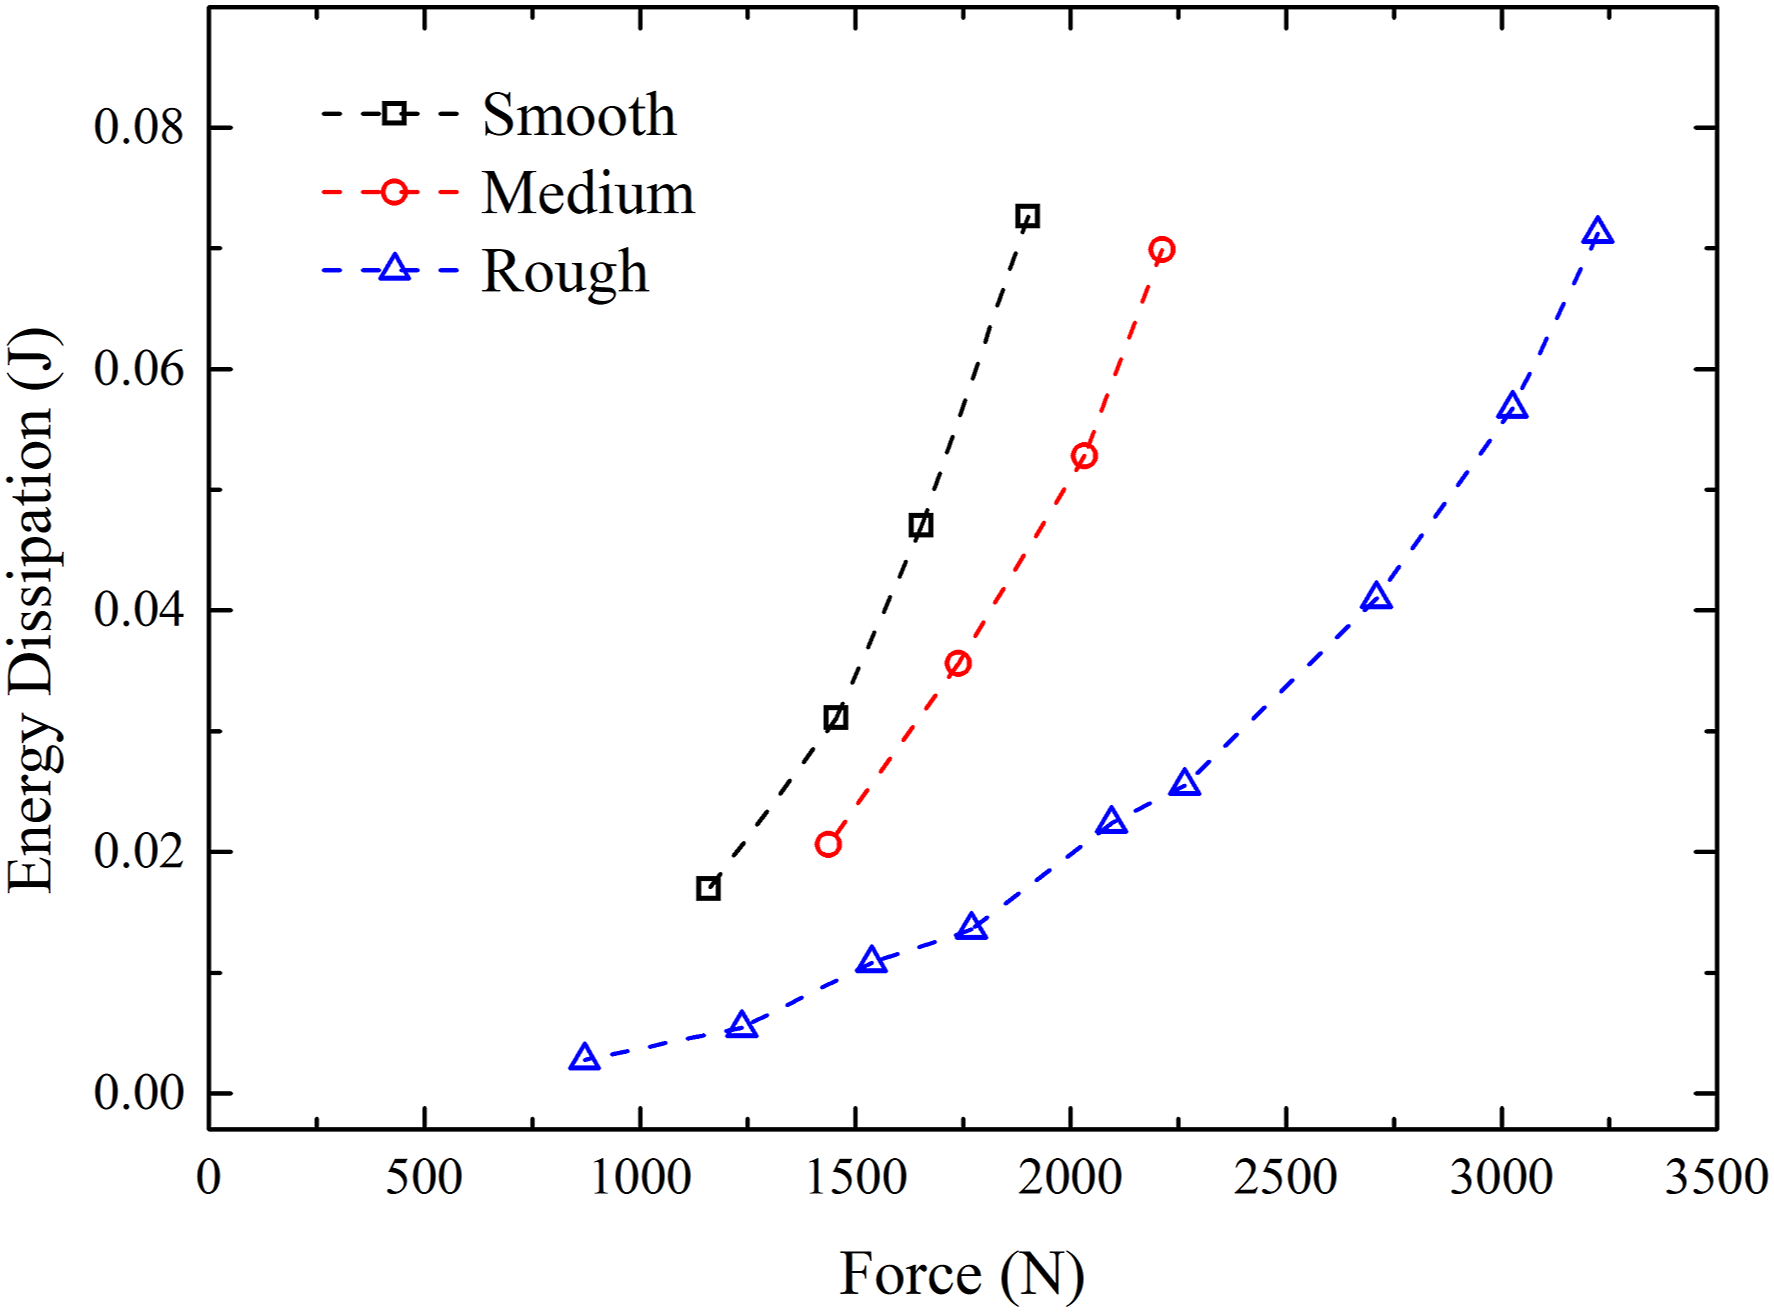
Slipping of contact interfaces is responsible for energy dissipation. The actual contact area of a jointed structure is related to surface roughness. For rough interfaces, the real contact area is small, thus high local pressure will be found. In this circumstance, local lockup might happen and micro-slipping is prevented. For smooth interfaces under the same preload, the real contact area is relatively larger and the local pressure is also lower than rough interfaces. In this circumstance, micro-slipping could easily occur when subjected to tangential loads. Therefore, smoother interfaces would result in higher dissipation. This interesting phenomenon is also observed by Ames et al. (2009) and Eriten et al. (2011b).
5.2. Influence of bolt arrangement
As listed in Table 1, there are five kinds of bolt arrangements in total. For every set, the preload torque is considered as 24 Nm. These specimens are all manufactured with rough surfaces. Their test roughness ranges from Ra2.35 to Ra3.13. Experiment results are plotted in Figure 10. Energy dissipation with different bolt arrangement.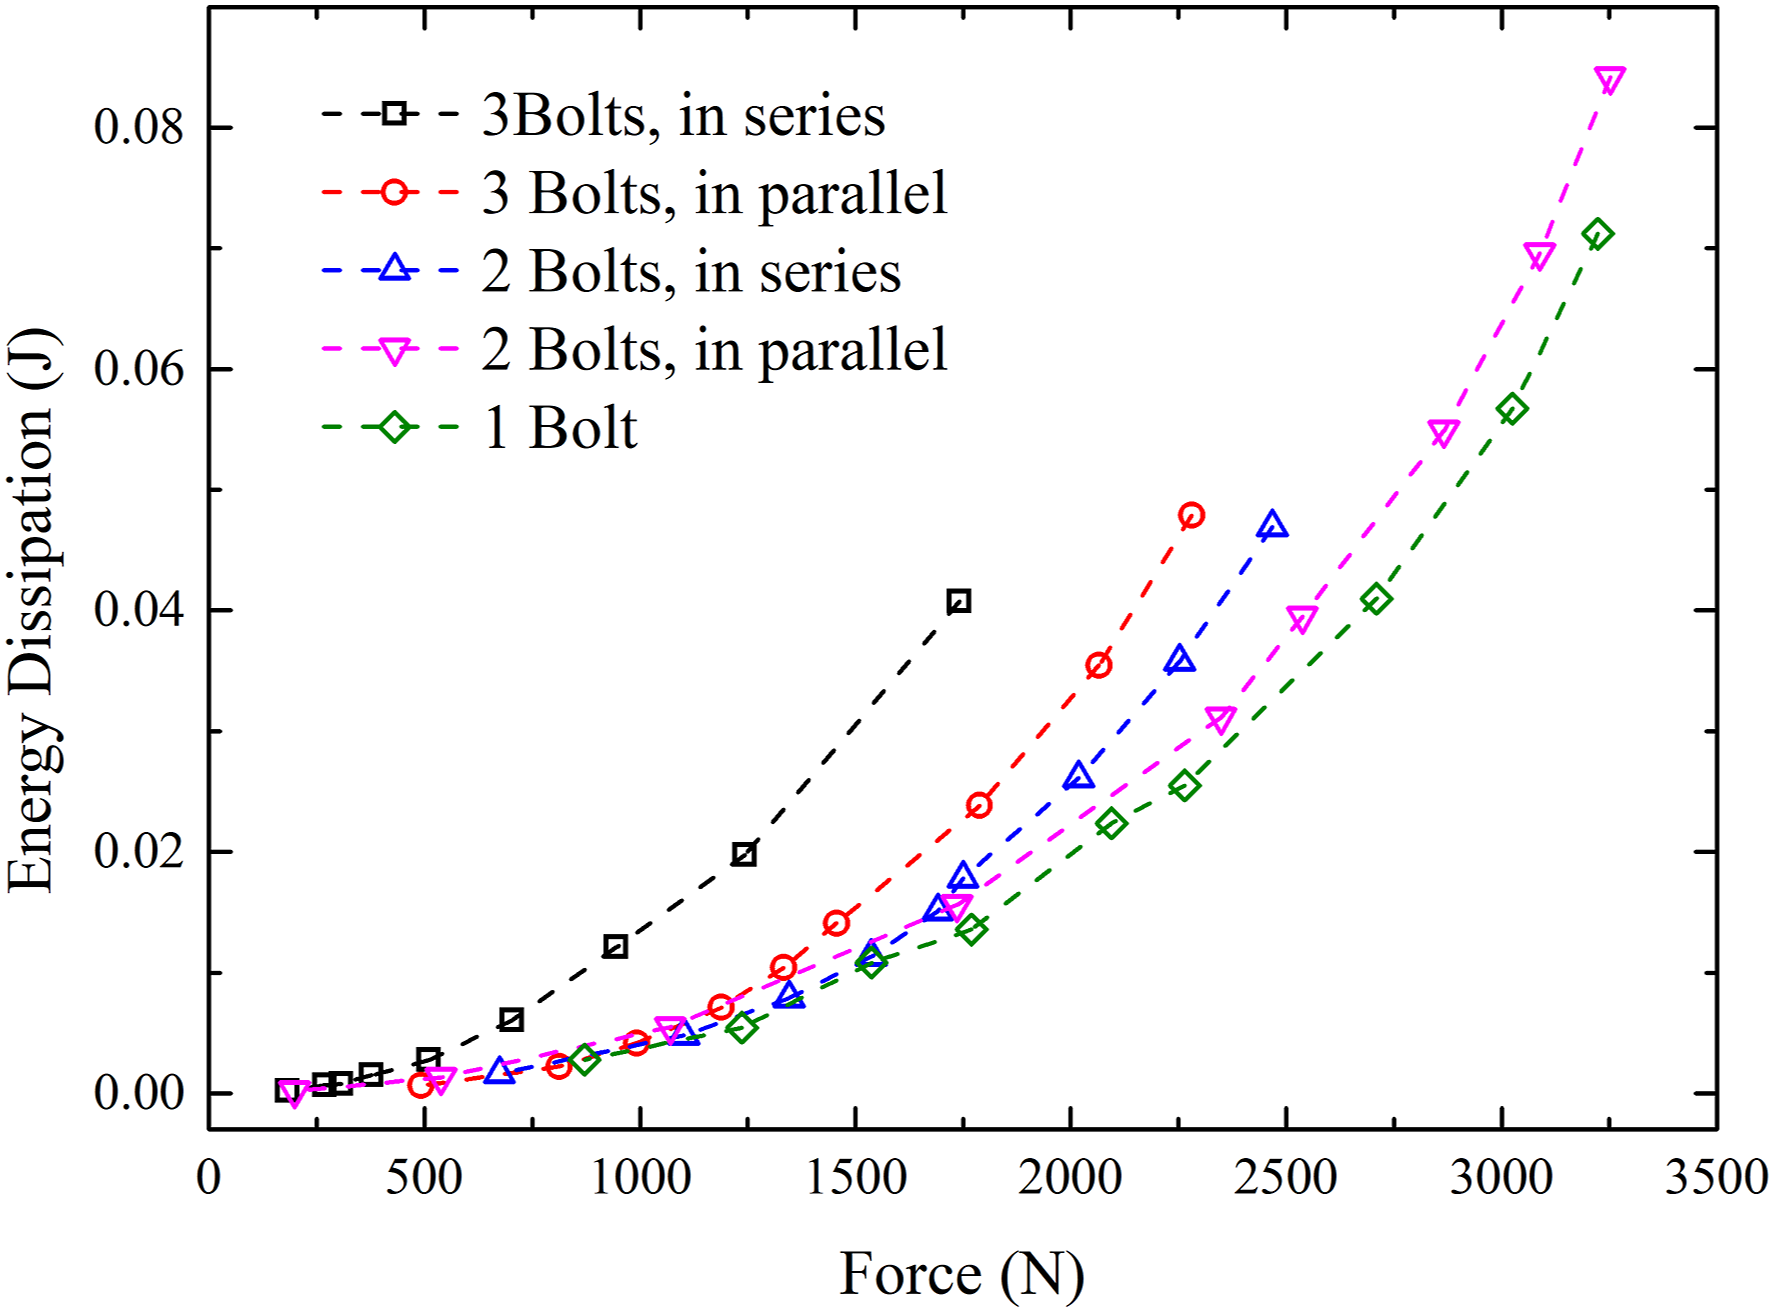
It is clearly shown that specimens with 3 bolts in series dissipate more energy than other types of specimens. For the other four sets (1 bolt, 2 bolts in series, 2 bolts in parallel, and 3 bolts in parallel), with a force smaller than 1250 N, energy dissipations show no significant differences. When the force grows larger than 1750 N, their differences become apparent. These results show that specimens with more bolts dissipate relatively more energy. When bolt number is consistent, the series type dissipates more energy than the parallel type.
5.3. Repeatability of identical specimens
Experiment data of all the three specimen pairs of Set 3 are plotted in Figure 11. Good conformities show that the energy dissipations obtained from the very same experimental process are well repeatable for the identical specimens. It also proves the stability of the proposed oscillator device. Comparison of identical specimens with error bars of ±6%, single bolt with rough surfaces.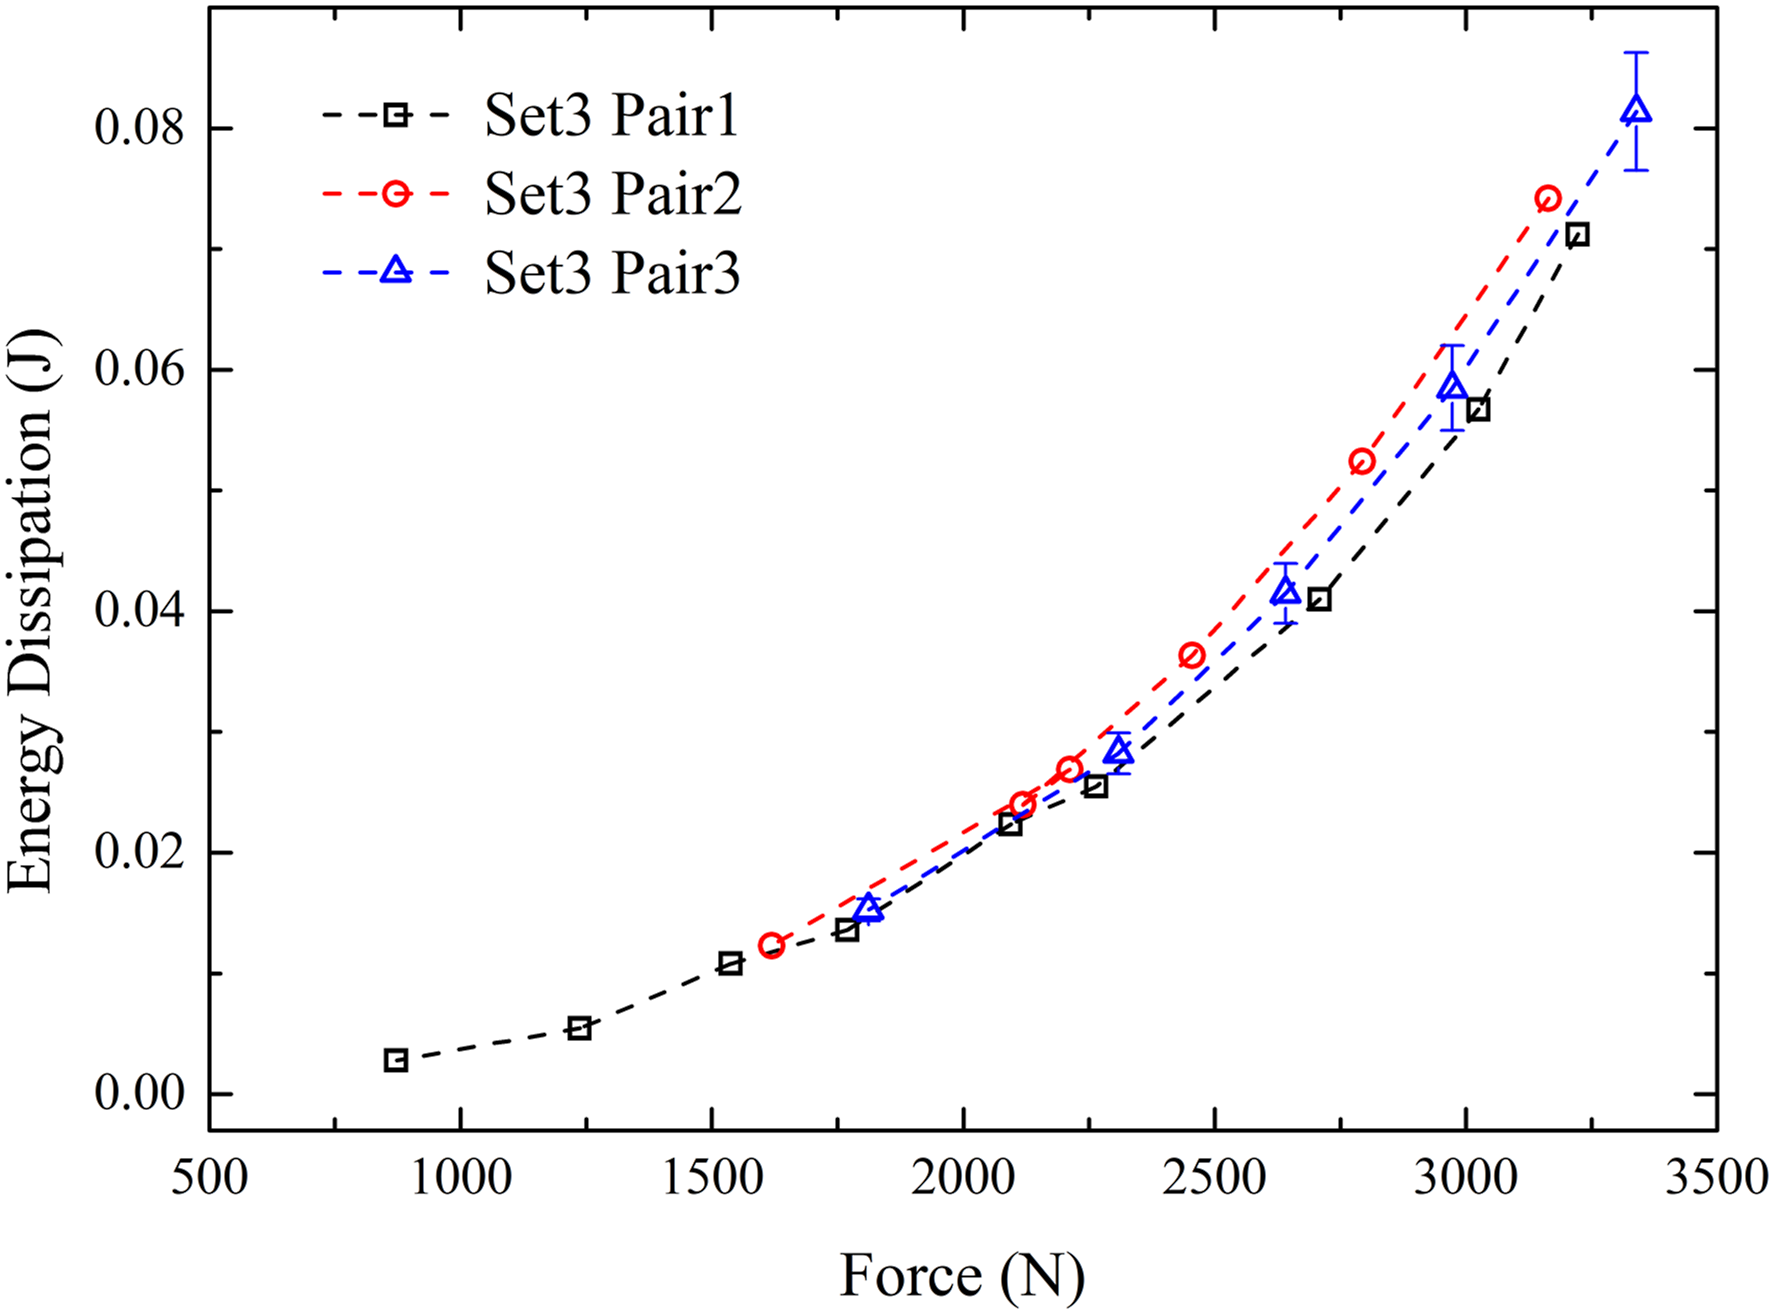
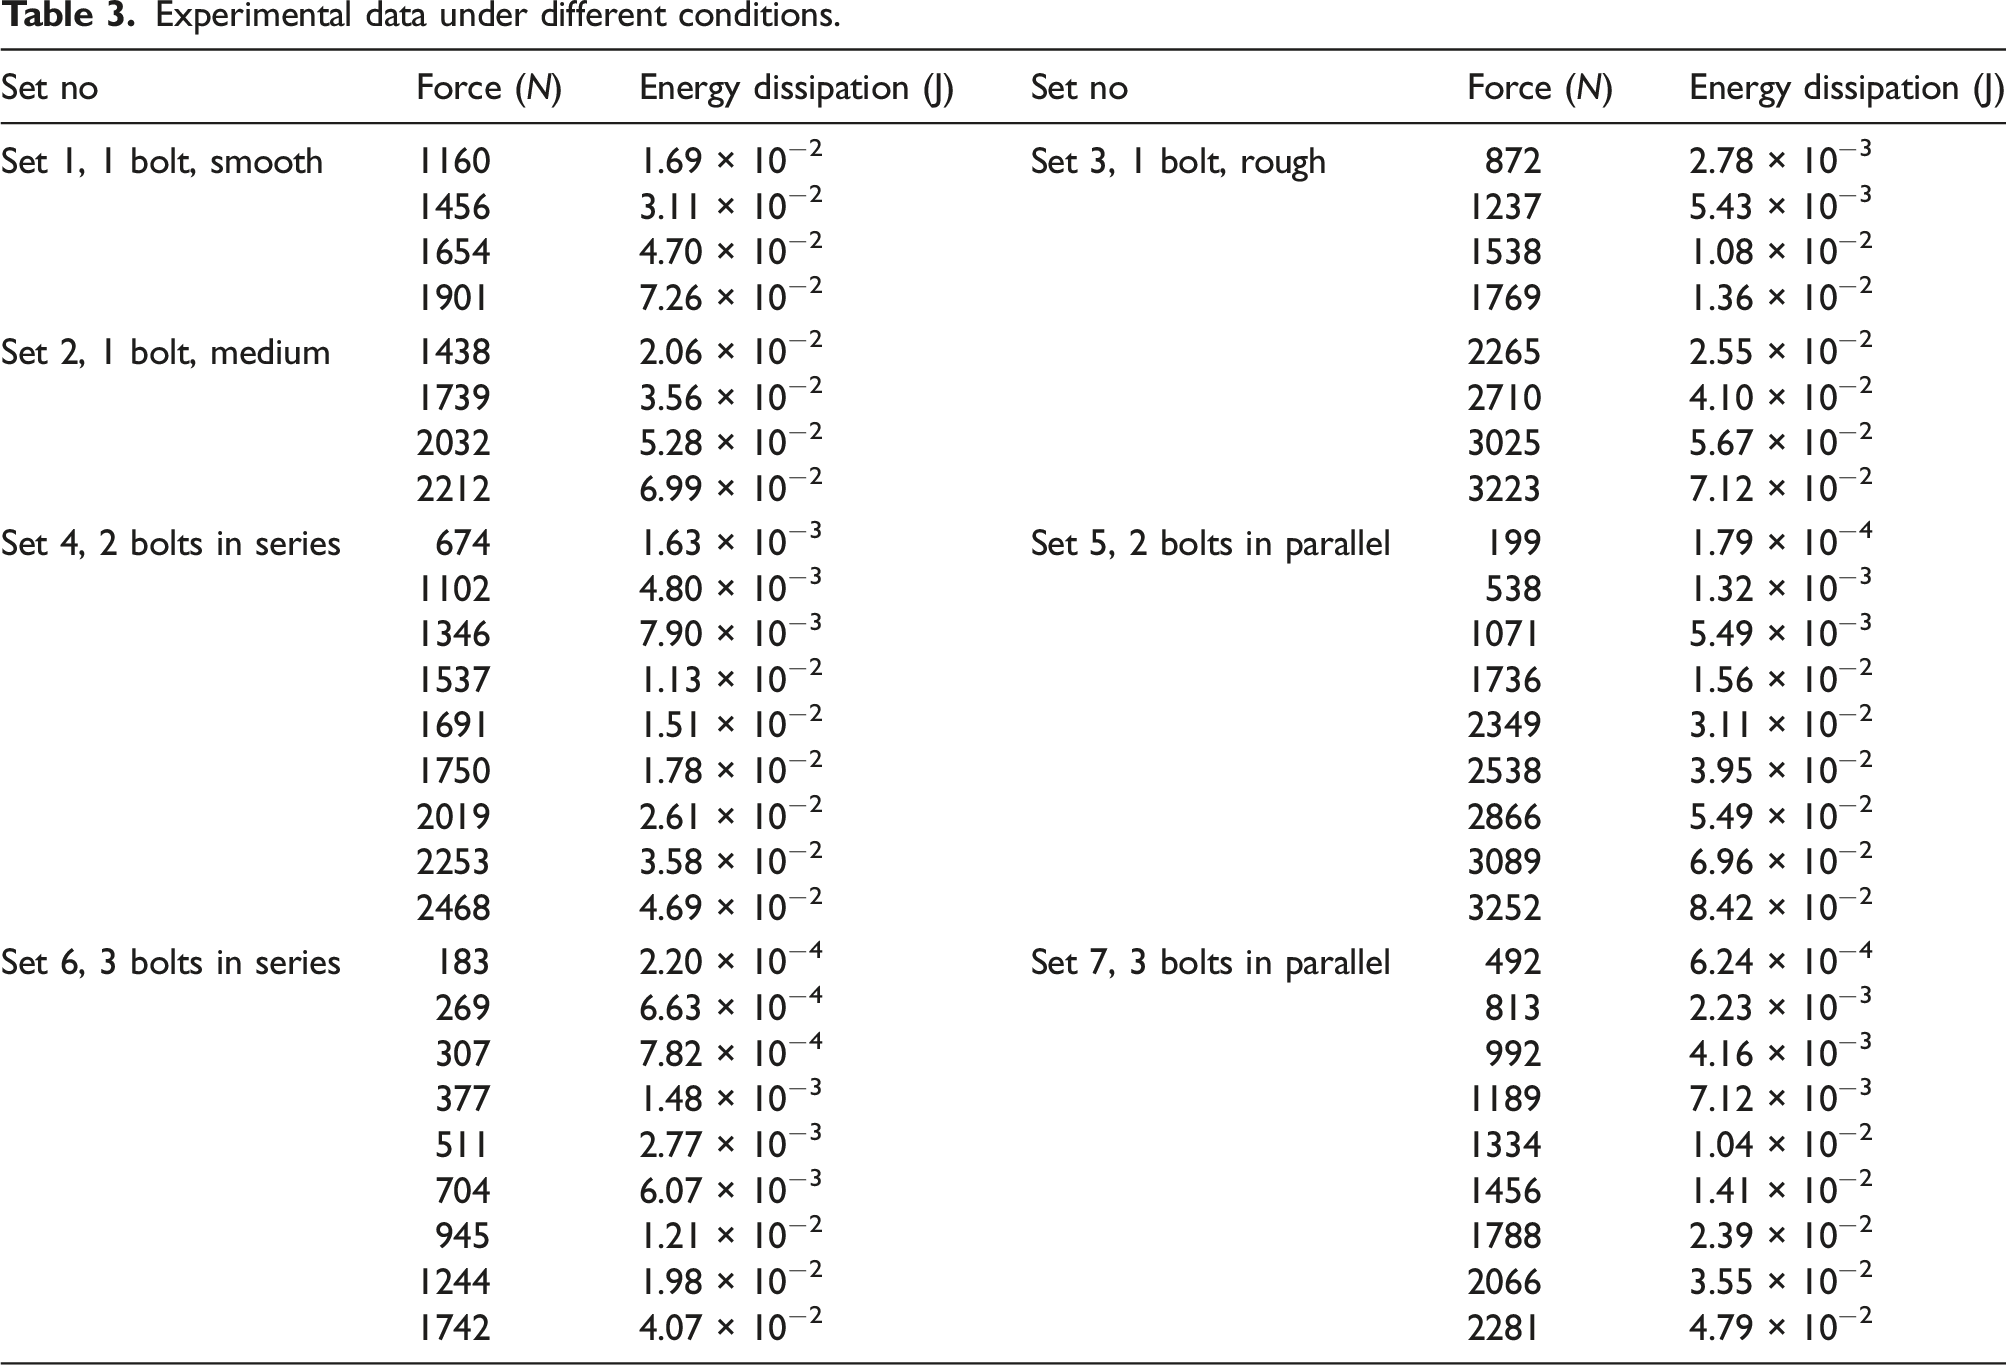
5.4. Experimental data
Experimental data under different conditions.
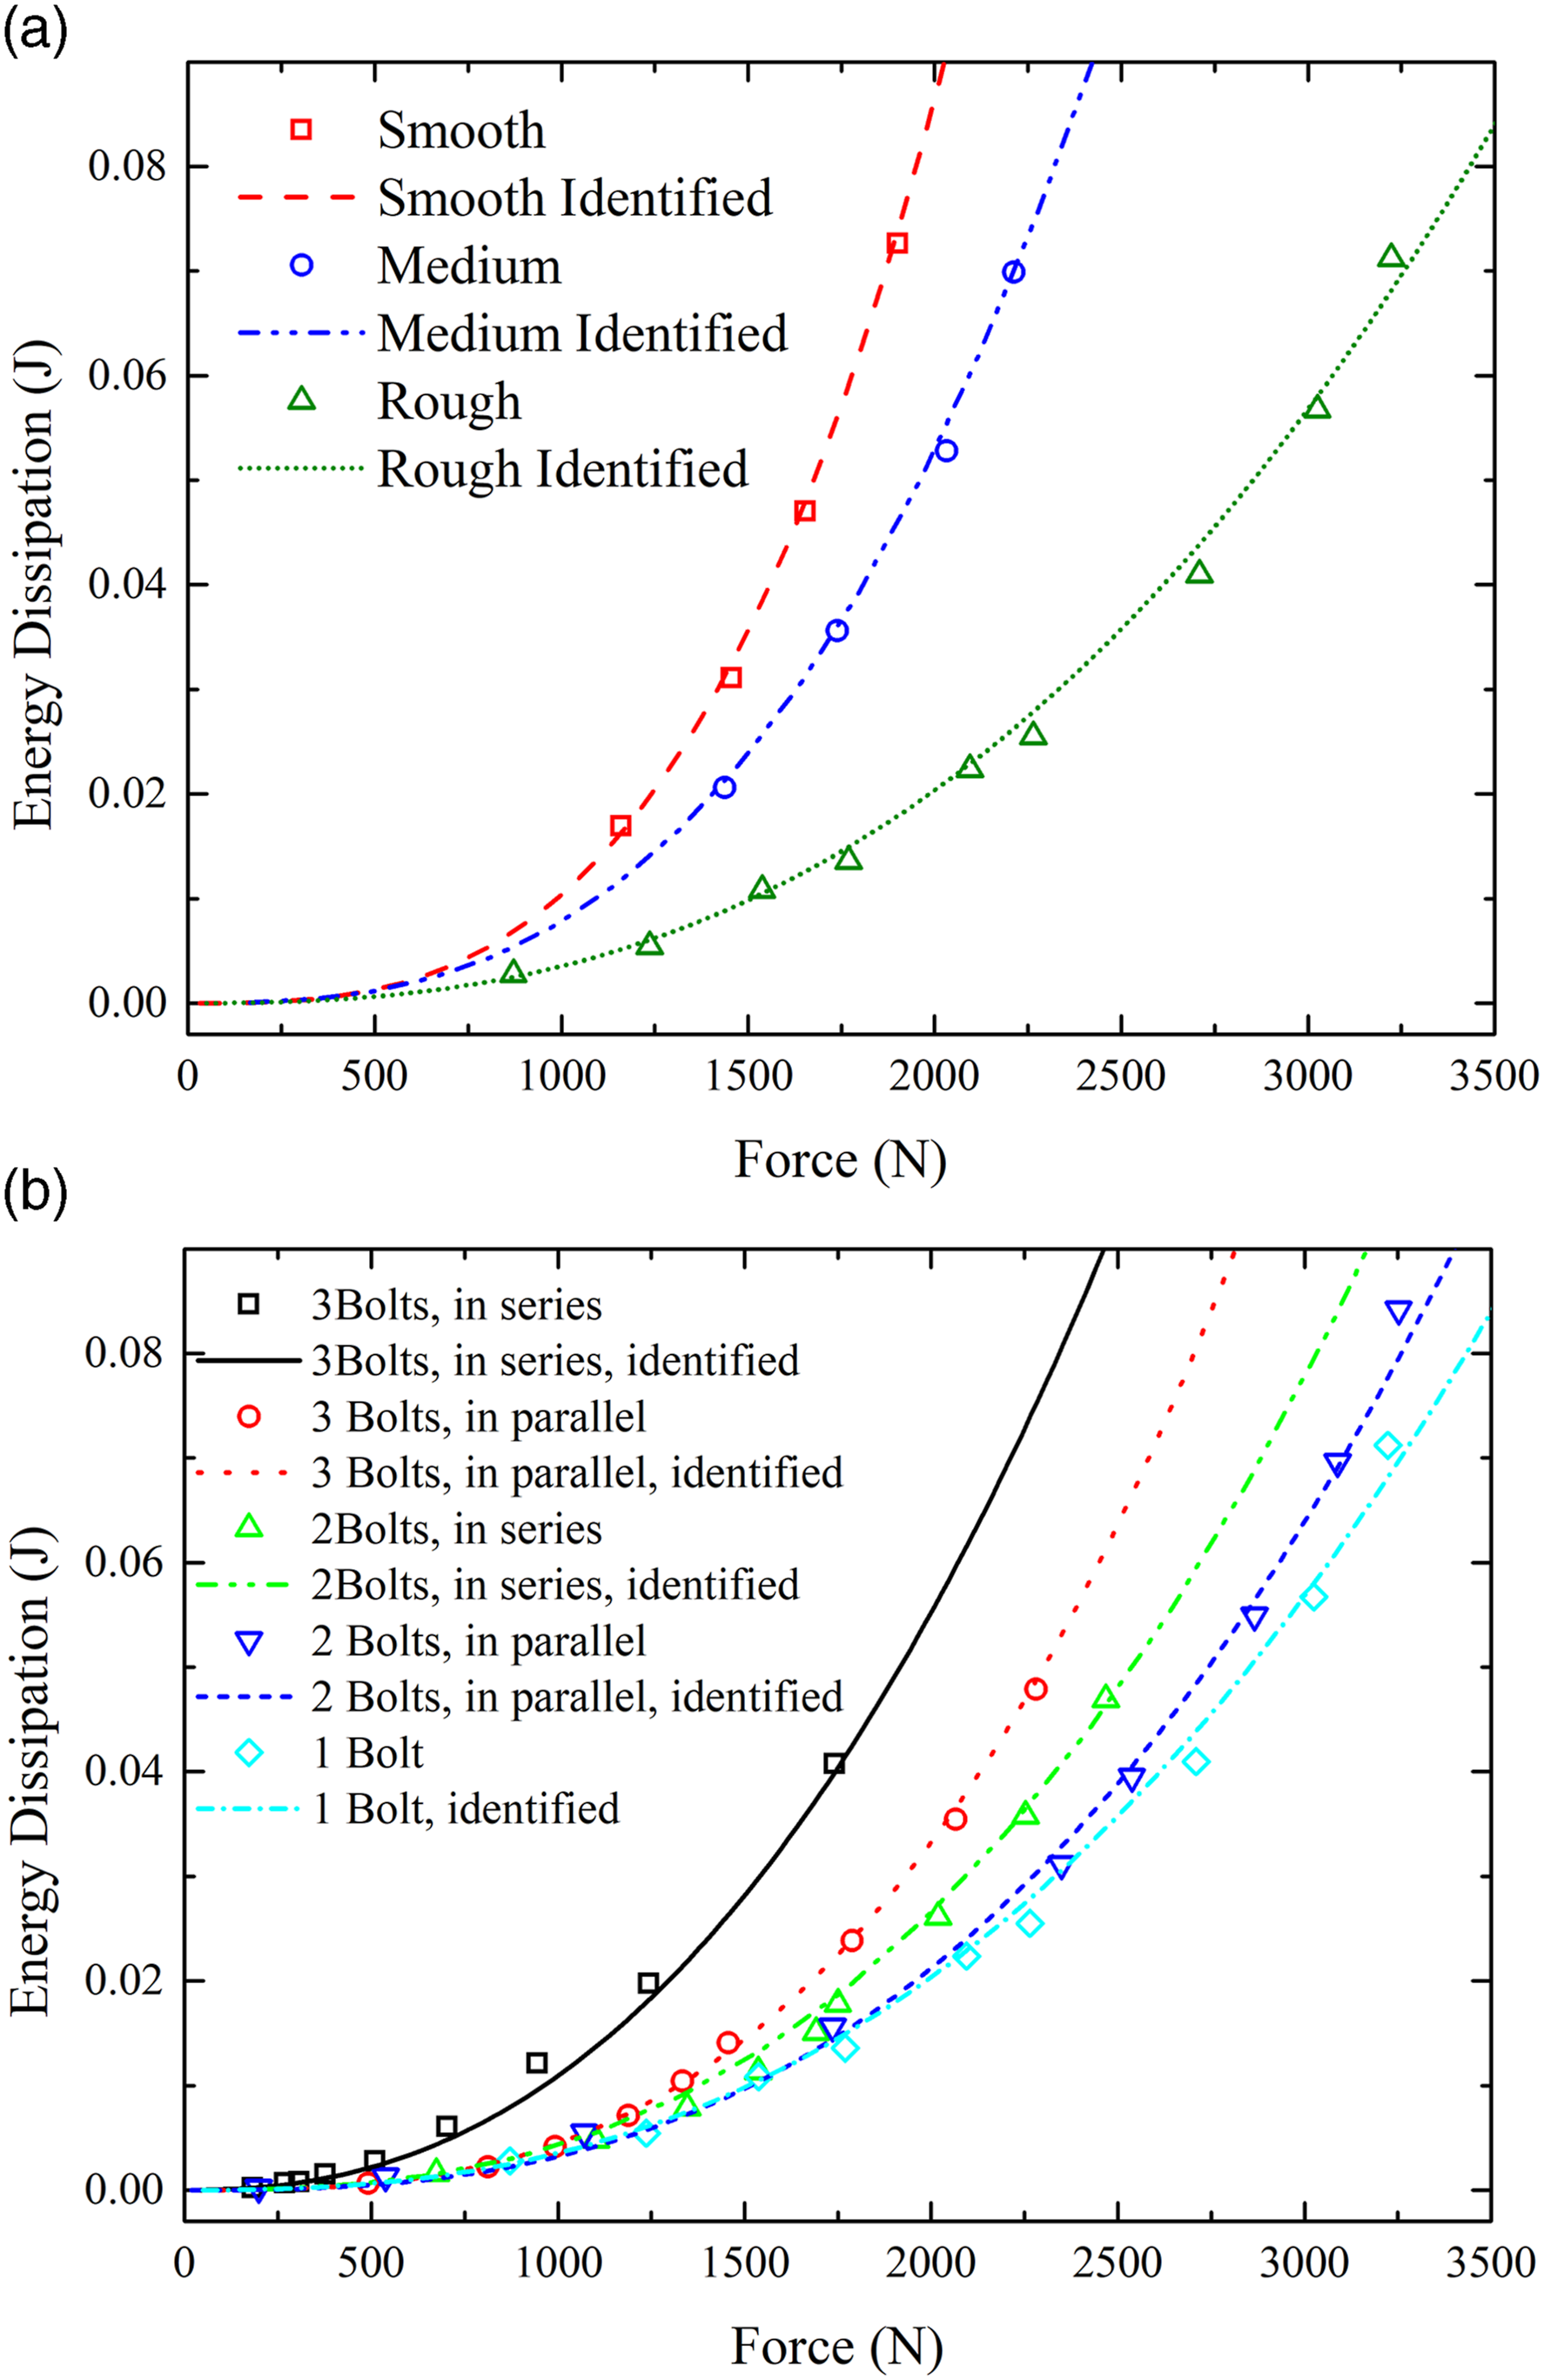
Comparisons between identified Iwan models and experimental data of (a) different contact roughness and (b) different bolt arrangements.
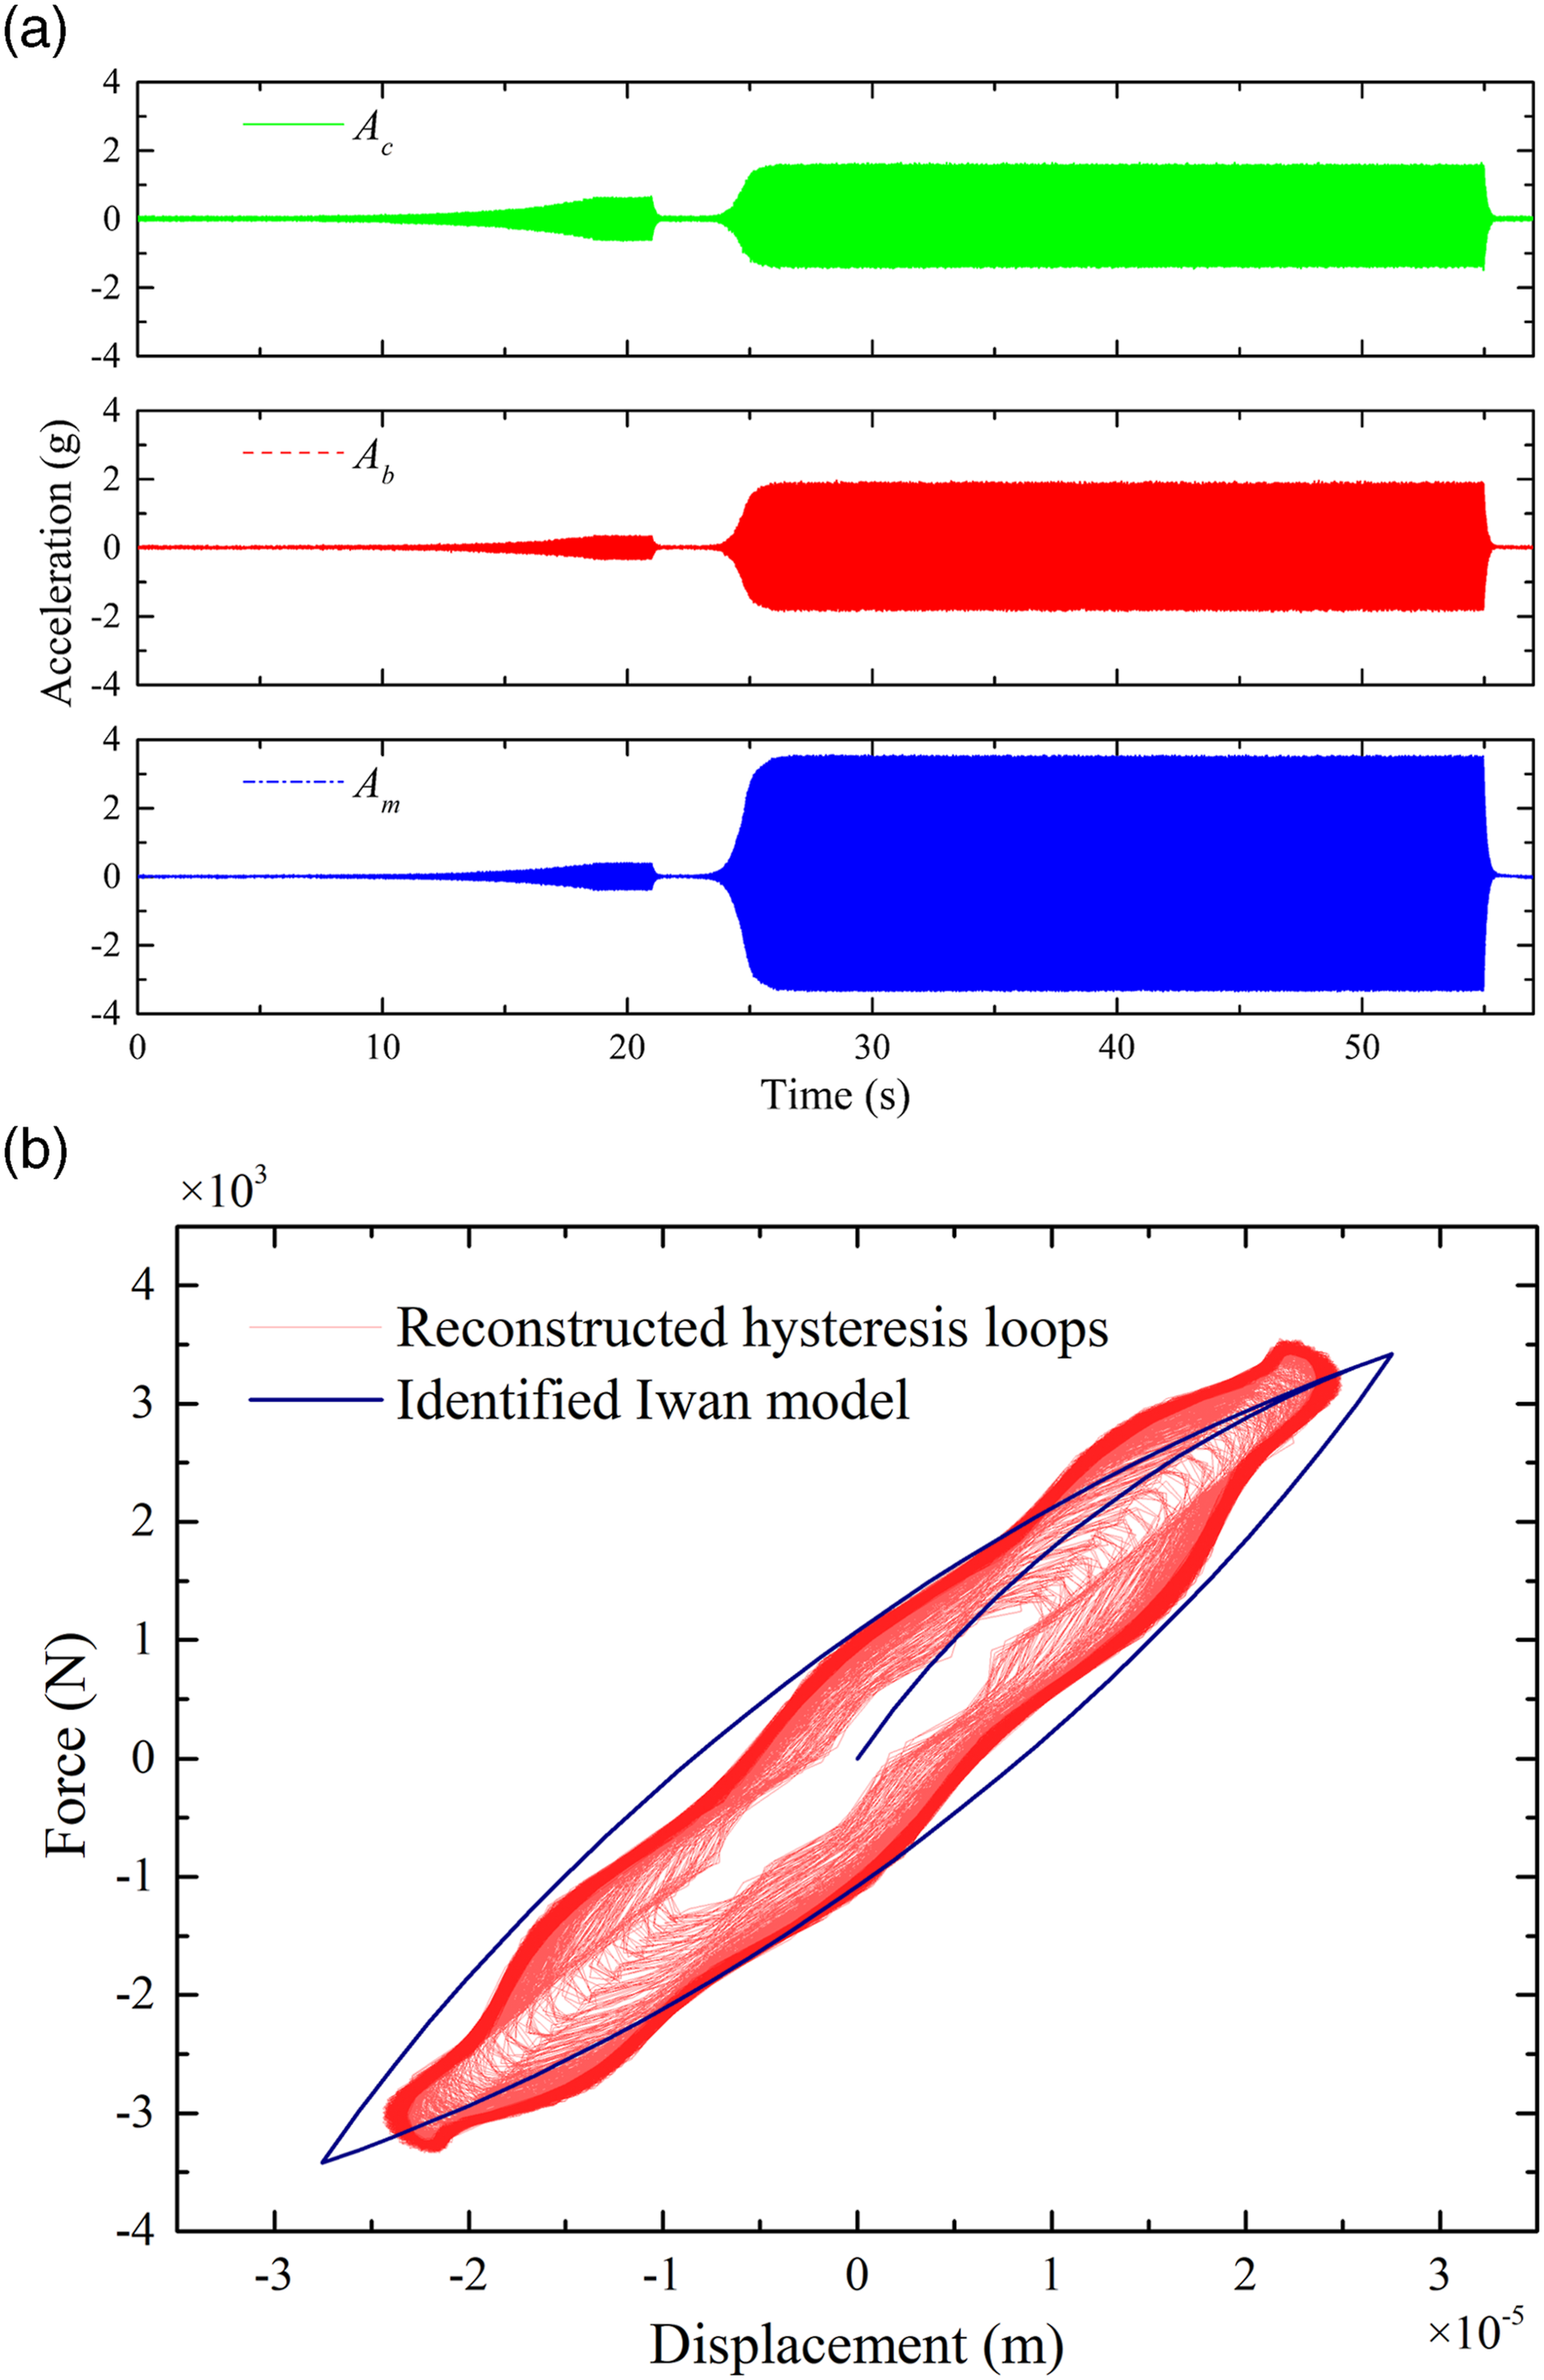
Results of Set 3, 1.2 g input: (a) acceleration–time curves and (b) reconstructed hysteresis loop compared with the identified Iwan model.
6. Applications of Iwan model
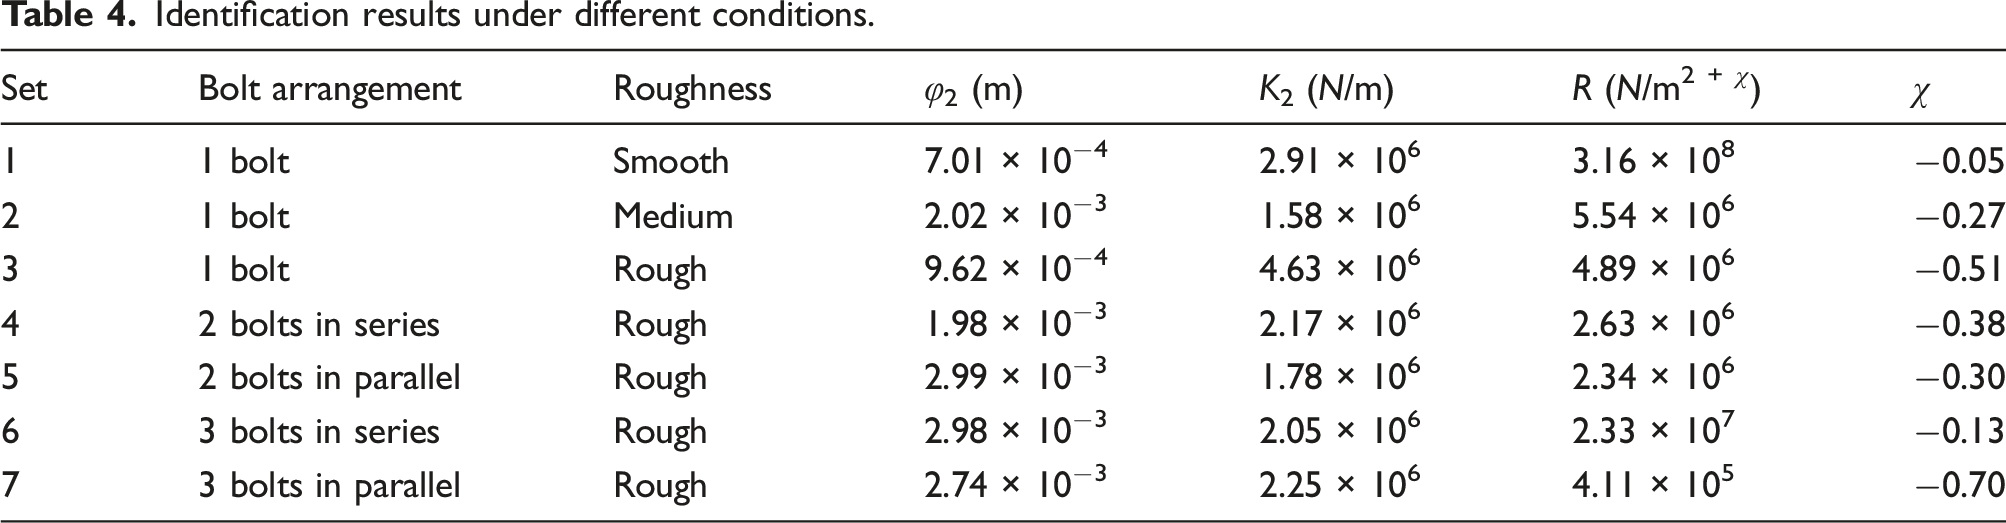
According to the procedures provided by Li and Hao (2016), the four-parameter Iwan model can be identified with the experimental data from Section 5. Parameter R and χ represent the power law distribution of Iwan model. Parameter φ2 is the initiation of macro-slip and K2 is the stiffness variation at the transition between micro- and macro-slip. The analytical expression between dissipation D and displacement amplitude ψ is derived as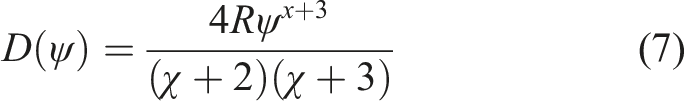
The analytical force–displacement relationship is
Identification results under different conditions.
Displacement–time curves of the base and the oscillator can be calculated with the obtained acceleration–time curves. In this manner, the hysteresis loop of force–displacement relationship can be reconstructed. Acceleration curves during the whole fix-frequency excitation of Set 3, 1.2 g, input are shown in Figure 13(a). 24,000 data points from 24.6 s to 29.3 s, as amplitudes are gradually enlarged, are chosen for analysis. A comparison between the identified Iwan model and the reconstructed hysteresis loop are illustrated in Figure 13(b). It can be observed that the color at edge is darker than inside of the loop, which indicates a fixed boundary as the response of the oscillator device tends to be stable. The closed loop of navy blue represents the identified Iwan model. Although the reconstructed hysteresis loop is not in a regular shape, its area is almost the same as that of the identified Iwan model. It proves that the four-parameter Iwan model can well describe the damping property of joints.
7. Conclusions
In this article, a modified and simplified oscillator device is designed, manufactured, and applied to study the energy dissipation caused by joint damping. Compared with the BMD, the oscillator in this study has two advantages. First, mass of the oscillator (101.55 kg) is similar to that of the BMD (205lb, 93 kg), whereas its shape has been redesigned with lower center of gravity. For all those tests with different frequencies, specimens, and input excitations, the stability of the oscillator has been well remained without any support frames. Second, the applied force with the BMD varies from 120 lb to 320 lb (534 N–1424 N). Range of the applied force with the oscillator is 183 N–3252 N, which is much wider than that of the BMD. More testing data can be acquired by the oscillator than the BMD. Experimental data under different conditions show a good stability and accuracy of the proposed oscillator device. It is planned to be deployed in future investigation of jointed structures.
Three different levels of surface roughness and five kinds of bolt arrangements are specifically discussed. The acquired data indicate rough surface dissipates more energy than smooth one. Specimens with more bolts dissipate relatively more energy. When bolt number is consistent, the series type dissipates more energy than the parallel type. Model identifications based on experimental data are carried out. The reconstructed hysteresis loop and the identified Iwan model match well with each other. It is shown that the four-parameter Iwan model can well describe the damping property of joints with different surface roughness and bolt arrangements.
Footnotes
Declaration of Conflicting Interests
The author(s) declared no potential conflicts of interest with respect to the research, authorship, and/or publication of this article.
Funding
The author(s) disclosed receipt of the following financial support for the research, authorship, and/or publication of this article: This research was supported by the National Natural Science Foundation of China under Grant No. 51974171.