
Abstract
It is crucial for flood discharge structure vibration safety evaluations to filter low-frequency noise, separate dense-frequency components and obtain high-frequency component accurately from vibration signals. Variational mode decomposition, a novel signal adaptive decomposition method, effectively processes flood discharge structures. However, the mode number and quadratic penalty item uncertainty in variational mode decomposition directly affects the vibration signal decomposition. Therefore, an improved variational mode decomposition method for vibration signal processing is proposed in this study. The proposed method adaptively determines the mode number based on singular entropy and frequency stability to completely separate the structural vibration components (including dense-frequency components and high-frequency components) and noise components from the vibration signal. Next, an objective quadratic penalty item function based on sample entropy and mutual information is proposed to quantify the mode mixing between the structural vibration components. Finally, a particle swarm optimisation algorithm based on beetle antenna search is proposed to optimise the quadratic penalty item, which overcomes the shortcomings of traditional algorithms and suppresses the mode mixing between the structural vibration components. The validity and feasibility of the proposed method was verified by the simulation signal and was applied to a sluice prototype project. The results showed that the method effectively filtered noise, greatly improved the vibration response signal-to-noise ratio and obtained the structural vibration component time history signal, which provides a foundation for flood discharge structure vibration safety evaluation and health monitoring.
Keywords
1. Introduction
High-speed flood turbulence causes strong fluid-induced structure vibrations (Li et al., 2017, 2020; Zhang et al., 2018a), such as house vibrations induced by the Xiangjiaba power station in China (Lian et al., 2015) and the destroyed Oroville dam spillway in the United States (Zhou et al., 2019). Flood discharge structure (FDS) dynamic characteristic parameters effectively reflect the operating state and health degree. However, FDS vibration signals are usually in the form of a low signal-to-noise ratio (SNR) and non-stationary random signal caused by noise from unknown external excitations (Zhang et al., 2018b), making it difficult to extract the dynamic characteristic parameters from the vibration signal and accurately assess its structural performance and hazard (Lian et al., 2018b, 2020). Therefore, an effective signal processing method must be adopted to denoise the measured signals and improve the accuracy of acquired structural feature information.
Filtering the low-frequency noise (LFN), separating the dense-frequency components (DFCs) and obtaining accurate high-frequency components (HFCs) make FDS vibration signal processing challenging. Wavelet threshold decomposition (WTD) (Lian et al., 2007), singular value decomposition (SVD) (Lian et al., 2009) and empirical mode decomposition (EMD) (Li et al., 2012) have been applied to FDS vibration signal processing. However, these methods can only filter noise to a certain extent and do not suppress mode mixing, which leads to separate structural DFCs and few obtained structural HFCs. Zhang et al. (2015) presented an FDS signal processing method combining WTD and EMD, but there are shortcomings in the EMD algorithm design theory. Zhang et al. (2016) combined ensemble empirical mode decomposition (EEMD) with WTD to process vibration signals. However, the mode splitting caused by non-standard intrinsic mode functions (IMFs) after adding white noise appears in EEMD. A denoising method based on complete ensemble empirical mode decomposition (CEEMD) and WTD was proposed (Hu et al., 2017). However, Gaussian white noise uncertainty affected signal decomposition. Zhang et al. (2017) proposed a signal denoising method based on complete ensemble empirical mode decomposition with adaptive noise (CEEMDAN) and SVD, but the SVD inverse operation inevitably increased the error when reconstructing the signal. Flood discharge structure (FDS) vibration signal processing has been primarily conducted using EMD and its improved methods which filter noise well, but the method does not consider structural DFCs, which results in mode mixing in the signal decomposition.
Variational mode decomposition (VMD) is a novel signal adaptive decomposition method that can extract feature information of all vibration components and suppress mode mixing effectively, which may solve the current difficulties in FDS vibration signal processing (Zhang et al., 2020b). Variational mode decomposition has received considerable attention and has been widely used (An et al., 2015; Zhang et al., 2020a) since it was introduced in 2014. However, VMD parameter uncertainty results in errors and deviations, especially in the preset mode number and quadratic penalty item (QPI), which directly affects the decomposition results. Many improved methods have been proposed to optimise the VMD mode number (Huang et al., 2019b; Lian et al., 2018a; Liu et al., 2018). However, the simultaneous optimisation of the mode number and QPI has not been achieved, and the complex nonlinear relationship and calculation efficiency of the parameter optimisation have not considered.
We proposed a new method for the vibration signal processing of FDSs based on improved variational mode decomposition (IVMD). The proposed method processed the vibration signal with no need to select the mode number and QPI artificially and addressed FDS vibration signal processing difficulties. The singular entropy increment (SEI) change rate threshold was proposed to determine the number of structural vibration components in the signal, and the centre frequency and instantaneous frequency mean (IFM) methods were used to separate the structural vibration components (including DFCs and HFCs) and the noise components and determine the optimal mode number. Next, considering that the vibration signal contained strong noise, the sample entropy threshold was proposed to select the QPI that met the signal reconstruction accuracy. The mutual information coefficient (MIC) quantifying the IMF mode mixing was used to construct the optimal QPI objective function to avoid DFC mode mixing during signal decomposition. Finally, we proposed an improved particle swarm optimisation (PSO) based on beetle antenna search (BAS) to determine the optimal QPI and then determined the optimal mode number and QPI in the VMD.
The remainder of this work is organised as follows. Section 2 describes the proposed method concept and flow chart. Section 3 uses the simulation signals to validate the proposed method. The results are compared with those analysed by CEEMD and CEEMDAN. In Section 4, the proposed method is used to process a prototype engineering vibration response. Section 5 provides the conclusions.
2. The IVMD
2.1. VMD principle
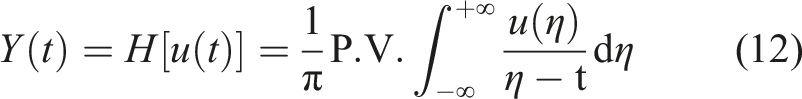
Variational mode decomposition refers to a multicomponent adaptive signal decomposition method that combines Wiener filtering and Hilbert transform. Through a series of mathematical transformations, the input signal is decomposed into a linear combination of IMFs. The basic principles (Dragomiretskiy and Zosso, 2014) are presented as follows.
Assuming that the signal
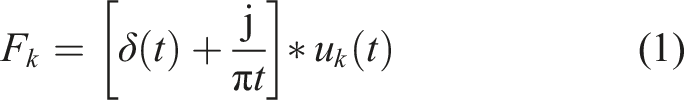
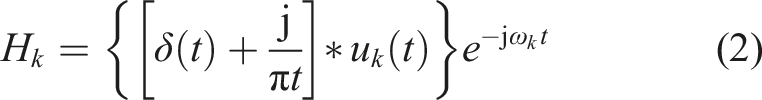
The constrained variational problem minimises the sum of the estimated IMF mode bandwidths by calculating the Gaussian smoothness
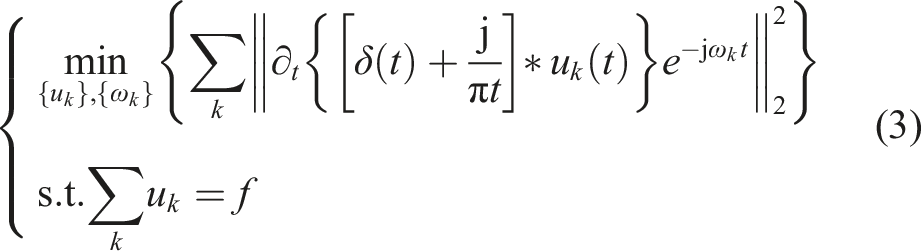
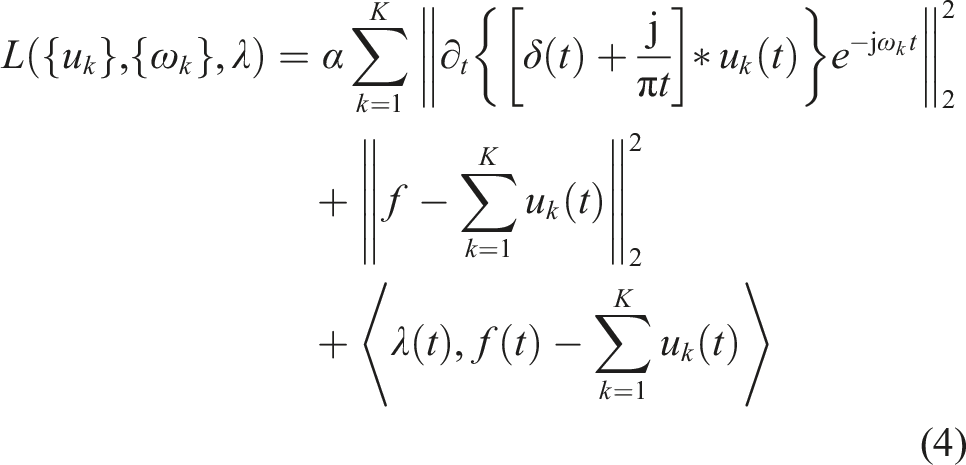
The QPI and Lagrangian multipliers are used to transform this problem into an unconstrained problem as follows
2.2. Determination of the mode number
The frequency resolution is determined by
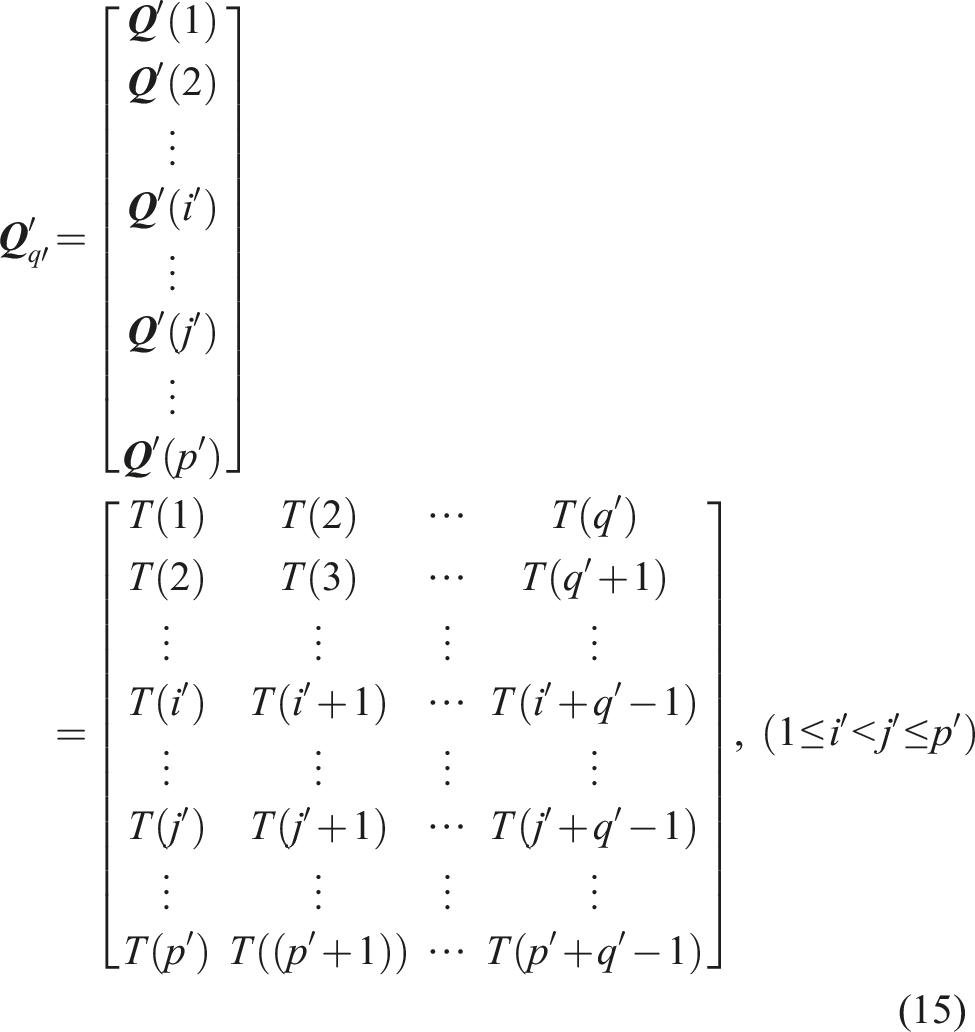
For the one-dimensional noisy signal sequence
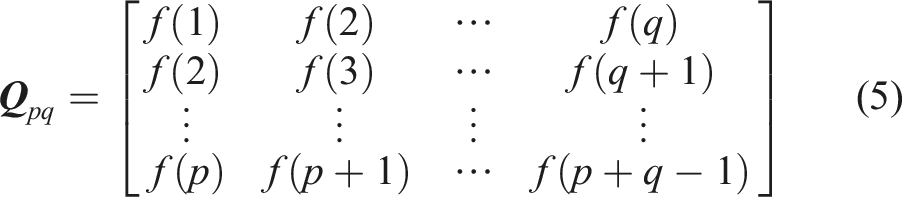
The matrix

When the SNR is low, the matrix

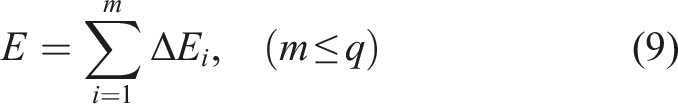
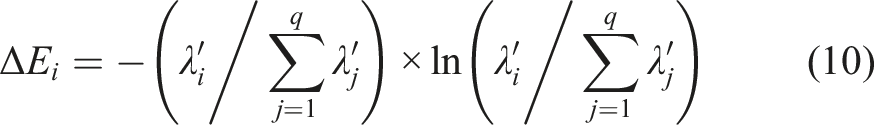
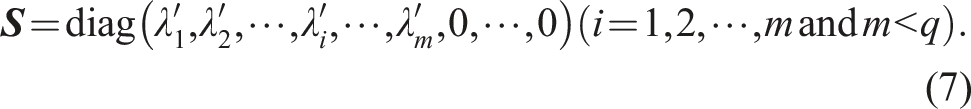
Let
When
By performing the Hilbert transform on the IMF
When
2.3. Determination of the QPI
IMF mode bandwidths are determined by the QPI
2.3.1. Objective function construction
To construct an objective function that considers the signal reconstruction accuracy and mode mixing, a sample entropy threshold is proposed to guarantee the signal reconstruction accuracy and select
The single vibration component sequence
We calculate the maximum difference between corresponding elements in vectors

The number of satisfying
Define
Similarly, to increase the dimension to

The signal sample entropy is expressed as

Given the
Subsequently, an index based on the MIC is proposed to quantify the mode mixing between the IMFs, and its expression is presented as follows

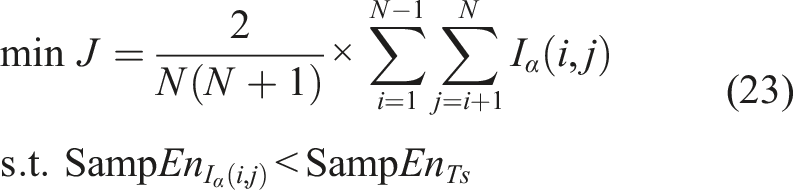
When the objective function
2.3.2. BAS-PSO algorithm
The BAS-PSO algorithm is proposed to make the objective function reach the minimum and optimise
Initialise the particle swarm. Define the particle swarm parameters, generate initial
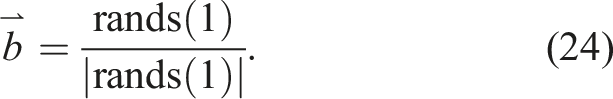
Generate the beetle direction randomly. A random vector
Define the individual beetle and its antenna position. The left and right antennae positions can be defined as


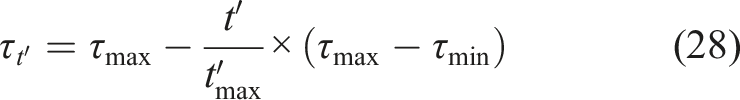
Update the beetle position. The fitness objective function is determined by equation (23), and the fitness

Calculate individual and global extremum. The current individual beetle optimal fitness is calculated, and the global extremum from the individual historical extremum is determined.
Update the particle velocity and position. The next velocity and position are determined through the particle experience and can be obtained according to equations (29) and (30)


Terminate the iterations. If
2.4. IVMD flow chart
The IVMD flow chart is presented in Figure 1. Improved variational mode decomposition method.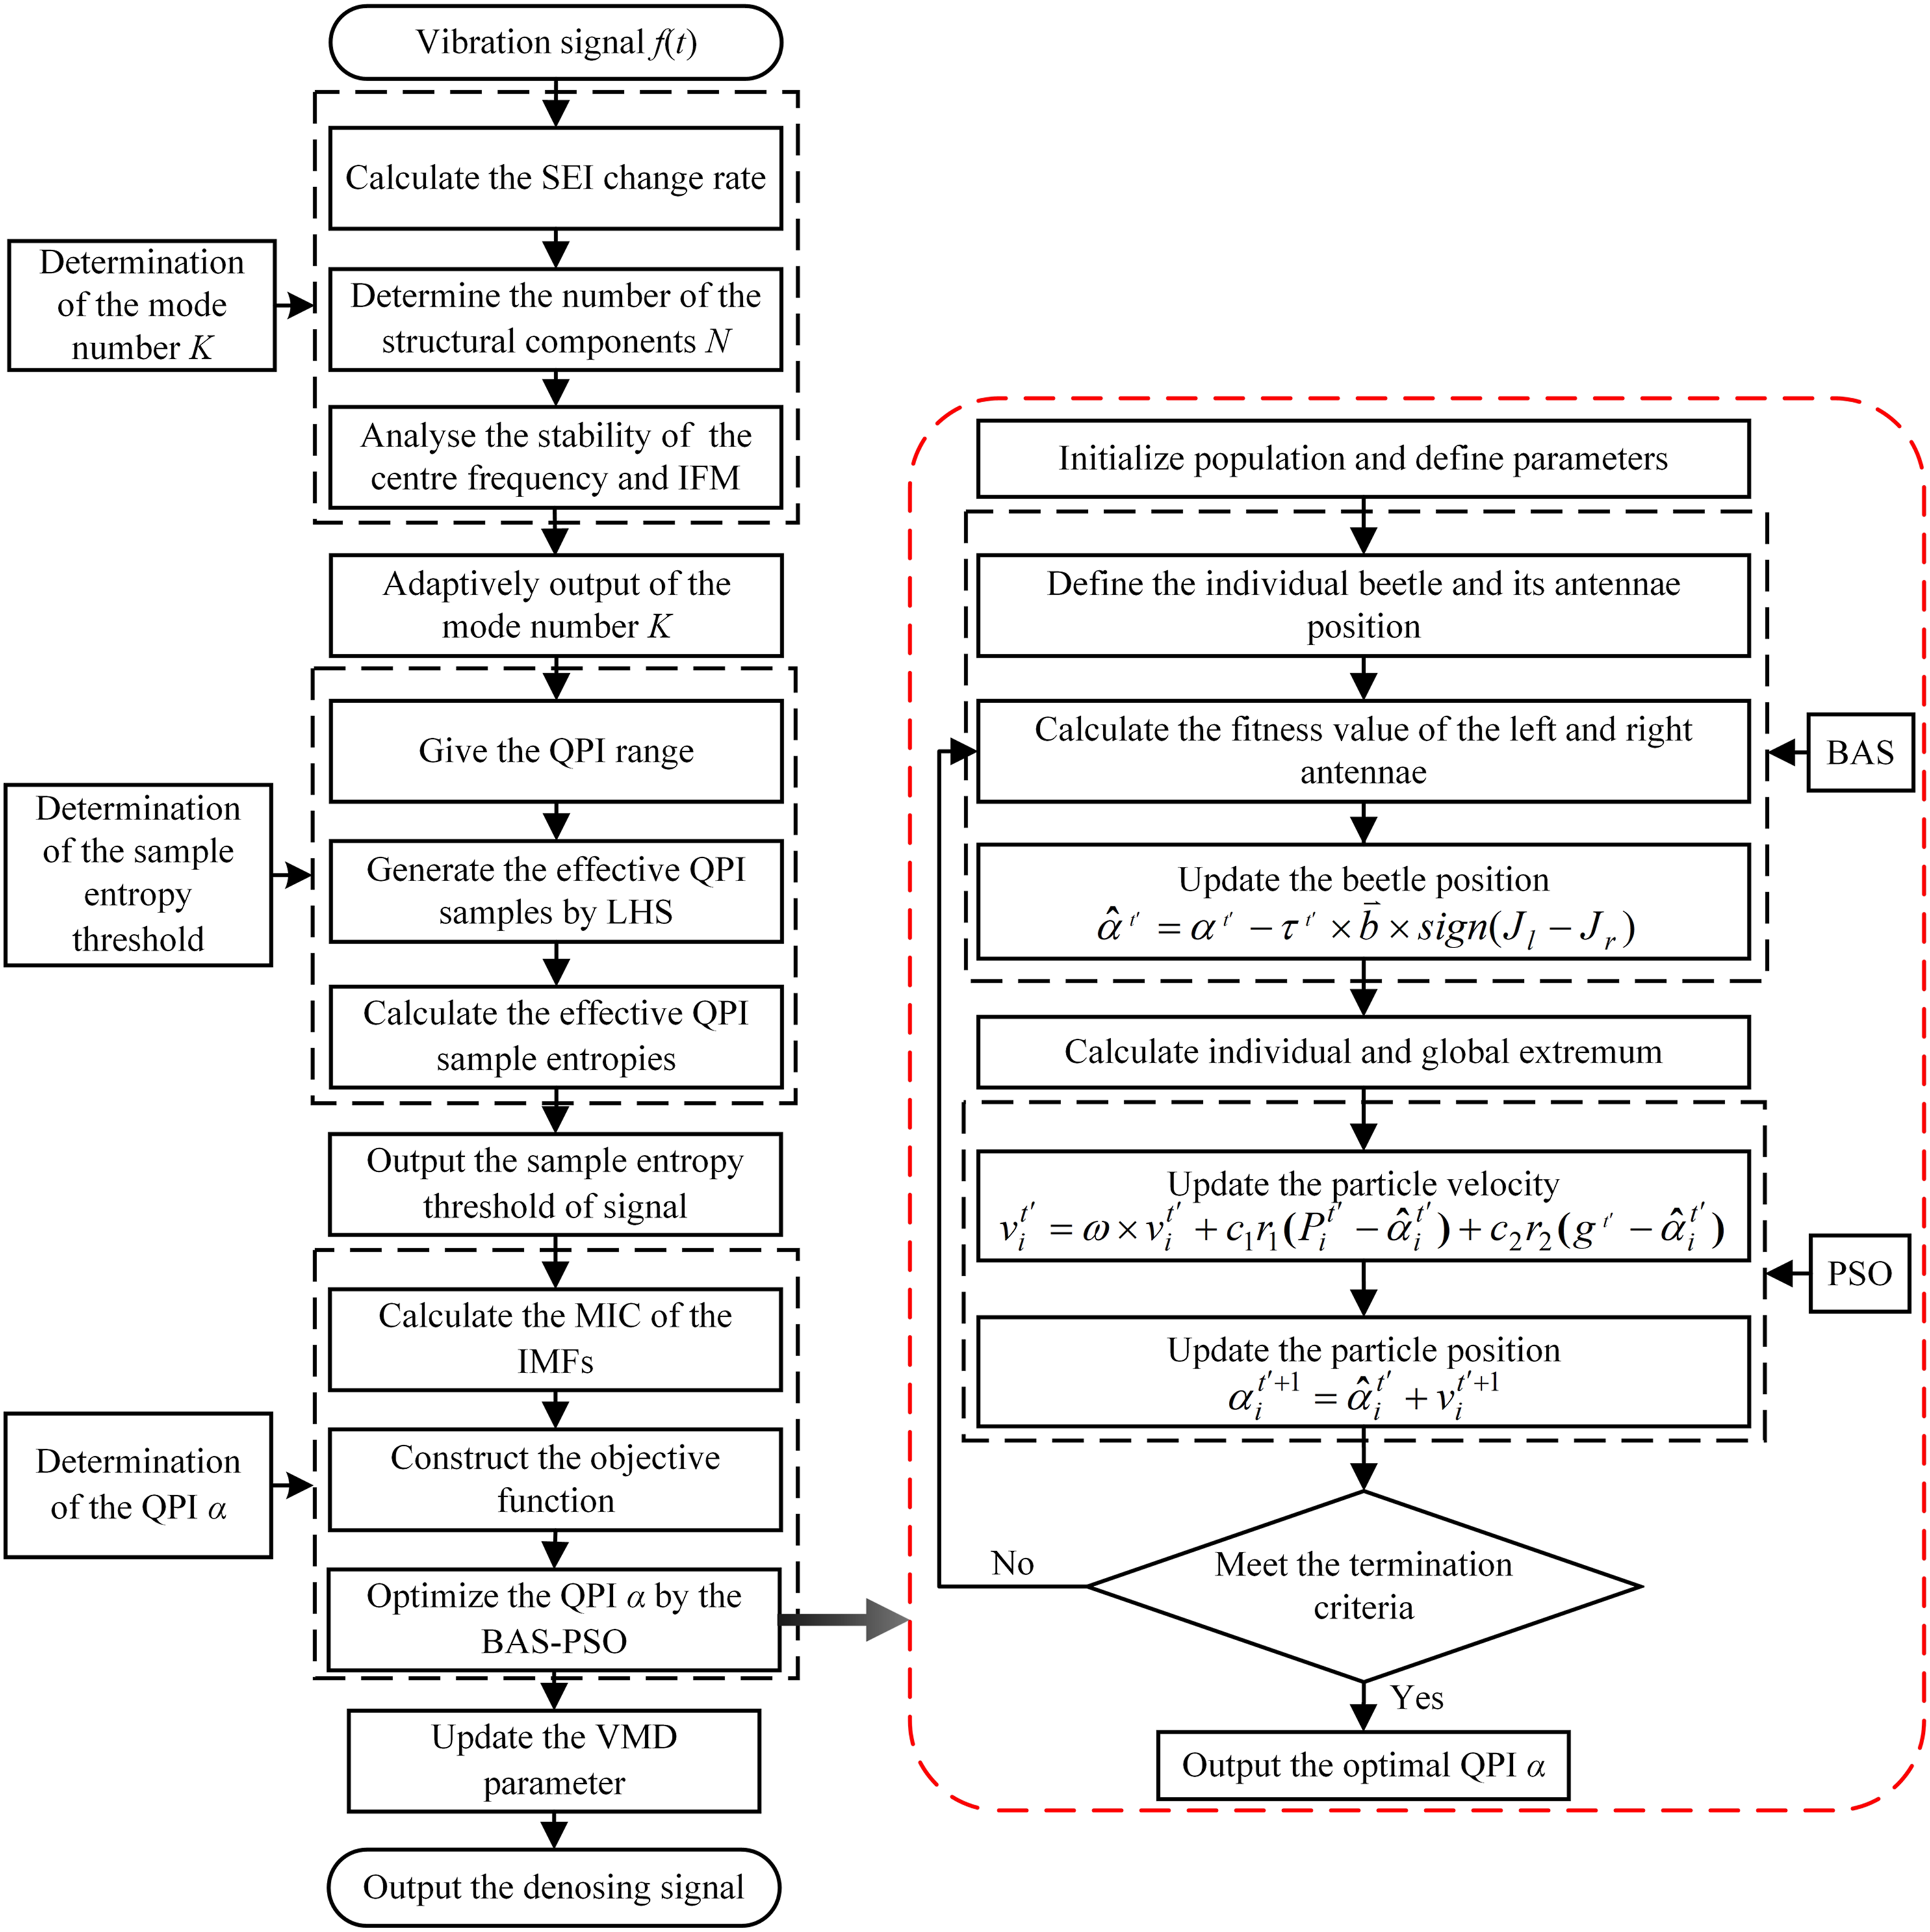
3. Simulation signal validation
According to the FDS vibration signal dense-frequency and high-frequency characteristics, a numerical simulation signal containing two DFCs, an HFC and random noise was constructed. The simulation signal Time history signals and power spectra of theoretical and noise signals.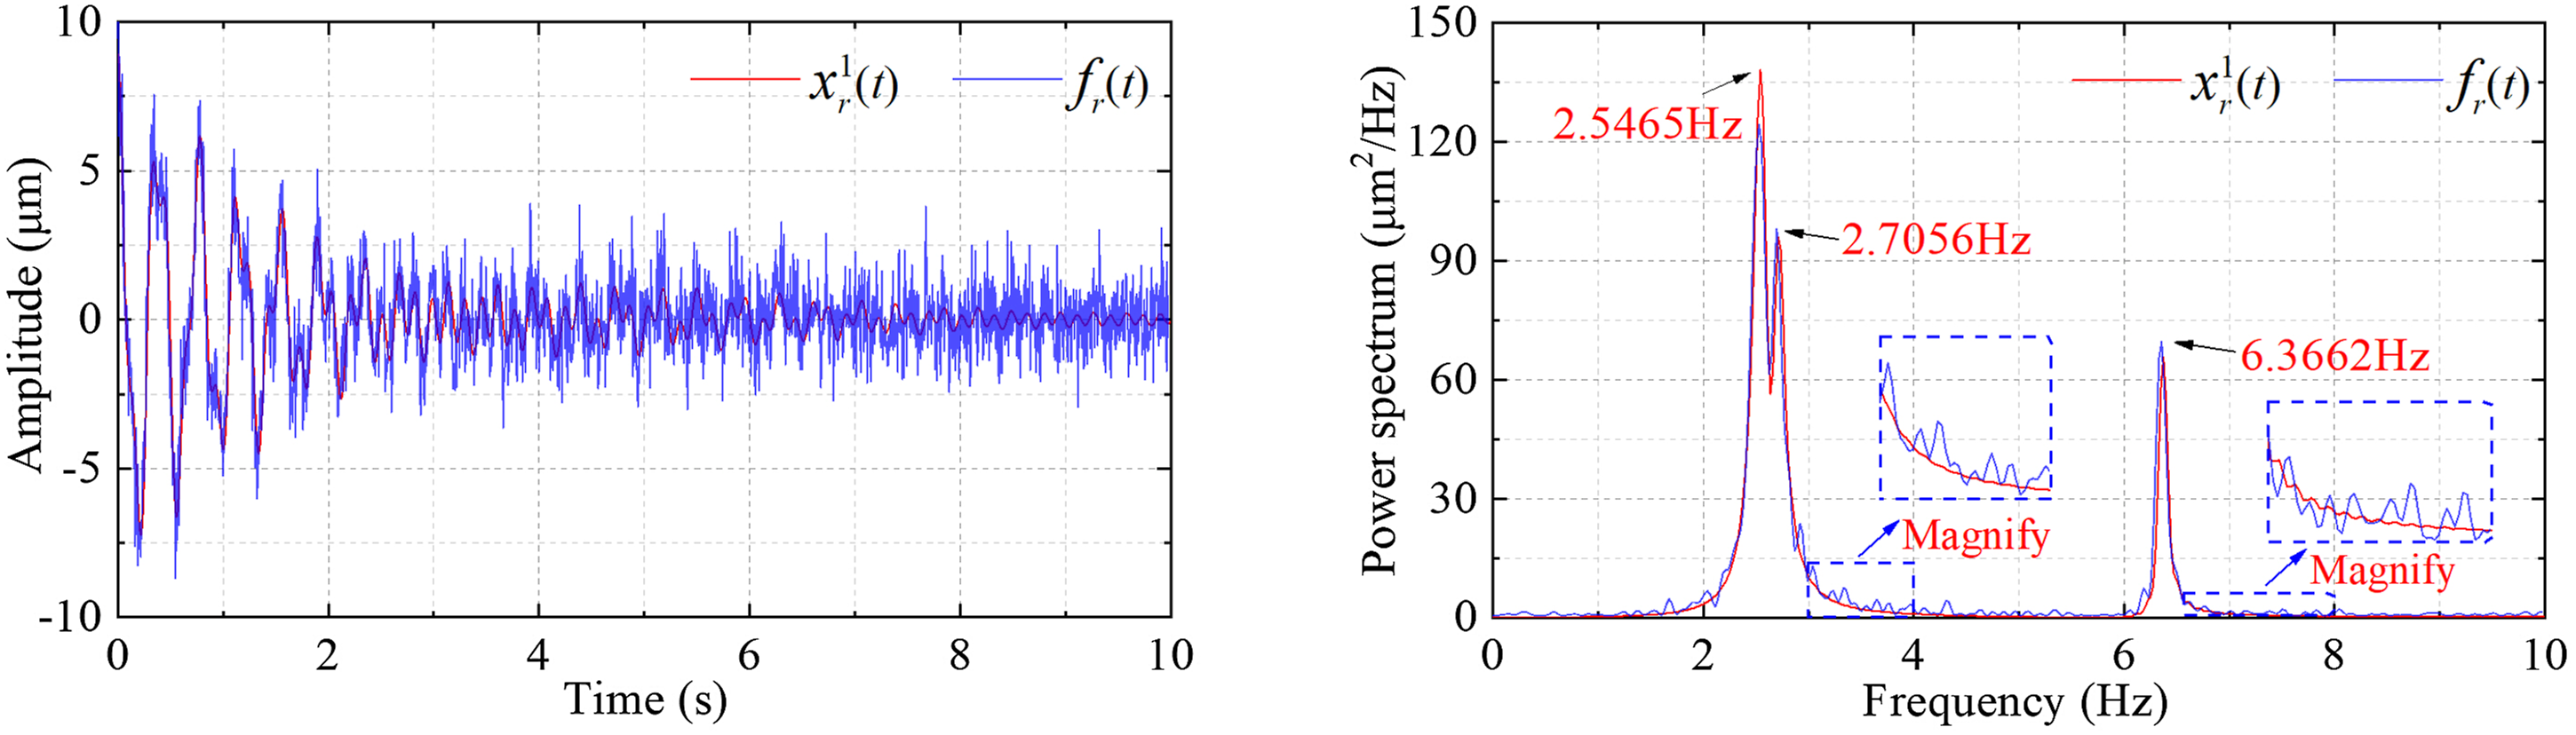


3.1. Simulation signal processing
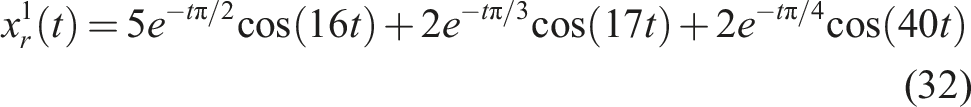
The simulation signal SEI and its change rate were calculated and are shown in Figure 3. When the order was 7, the SEI change rate met the threshold condition. When the system non-modal and conjugate terms were eliminated, the signal contained three effective signal components. The QPI was set to 3000, and Trend of the singular entropy increment and its change rate with signal order. Stabilisation diagram.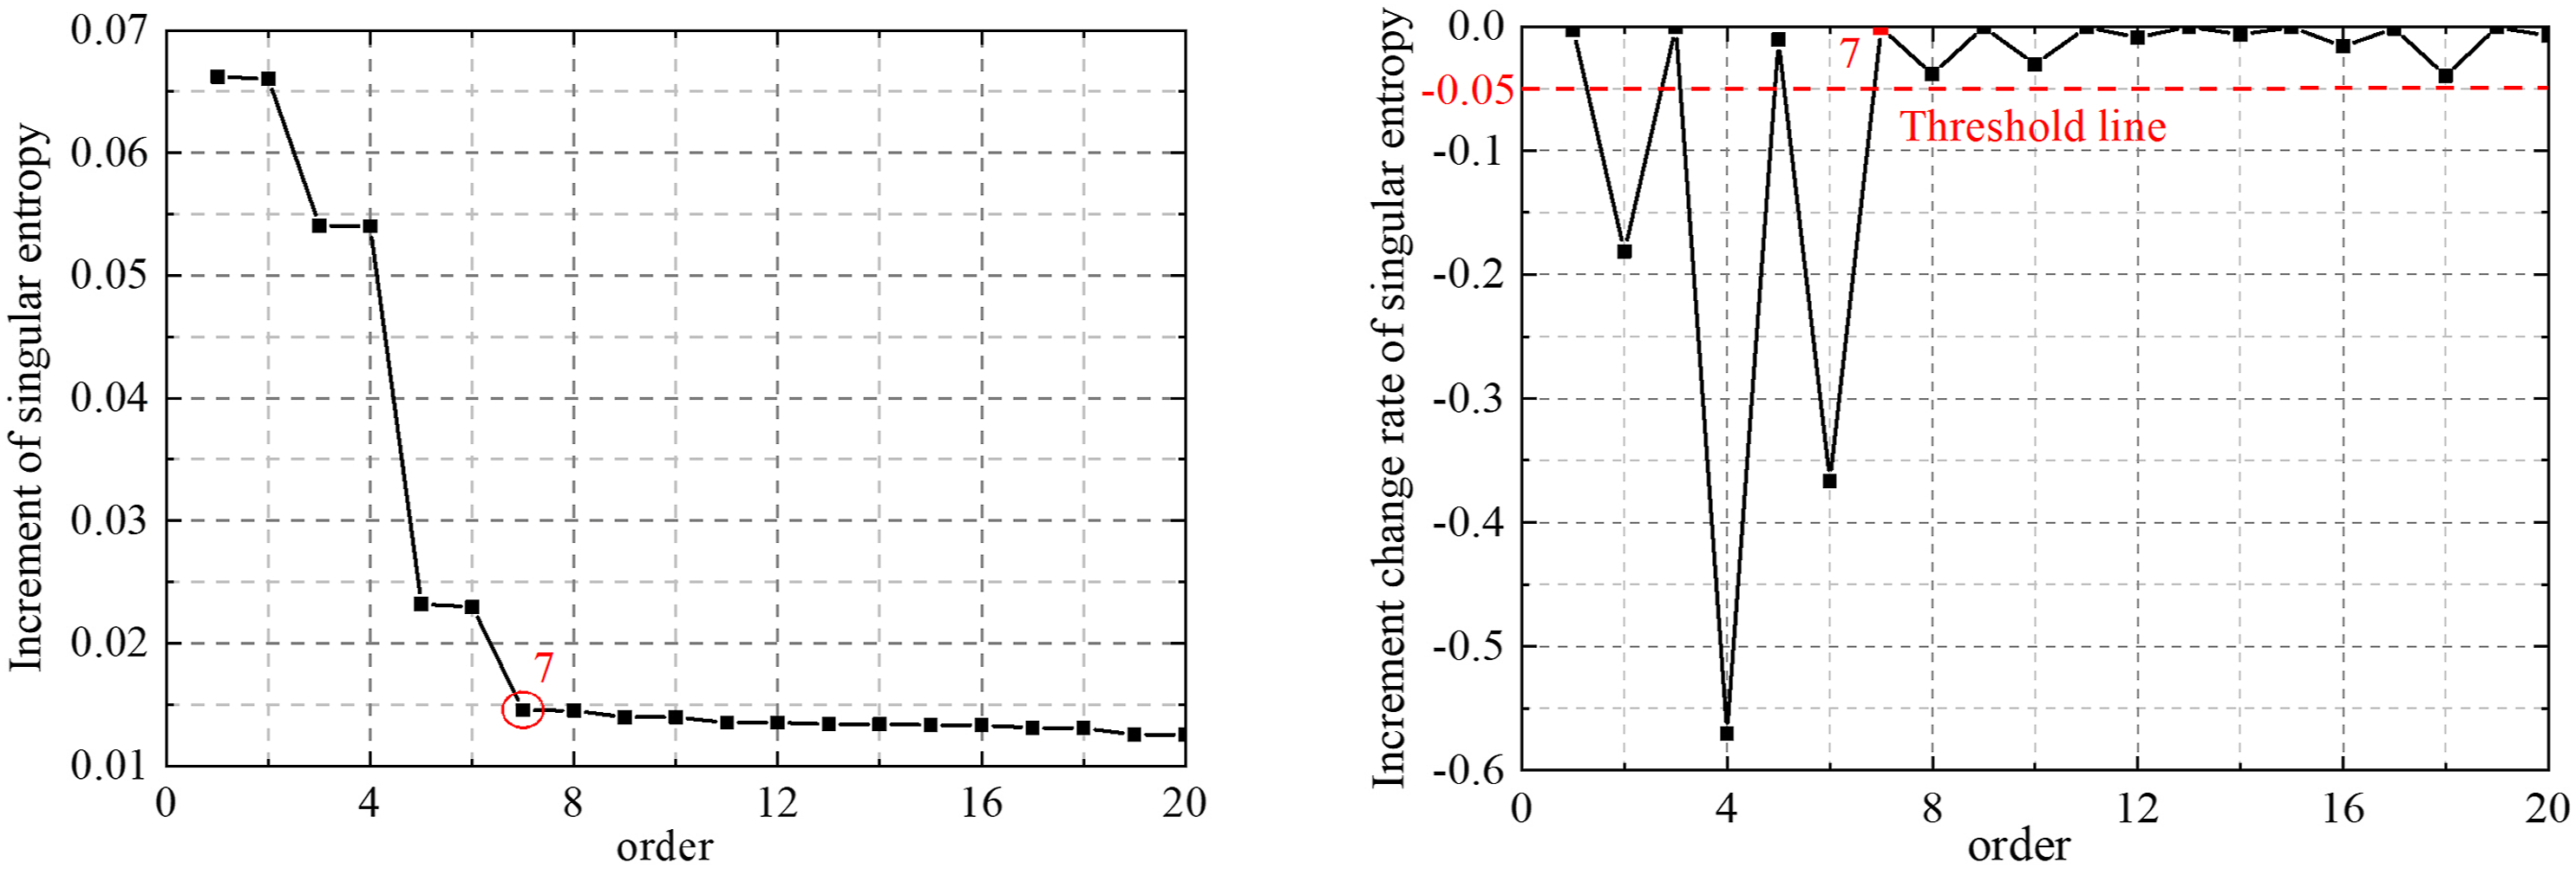
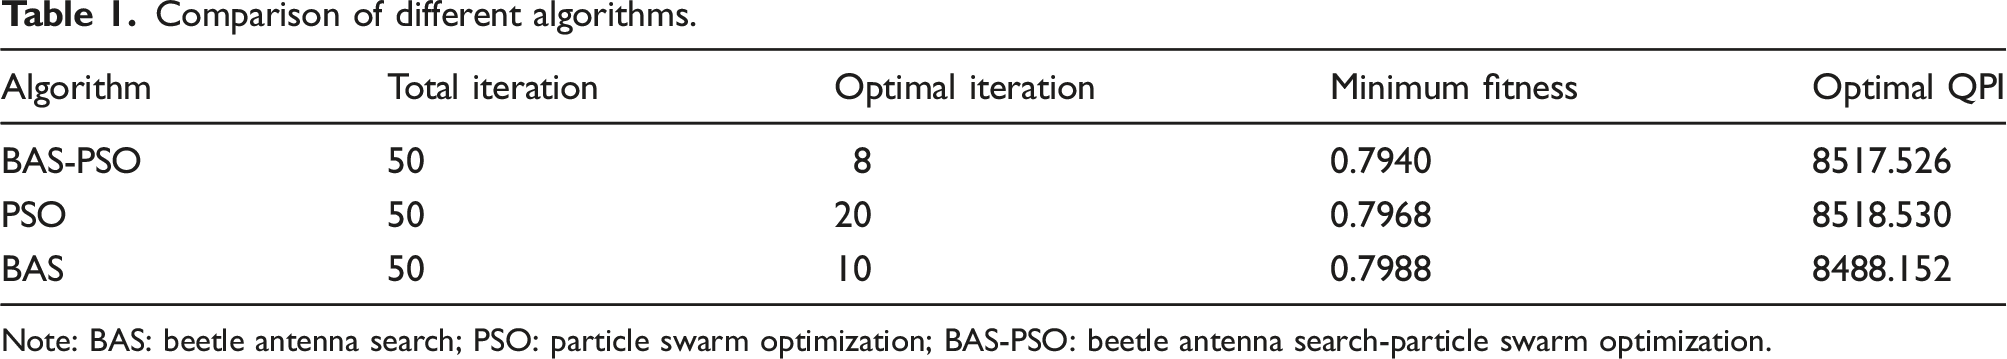
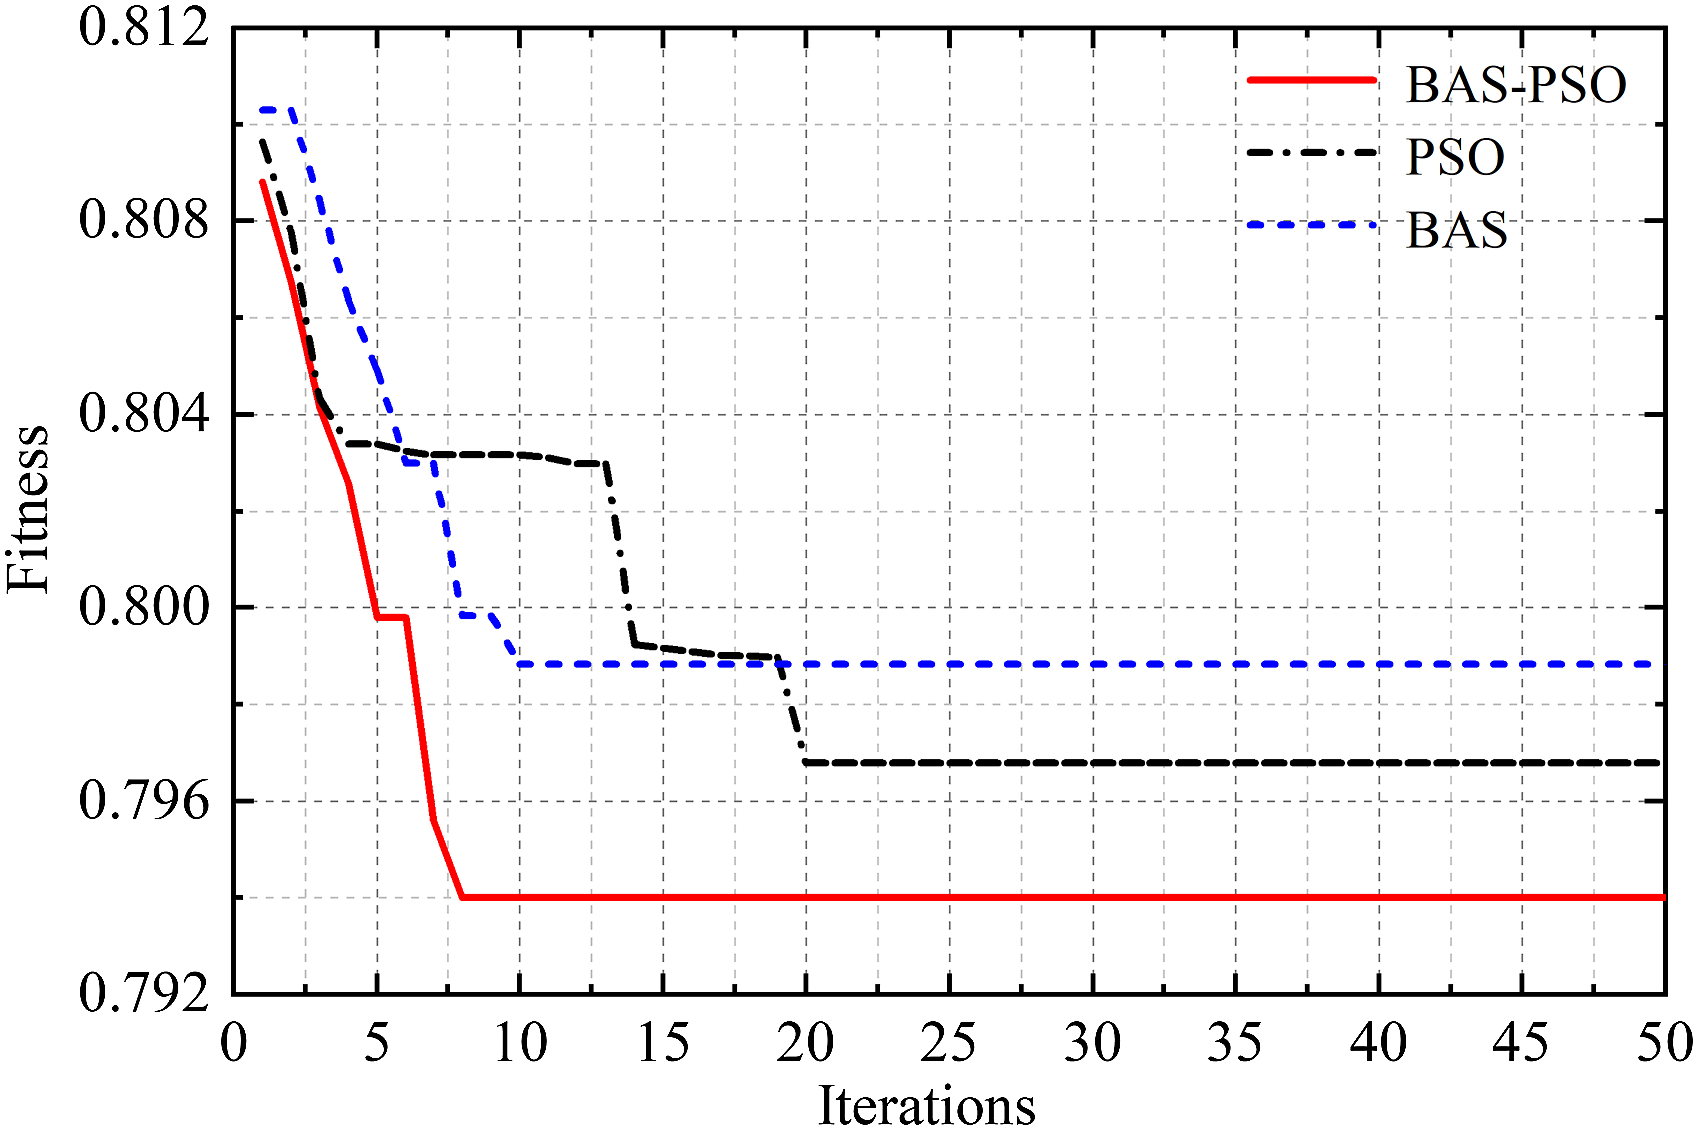
The QPI range was set to [1000, 10,000], and 100 effective QPI samples were generated (Figure 5). When the QPI was less than 2727.76 or greater than 8662.65, the effective samples could not be generated mainly because the QPI affected the component bandwidth, thereby resulting in insufficient or excessive signal decomposition. Thus, the sample entropy threshold was 0.8101. The QPI that satisfied the sample entropy threshold was used to obtain the corresponding structural vibration components and calculate their MICs. Then, three algorithms, namely, BAS-PSO, PSO and BAS, were used to optimise the QPI. The algorithm parameters were defined as follows: the particle swarms were 200; the distance between the left and right antennae was two; the step size range of was [0, 40]; the acceleration coefficients Sample entropy of effective signal components. Comparison of different algorithms. Note: BAS: beetle antenna search; PSO: particle swarm optimization; BAS-PSO: beetle antenna search-particle swarm optimization. Fitness convergence curves.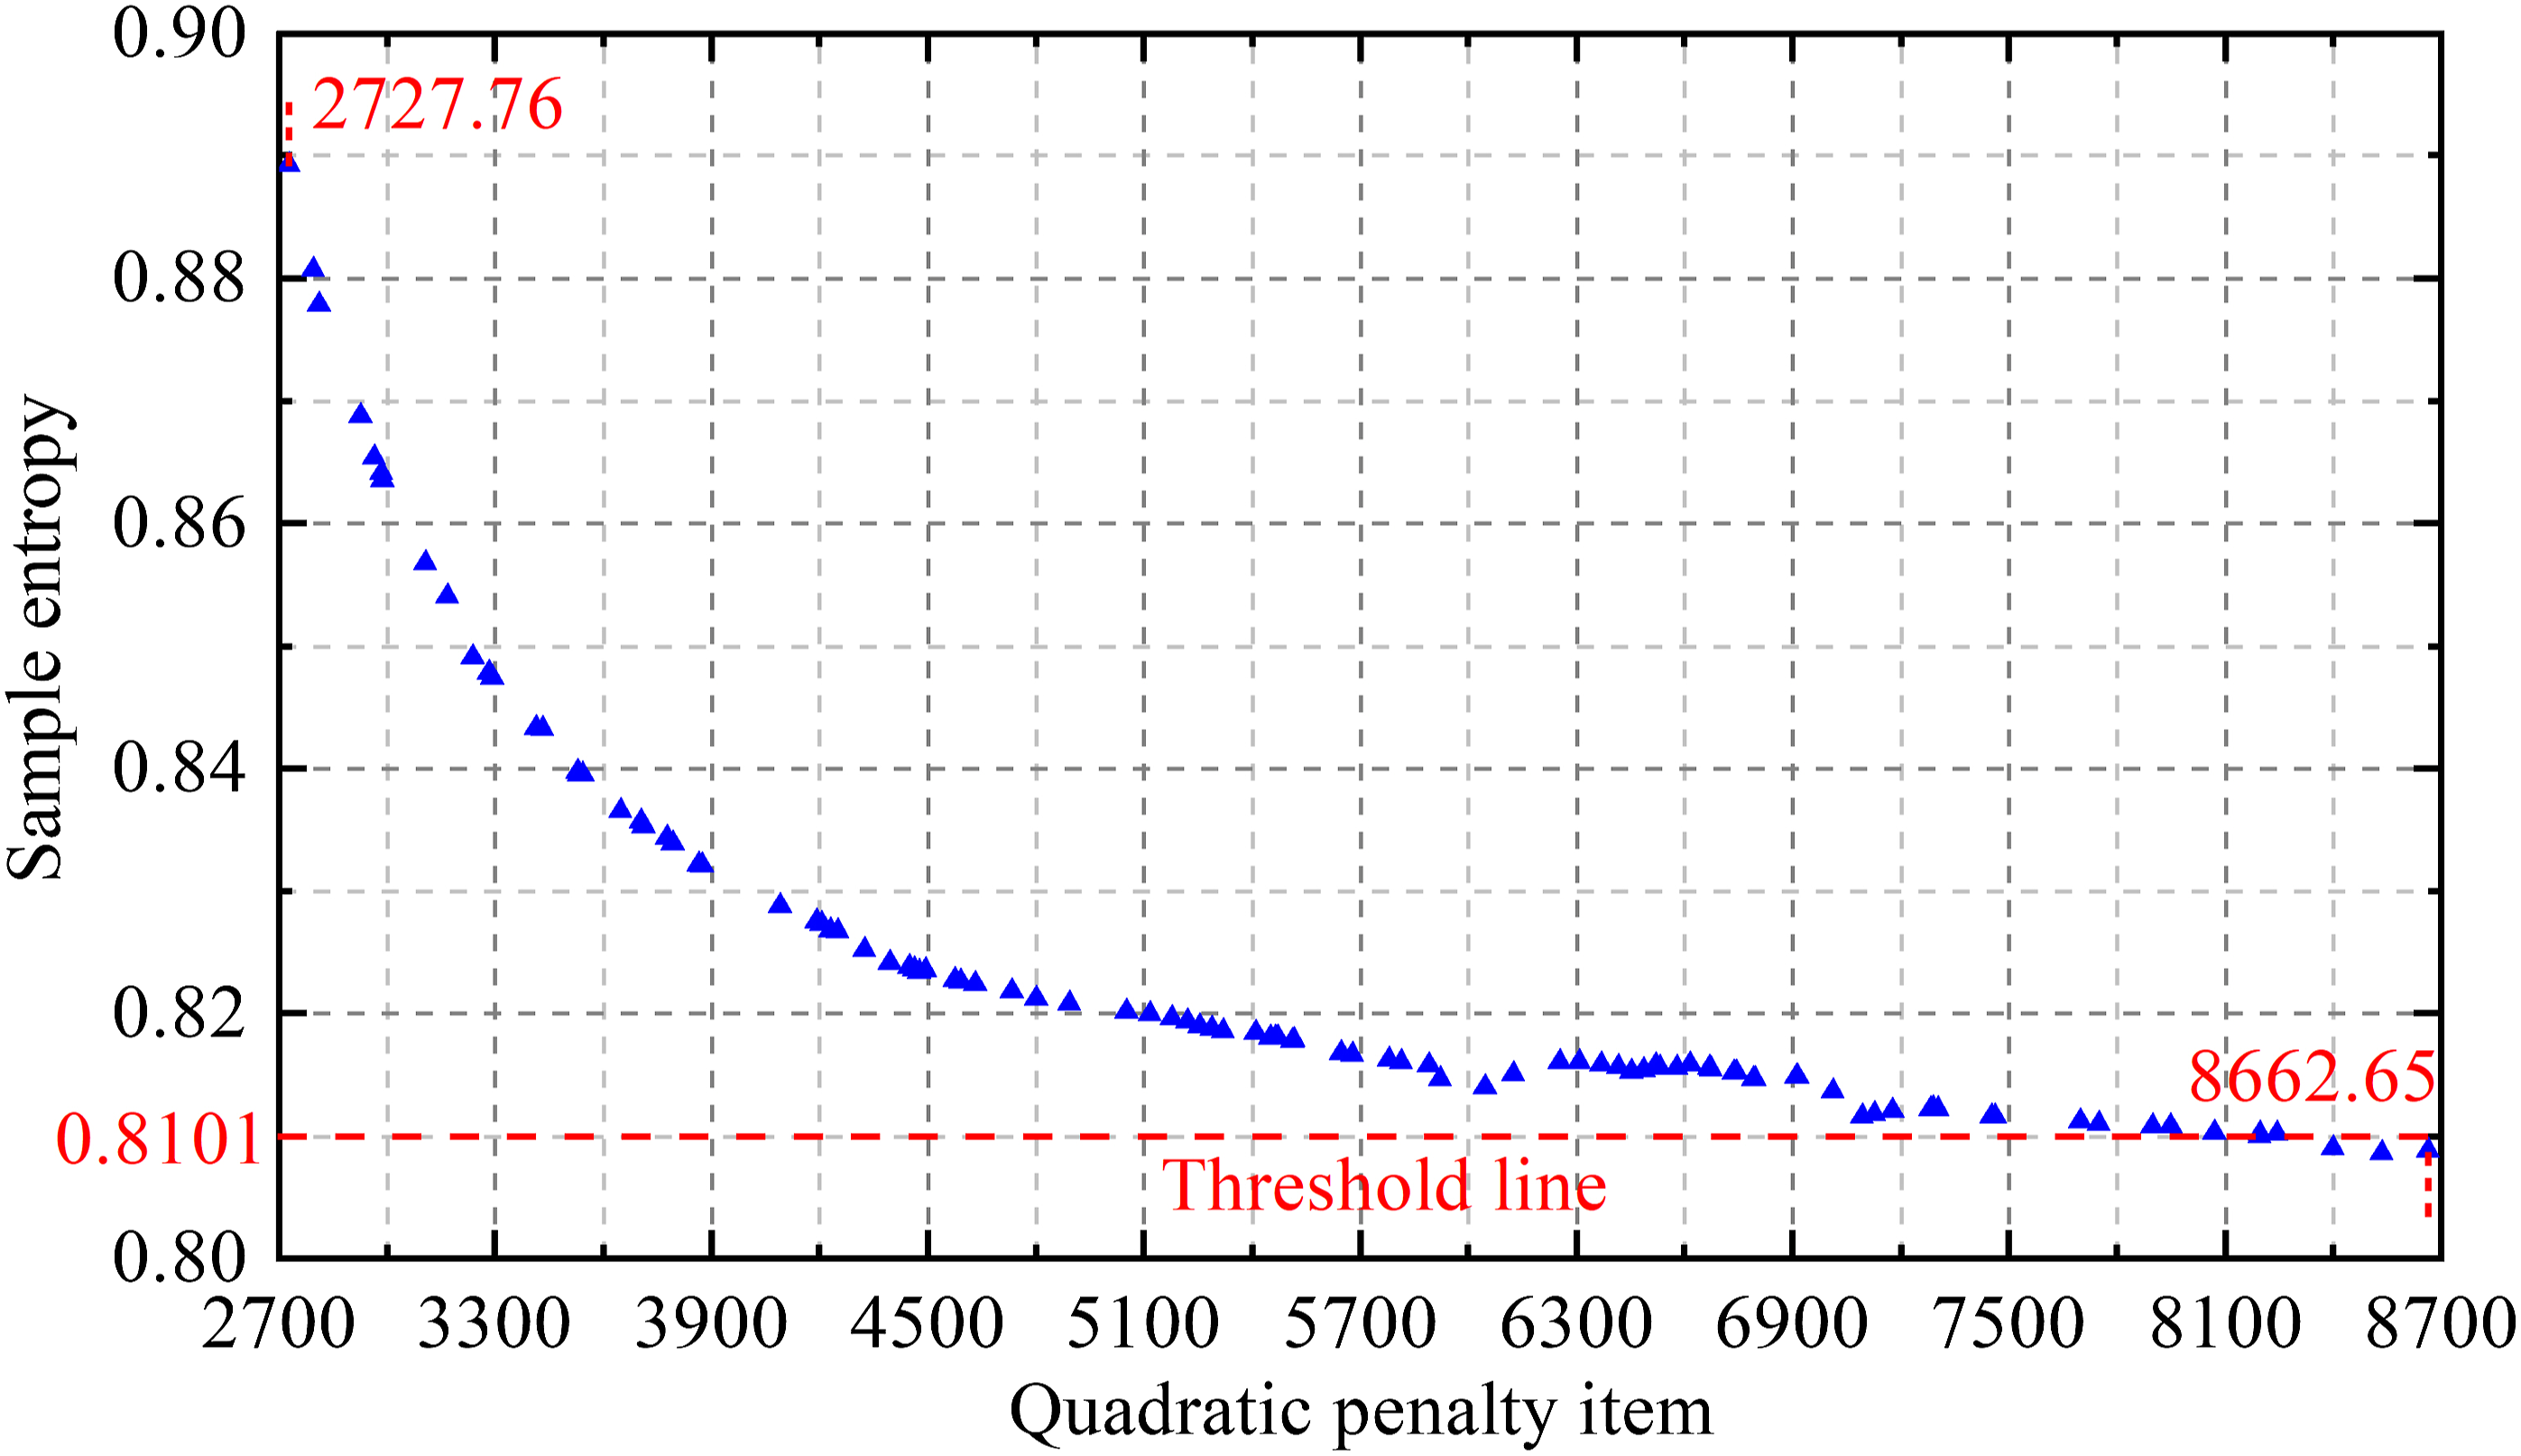
3.2. Simulation signal result analysis

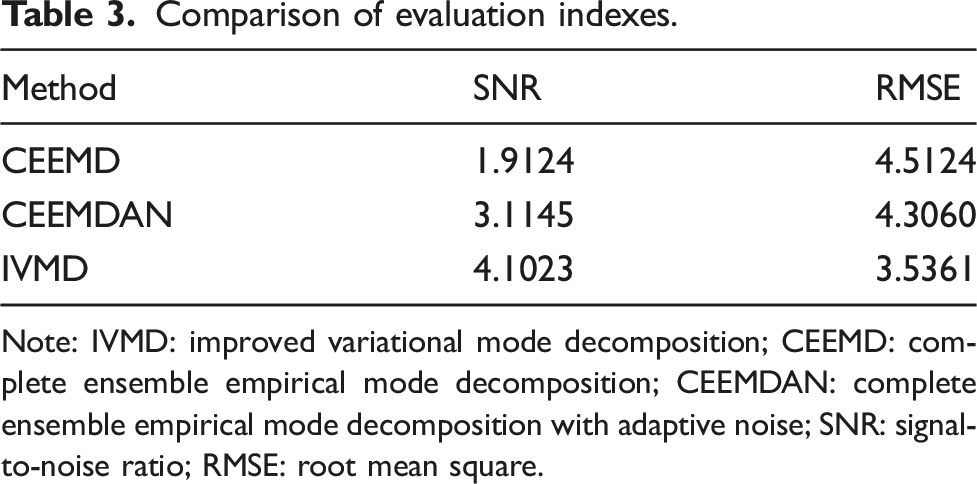
Comparison of evaluation indexes.
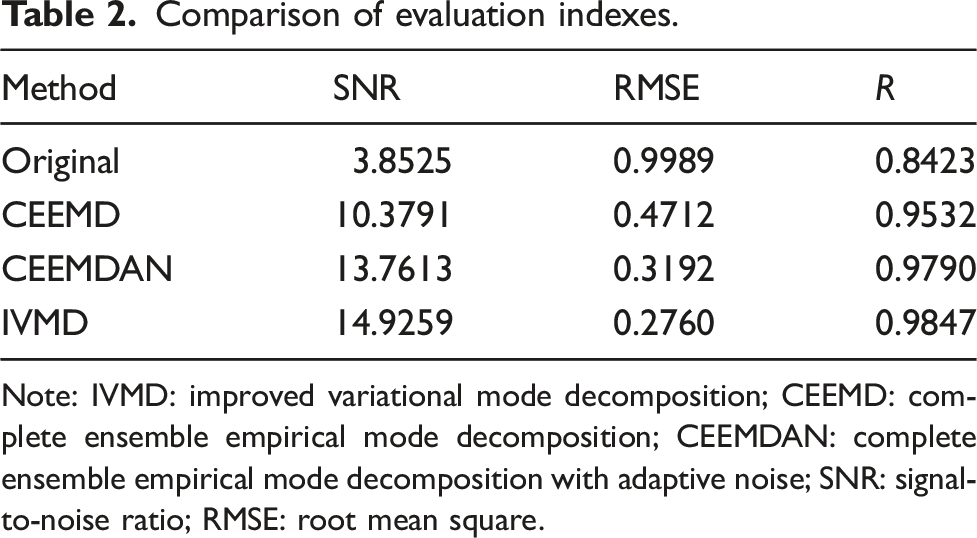
Note: IVMD: improved variational mode decomposition; CEEMD: complete ensemble empirical mode decomposition; CEEMDAN: complete ensemble empirical mode decomposition with adaptive noise; SNR: signal-to-noise ratio; RMSE: root mean square.
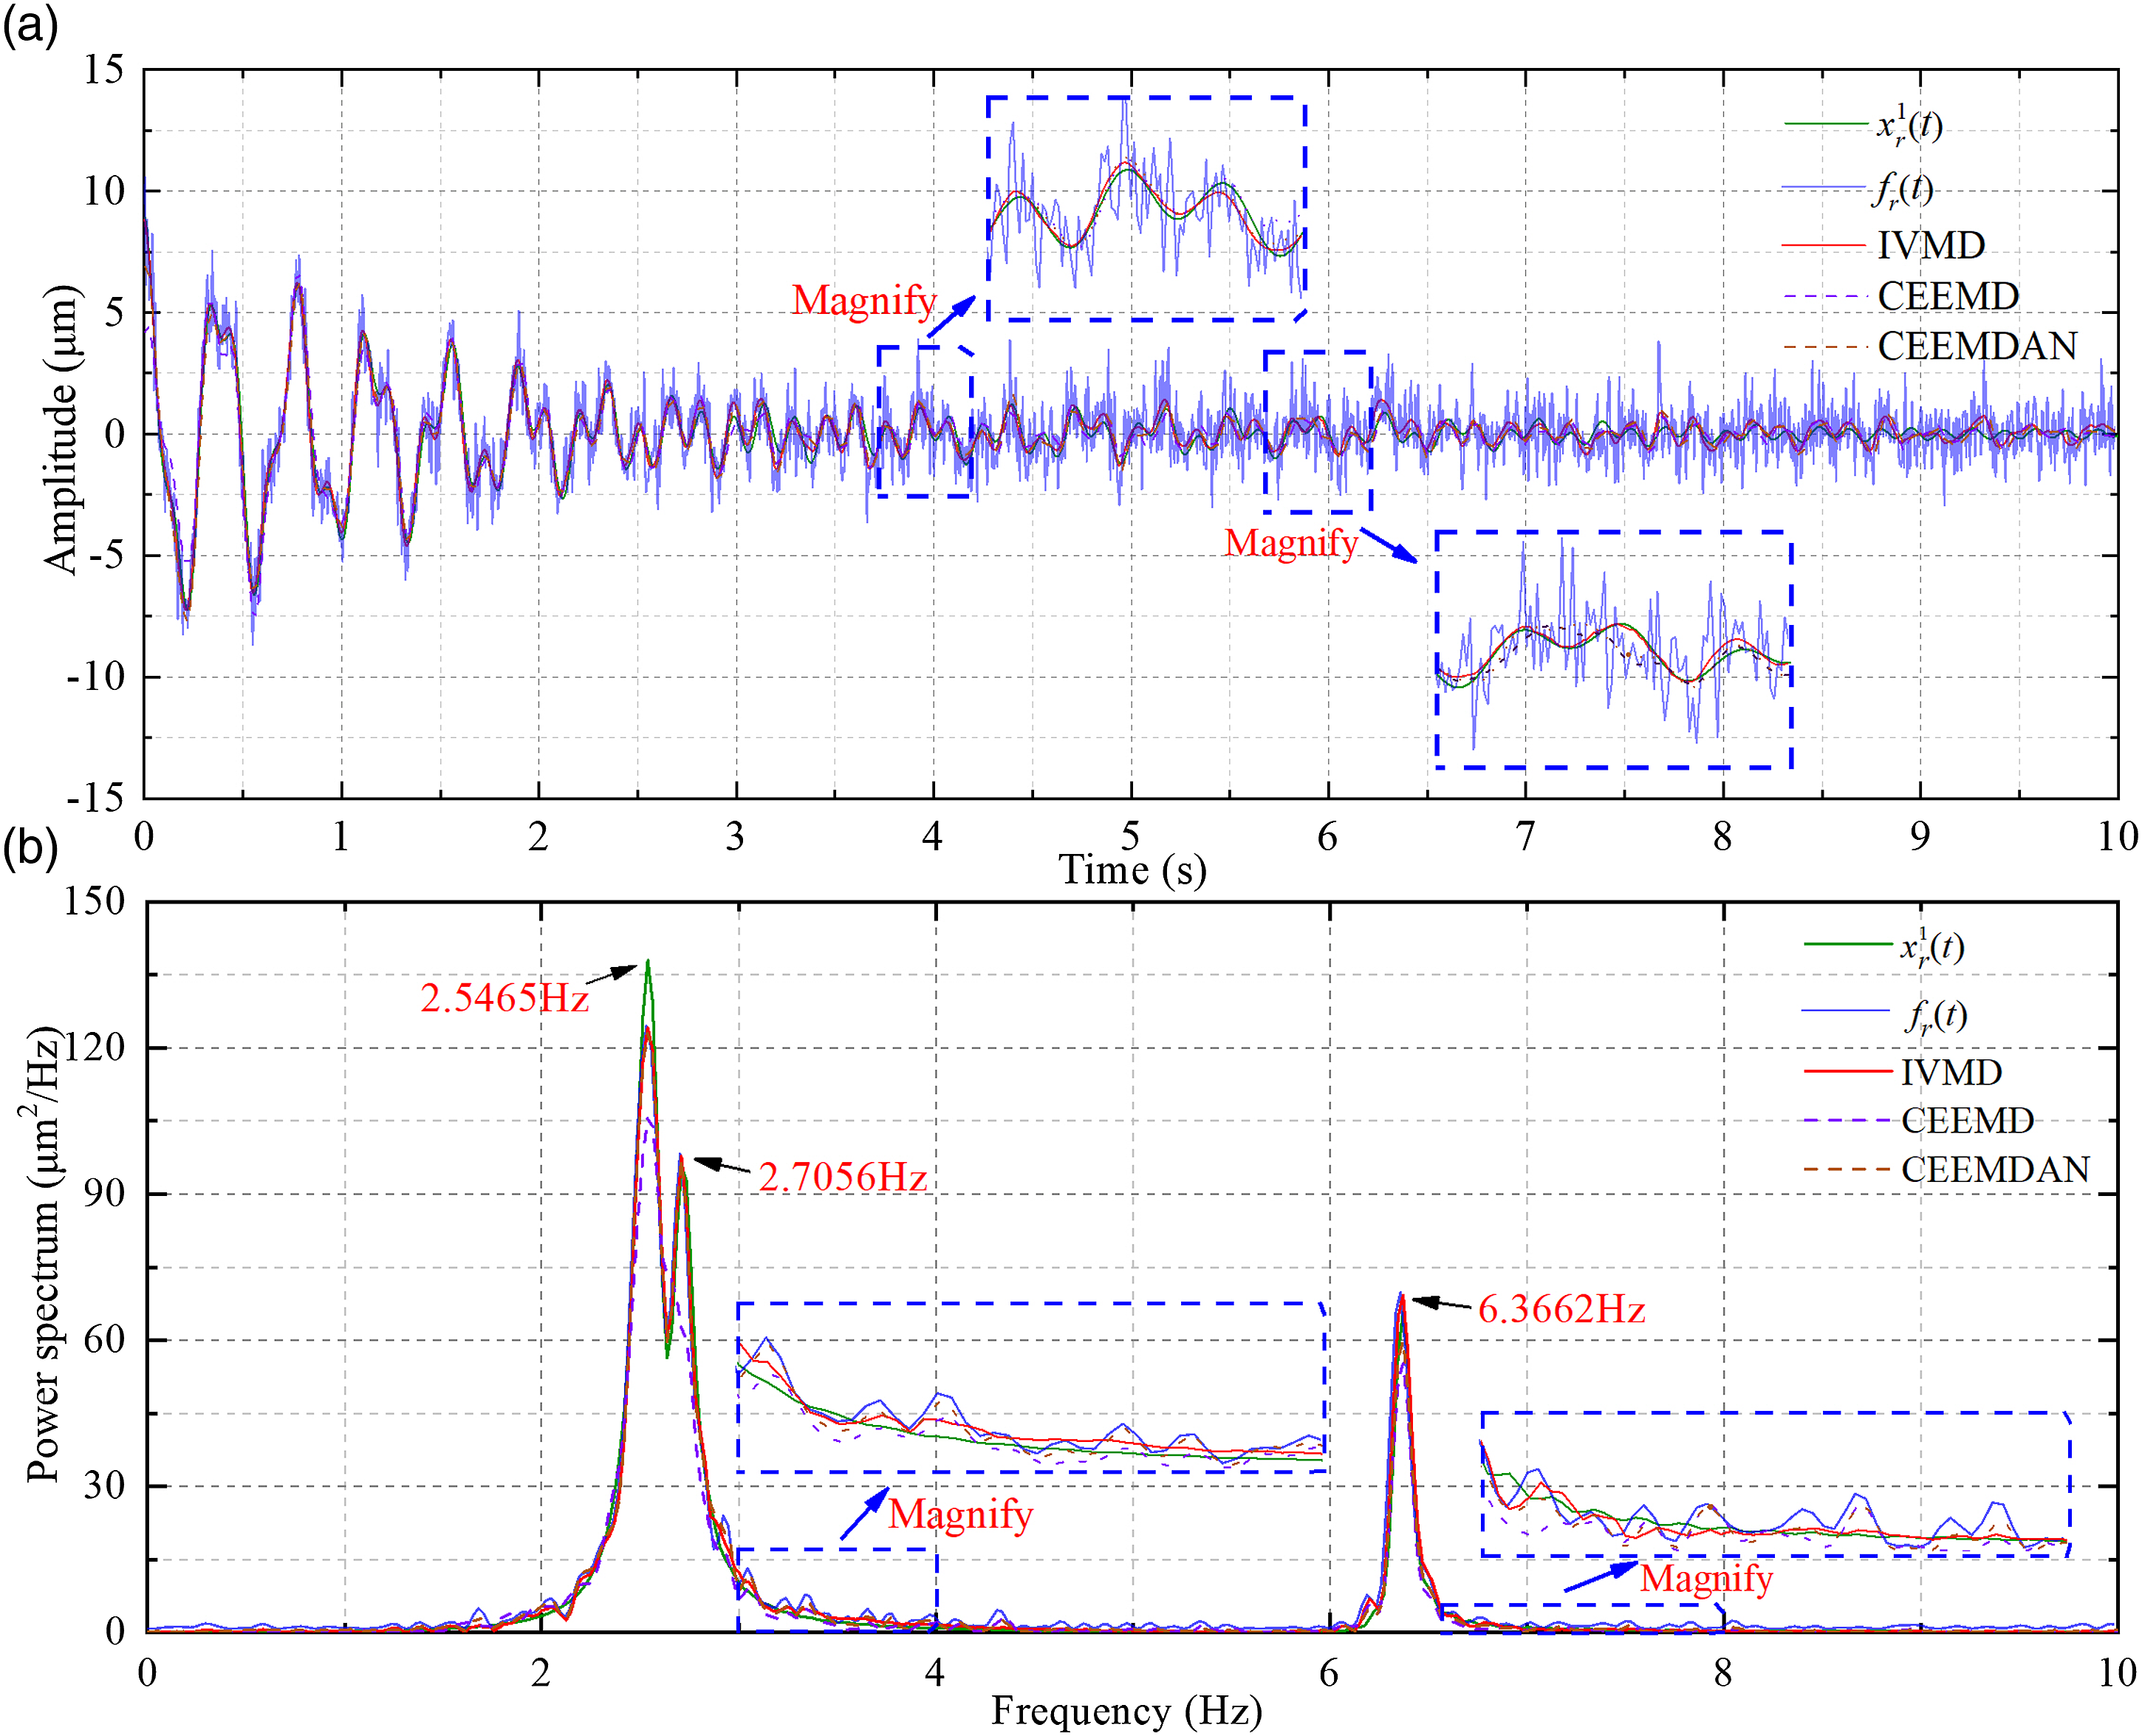
Comparison of time history signals and power spectra. (a) Time history signals and (b) power spectra.
The third-order stable components decomposed by IVMD were compared with the pure signal components to evaluate the performance, extract the HFC and separate the DFC further. The time history signal and power spectra comparisons are presented in Figure 8. This showed that IVMD had better resolution capabilities to reduce modal mixing. Comparison of the components using three methods. (a) Time history signals by IVMD, (b) power spectra by IVMD, (c) time history signals by CEEMD, (d) power spectra by CEEMD, (e) time history signals by CEEMDAN and (f) power spectra by CEEMDAN. Note: IVMD: improved variational mode decomposition; CEEMD: complete ensemble empirical mode decomposition; CEEMDAN: complete ensemble empirical mode decomposition with adaptive noise.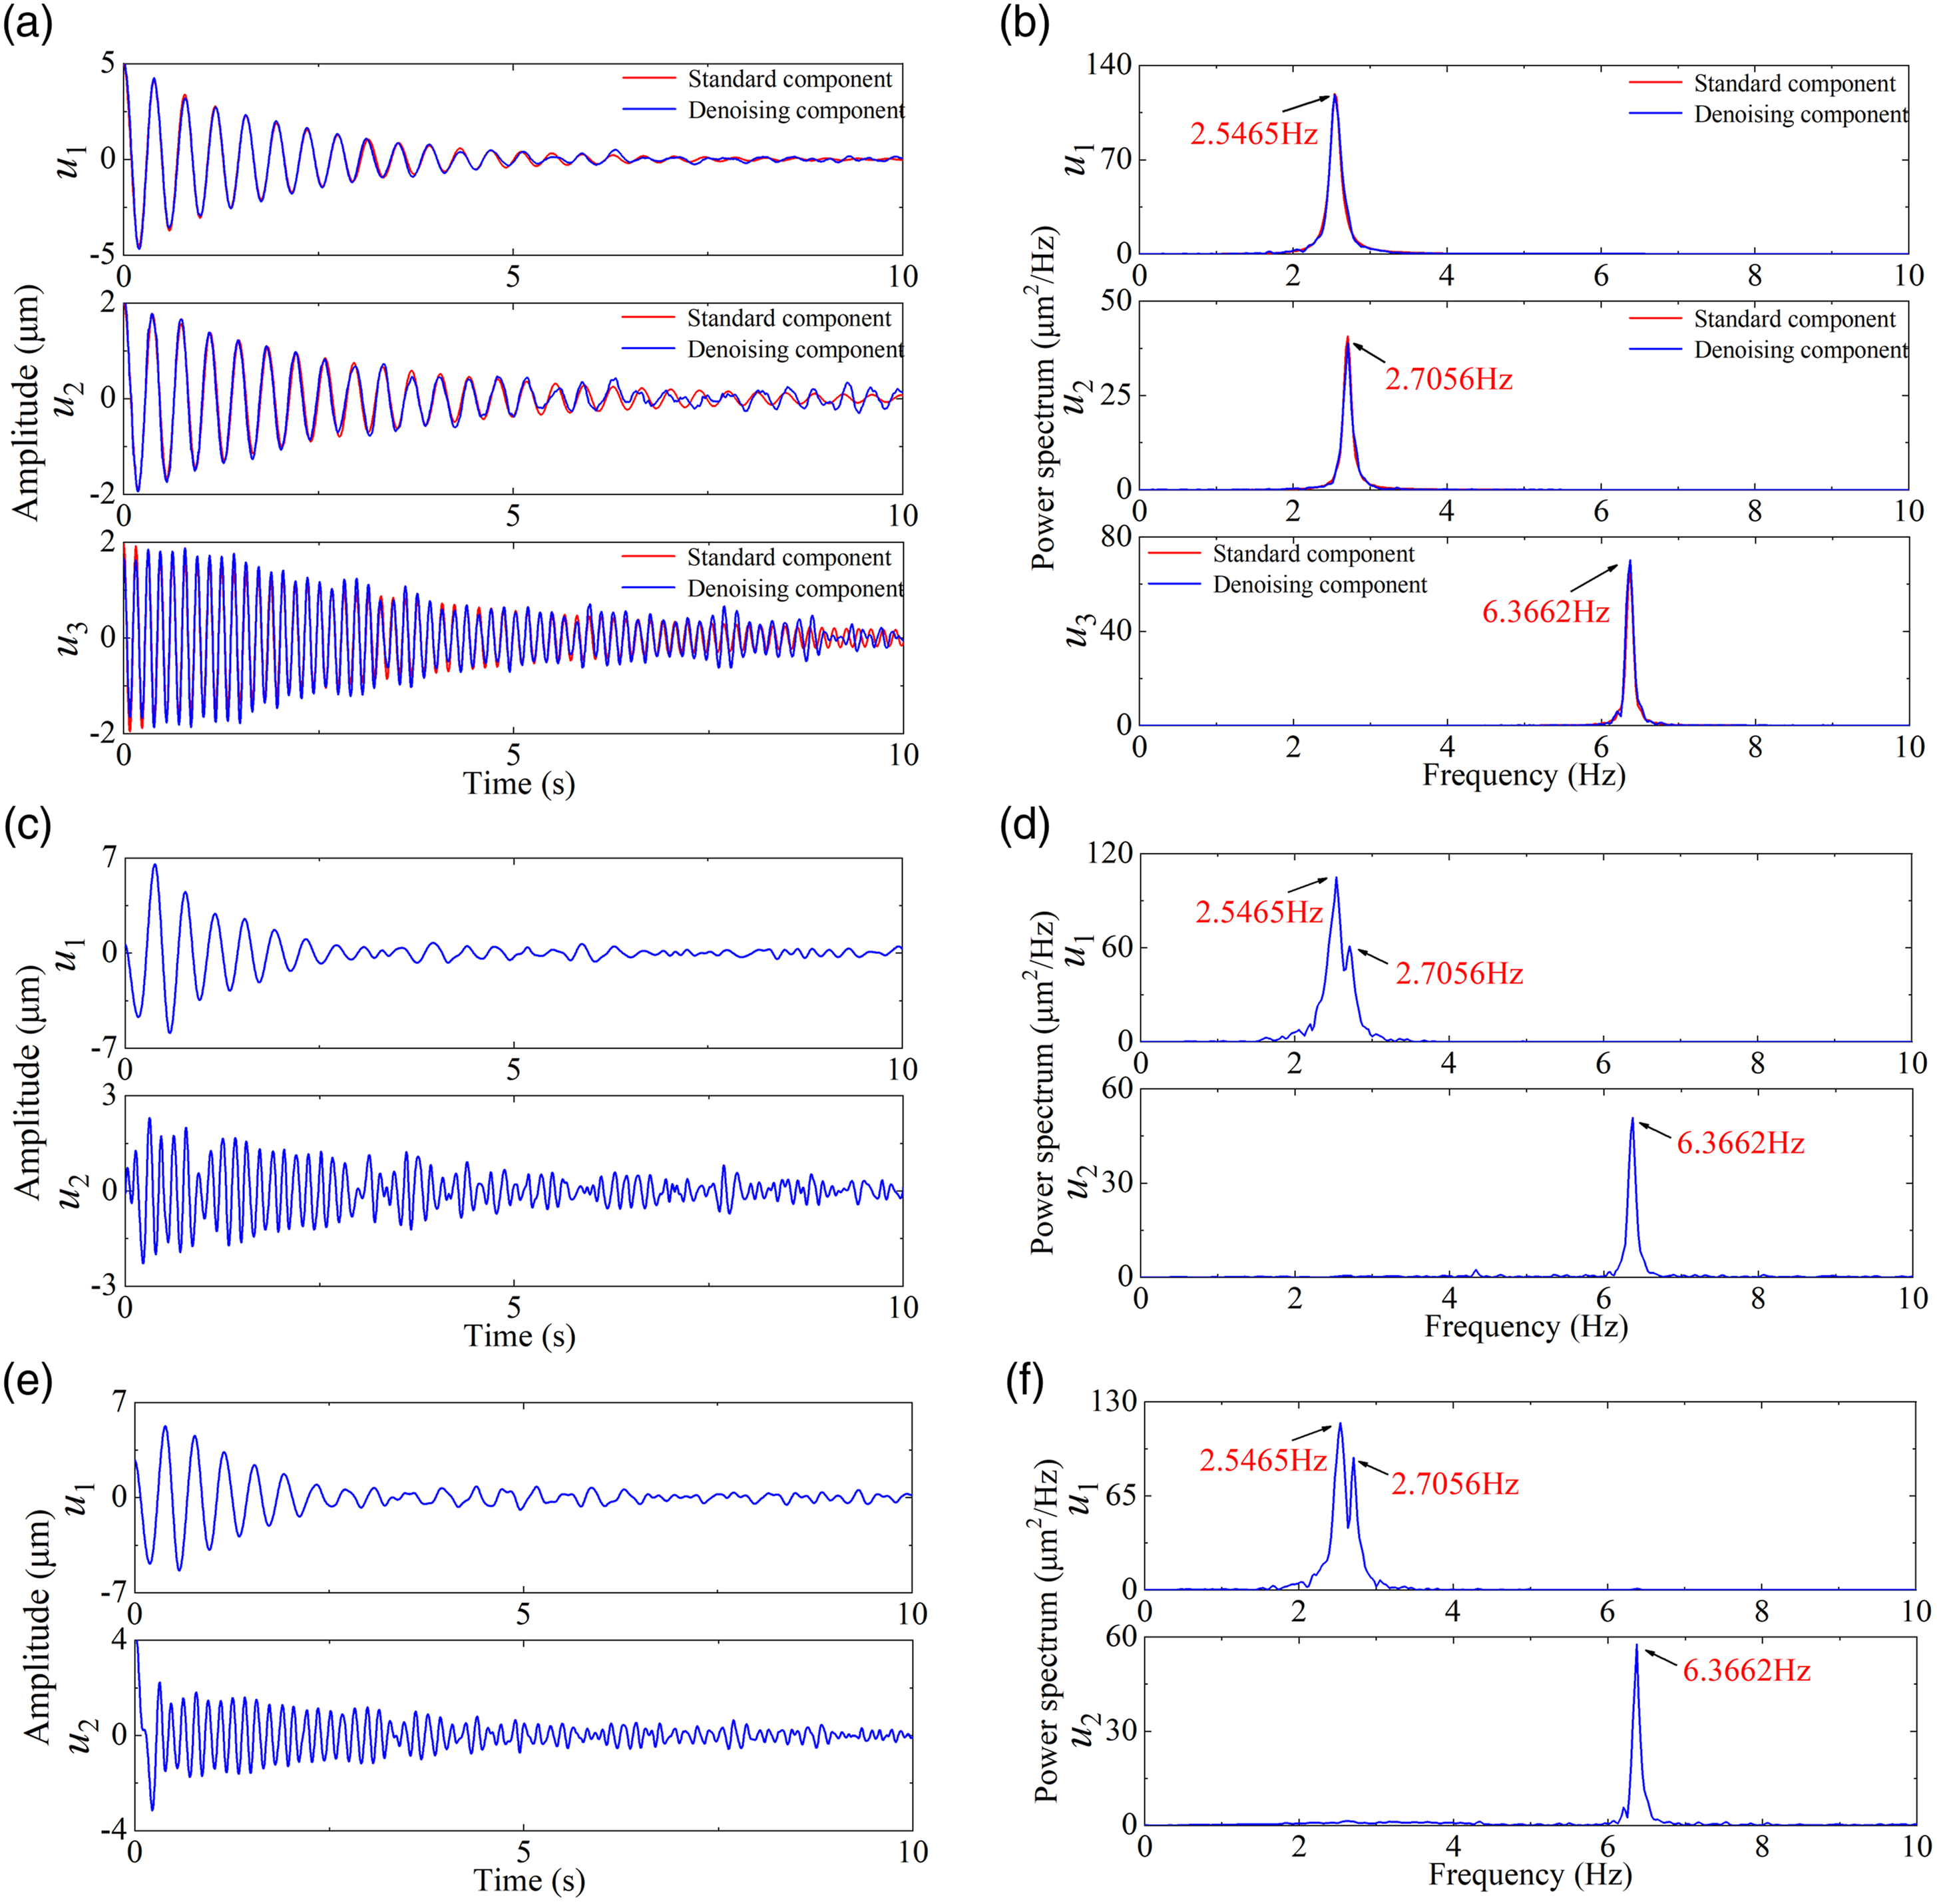
Numerical simulation signal verification showed that the IVMD adaptively determined the optimal
4. Engineering case
4.1. Vibration tests
Shuhe Hydropower Station is a large-scale hydropower station that consists of the powerhouse dam on the left and the five sluice gates on the right. The length, width and height of the sluice orifice are 54, 13 and 23.8 m, respectively. The pier thickness is 4.5 m. The right and left sluice piers of the #2 sluice orifice from left to right were selected as the test objects in the prototype vibration tests. As shown in Figure 9, eight measuring points were arranged on the top of the sluice piers. The dynamic displacement direction was transverse to the flow direction. The vibration sensor was a DP-type dynamic displacement sensor. The sampling frequency was 50 Hz, the sampling time was 80 s and the physical principle and sensor parameters were explained in the literature (Yan et al., 2000; Yang and Zhang, 1997). Sensor arrangement. (a) 3-D diagram and (b) top view.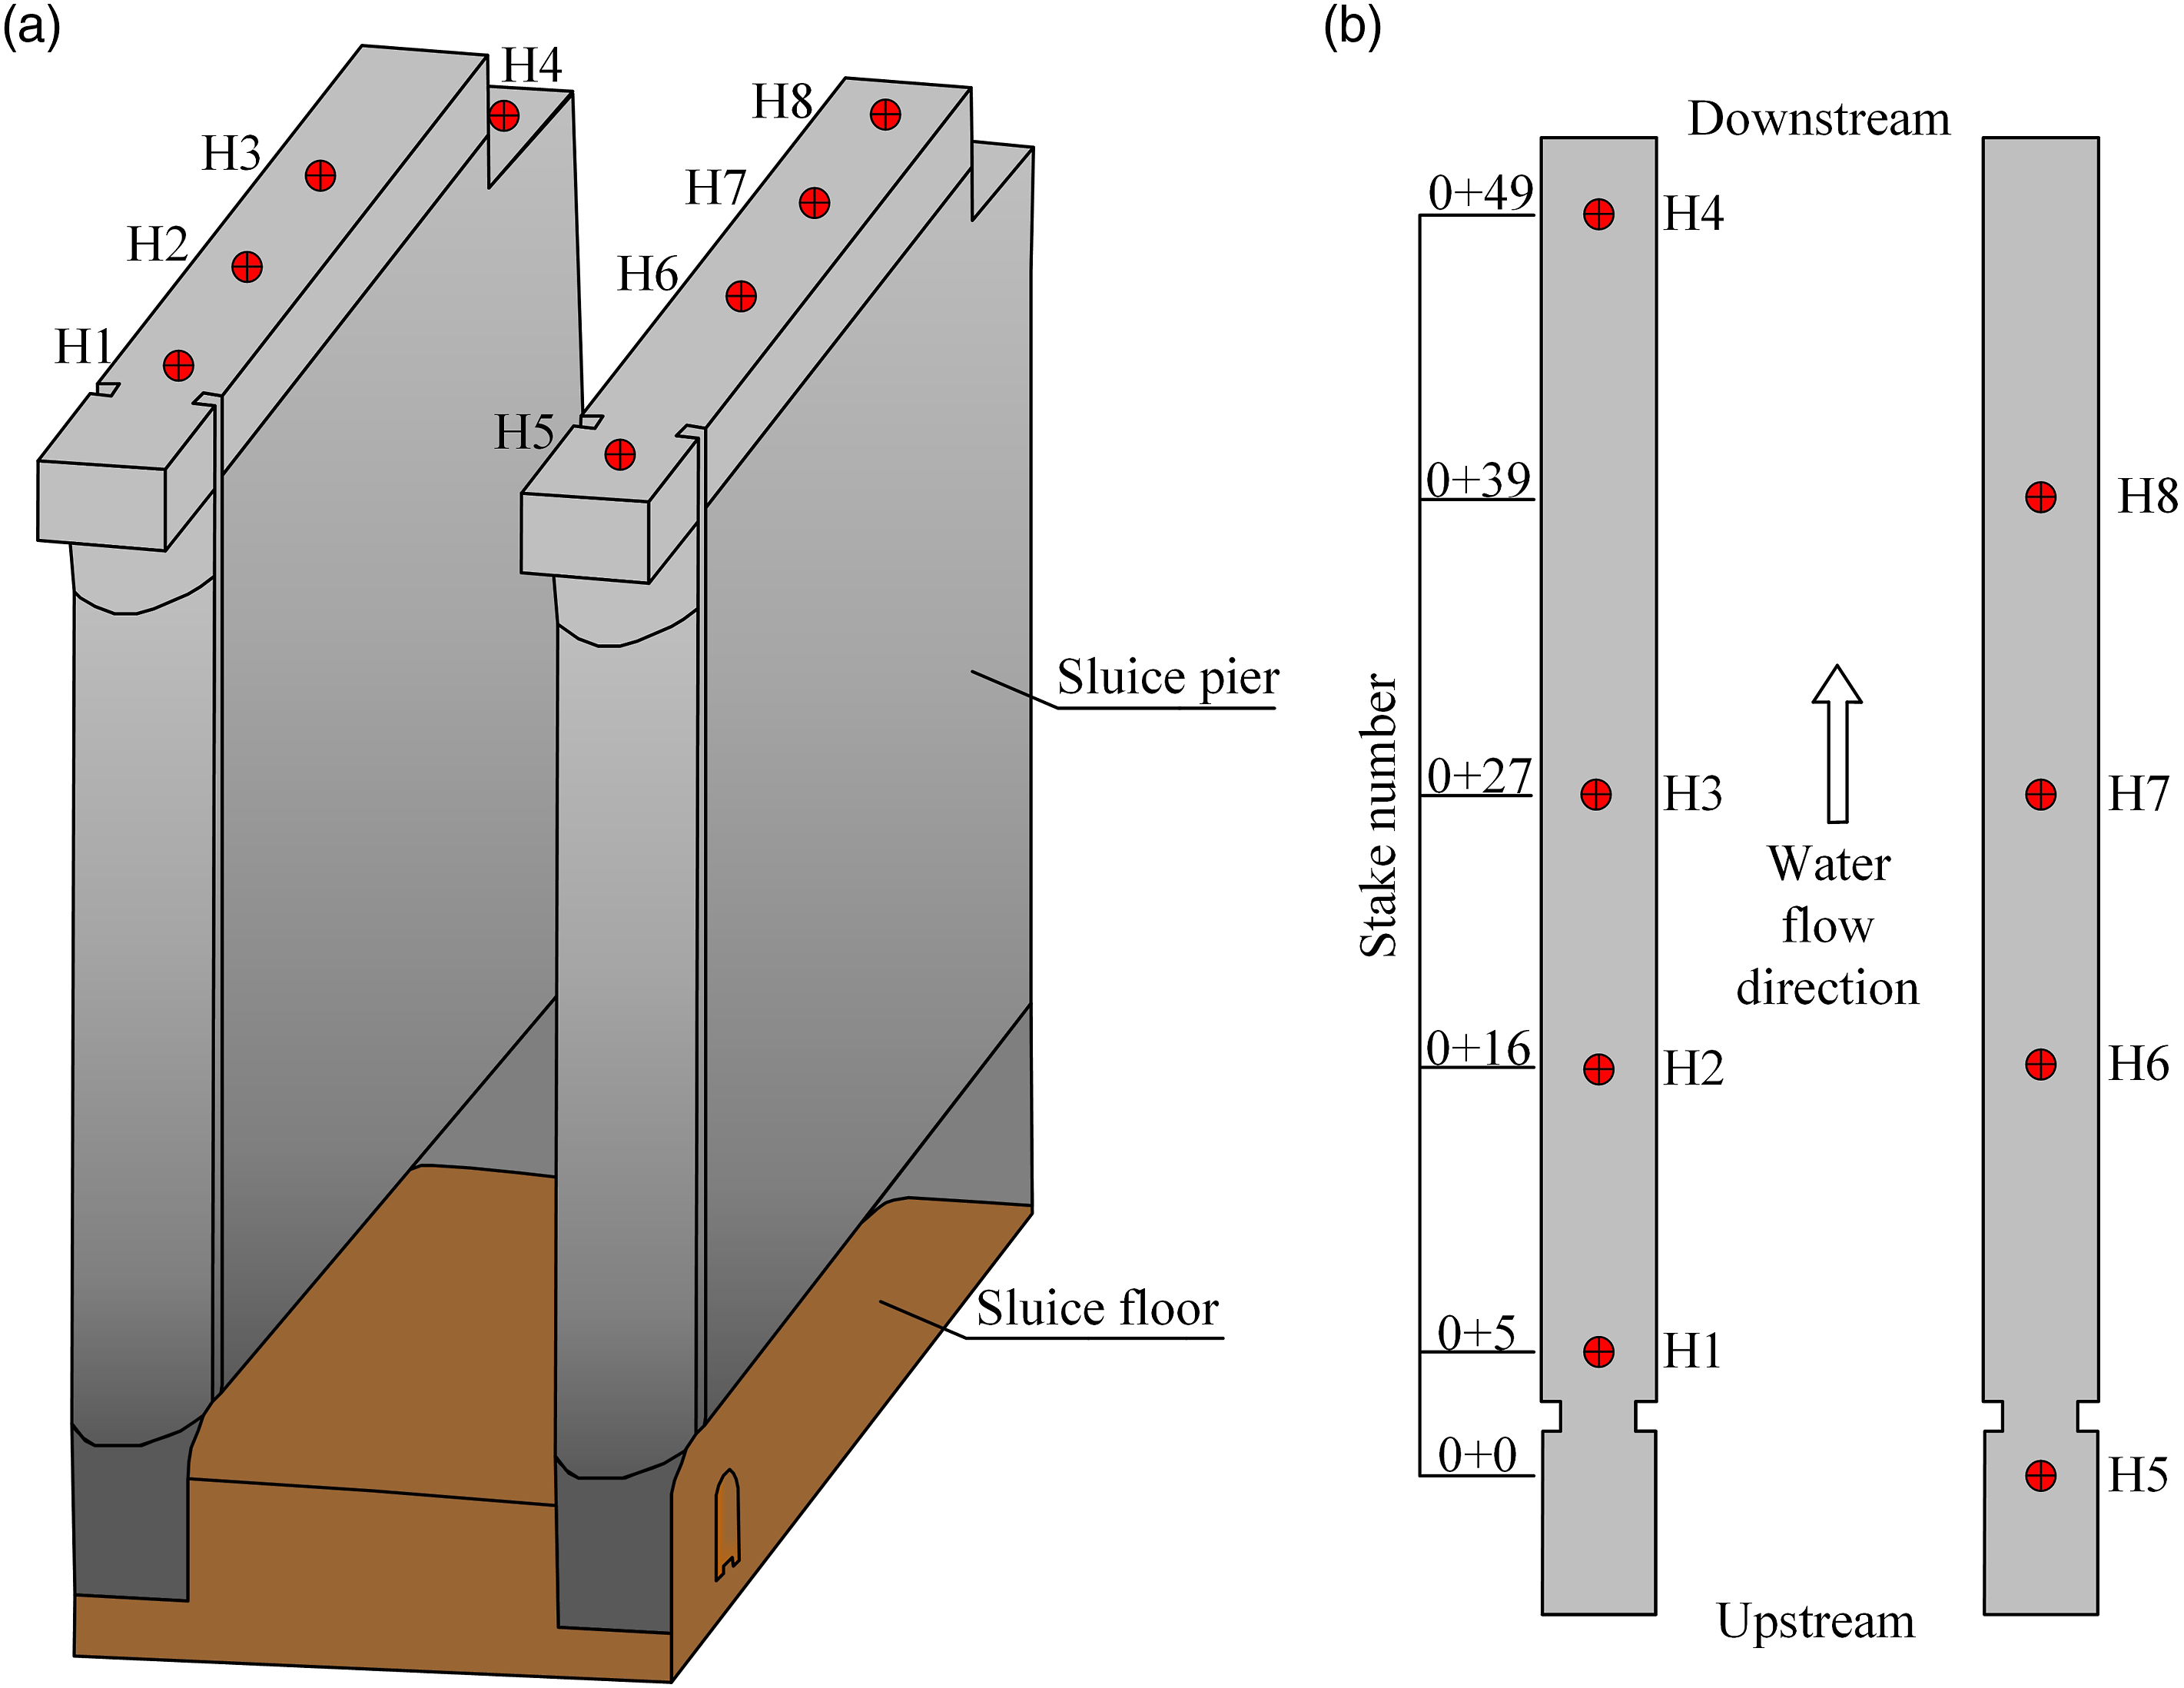
4.2. Typical measuring point signal processing
Because of length limitations, H1 was used as a typical measuring point to introduce signal processing, and its time history signals and power spectra are shown in Figure 10. The vibration signal at the H1 measuring point contained LFN with high intensity, high-frequency noise (HFN) and many DFCs making structural vibration component time history signal separation difficult. Based on the above process, the mode number and QPI were 6 and 4437.184, respectively. Measuring point H1 time history signals and power spectra. (a) Time history signals of the original signal, (b) power spectra of the original signal, (c) time history signals by IVMD, (d) power spectra by IVMD, (e) time history signals by CEEMD, (f) power spectra by CEEMD, (g) time history signals by CEEMDAN and (h) power spectra by CEEMDAN. Note: IVMD: improved variational mode decomposition; CEEMD: complete ensemble empirical mode decomposition; CEEMDAN: complete ensemble empirical mode decomposition with adaptive noise.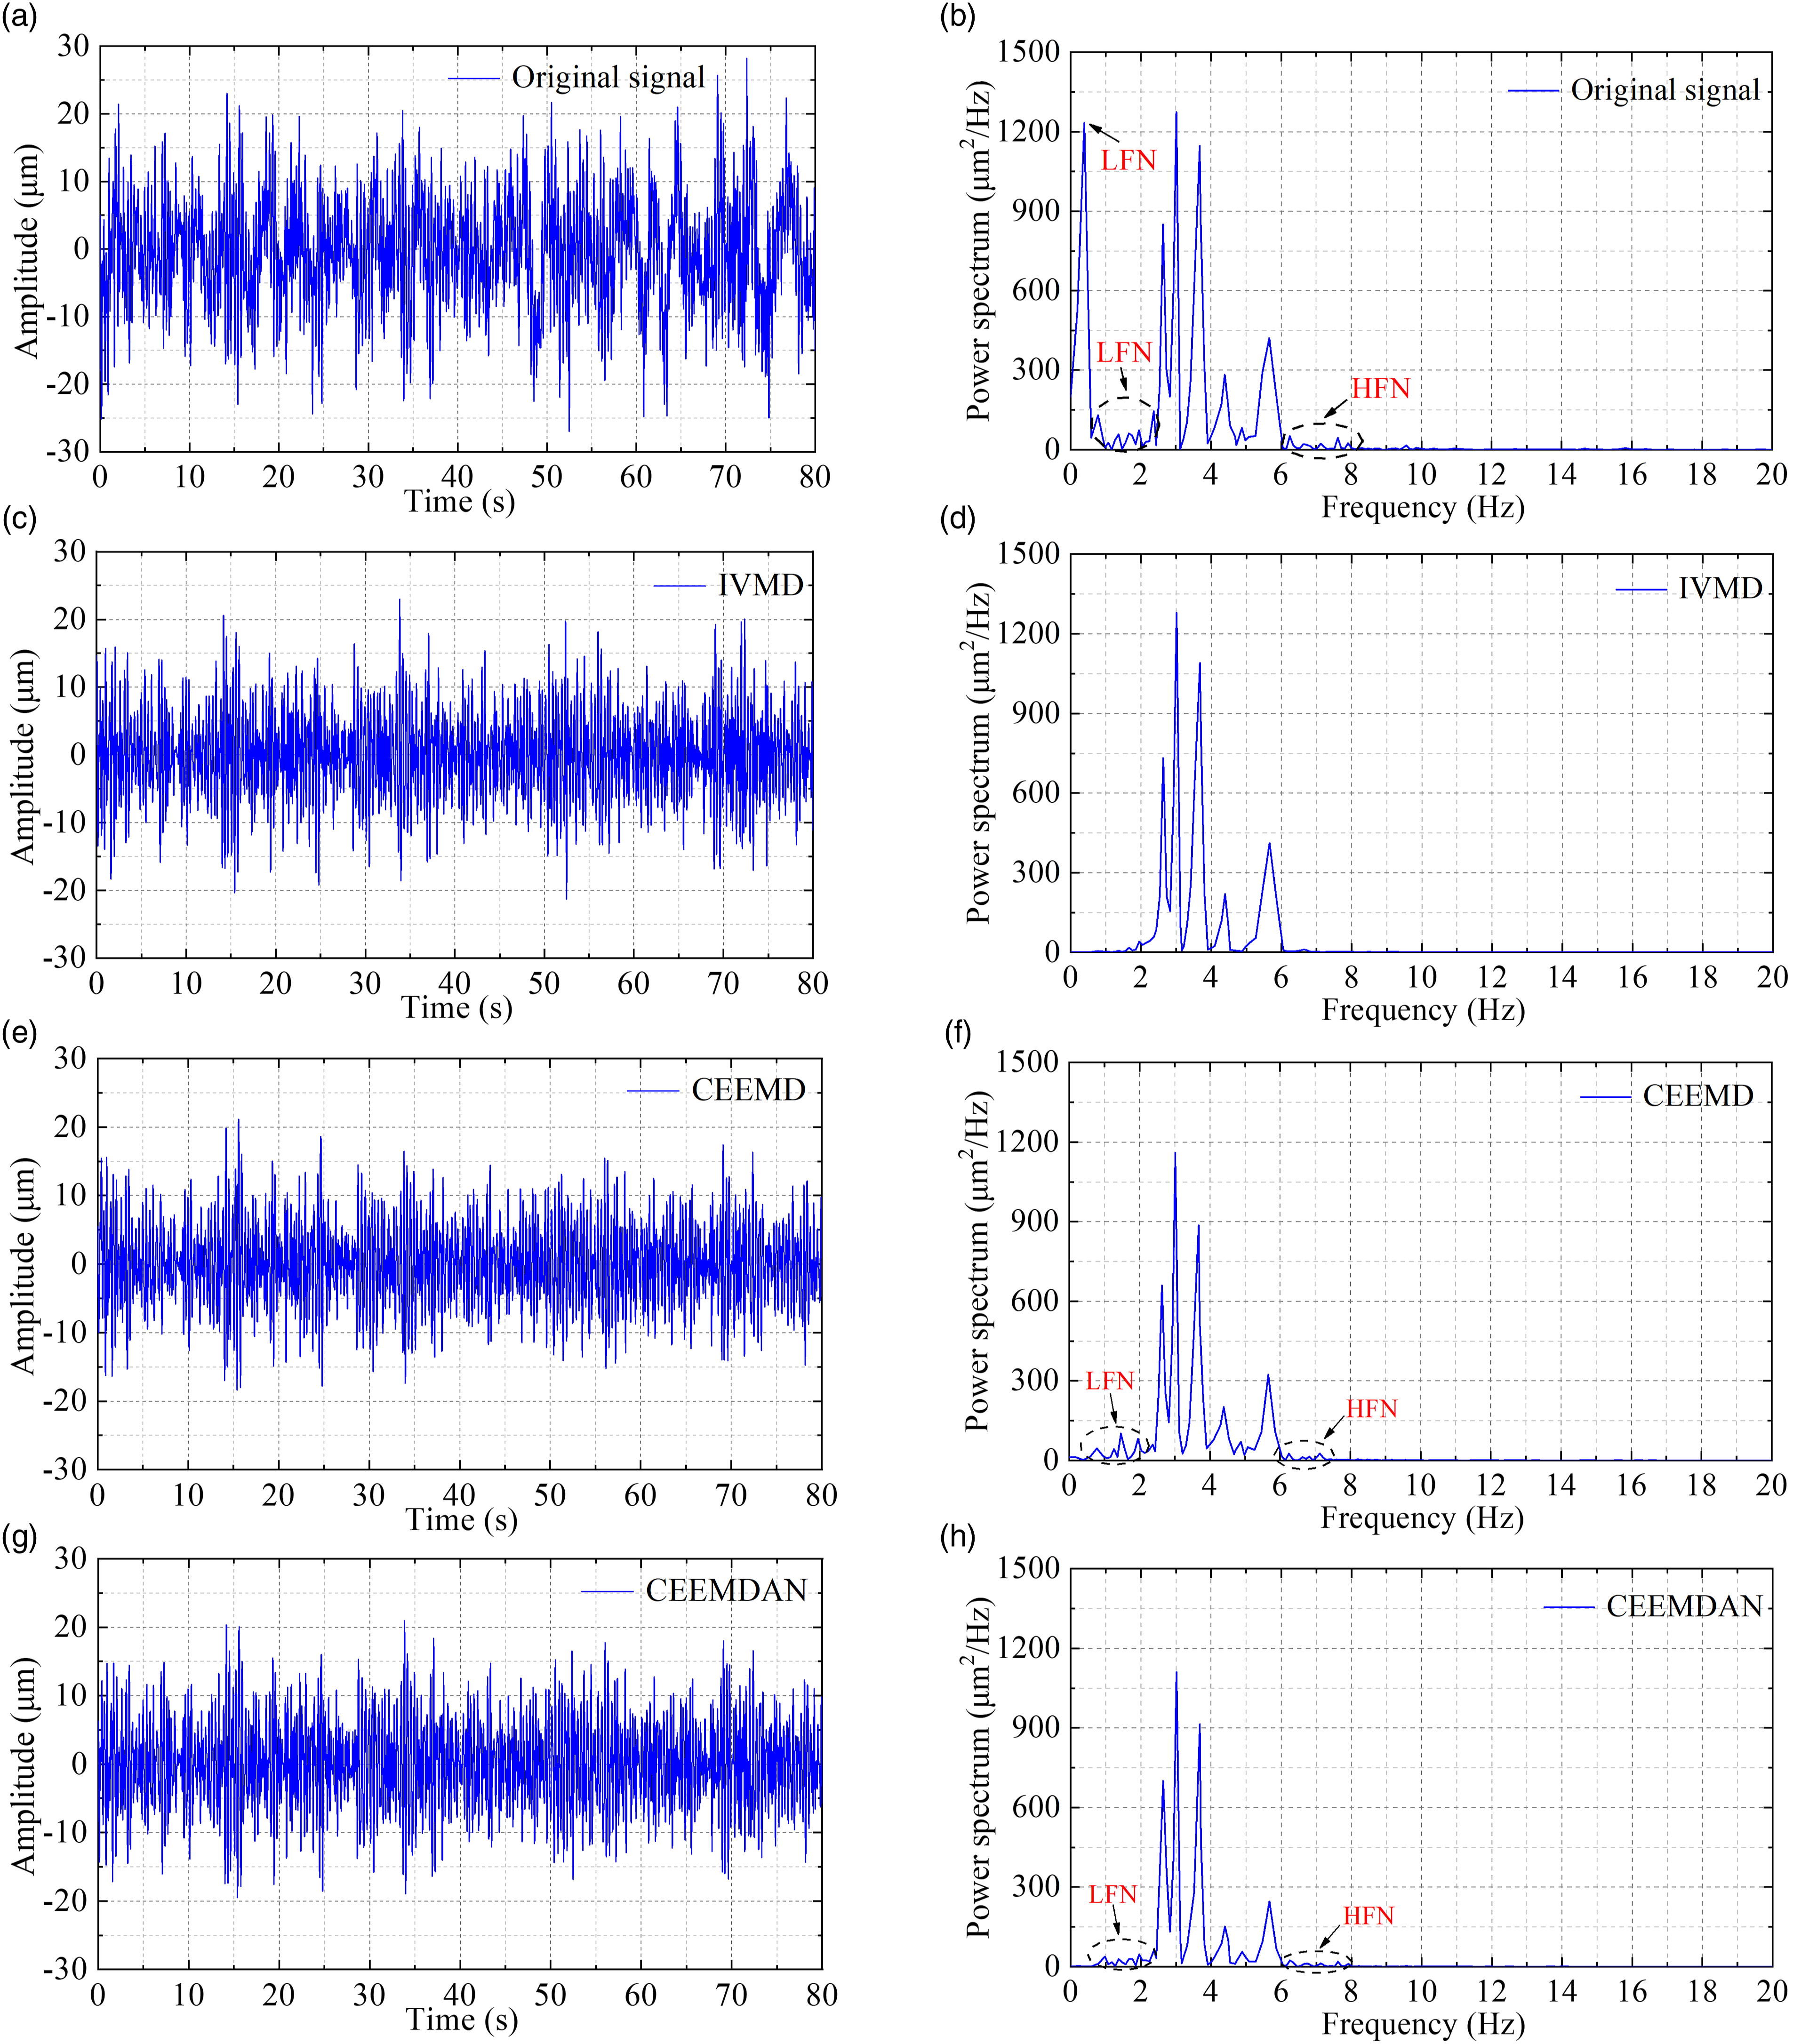
Comparison of evaluation indexes.
Note: IVMD: improved variational mode decomposition; CEEMD: complete ensemble empirical mode decomposition; CEEMDAN: complete ensemble empirical mode decomposition with adaptive noise; SNR: signal-to-noise ratio; RMSE: root mean square.
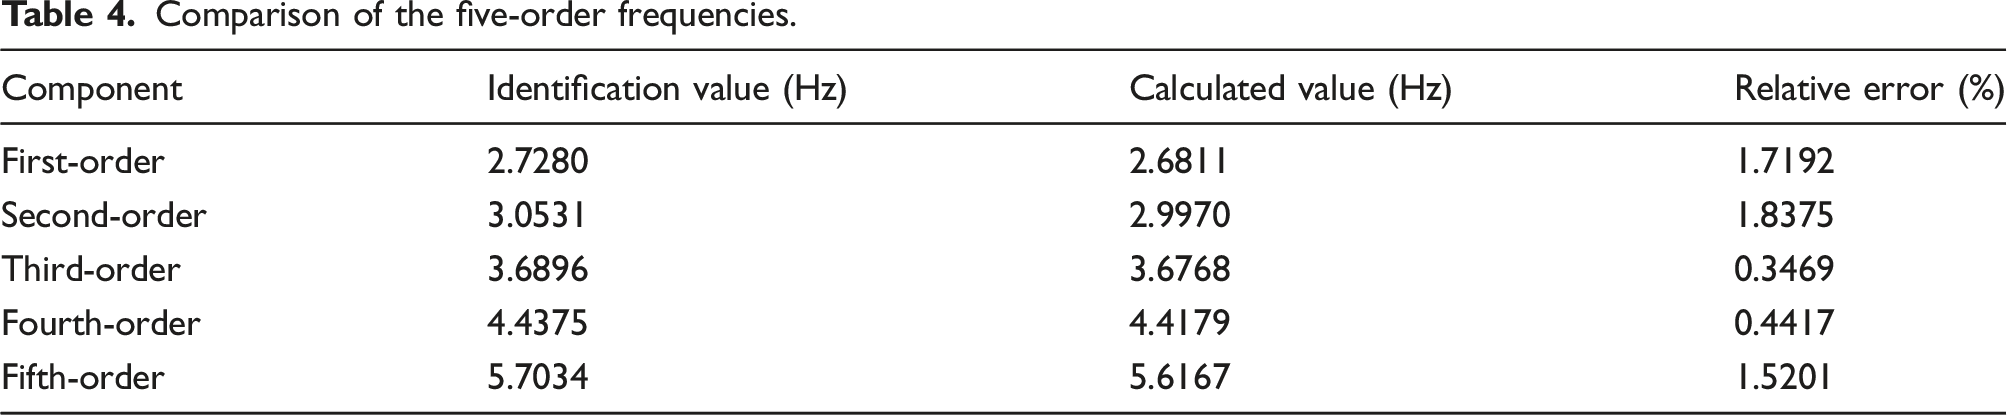
After IVMD processing, the measurement point H1 vibration signal was decomposed completely, and the vibration component time history signals and power spectra are shown in Figure 11. To analyse the ability to separate the DFC and obtain the HFC, the calculated values of the structural vibration component centre frequencies were compared with the frequency identification values obtained by stochastic subspace identification based on singular entropy (Table 4) (Li et al., 2019). The structural frequencies were 2.7280, 3.0531, 3.6896, 4.4375 and 5.7034 Hz, and the relative errors were within 1.8375%, indicating that the IVMD obtained the structural vibration component time history with similar calculated and identified values as well as decomposed the vibration signals containing DFCs and HFCs well. The proposed model provides a foundation for FDS vibration safety evaluation and health monitoring. Time history signals and power spectra of the measuring point H1 components. Comparison of the five-order frequencies.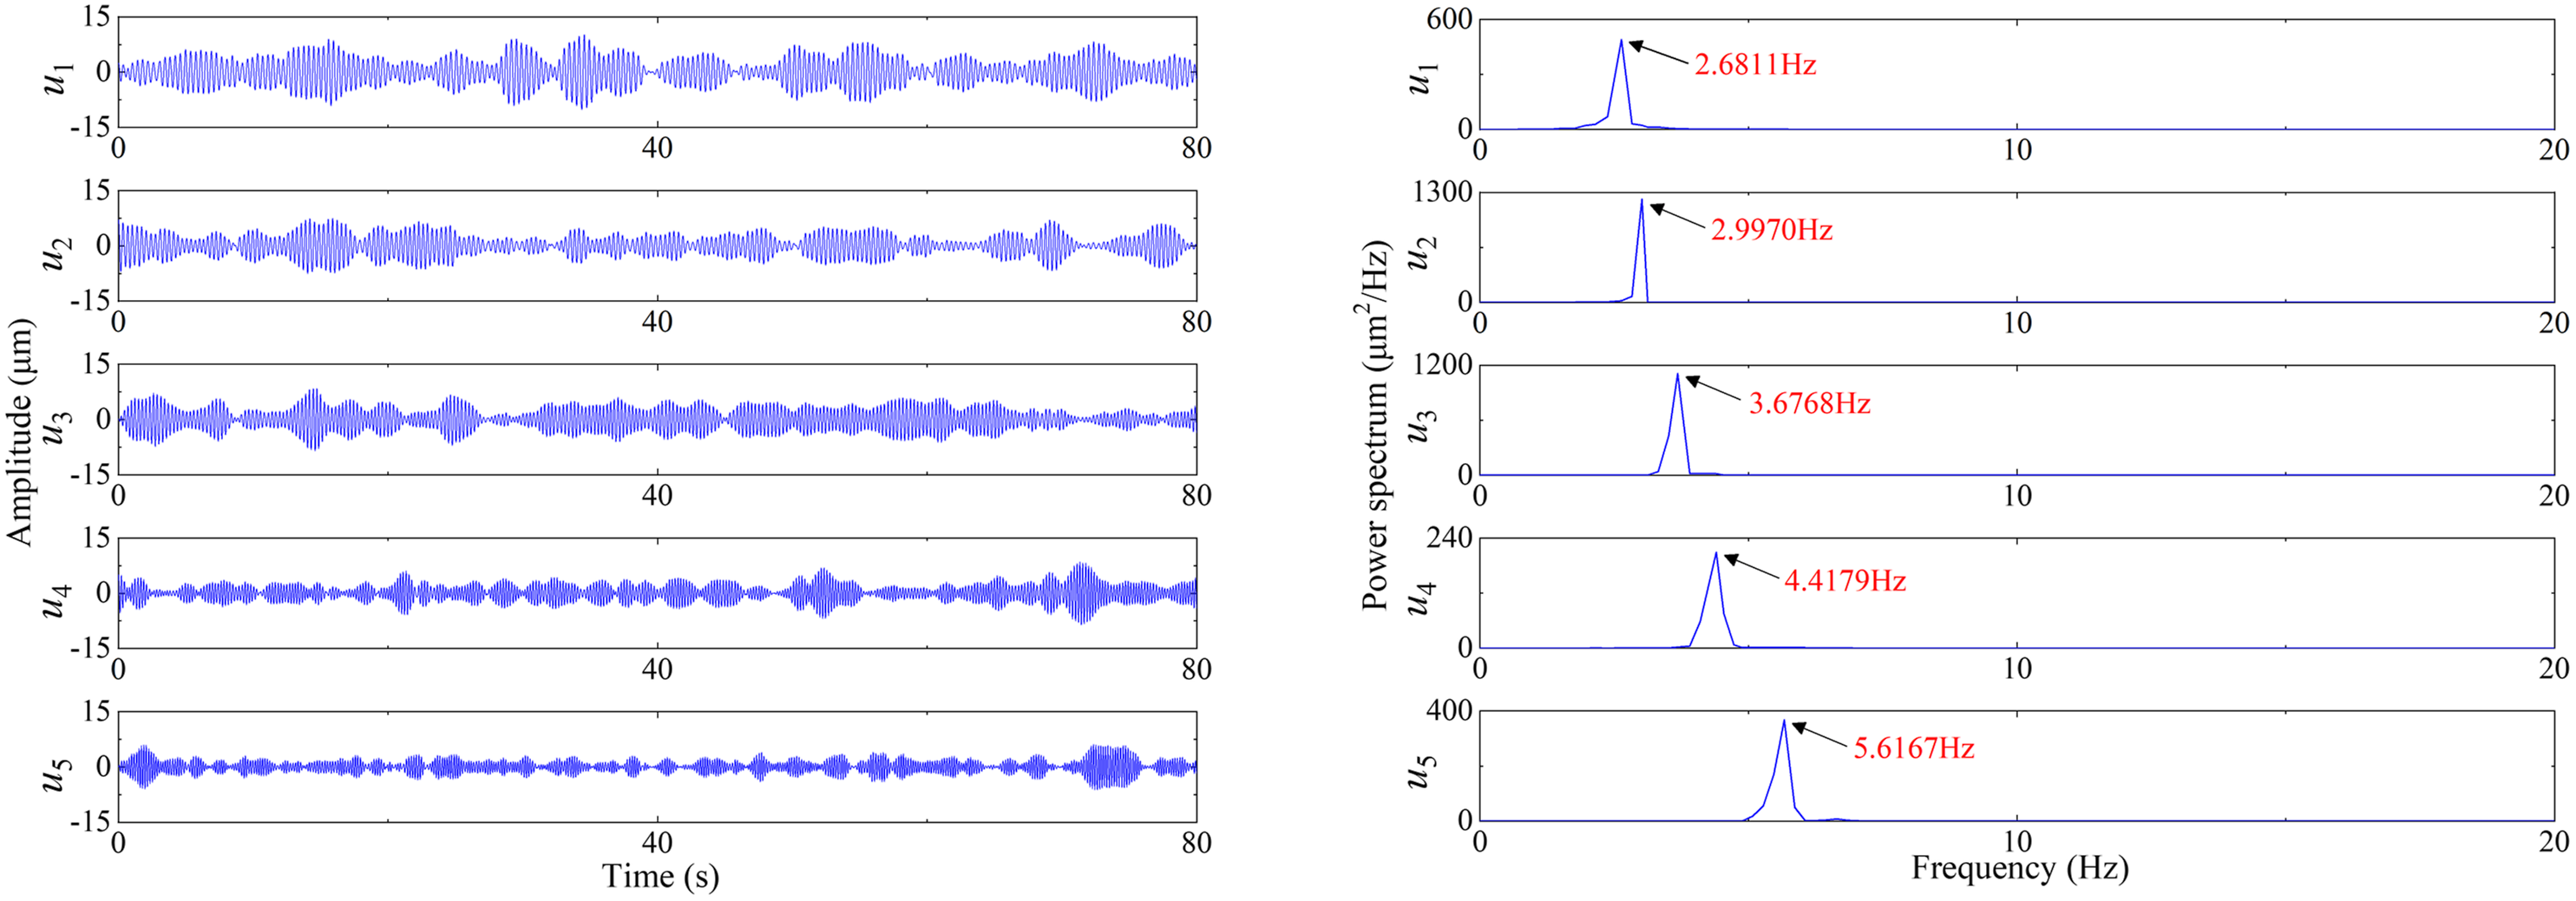
5. Conclusion
An IVMD method for the vibration signal processing of FDS was proposed in this study; the deviation caused by parameter uncertainty was solved, and the signal adaptive processing ability was improved. Conclusions were obtained by analysing the simulation and prototype vibration signals. A method that adaptively determined the mode number was proposed based on singular entropy and frequency stability, which accurately decomposed noise and structural vibration components. This approach effectively avoided human subjectivity and insufficient or excessive decomposition. An objective function was proposed to quantify the IMF mode mixing while meeting the signal reconstruction accuracy based on sample entropy and MIC. This made up for the lack of indicators in quantifying the mode mixing and effectively reduced the mode mixing between structural vibration components. The QPI parameter optimisation was also converted into objective function optimisation, which greatly improved the calculation efficiency and accuracy. A BAS-PSO algorithm, which retained the particle population diversity and improved the individual particle optimisation speed, was proposed to find the optimal QPI. Compared with the CEEMD and CEEMDAN methods, the proposed IVMD effectively filtered the FDS vibration signal LFN and HFN, separated the structural DFC and accurately obtained the structural HFC. The structural vibration component time history signals were obtained, which provide a foundation for FDS vibration safety evaluation and health monitoring.
Supplemental Material
sj-pdf-1-jvc-10.1177_10775463211016132 – Supplemental Material for Improved variational mode decomposition method for vibration signal processing of flood discharge structure
Supplemental Material, sj-pdf-1-jvc-10.1177_10775463211016132 for Improved variational mode decomposition method for vibration signal processing of flood discharge structure by Huokun Li, Gang Wang, Bowen Wei, Hanyue Liu and Wei Huang in Journal of Vibration and Control
Footnotes
Declaration of conflicting interests
The author(s) declared no potential conflicts of interest with respect to the research, authorship and/or publication of this article.
Funding
The author(s) disclosed receipt of the following financial support for the research, authorship, and/or publication of this article: This work was partially supported by the National Natural Science Foundation of China (Grant No: 51879126, 52079061, 51869011 and 51909115), Natural Science Foundation of Jiangxi, China (Grant No: 2018ACB21018 and 20192BAB216038) and Open Research Fund of State Key Laboratory of Simulation and Regulation of Water Cycle in River Basin (China Institute of Water Resources and Hydropower Research) (Grant No: IWHR-SKL-KF201904).
Supplementary Material
Supplemental material for this article is available online.
References
Supplementary Material
Please find the following supplemental material available below.
For Open Access articles published under a Creative Commons License, all supplemental material carries the same license as the article it is associated with.
For non-Open Access articles published, all supplemental material carries a non-exclusive license, and permission requests for re-use of supplemental material or any part of supplemental material shall be sent directly to the copyright owner as specified in the copyright notice associated with the article.