
Abstract
Sound field separation based on near-field acoustical holography has been developed worldwide, but with the increase in the number of sound sources, traditional measurement methods and calculation methods will generate more workload. To reduce the number of measuring points and save calculation time, the sound field separation of multiple coherent sources with a single measurement surface is proposed. On the basis of separating two coherent sources with this method, the separation formula of more sources based on an equivalent source method is given. Through numerical simulation, the effects of the number of holographic surface measuring points, measuring distance, array shape, and equivalent source number on the calculation accuracy of the sound field separation were compared at different frequencies. The correctness and effectiveness of the sound field separation method with a single surface are verified by actual experiments.
Keywords
1. Introduction
Near-field acoustical holography (NAH) has been extensively studied by scholars because it has the function of three-dimensional visualization and can reconstruct the information at any position in the sound field (Ungnad and Sachau, 2019). With the development of technology, the NAH technique has evolved from the original spatial sound field transformation to the current equivalent sources method (ESM). Because the ESM has high calculation accuracy, scholars have conducted extensive research on it (Salin and Kosteev, 2020; Tan et al., 2019; Valdivia, 2019). On the basis of NAH technology, scholars have further studied the sound field separation method (Bi et al., 2016; Ma et al., 2019; Zea and Arteaga, 2019).
The sound field separation method has also evolved with the development of the NAH technique, from multiple measuring points on two surfaces to fewer measuring points on a single surface. Bi et al. (2008) studied the sound field separation method with the ESM based on the previous double-layer sound field separation method (Fei et al., 2005). Fernandez-Grande and Jacobsen (2011) went on to discuss the double-layer sound field separation method based on particle velocity measurement. Fernandez-Grande et al. (2012) proposed a sound field separation method with a single surface using sound pressure and particle velocity. That same year, Wang et al. (2012) proposed the acoustic field separation technique with a single holographic surface based on the wave superposition algorithm and statistically optimal NAH. Hald (2016) proposed fast wideband acoustical holography. In the same year, Xu et al. (2016) improved the noise source localization based on the equivalent source method. These sound source localization methods provide prior knowledge for sound field separation. Mao et al. (2017) studied the sound field separation method with a single holographic surface based on sound pressure. This method uses the transfer function relationship between the theoretical sound pressure and measured value with error on the holographic surface to derive the calculation formula. Mao et al. (2019) also studied the sound field separation method with a single surface based on the particle velocity. Compared with the method based on sound pressure, it is found that the sound pressure method has higher accuracy for separating the sound pressure, and the particle velocity method has higher accuracy for separating the particle velocity. Hu et al. (2020) proposed a sound field separation method based on compressive sensing. This method could obtain higher accuracy when the number of measuring points on double holographic surfaces is less. Zhang et al. (2021) used single-layer pressure–velocity measurements to separate nonstationary sound fields. It can effectively eliminate interfering sound sources in both time and space domains.
In summary, the traditional sound field separation method requires two measurement surfaces or a single measurement surface measuring sound pressure and vibration velocity for calculation. For other single holographic interpolation methods, more data processing time is needed. To reduce the measurement cost and shorten the calculation time, the sound field separation method for separating multiple coherent sound sources with a single holographic surface is proposed. Among three or more coherent sound sources, the free sound field of target sound source can be restored based on ESM. The algorithm is analyzed and verified through numerical simulation and experiments.
2. Basic theory
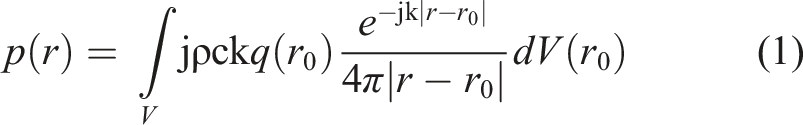
The principle of ESM is to replace the sound field radiated by the original vibrating body with the sound field radiated by a series of internal equivalent sources. Suppose there is a vibrating body in the sound field, and the sound pressure it radiated is
The sound pressure measured on the holographic surface turns it into a matrix mode as

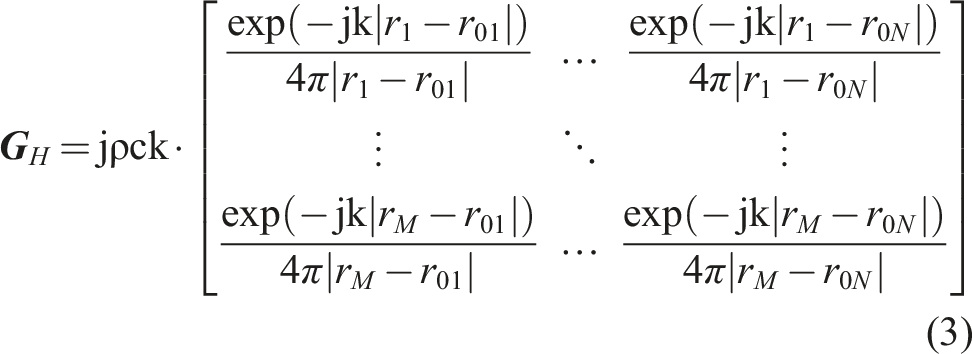
Then,

If

If

According to the solution equation of Q, the pressure on the random position of the acoustical field could be calculated by

As shown in Figure 1, assuming that there are two coherent sound sources in the sound field, the sound pressure Schematic diagram of the position.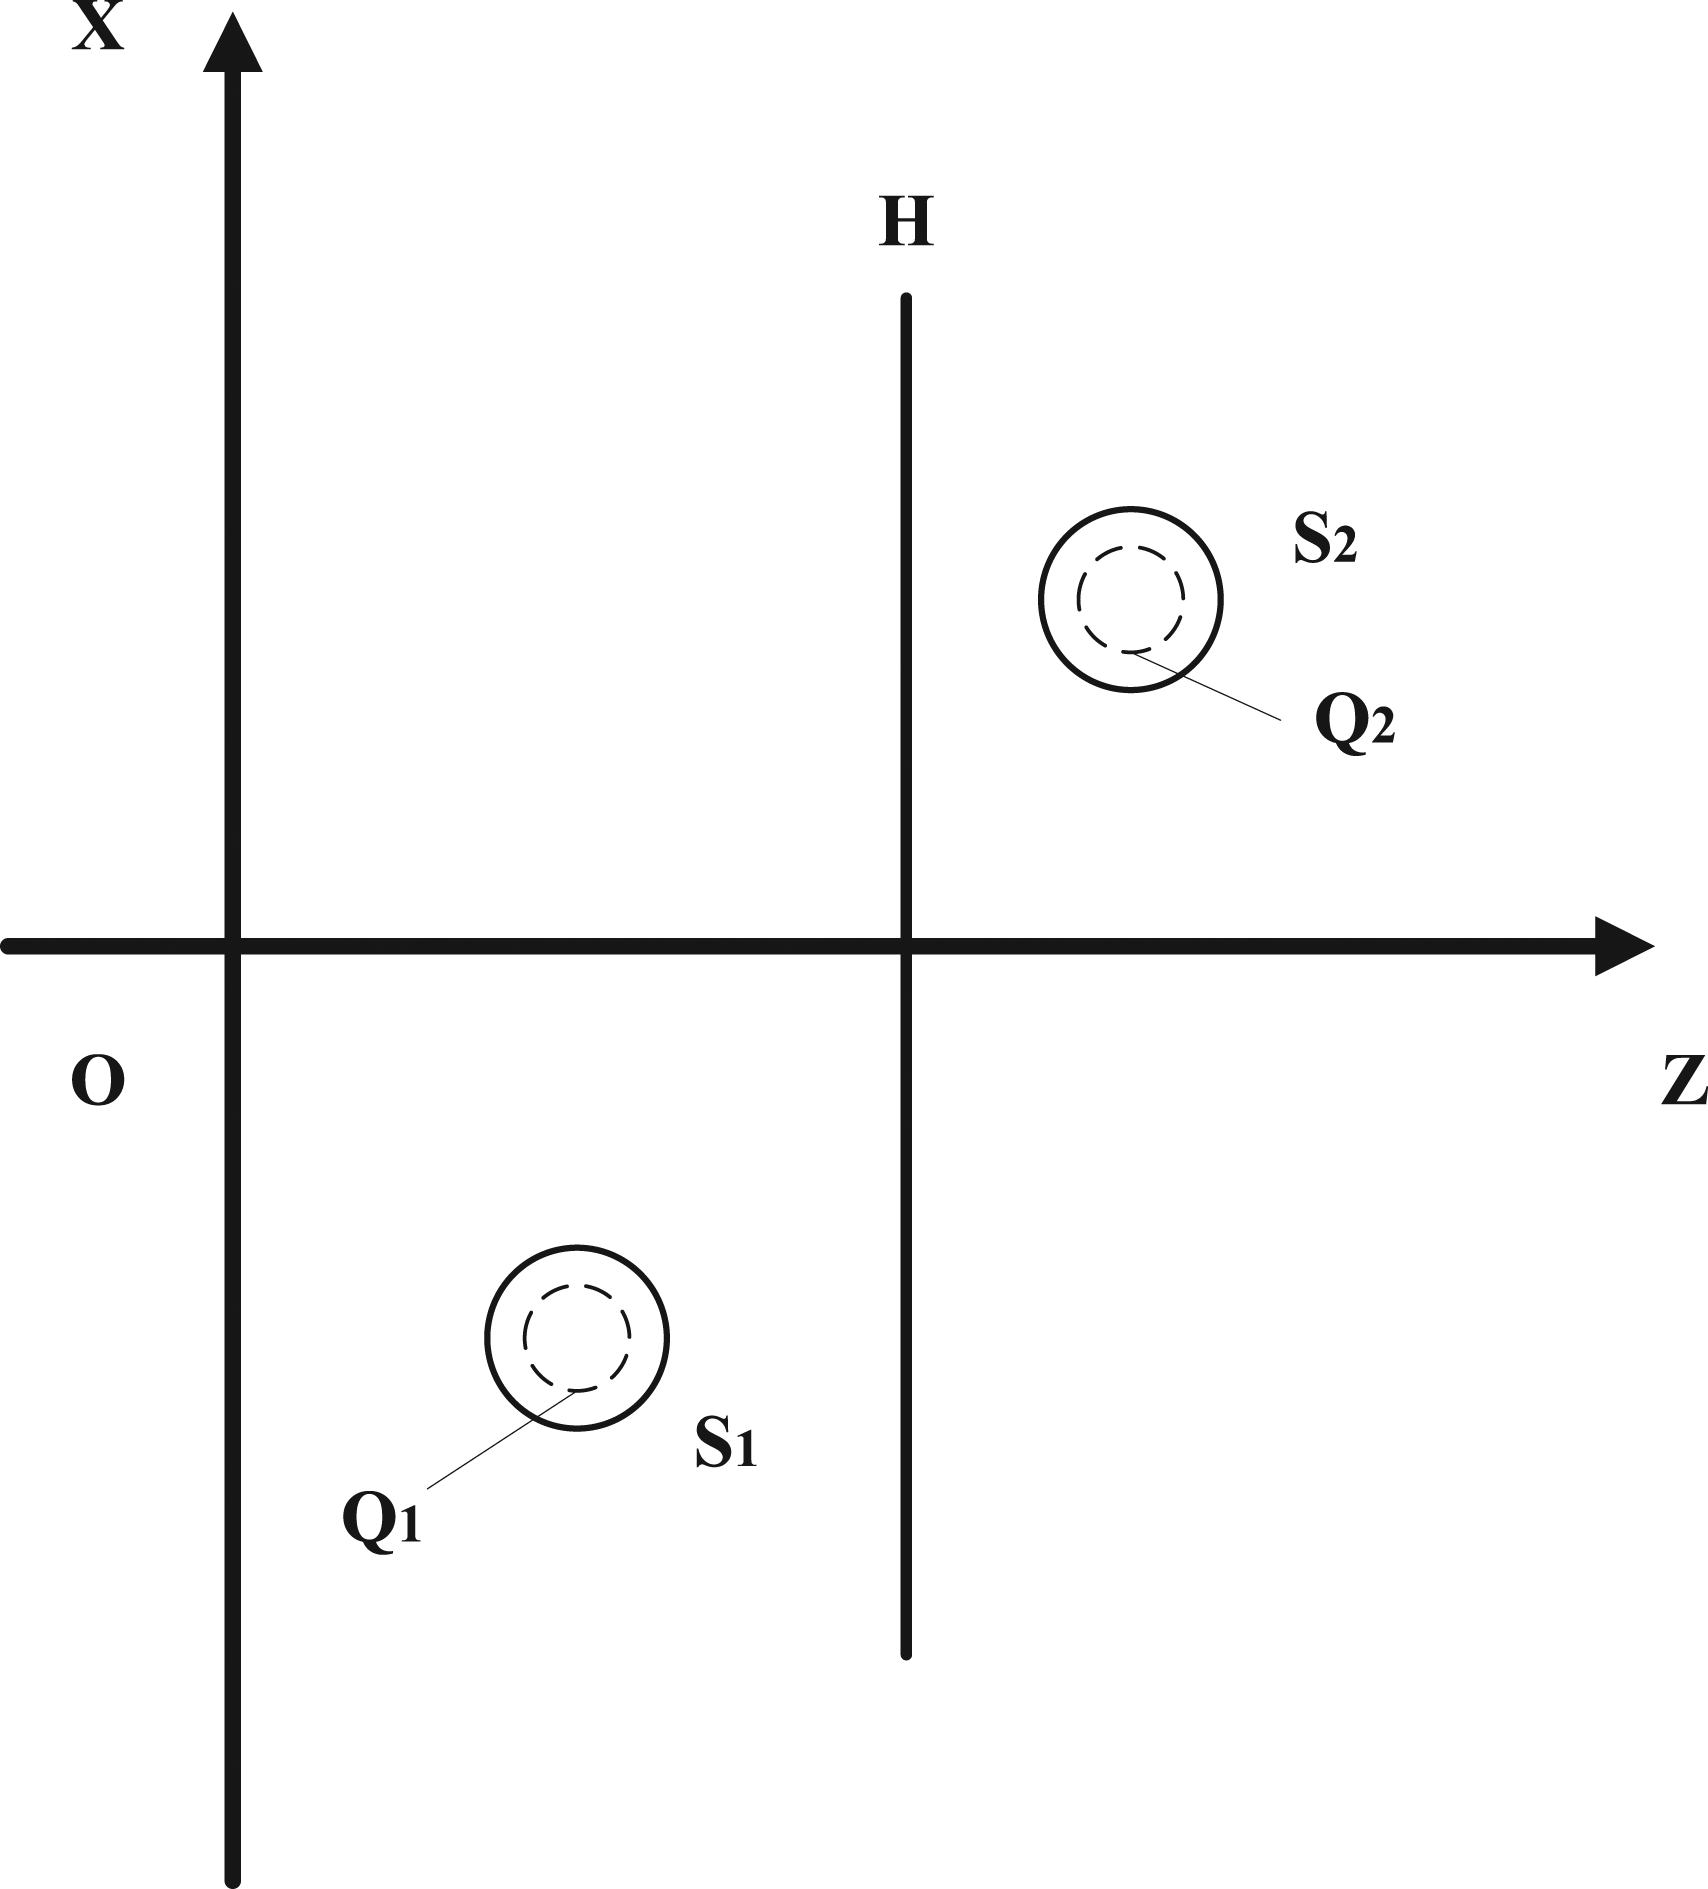

Assuming all errors are caused by source

According to the principle of the ESM, the

Similarly, the


Then, the


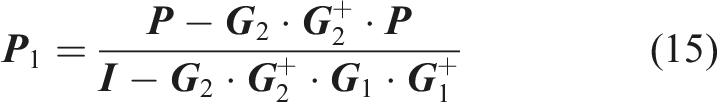
According to equations (13) and (14),
As shown in Figure 2, there are three coherent sound sources in the sound field. If source Location of three coherent sound sources.
The measured sound pressure on the holographic surface is as follows

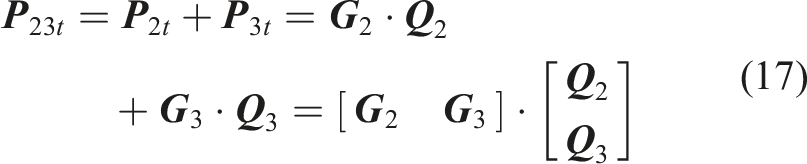
Then, the pressure

Similarly, assuming the errors are caused by source


Then,
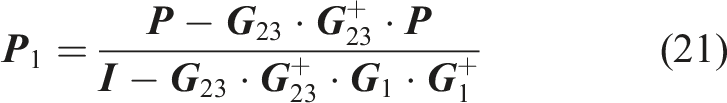
According to the above derivation, if there are
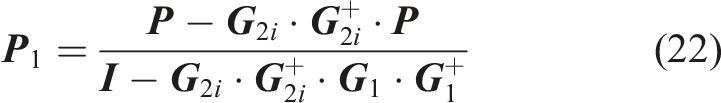
In the actual separation process, cyclic separation can also be performed according to the position of the coherent sound source.
3. Numerical Simulation
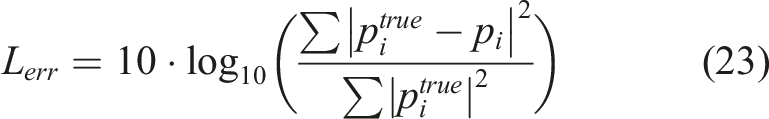
The location of the sound sources and holographic surface is shown in Figure 2. The coordinates of the three sound sources in the Cartesian coordinate system are (−0.2, 0, 0) m, (0.2, 0, 0.2) m, and (0, 0.2, 0.2) m, respectively. The coordinate of the holographic surface on the z-axis is 0.1 m, and the grid is 13*13 with 0.07 m spacing. The frequency, vibration speed, and vibration radius of each source are 1000 Hz, 0.125 m/s, and 0.01 m, respectively. The signal-to-noise ratio (SNR) is 30 dB. Equivalent sources are arranged on the sphere according to the equal grid pattern (Mao et al., 2015). The number of equivalent sources for each sound source is 74. The calculation formula for the error is as follows (Sarkissian, 2005)
Shown in Figure 3(a) is the measured pressure on the holographic surface. Figure 3(b) is the theoretical pressure radiated by target source Sound pressure on holographic surface. (a) Coherent values. (b) Theoretical value of source Separation value of source 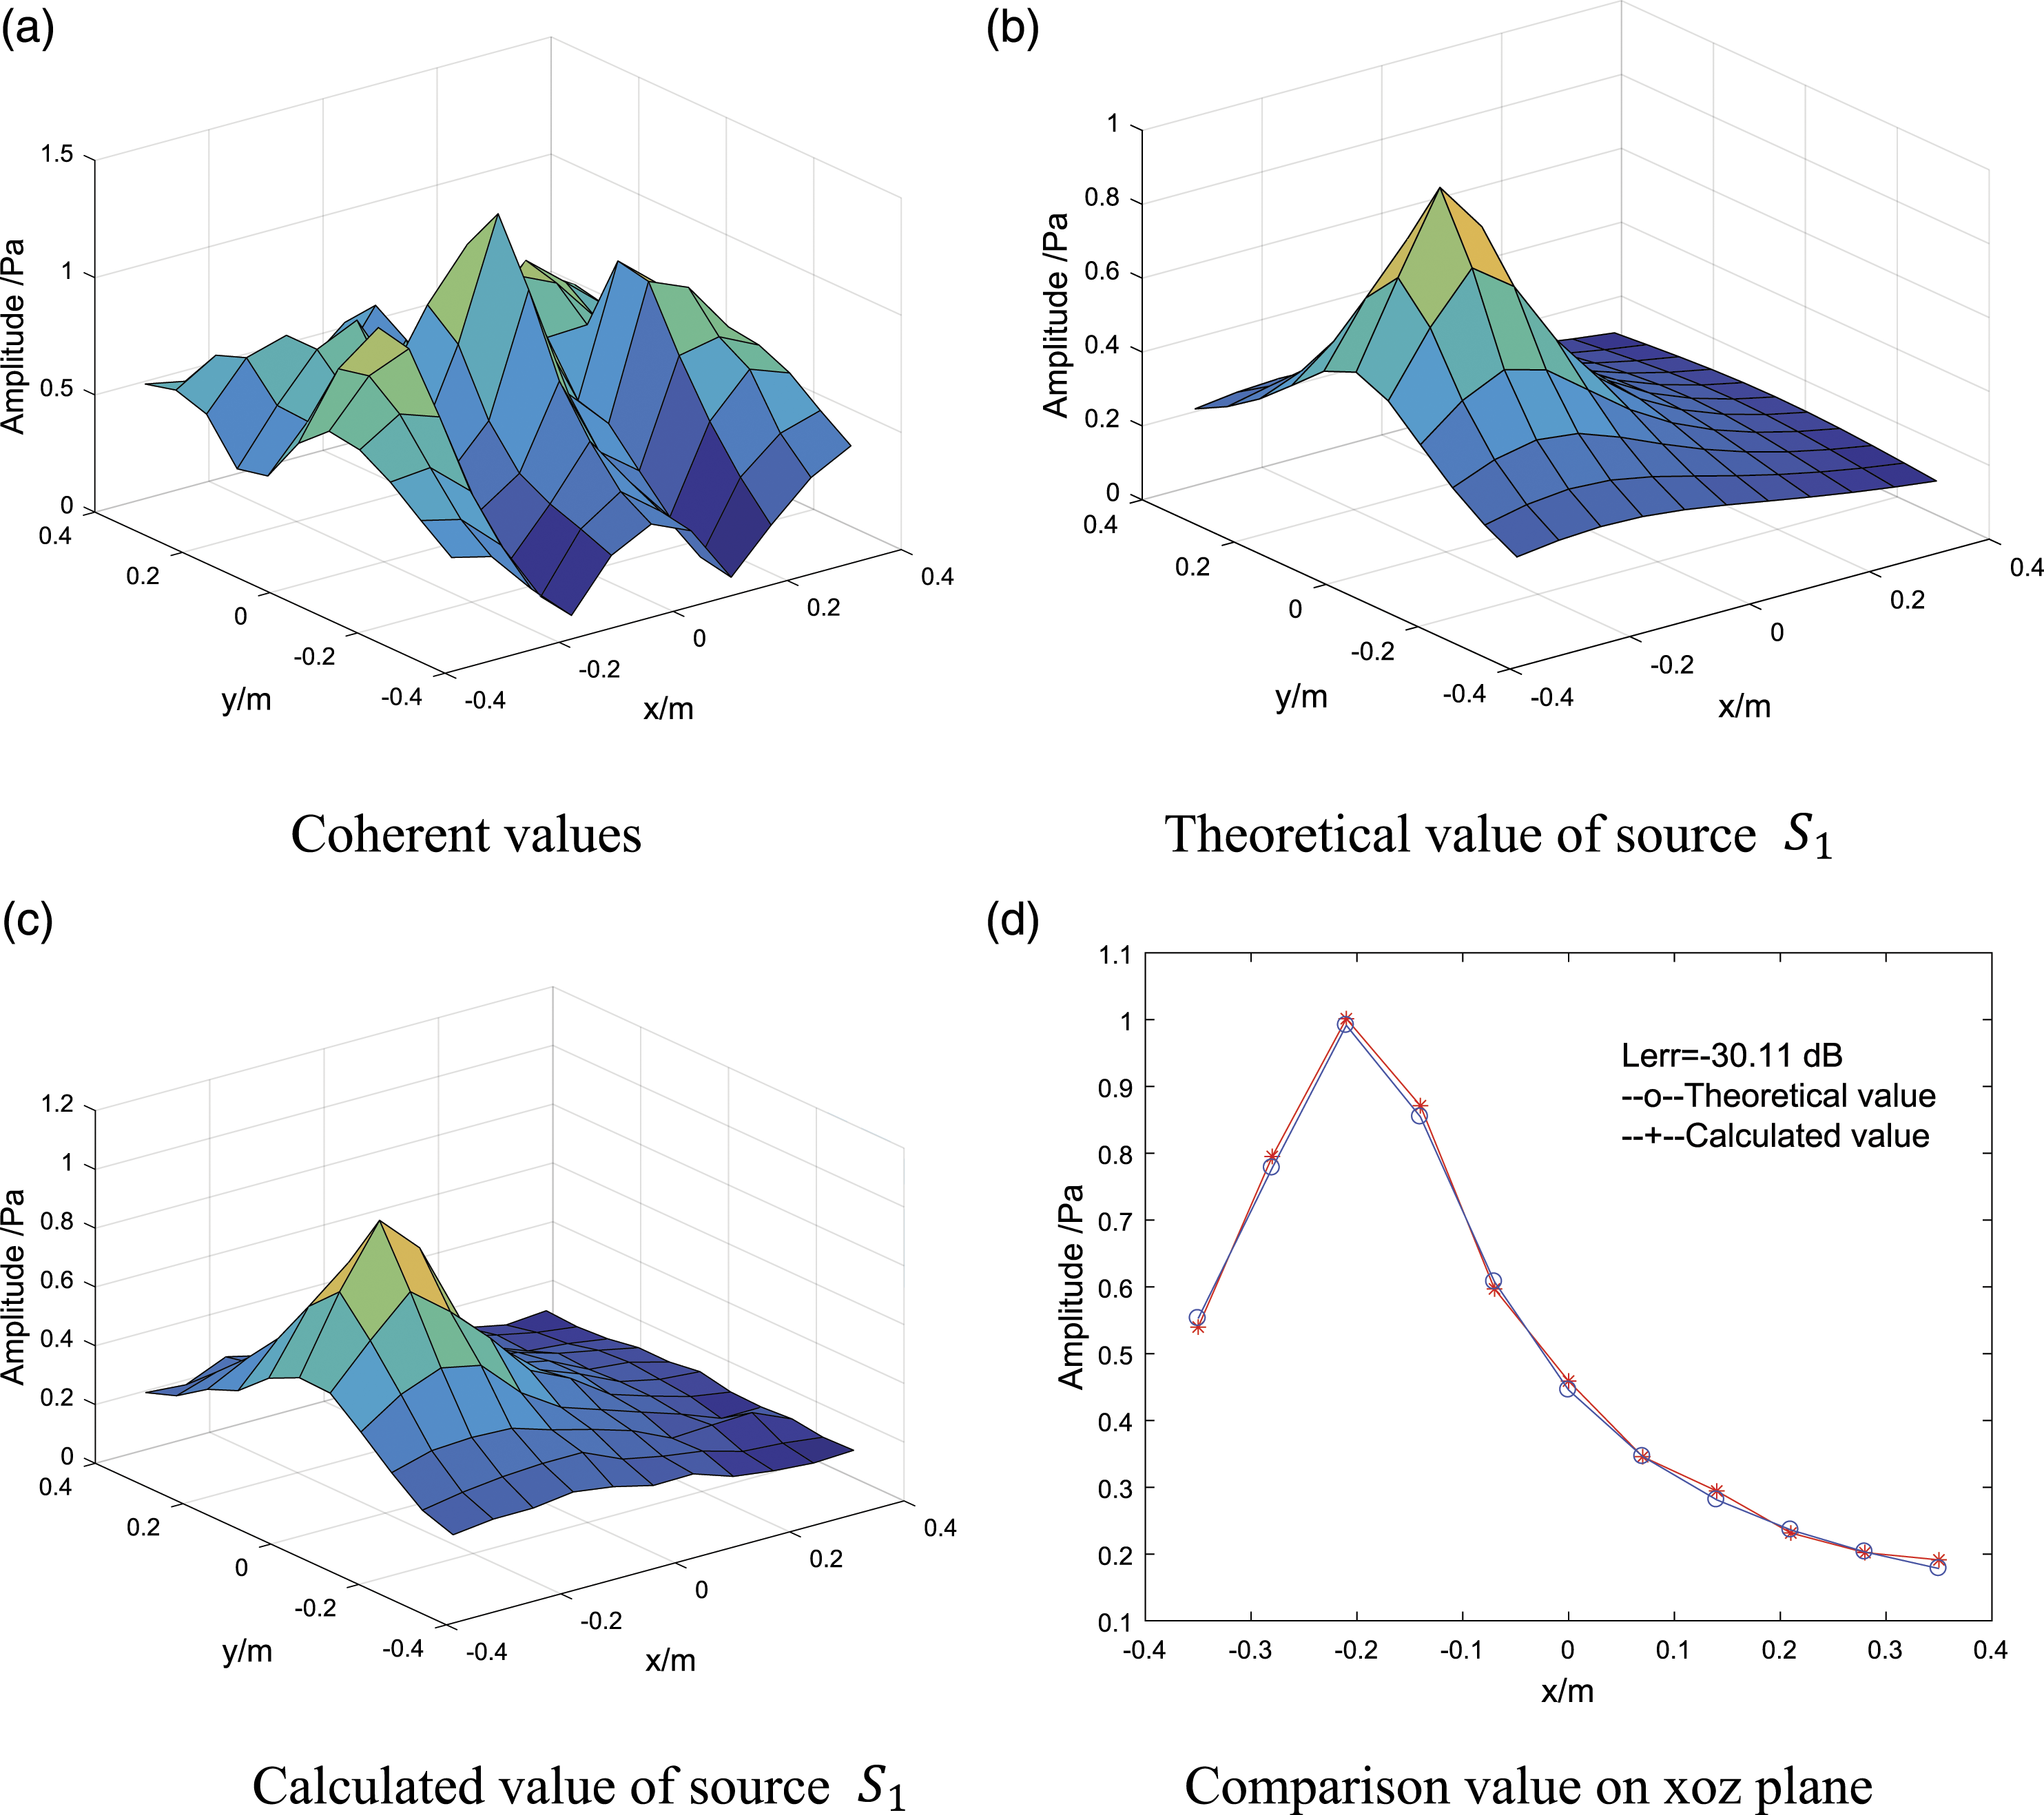
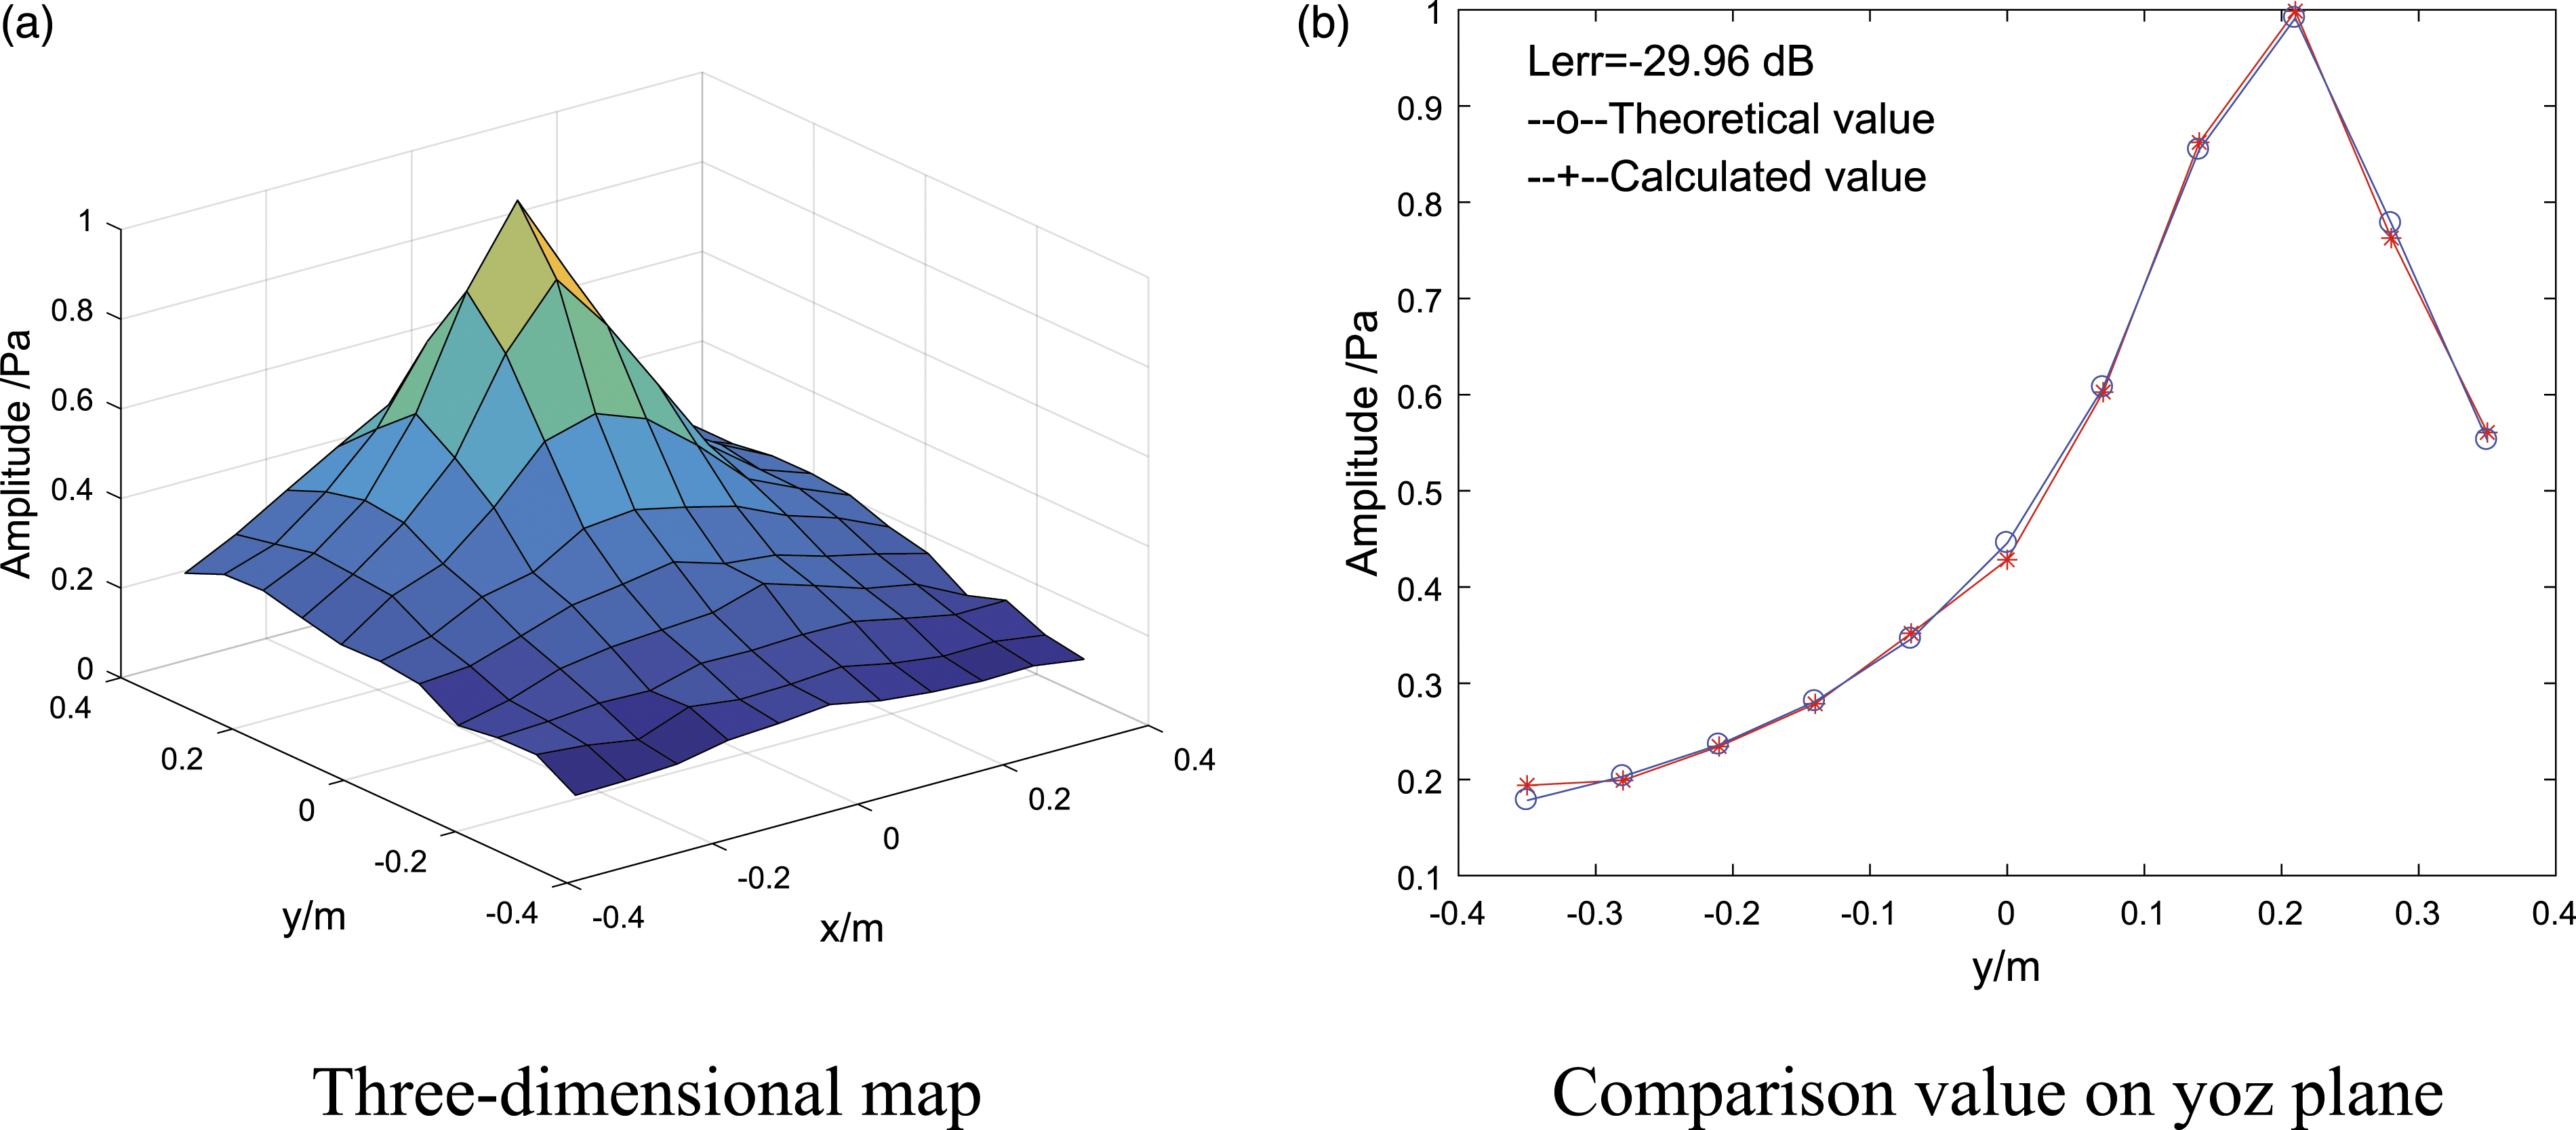
Figure 4(a) is the calculated pressure of source
To further study the practicability of the method, the effects of parameters such as sound source position, the number of measuring points on holographic surface, and sound source frequency on the separation results are discussed.
The influence of the shape of the holographic surface on the separation results mainly includes the number of measuring points and the grid spacing. The following is an analysis when the sound source frequency is in the range of 200–3000 Hz. Other parameters are consistent with those in the simulation. The source
It can be seen from Figure 5 that the error variation law of the measurement point increases from 7*7 to 15*15. In the whole analysis, the frequency range is basically the same. When the measurement point is reduced to 5*5, the error increases at 200–800 Hz. At low frequencies, the column vectors of the transfer matrix become correlated, so the accuracy will decrease. Influence of the number of holographic surface measuring points on separation results.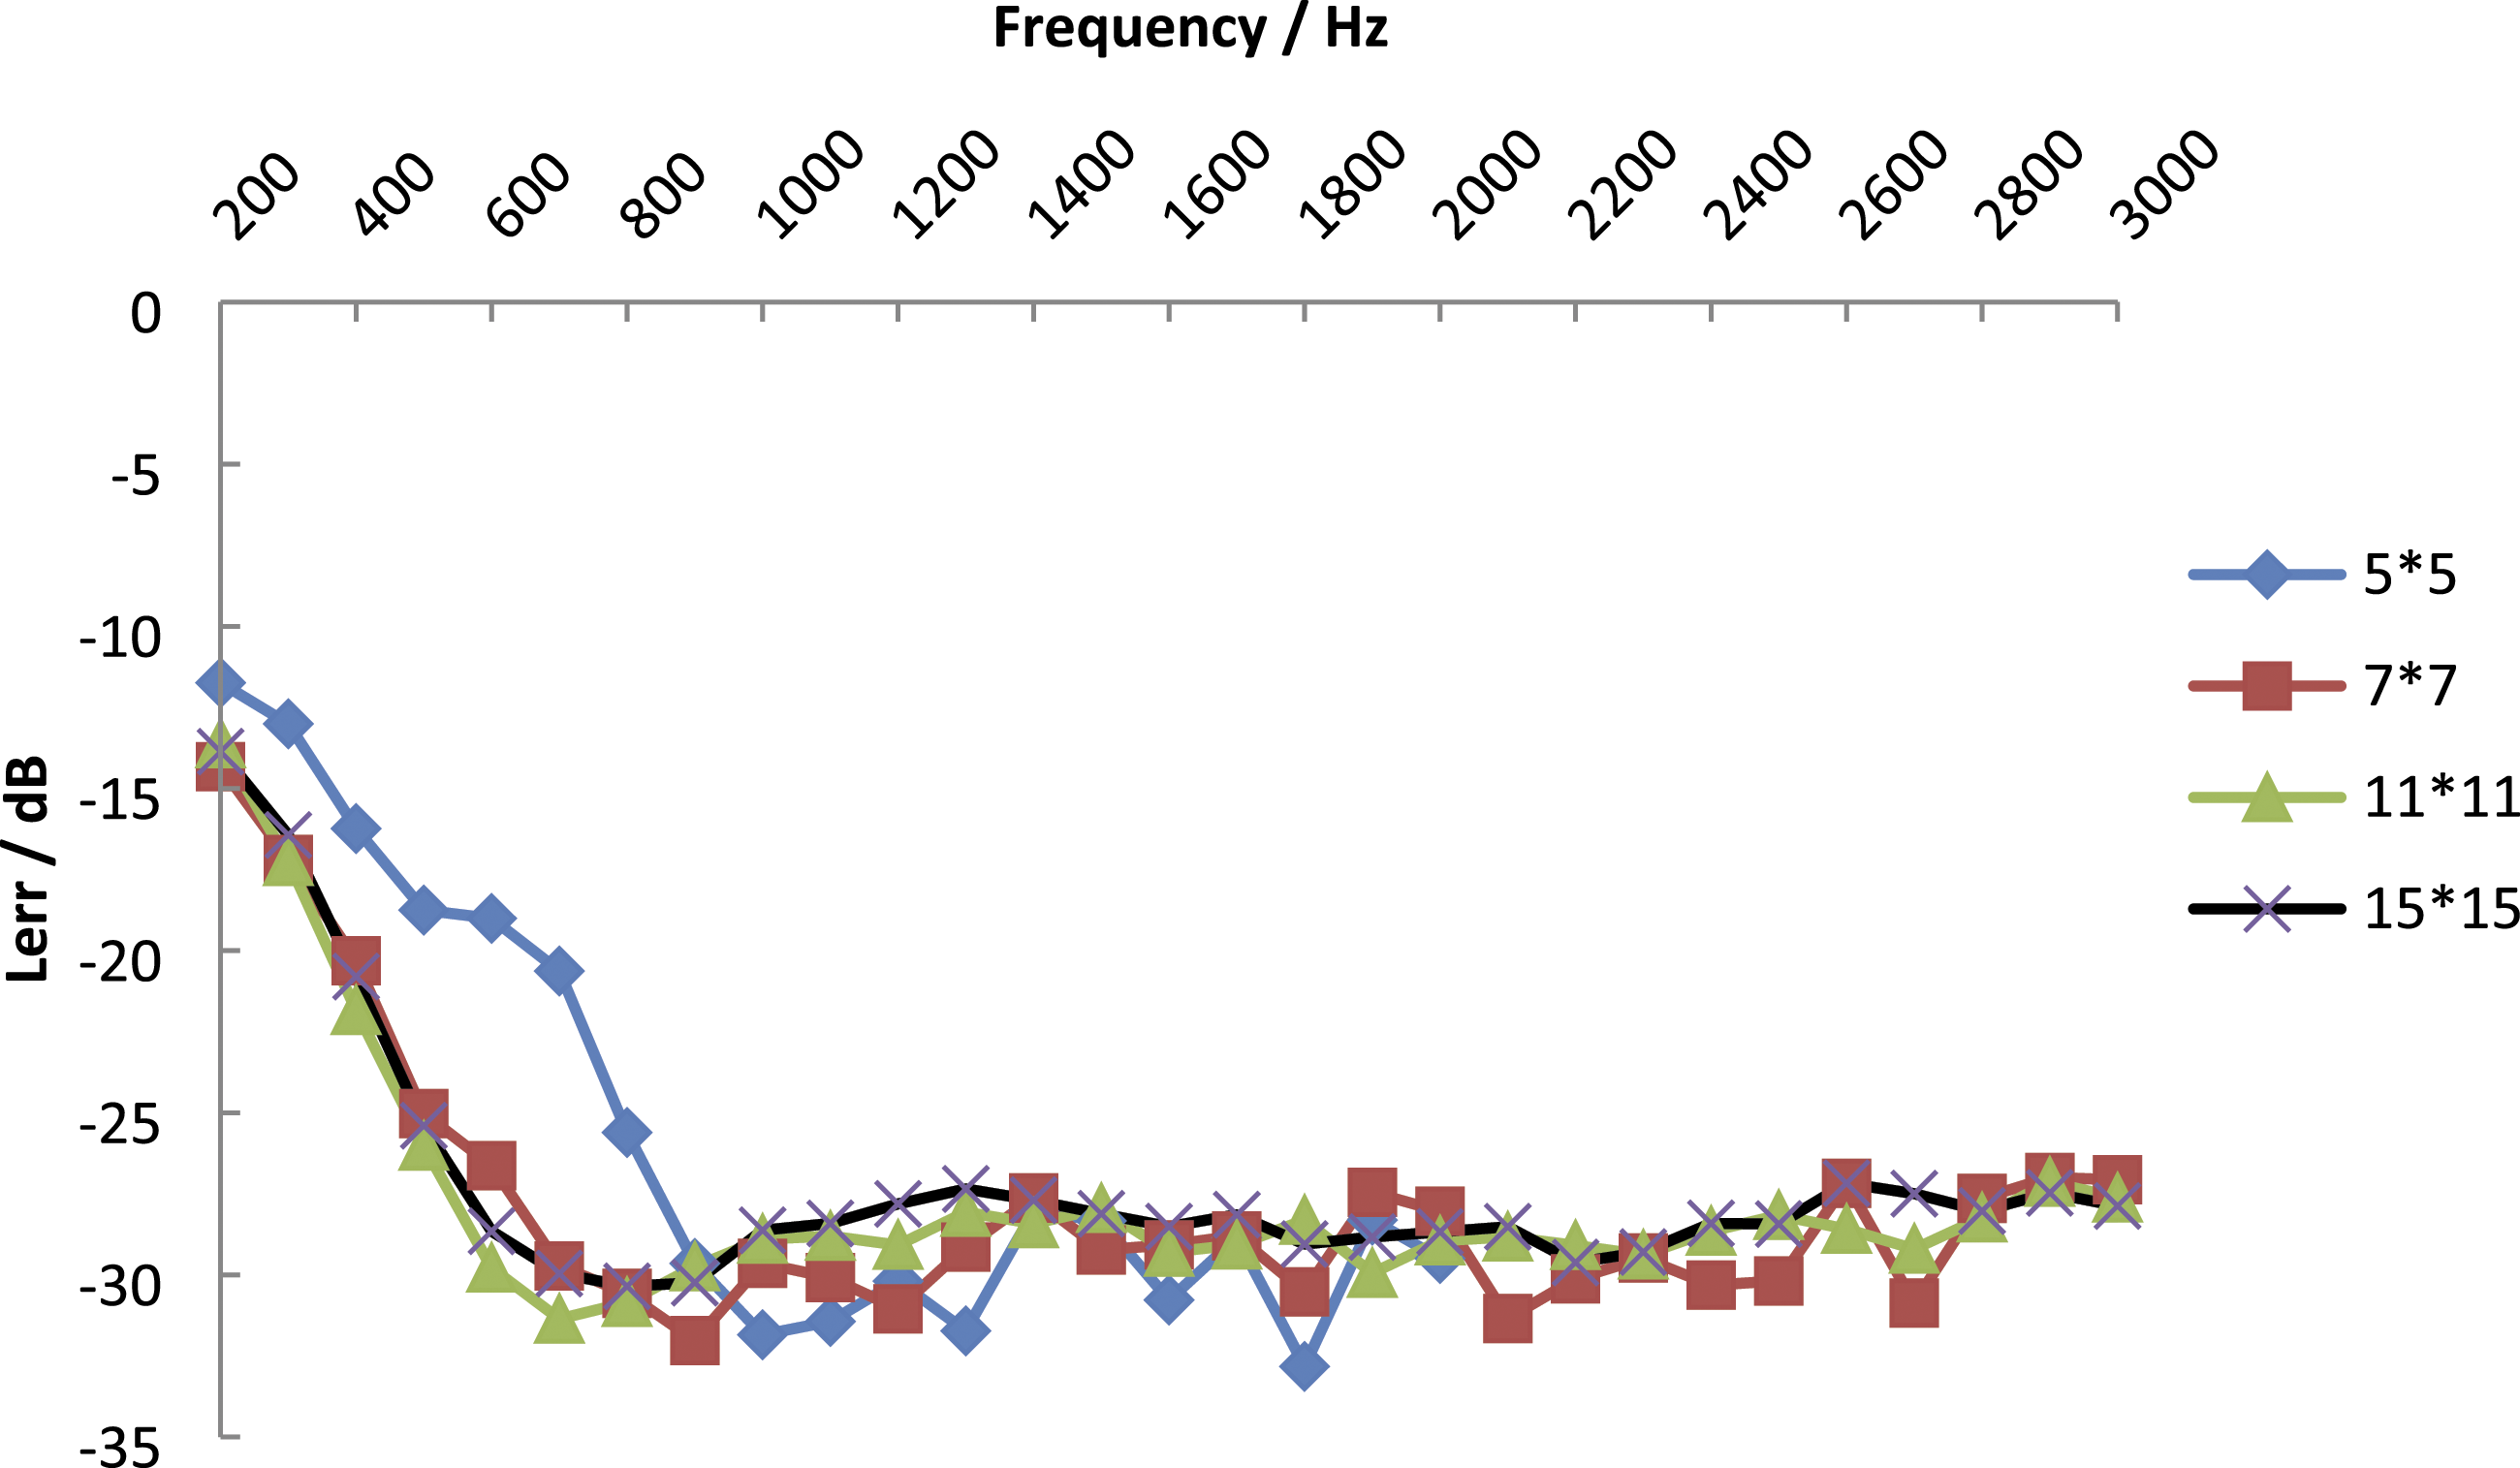
Under the condition that the measuring points of the holographic surface is 7*7, the sound field is separated when the distance between the holographic surface and the sound source changes from 0.05 cm to 0.15 cm. The separation results are shown in Figure 6. Influence of measurement distance on separation results.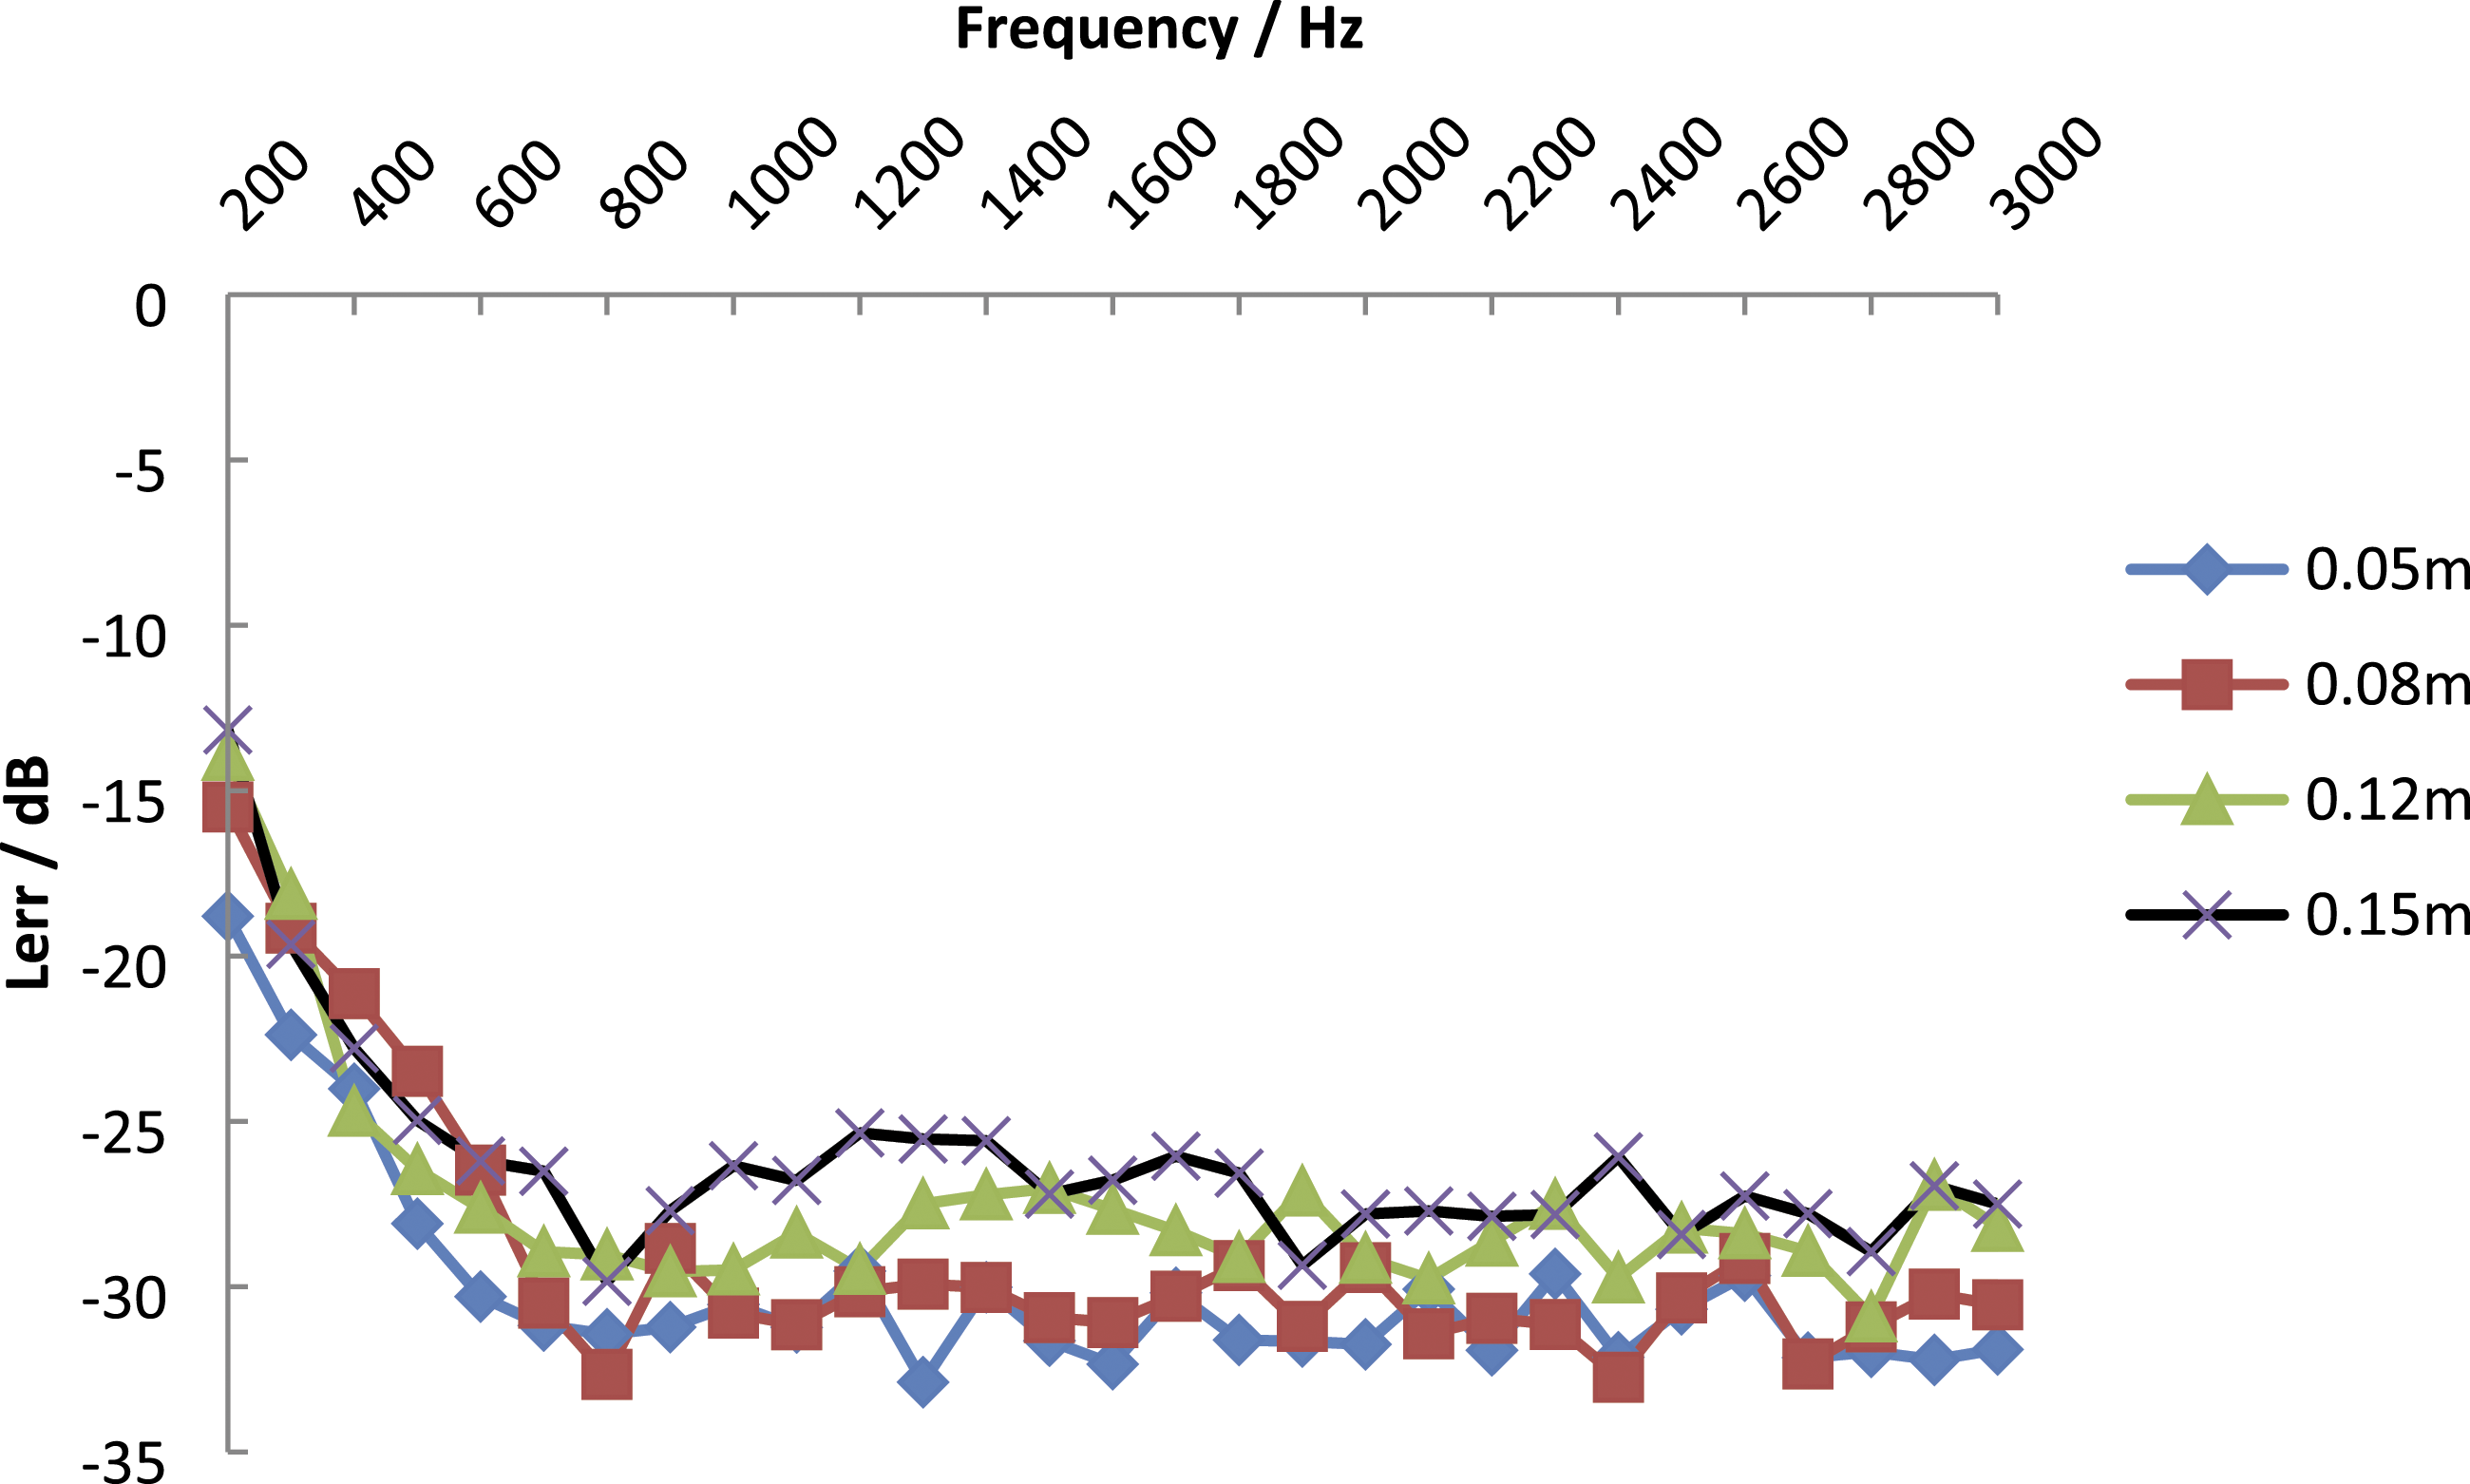
It can be seen from Figure 6 that at all the separation accuracies are high at all the above analysis distances. As the distance between the holographic surface and the sound source becomes higher, the separation accuracy tends to decrease.
In the case of 49 holographic surface measuring points and a measuring distance of 0.1 m, the influence of the number of equivalent sources on the separation accuracy is analyzed. The number of equivalent sources of each sound source uses the same calculation. It is divided into four calculations, where the numbers of equivalent sources are 22, 44, 74, and 112, respectively. The calculation results are shown in Figure 7. Influence of the number of equivalent sources on the separation results.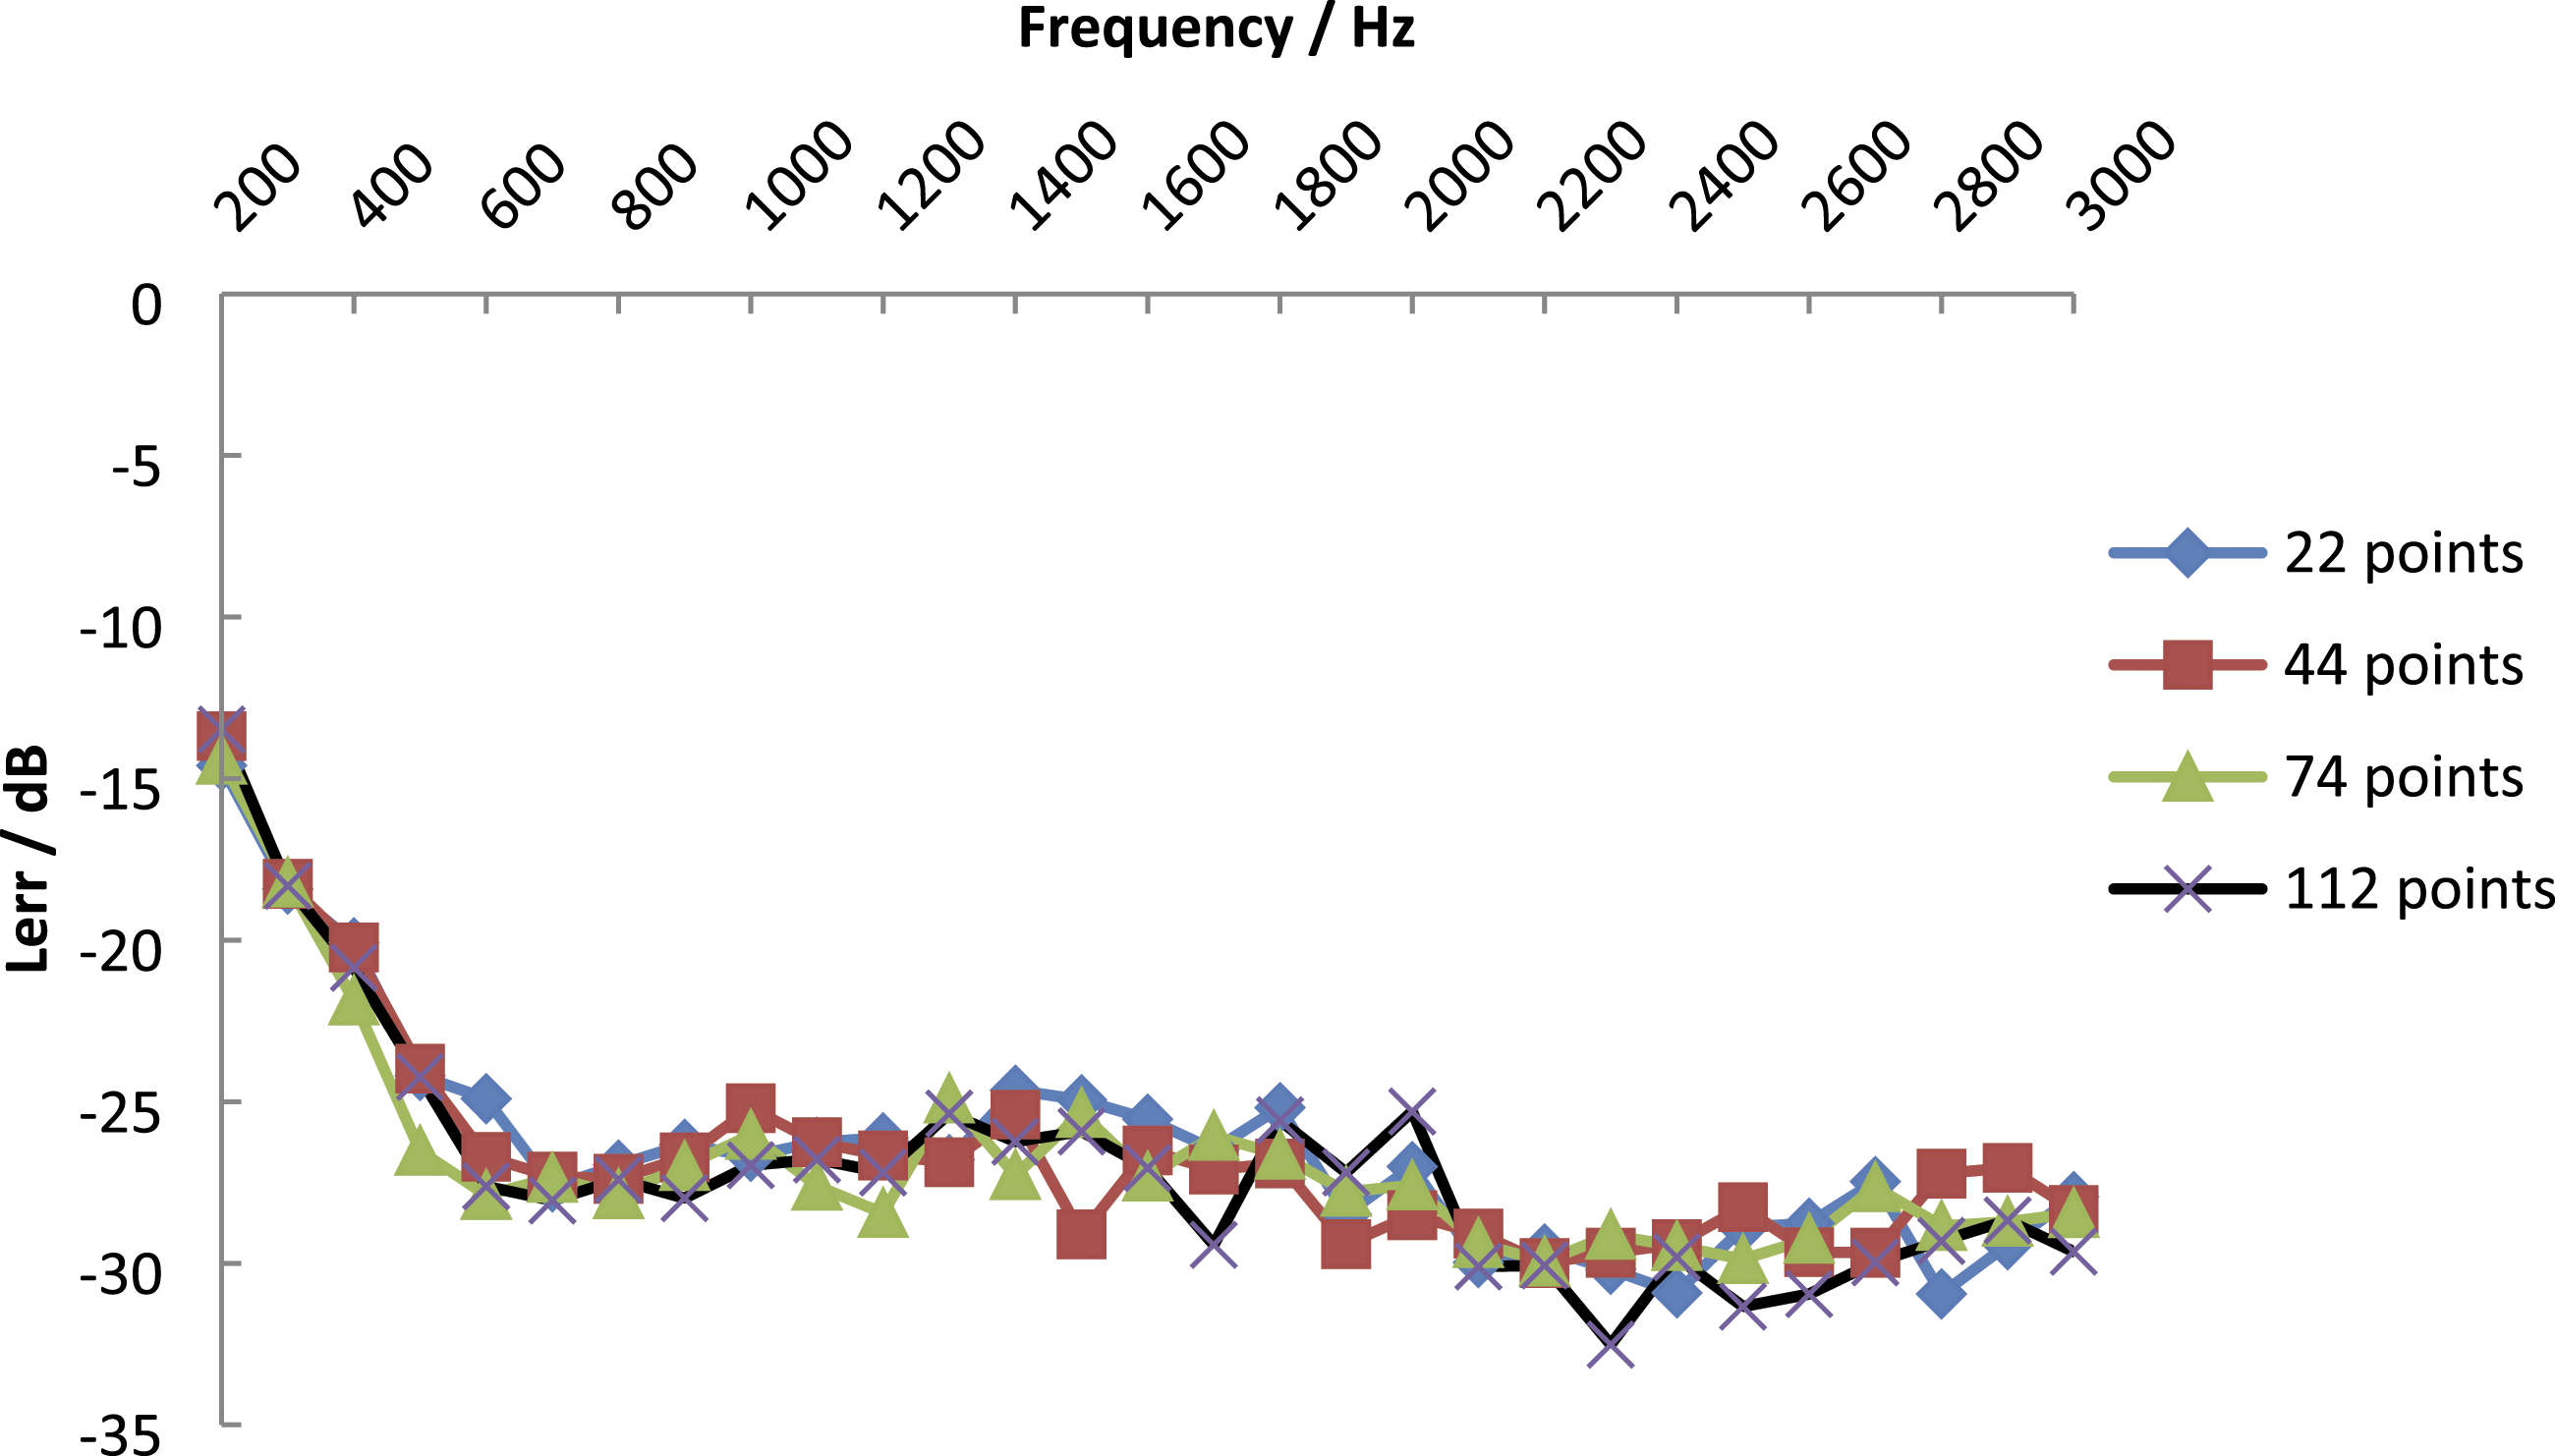
As shown in Figure 7, in the entire analysis of the frequency band, the change of the numbers of equivalent sources does not greatly affect the separation accuracy and is basically stable.
On the basis of measurement distance and number of equivalent sources, the influence of the array shape on separation accuracy is analyzed in Figure 8. To ensure the approximate size of the measuring surface, an 18-channel wheel array (same as the experiment array) and an 18-channel circular random array (C-Random) with a diameter of 45 cm, an 18-channel rectangular random array (R-Random) with length and width of 45 cm, and a 7*7 gird array are used for analysis. Influence of the array shape on the separation results.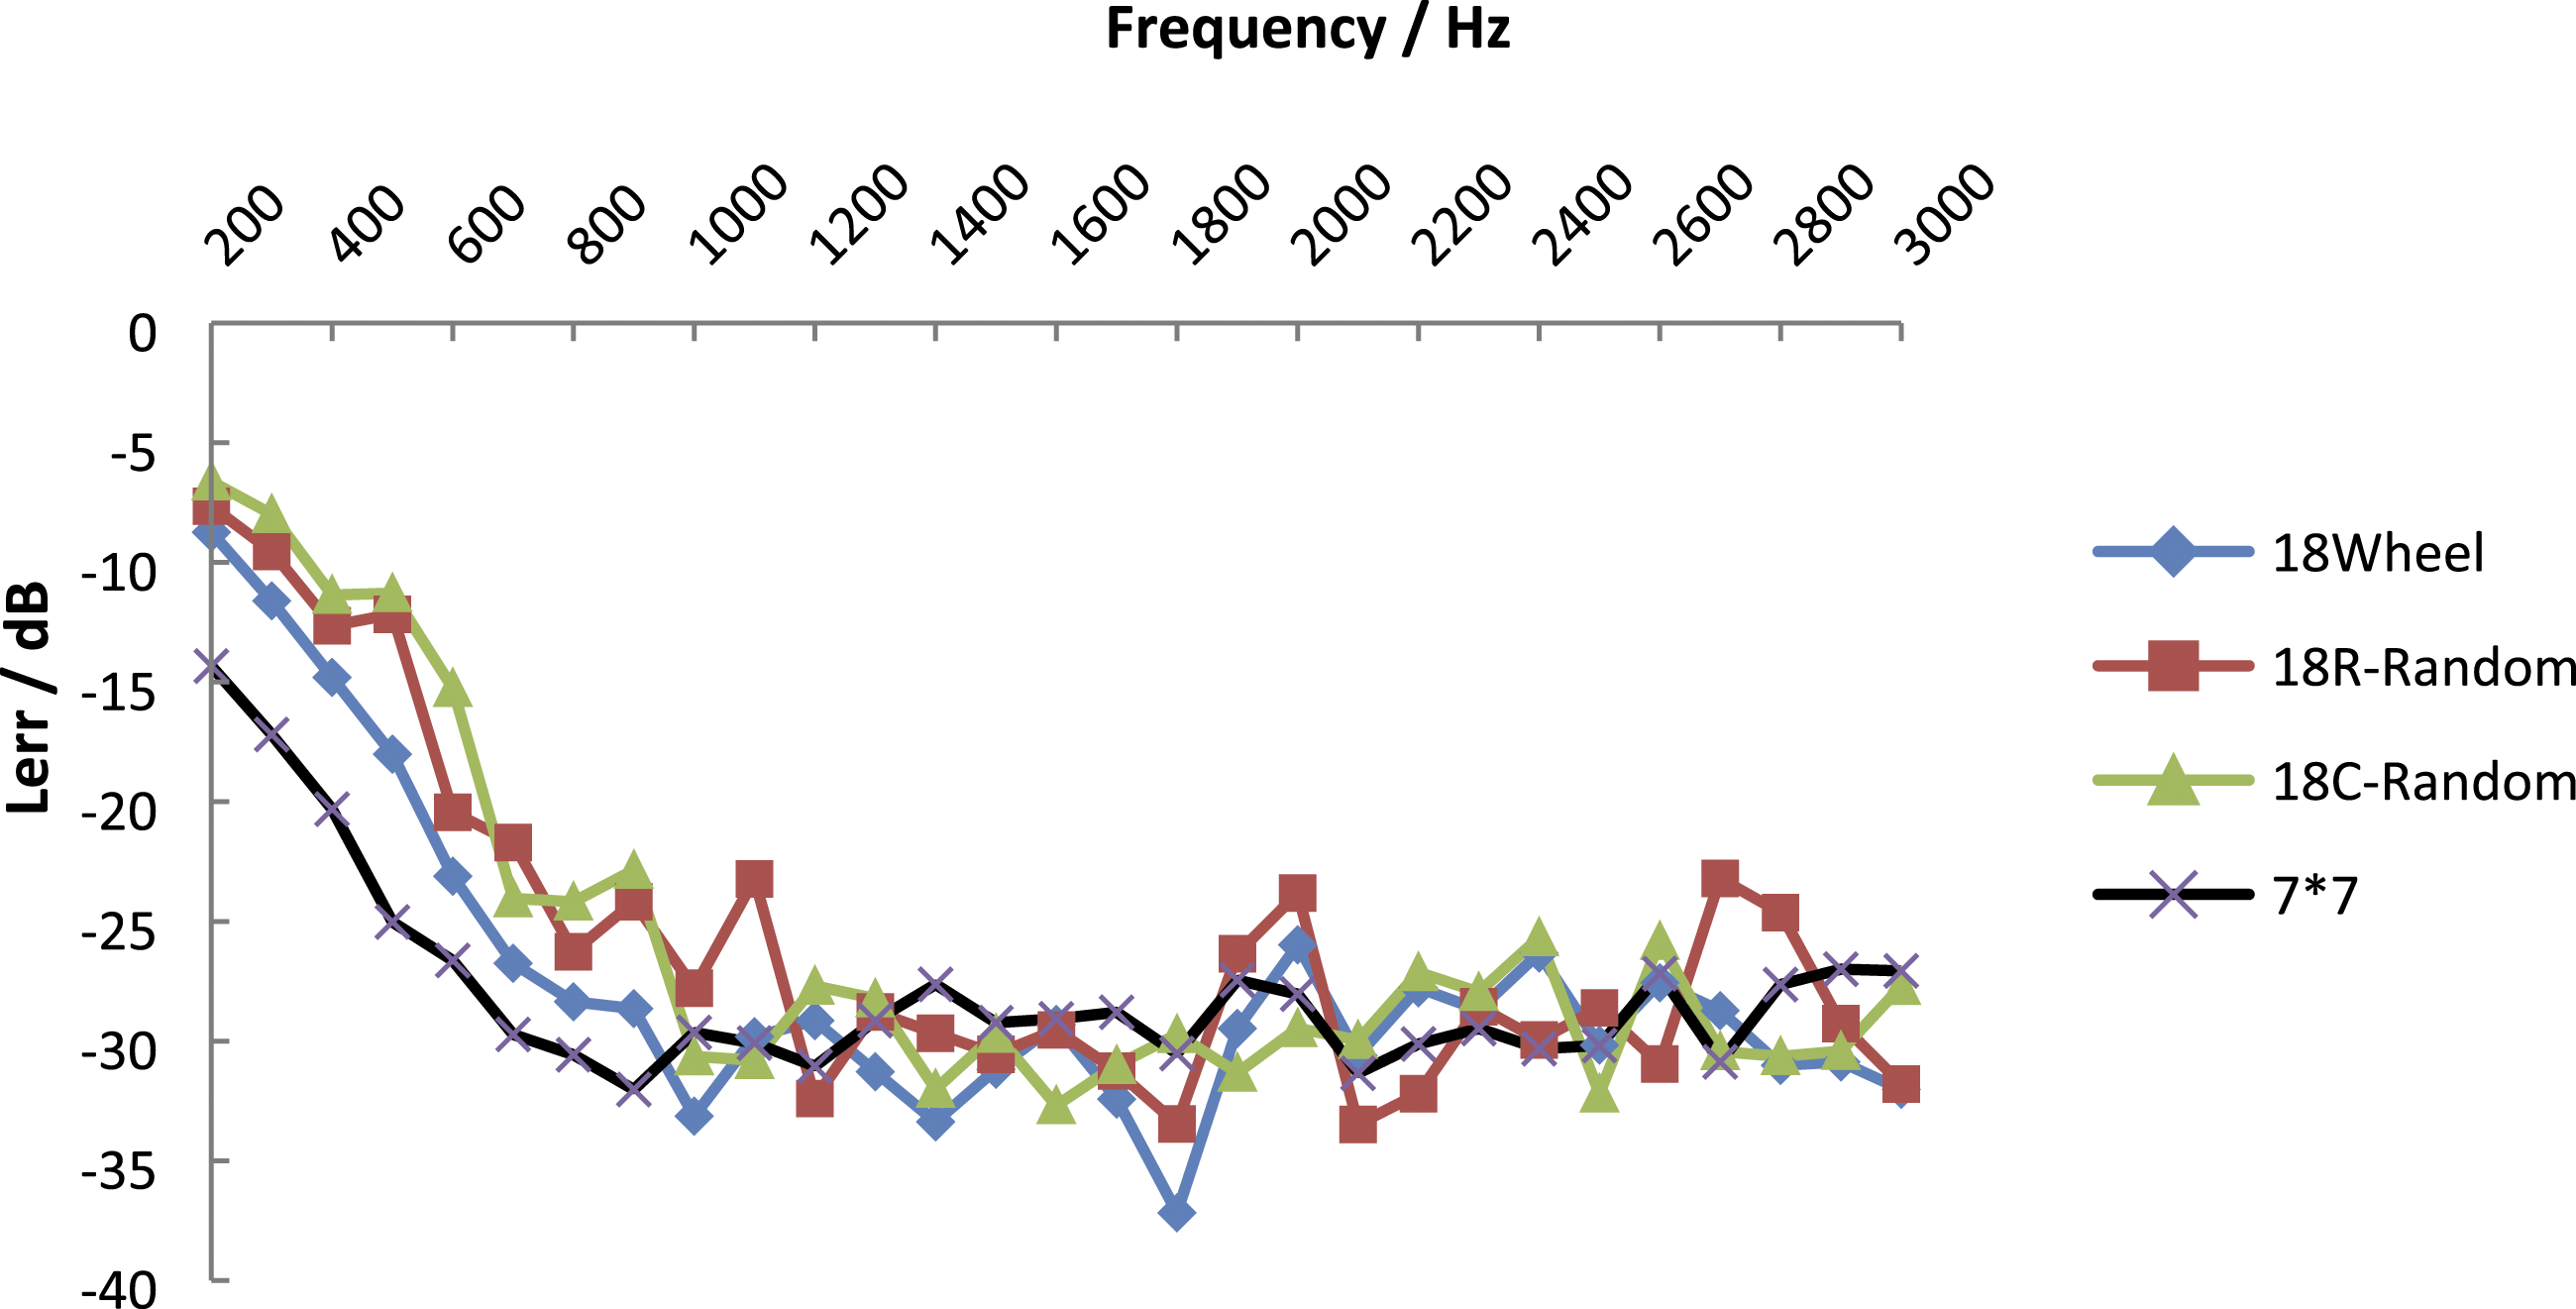
From Figure 8, we could see that 18-channel wheel and random arrays have high accuracies similar to the 7*7 grid array in the frequency of 1000–3000 Hz. Below 1000 Hz, because of the increase of the correlation of the transfer function, the separation accuracy decreases when there are few measuring points. At the same time, whether the random array is rectangular or circular has little influence on the separation error. Therefore, in the range of 1000–3000 Hz, the 18-channel wheel array or random array can be used for sound field separation or verification.
4. Practical Experiments
A B&K 18 channel array was used as the measurement array, with a diameter of 45 cm and a coordinate on the z-axis of 0.1 m. The sound source positions are placed at
Figure 9 shows the sound field relationship between the sound source and the measurement array. Coherent sound sources are located on the same side of the holographic surface. The experiment is divided into two measurements. First, we measured the value on the holographic surface when three coherent sound sources radiated sound field information at the same time. Second, we measured the value on the holographic surface radiated by the target sound source Experiment setup.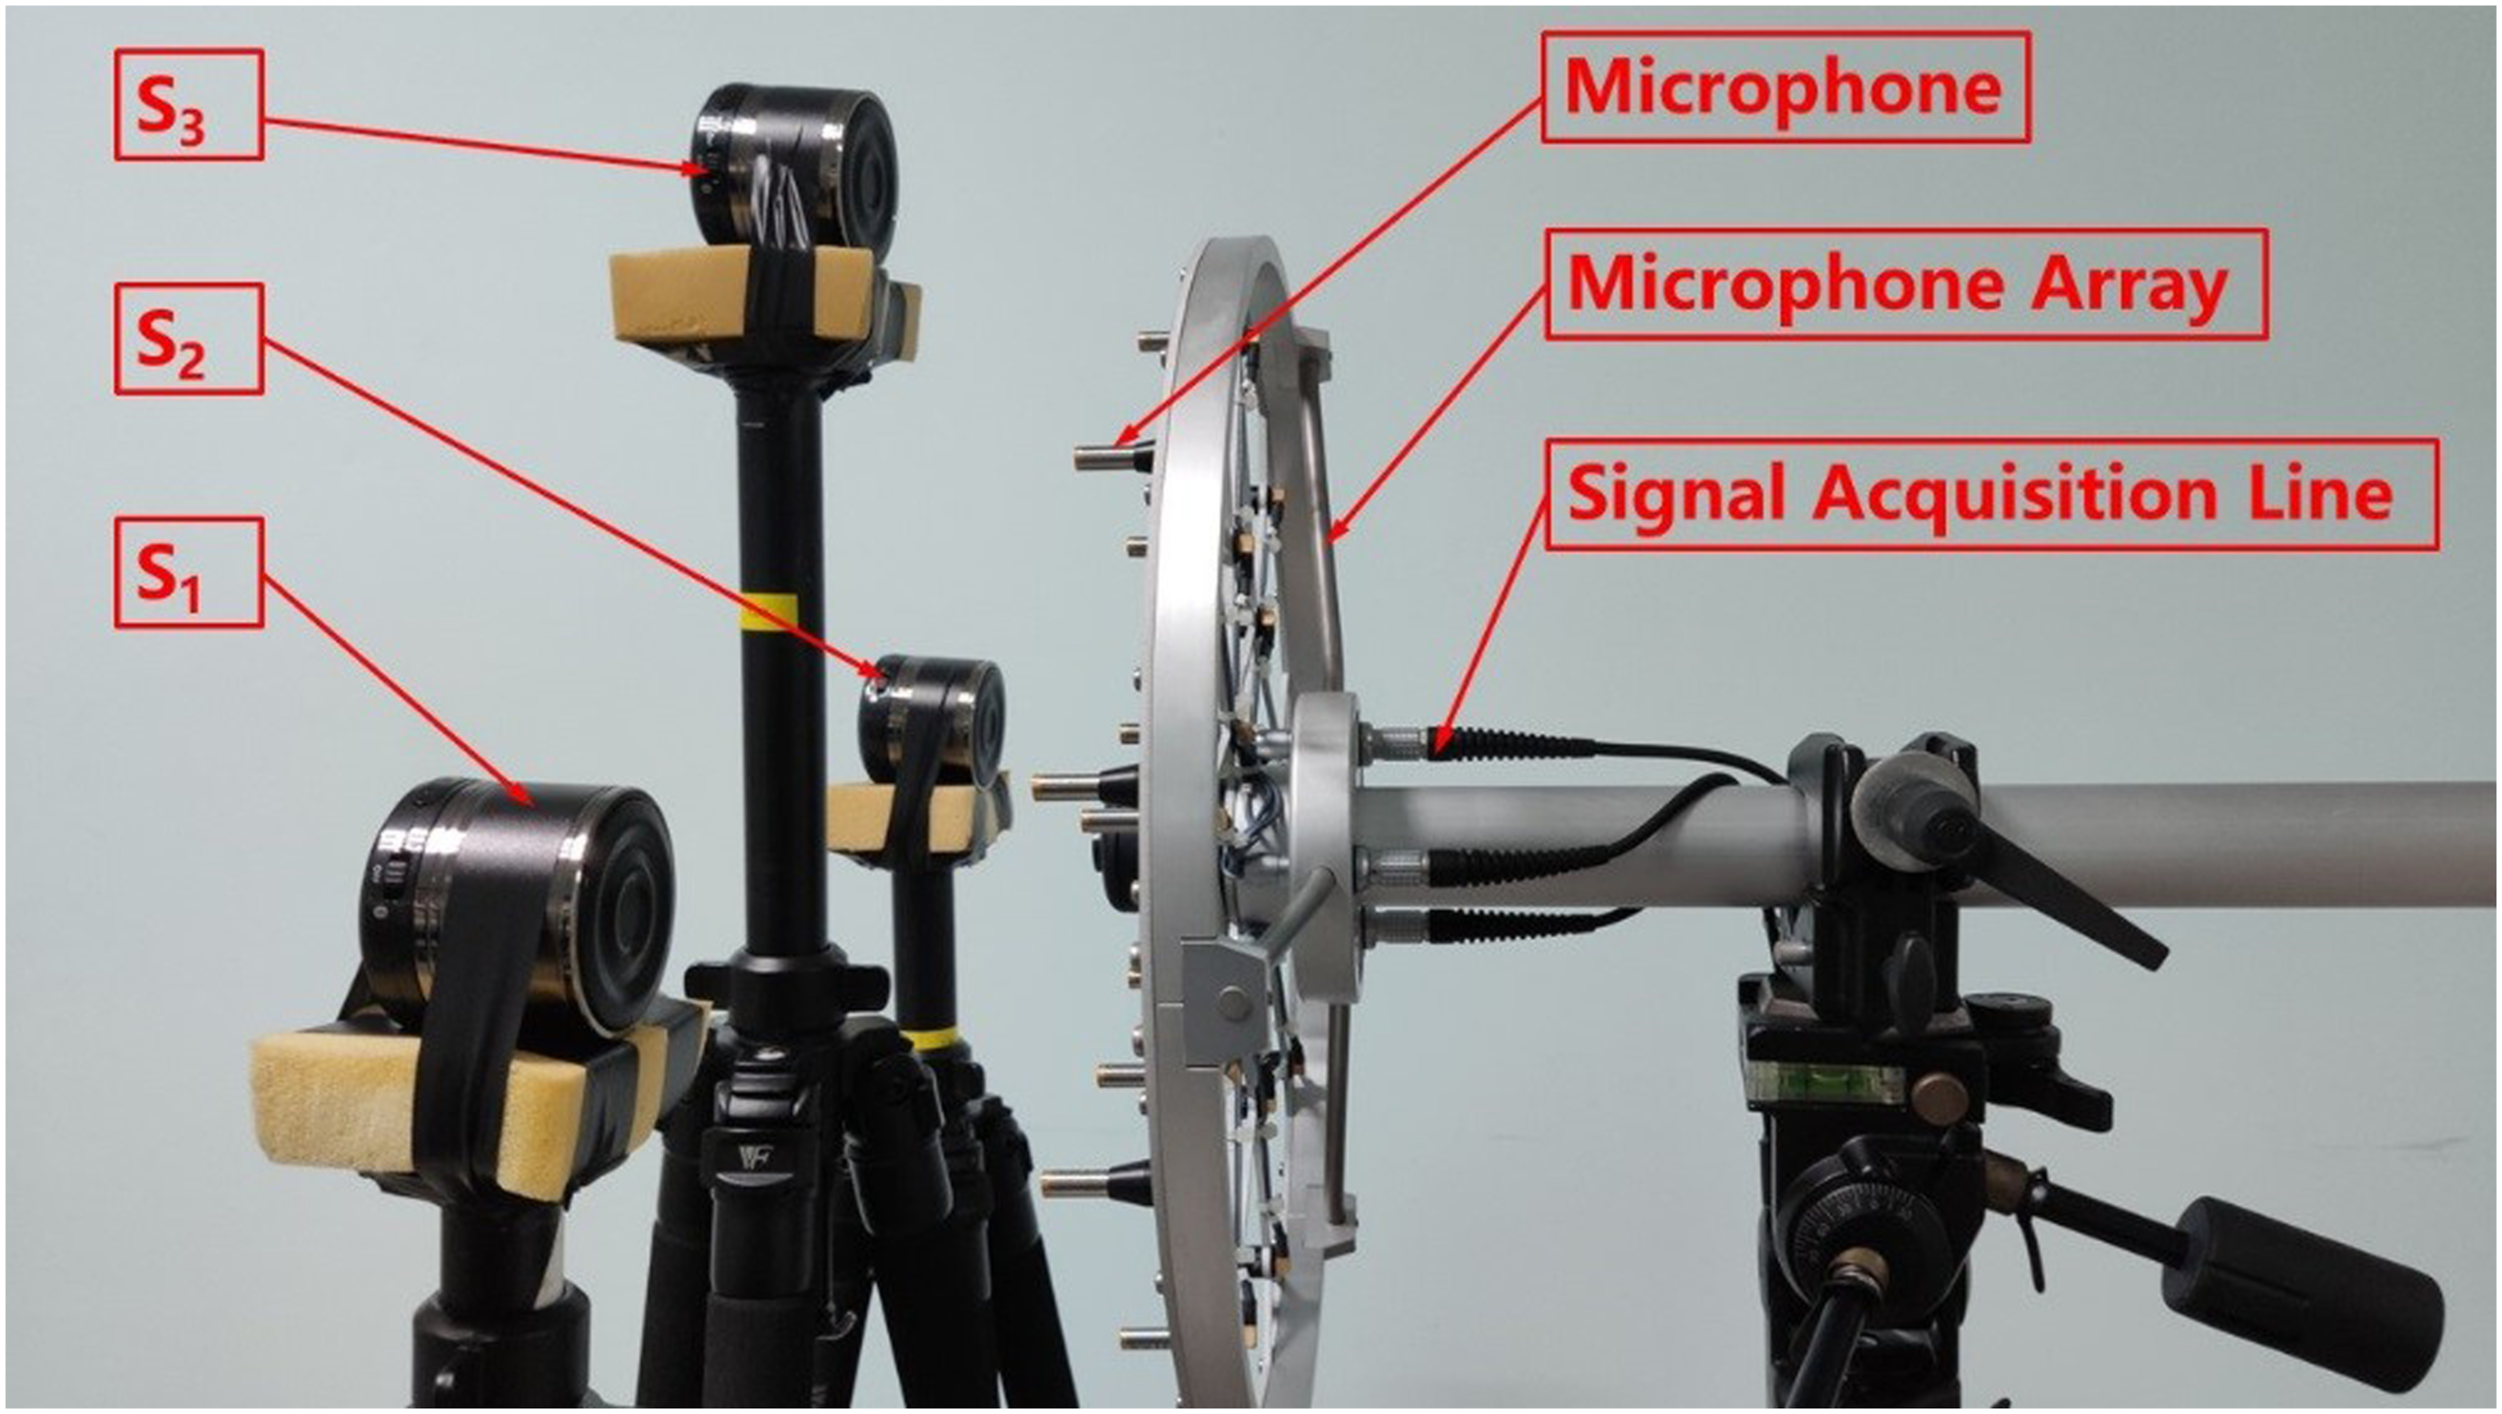
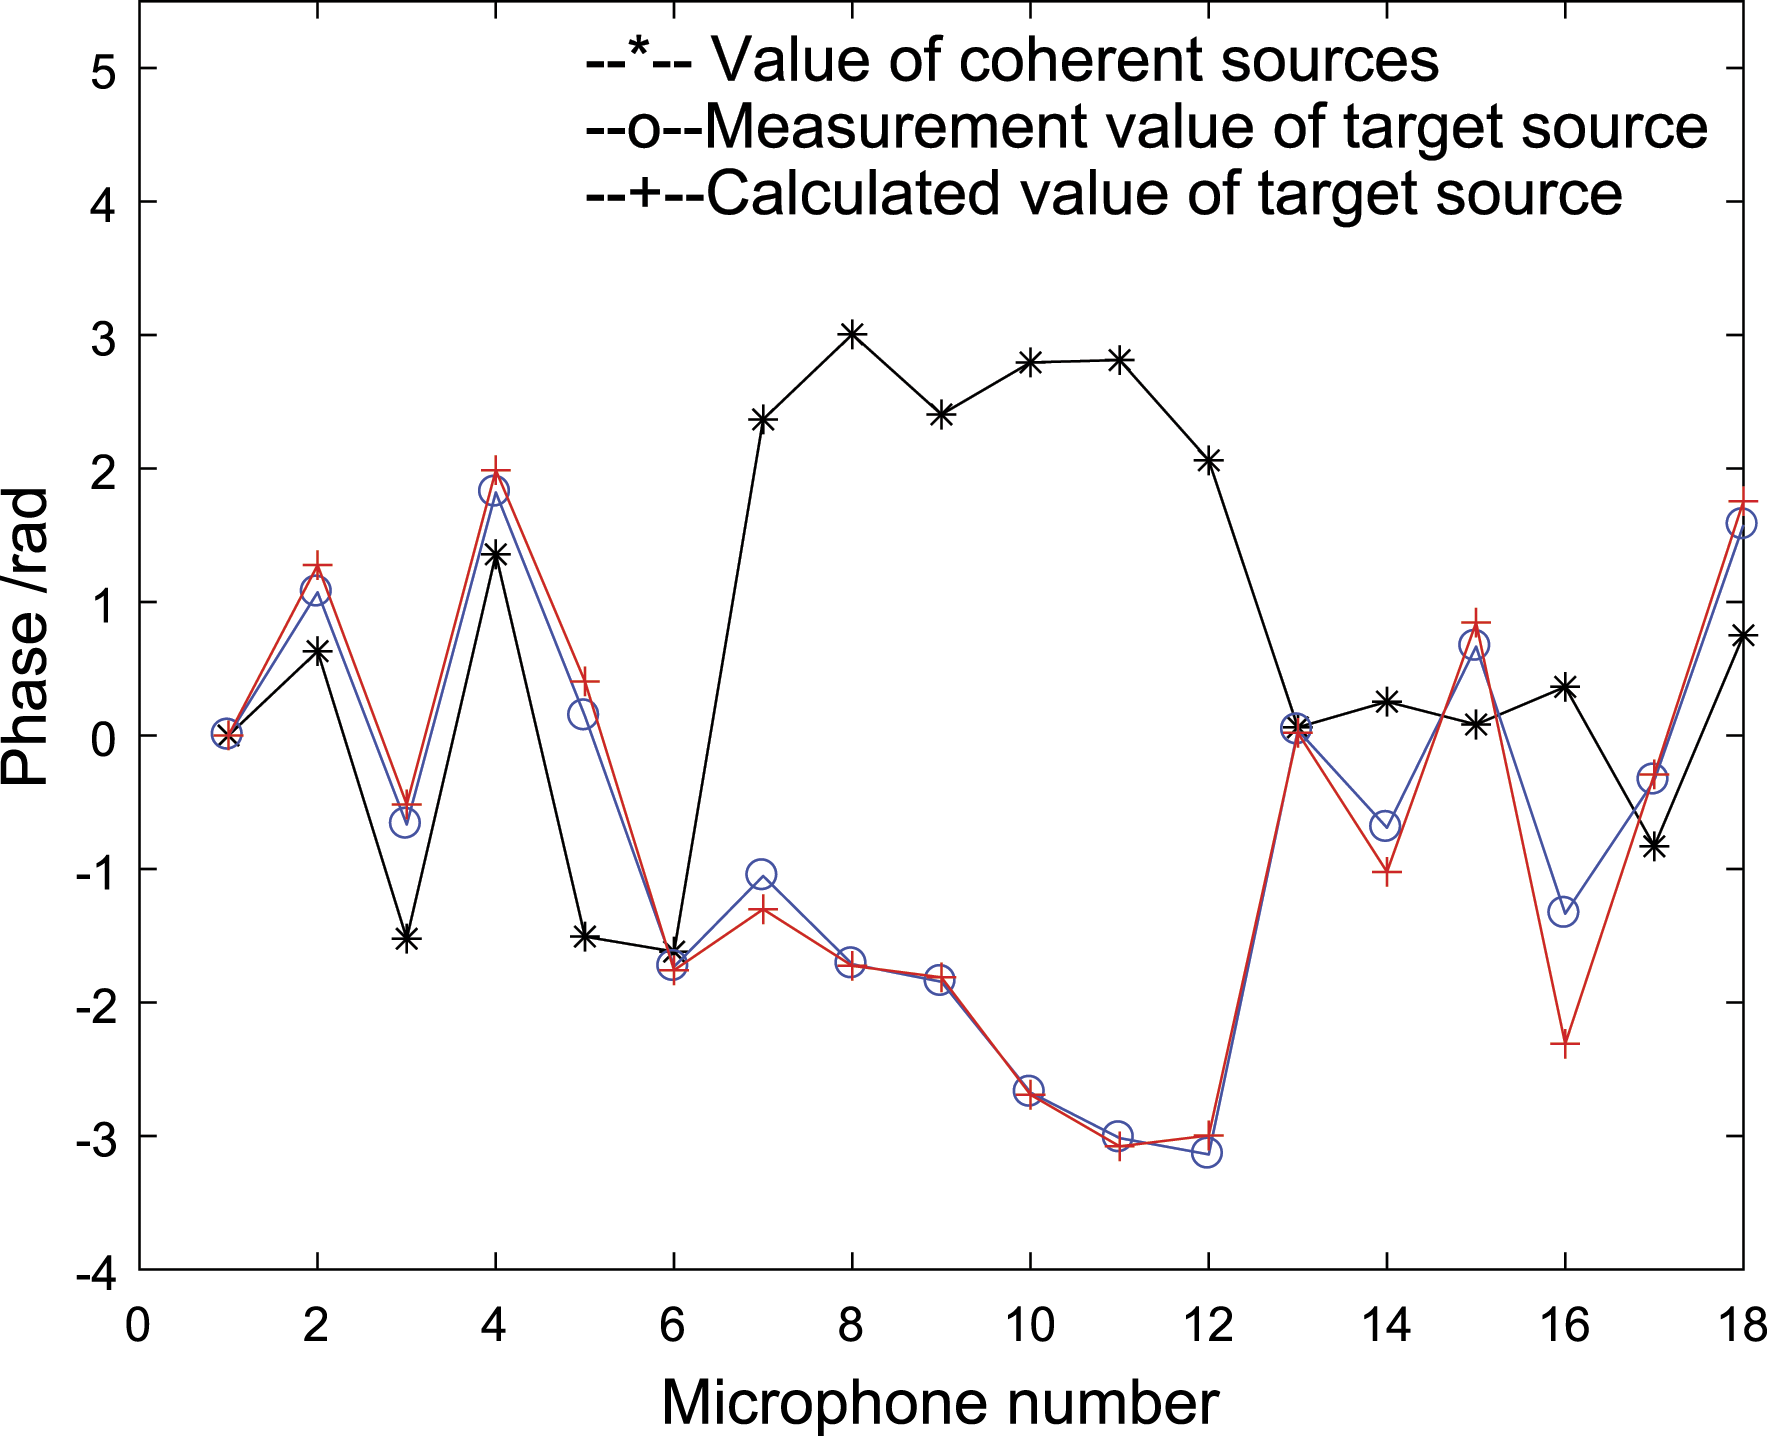
Figure 10 shows the measured sound pressure and phase of the target sound source on the holographic surface with two measurements and the value after sound field separation. In the figure, --*-- and --o-- indicate the values on the holographic surface with first and second measurement, respectively, and --+-- indicates the separation value of the target sound source on the holographic surface. It can be found from Figure 10(a) that the theoretical and calculated pressures of the target sound source have the same trend at 18 measurement points, and the values are basically close. From the phase shown in Figure 10(b), it can be seen that the theoretical value and calculated value are basically the same except at points 10, 11, and 12 points. After Comparison of measurement value and calculated value on the holographic surface. (a) Amplitude. (b) Phase. After 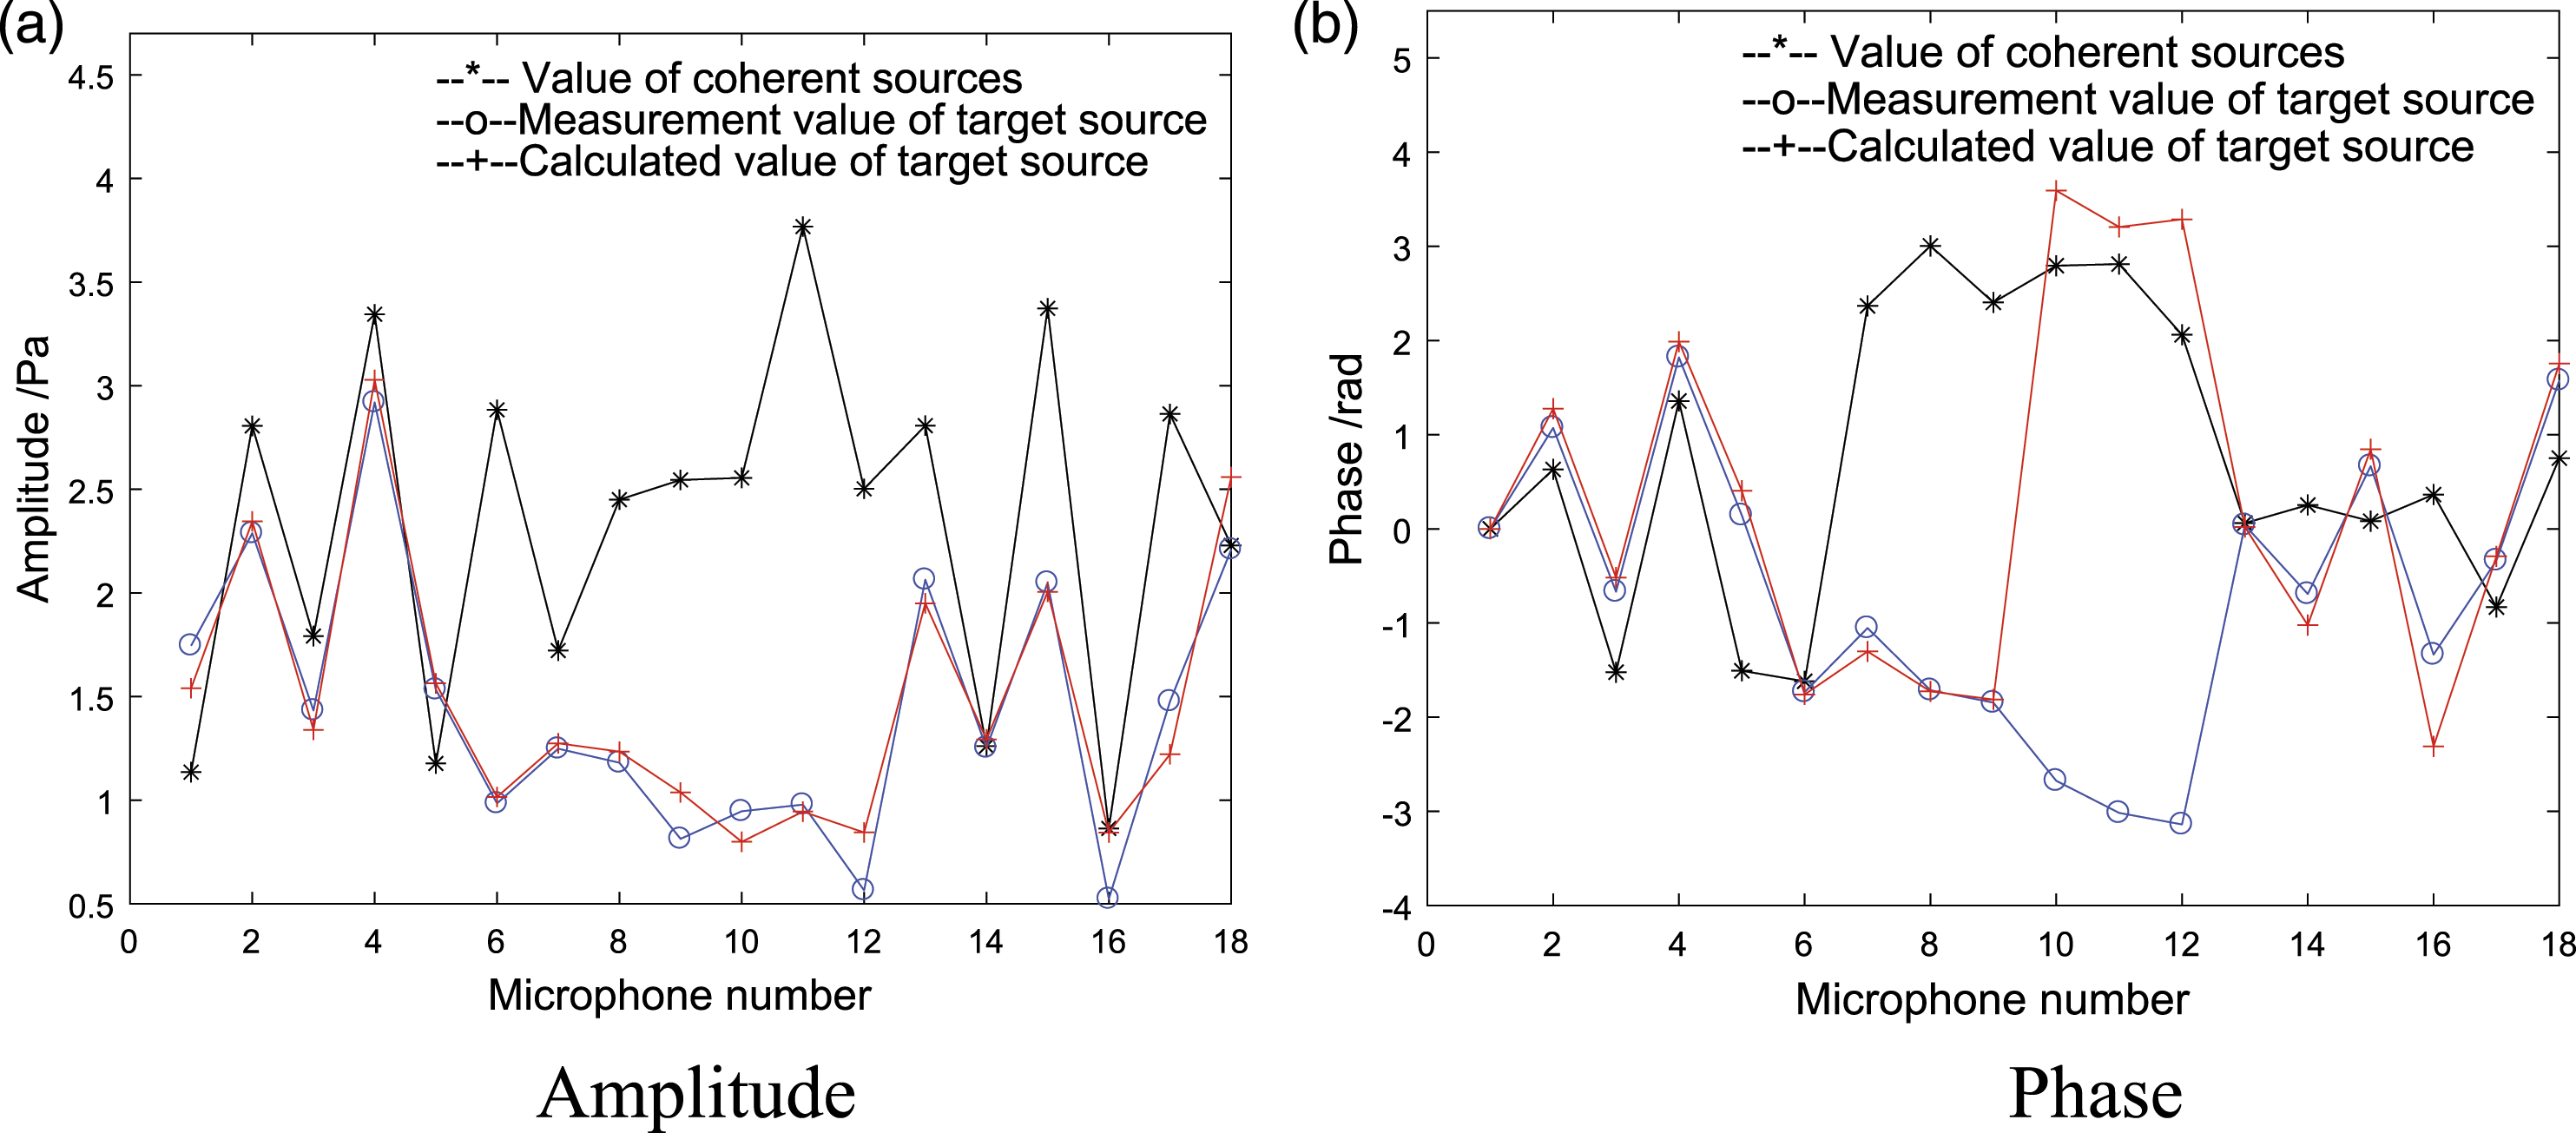
5. Conclusion
To improve the measurement efficiency and reduce the number of sensors, the calculation formula of the sound field separation method of multiple coherent sources is derived based on the ESM. Through numerical simulation, the influences of the number of measuring points, measuring distance, and the number of equivalent sources on the separation accuracy of the holographic surface are analyzed. The rectangular array with 7*7 measuring points can achieve the separation accuracy basically consistent with that of more measuring points, and the separation error of low frequency is relatively high. When the measurement distance between the holographic surface and sound source surface is changed from 0.05 to 0.15 cm, the separation accuracy tends to decrease with the increase of measurement distance. When the number of equivalent sources of each sound source changes from 22 to 112, the separation accuracy is high and stable. The accuracy of the 18-channel wheel array or random array is similar to that of the 7*7 grid array in the range of 1000–3000 Hz. The actual experiments further prove the correctness and effectiveness of the method.
Footnotes
Declaration of conflicting interests
The author(s) declared no potential conflicts of interest with respect to the research, authorship, and/or publication of this article.
Funding
The author(s) disclosed receipt of the following financial support for the research, authorship, and/or publication of this article: This study was supported by the National Natural Science Foundation of China (grant no. 61701397 and 51705419) and the Fundamental Research Funds for the Central Universities, CHD (grant no. 300102210512 and 300102210511).