
Abstract
The torsional vibration problems often occur to industrial robots during start and stop due to the use of flexible wheel in harmonic gear reducer as a transmission pair. Because of the influence of nonlinear stiffness, transmission error, and other factors, the nonlinear torsional vibration of harmonic gear reducer will affect the stability and reliability of transmission system. In this article, based on the structural characteristics of the harmonic gear reducer, considering the nonlinear torsional stiffness, transmission error, meshing damping, and other factors, the nonlinear torsional dynamic model of the harmonic gear reducer was established with the theoretical analysis and the experimental results. Based on this model, the influence of various factors such as rotational speed, moment of inertia, torsional stiffness, and transmission error on the nonlinear torsional vibration of harmonic gear reducer was discussed. The results show that the vibration amplitude of harmonic gear reducer increases with the increase of speed, transmission error, and motor inertia, and decreases with the increase of load inertia and damping. The dynamic model and analysis method established in the study can provide the theoretical guidance for the optimal design and the vibration reduction of harmonic gear reducer.
1. Introduction
Harmonic gear reducer is a kind of drive device, which can transfer power through the flexible wheel to produce controllable deformation. Since the deformation process of the flexible wheel is similar to the harmonic waveform, it is named a harmonic gear reducer. It was first invented by Musser (1960) for aerospace applications and patented and exhibited in the next few years. The dynamic characteristics of harmonic gear reducers (such as vibration, noise, and smoothness) are important indicators for measuring their performance. Compared with the traditional gear transmission system, it has the difference of the form and structure of the harmonic transmission, which mainly relies on the controllable deformation of the particular wheel as a flexible member to transmit power. However, with the development of high-performance harmonic gear reducer, the dynamic characteristics of harmonic gear reducer also put forward more stringent requirements. For example, it is necessary to consider the manufacturing and assembly error of harmonic gear reducer, friction and nonlinear torsional stiffness during operation, etc.
In recent years, there have been some studies on the dynamic characteristics of gear transmission systems based on the theory of nonlinear vibration. Li et al. (2011) and Wu et al. (2011, 2012) studied the bifurcation characteristics of the gear system by means of nonlinear vibration mathematical model and analyzed the influence of parameters such as rotating speed, tooth-side clearance, and meshing damping on its stability. Li et al. (2016) studied the nonlinear dynamic characteristics of a gear pair system with dynamic backlash under internal and external periodic excitation theoretically by using the incremental harmonic balance method. The compound planetary gear sets lumped parameter dynamic model, incorporating parametric gear mesh stiffness fluctuations, transmission errors, and gear backlash which were established by Zhu et al. (2015), and Yang et al. (2011) studied the inherent characteristics of the compound planetary gear based on the factors of translation, torsional vibration, and static transmission error of each component. Zhu et al. (2010) gave the calculation formula of friction arm between tooth pairs and established the nonlinear vibration model considering meshing displacement and meshing force.
In the aspect of harmonic gear reducer dynamics modeling and analysis, Tuttle and Seering (1996) used experimental observations to guide the development and establishment of a model describing harmonic drive operation. Unlike less detailed representations, this model was capable of replicating many of the features observed in actual harmonic drive dynamic response. Ghorbel et al. (2001) found that the mechanism of the transmission error in the current literature was not clearly characterized. They studied the theoretical analysis and experimental results of the harmonic drive error using the special harmonic drive test instrument. Transmission error is a very important performance index in the field of precision gear transmission. Xin et al. (2005) established nonlinear model of harmonic gear transmission system and improved the calculation formula of transmission error. Gravagno et al. (2016) discussed the influence of the shape of the wave generator on the pure kinematics error of the harmonic gear reducer and carried out quantitative evaluation. Curt et al. (2012) regarded the harmonic drive as a black box and studied the hysteresis behavior of the transmission by observing the input–output relationship of the transmission. The results show that the combination of hysteresis model, nonlinear viscous friction model, and spectral motion error model can accurately reflect the characteristics of harmonic drive. Masoumi and Alimohammadi (2013) applied the shell theory to analyze the vibration of the harmonic drive system and calculated the natural frequency of the system. In order to design harmonic gear profile,Chen et al. (2014a, 2014b) proposed a new mechanical analysis method based on the flexure neutral line tensile deformation. Dhaouadi et al. (2003) found that the friction of the system played a major role in the shape of the hysteretic curve, while the flexibility of the system determined the nonlinear part of the hysteretic curve. Therefore, there are many factors that affect the transmission performance of gear reducer. The mismatch of gear parameters may cause vibration instability (Gao et al., 2020). Based on the above problems, Li (2011, 2012) designed an experiment with interactive orthogonal design to analyze the influence of different factors on transmission efficiency.
Harmonic gear reducer is widely used in the end joints of industrial robots. However, when the robot is started and braked in emergency, the end of the manipulator is prone to vibration problems. The inevitable transmission error and nonlinear torsional stiffness of harmonic gear reducer are the main reasons for this problem. There is still a lack of theoretical research in this area, which is worthy of further discussion. Therefore, this article studies the dynamic characteristics of the system and the torsional vibration of the harmonic gear reducer based on the theoretical analysis and experimental data. A nonlinear dynamic model considering nonlinear torsional stiffness, meshing damping, and transmission error is established. The influence of various factors on the nonlinear torsional vibration of harmonic gear reducer is discussed, which provides a theoretical basis for the optimal design of harmonic gear reducer.
2. Dynamic model
The vibration system can be divided into continuous system and discrete system according to the mathematical model of structure. Continuous systems require numerous generalized coordinates to determine the vibration of system at any instantaneous position. It is an accurate simulation for the real motion state, but the computation is more complicated than that of discrete systems, and sometimes it is impossible to calculate. For the actual situation, choosing a continuous system or a simplified system should be determined according to the research purpose of actual problem and the accuracy requirement of the problem to be solved. For the most engineering problems, the accuracy of discrete systems is accurate enough.
As a rigid–flexible coupling precise transmission component, the harmonic gear reducer has many factors affecting its torsional vibration characteristics. It is unrealistic to fully consider all the factors. Therefore, it is necessary to simplify its modeling process and can be finished as follows to establish a nonlinear dynamic model: The mass of each part is concentrated and there is no eccentric excitation. The axial small jitter of the system can be negligible. The meshing stiffness between gears changes with time, and the bearings may generate friction. These are ignored.
Based on the above assumptions, in order to establish the dynamic model of harmonic drive, this article first proposed a physical model of harmonic drive. As shown in Figure 1, all components are bolted to the mounting bracket. In Figure 1, J
m
is the lumped moment of inertia from the driving side and J
l
is the lumped moment of inertia from the loading side, which mainly includes the motor spindle and the experimental shaft section. Due to the misalignment of all bearings on the motor and load side and the coupling of damping between different components, that is, B
m
on the motor side and B
l
on the load side, B
ml
is the damping of the wave generator on the cup-shaped flexible wheel and B
sp
is the damping of the flexible wheel meshing with the rigid wheel. Based on the geometry of the system, these parameters were obtained by estimating the viscous damping factor and the constant friction torque from experiments at different speeds. In order to consider the influence of flexible wheel’s flexibility, it was assumed that there is a torsion spring between the input end and the output end, which is characterized by a variation of the stiffness coefficient K. In order to simulate the nonlinear torsional stiffness of the harmonic gear reducer, the specific value of which will be given later. Harmonic drive model.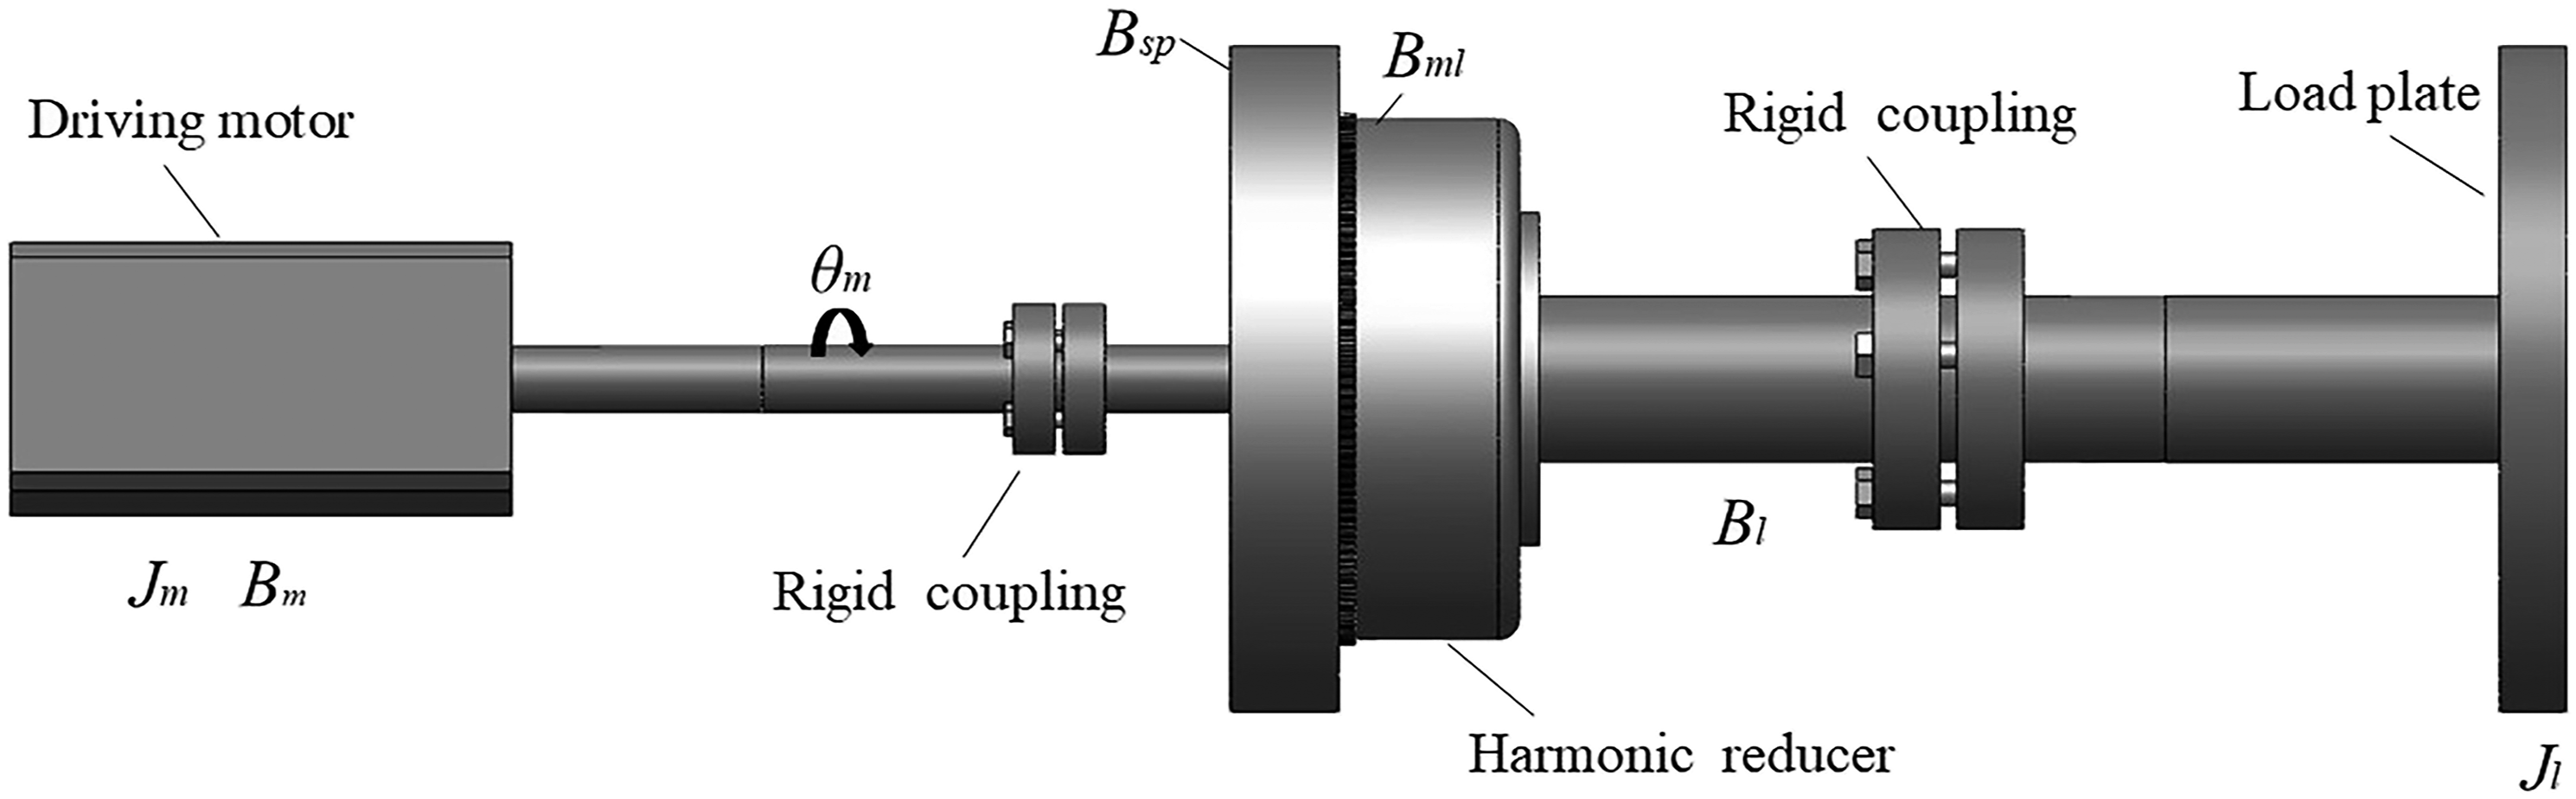
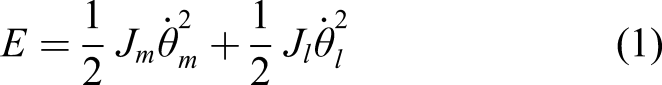
The kinetic energy of the system consists of the energy generated by the drive motor side and the moving load side component. The kinetic energy formula is

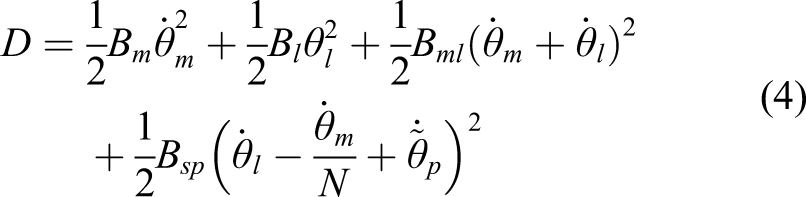
The Rayleigh dissipation function is
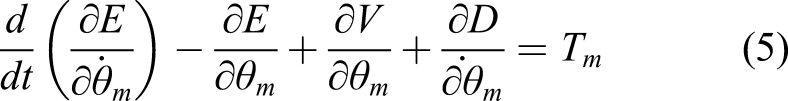
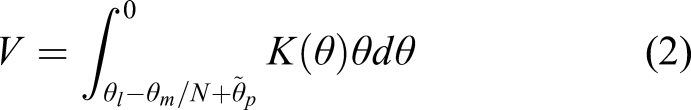
It should be noted that the
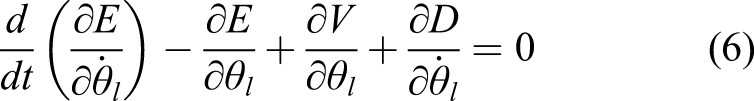
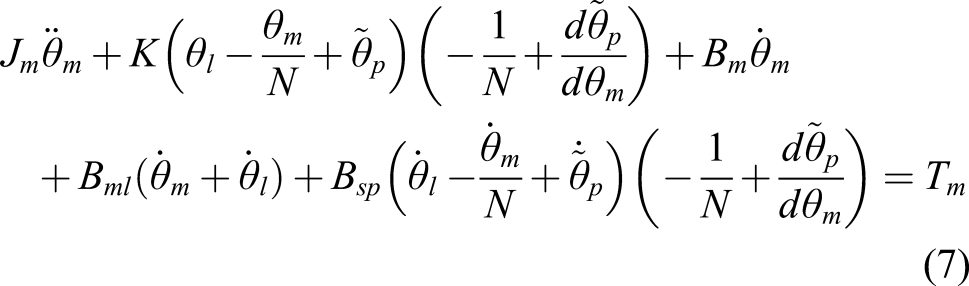
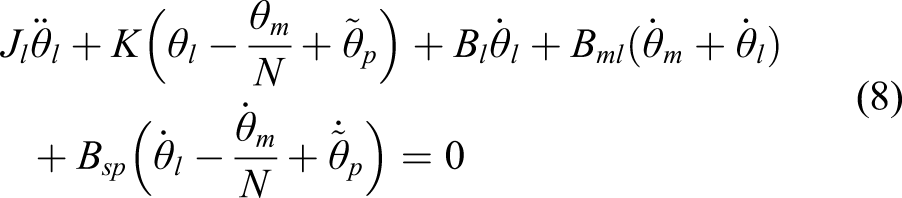
Therefore,
3. Experimental verification
In order to obtain the relevant parameters in the nonlinear dynamic equation and the theoretical analysis results of the test equation, a comprehensive test platform was designed for harmonic gear reducer. The platform can be used to test transmission error, stiffness backlash, and transmission for different types of reducers. In experimental tests, such as efficiency and starting torque, the platform can derive the rotation angle and angular velocity of the input and output at different times, which provides experimental support for the dynamic design and analysis of the harmonic gear reducer.
3.1. Experimental platform design
The test bench, consisting of a drive motor, an angle sensor, a torque sensor, a coupling, a tested part, and a motor, adopted a horizontal structure. The physical map is as shown in Figure 2. The driving motor, the torque sensor, and the tested parts were mounted on the reference platform through a high-precision coupling. The bracket mounting holes must be drawn at one time, and a pair of mounting holes were reserved in the radial direction to facilitate the expansion of the module. The pin positioning used between the brackets was designed to replace the maintenance equipment to ensure the concentricity of each component and the accuracy of repositioning. The driving motor drives the reducer to run, and the load motor loaded at the output to simulate the load of the reducer in actual operation. Harmonic gear reducer comprehensive test platform.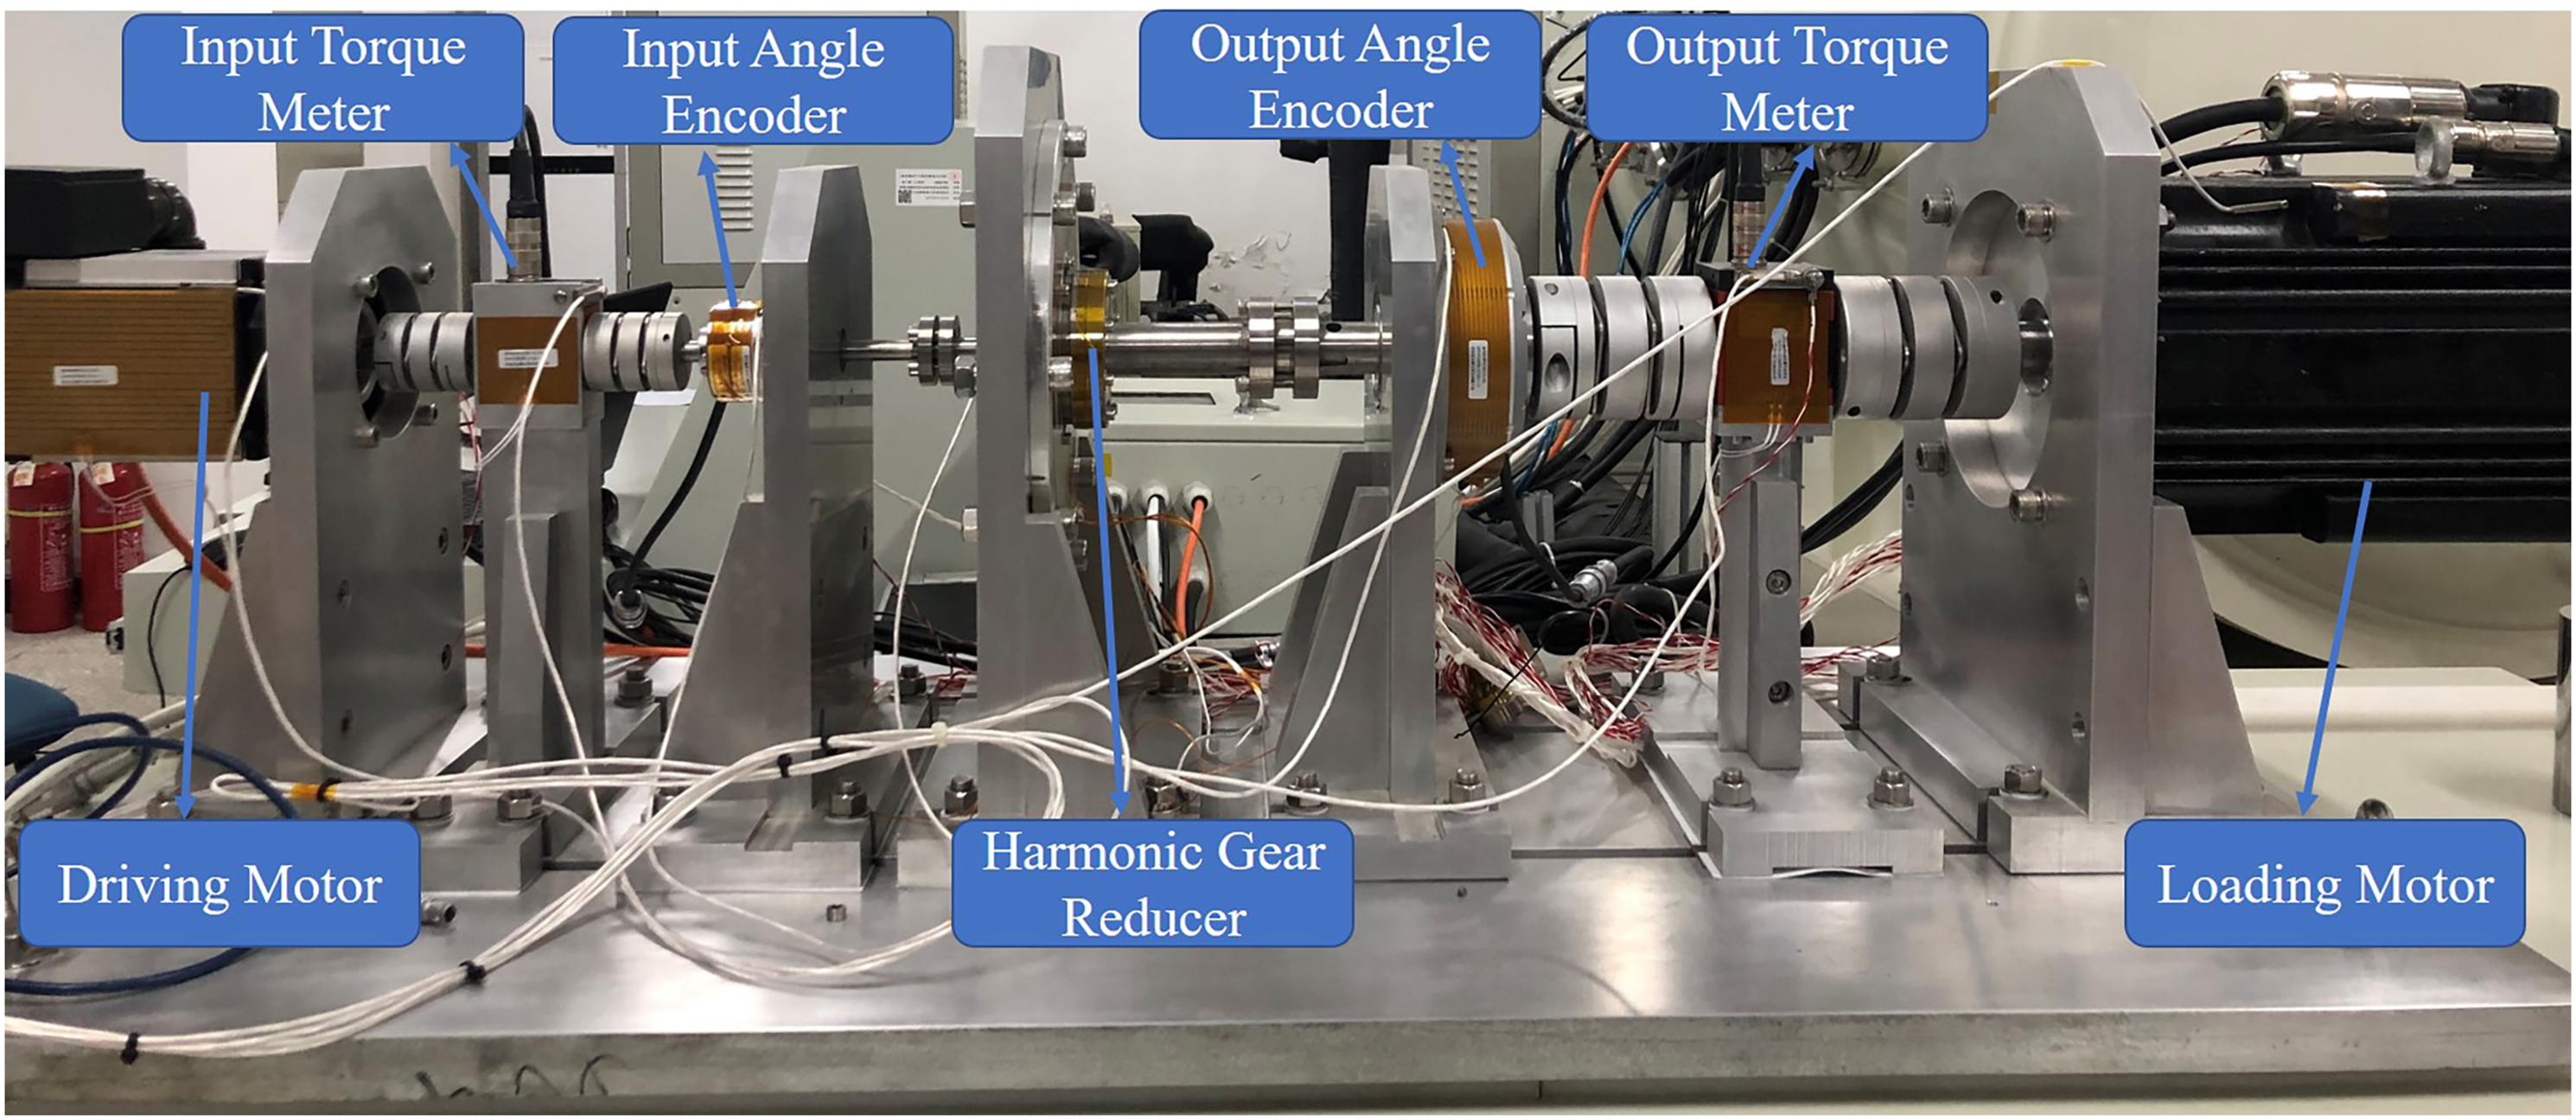
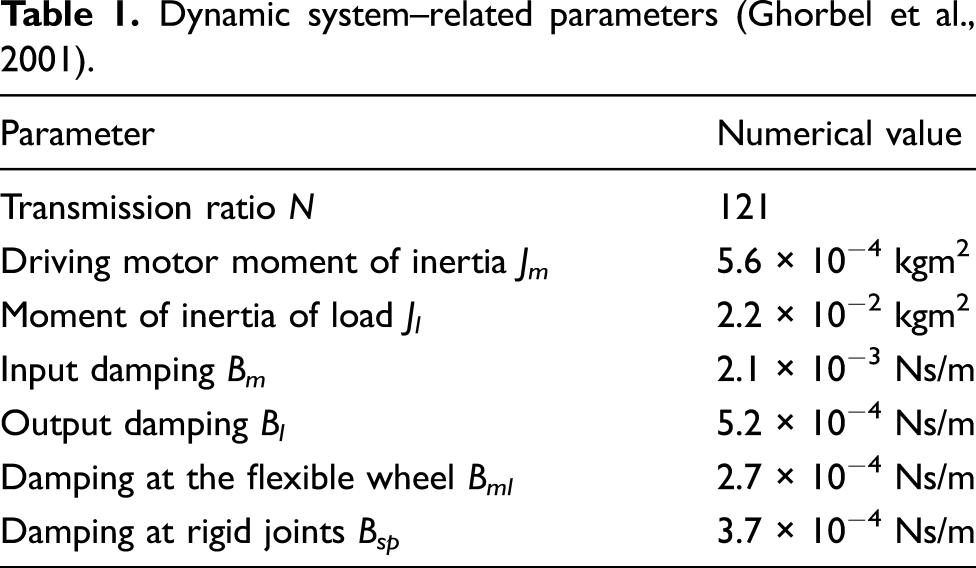
The reducer was selected from the SHF-25-120 harmonic gear reducer designed and manufactured by Harmonic Drive Systems Inc. of Japan. The motion mode of the reducer adopts wave generator input, rigid wheel output, and flexible wheel fixed. The housing of the reducer is fixed on the support base of the test bench. Transmission ratio is 121, rated torque is 67 N m, and maximum allowable load for start and stop is 167 N m.
Dynamic system–related parameters (Ghorbel et al., 2001).
3.2. Torsional stiffness test
The input shaft is fixed and loaded at the end of the output shaft. The angle of the output shaft is tested by an angular displacement sensor. The graph, test data, and encoder were cleaned before the testing. The torque is gradually applied in the same rotation direction of the output end. The angular displacement of the output shaft under different moments was tested after the rated load had been loaded. The load was unloaded and then loaded in opposite directions to test the corner value under different moments. By using the fifth-order polynomial fitting, the measured and the obtained curve and the values of each coefficient are shown in Figure 3. Torsional stiffness curve: (a) experiment curve and (b) fitting curve.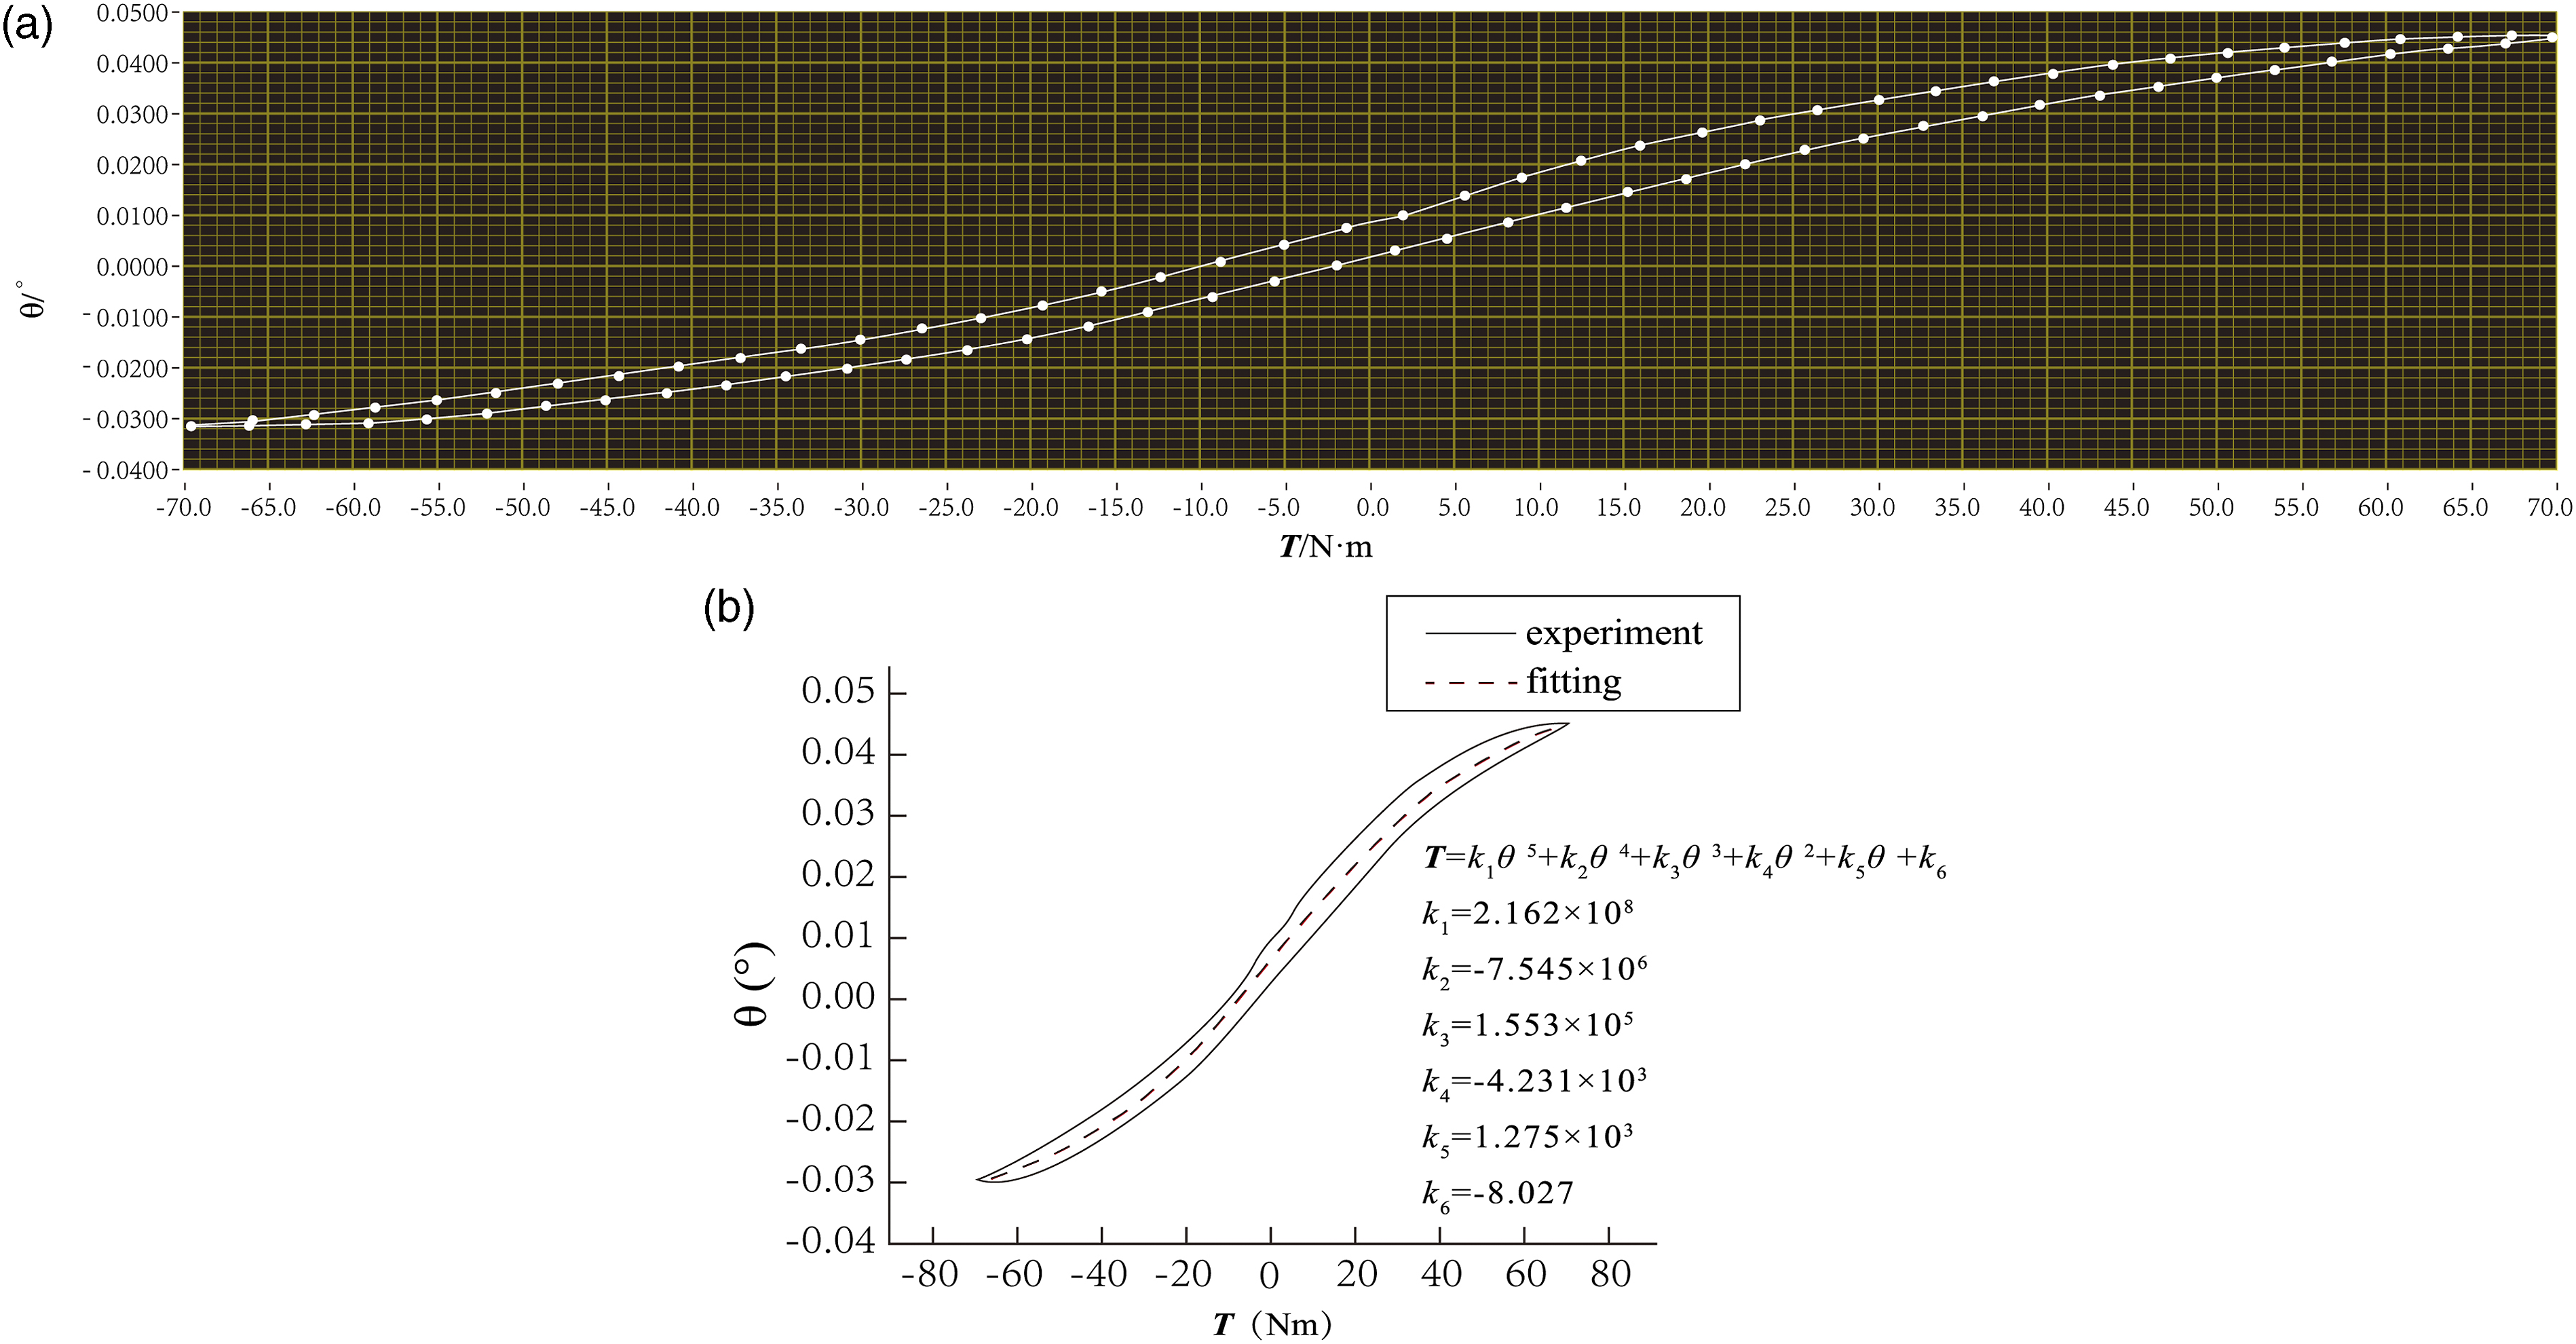
3.3. Transmission error test
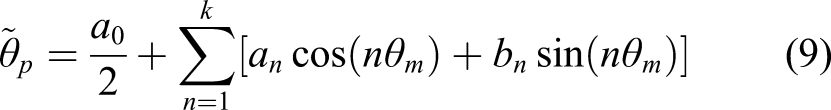
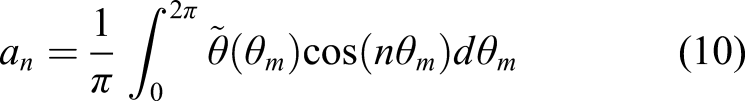
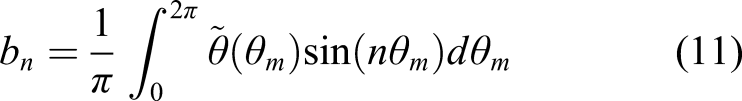
After starting the drive motor, the angles of the input shaft and the output shafts were obtained by the angle sensor and the difference of the angle between the input shaft and the output shaft was calculated. The curve for transmission error was drawn and the maximum value was collected. In order to obtain the pure static transmission error, the experiment must be carried out at an extremely low speed to avoid the vibrational excitation caused by dynamic factors such as flexibility. It is very important because the drive stiffness experimentally measured for deflections is small. Therefore, the experiment is carried out at a very low speed to suppress the influence of the flexibility of drive end, which may vary depending on the drive stiffness. Therefore, in this experiment, the rotation speed of the input shaft is selected as 15 r/min and the rotation speed is constant. The measured transmission error is as shown in Figure 4. The fitting curve in Figure 4(b) was fitted by the method of multi-order Fourier series fitting described below. At low speed (such as 15 r/min), the fitting curve is in good agreement with the experimental results. Due to the low speed, the influence of dynamic component of transmission error is reduced, which reflects the whole transmission error of harmonic gear reducer well. Experimental and simulation accuracy curve for 15 r/min: (a) experimental curve and (b) simulation curve.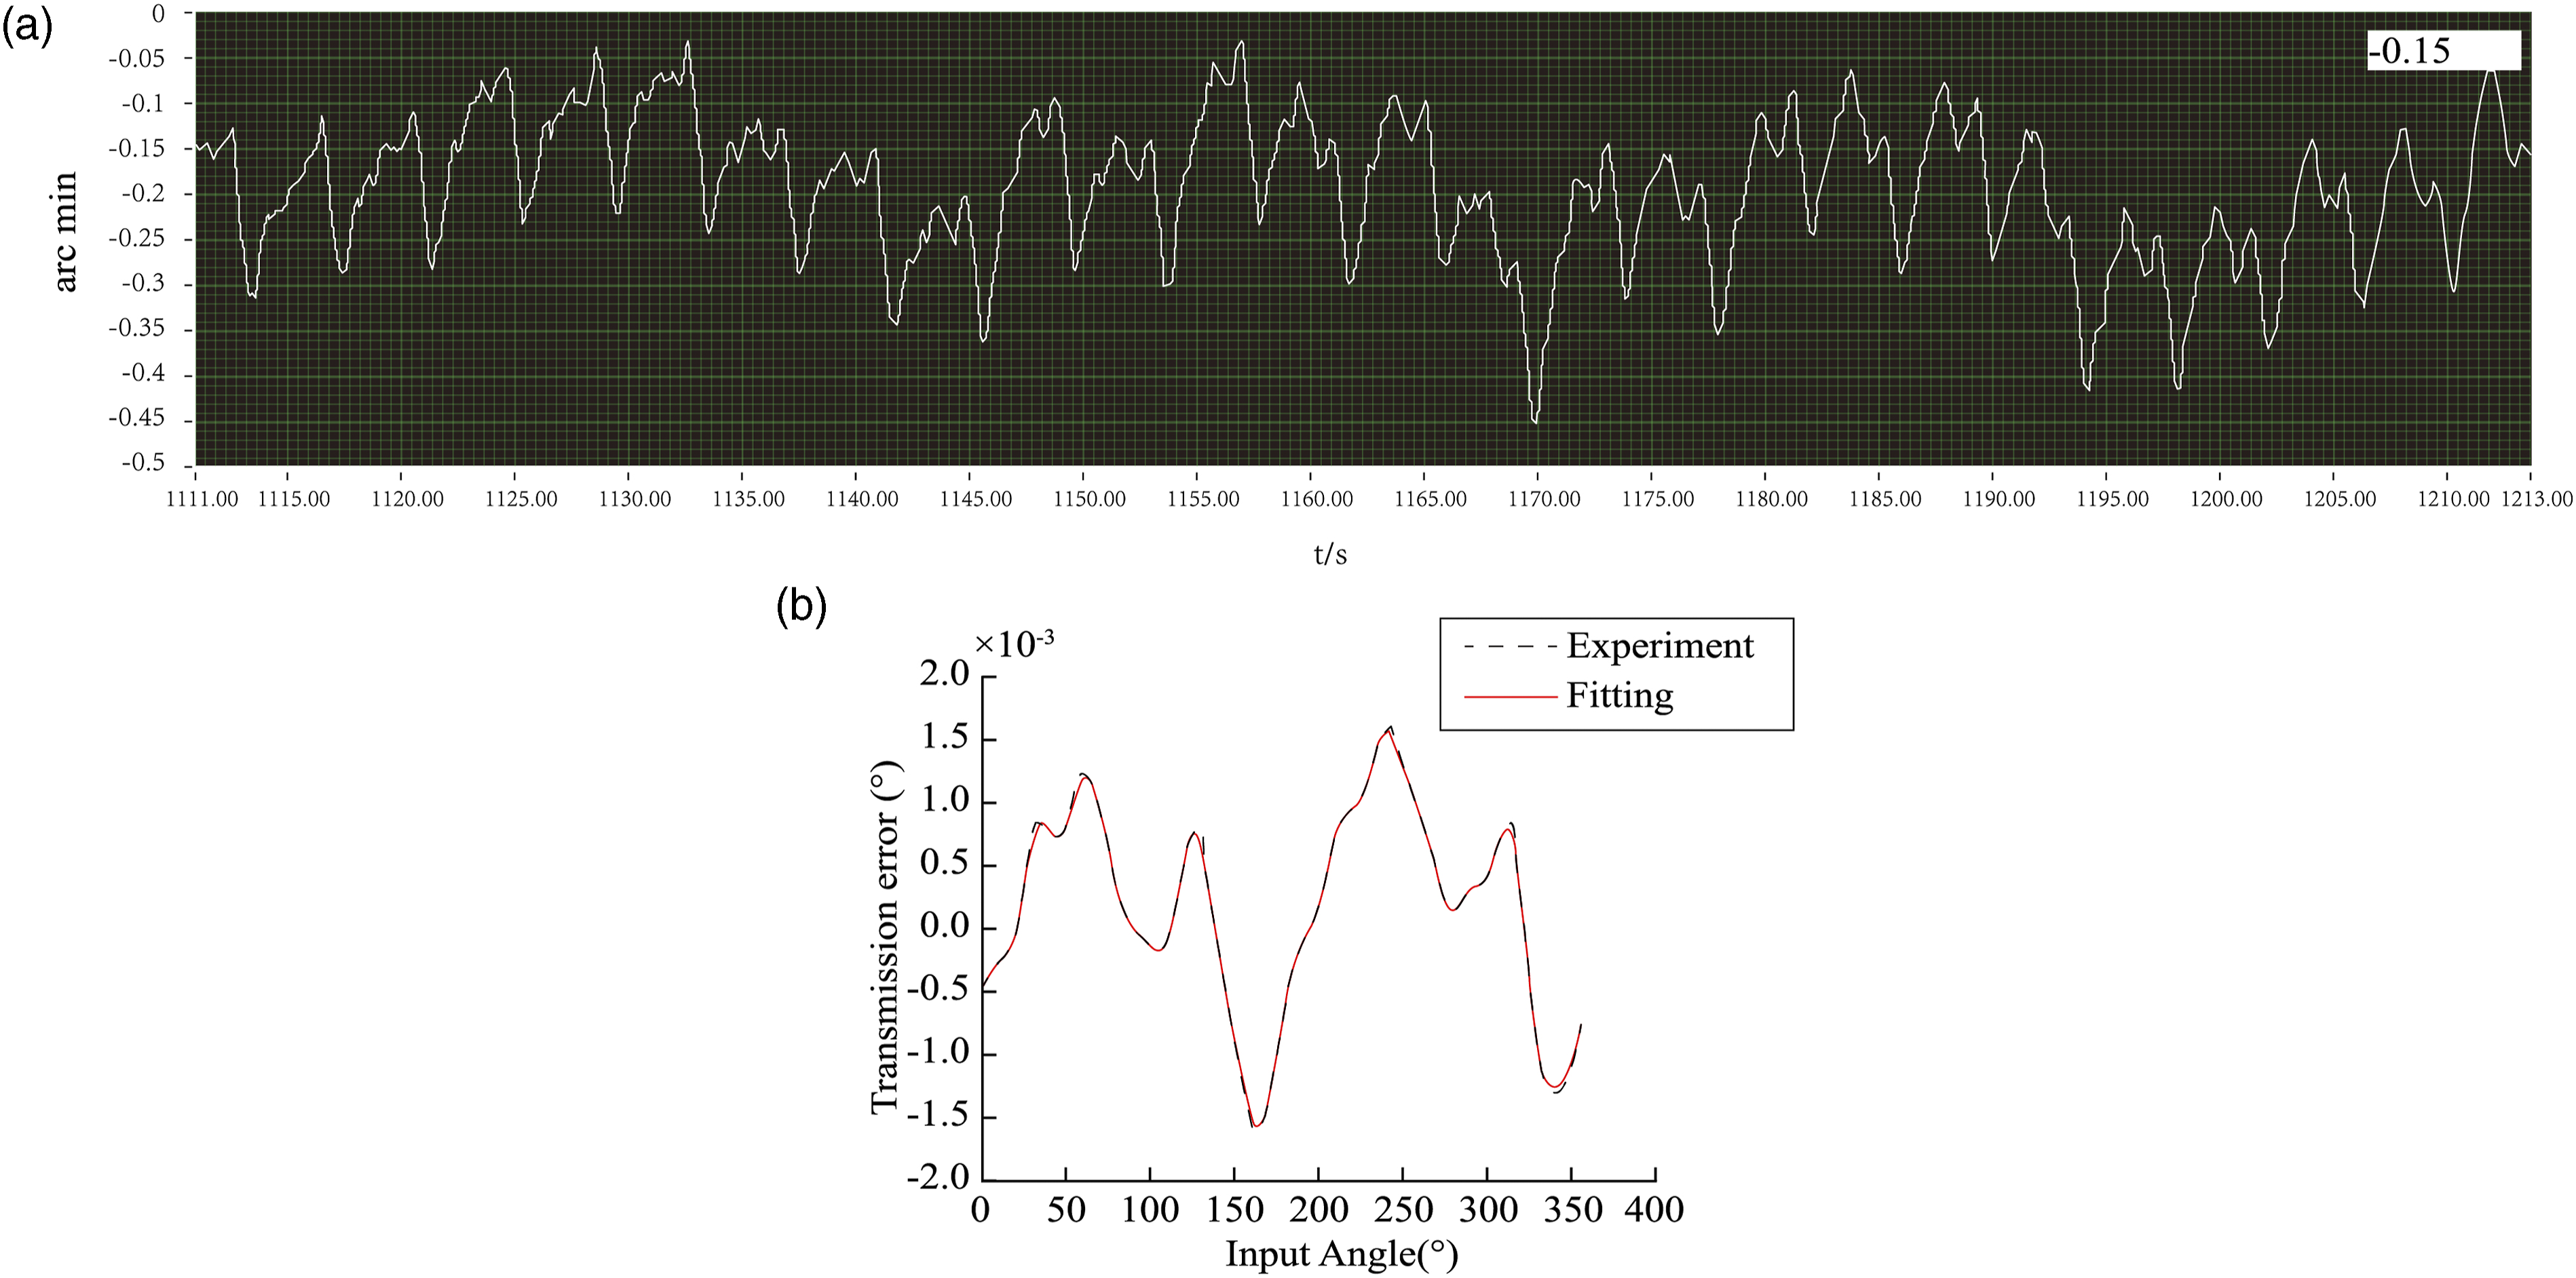
Fourier series expansion coefficient.
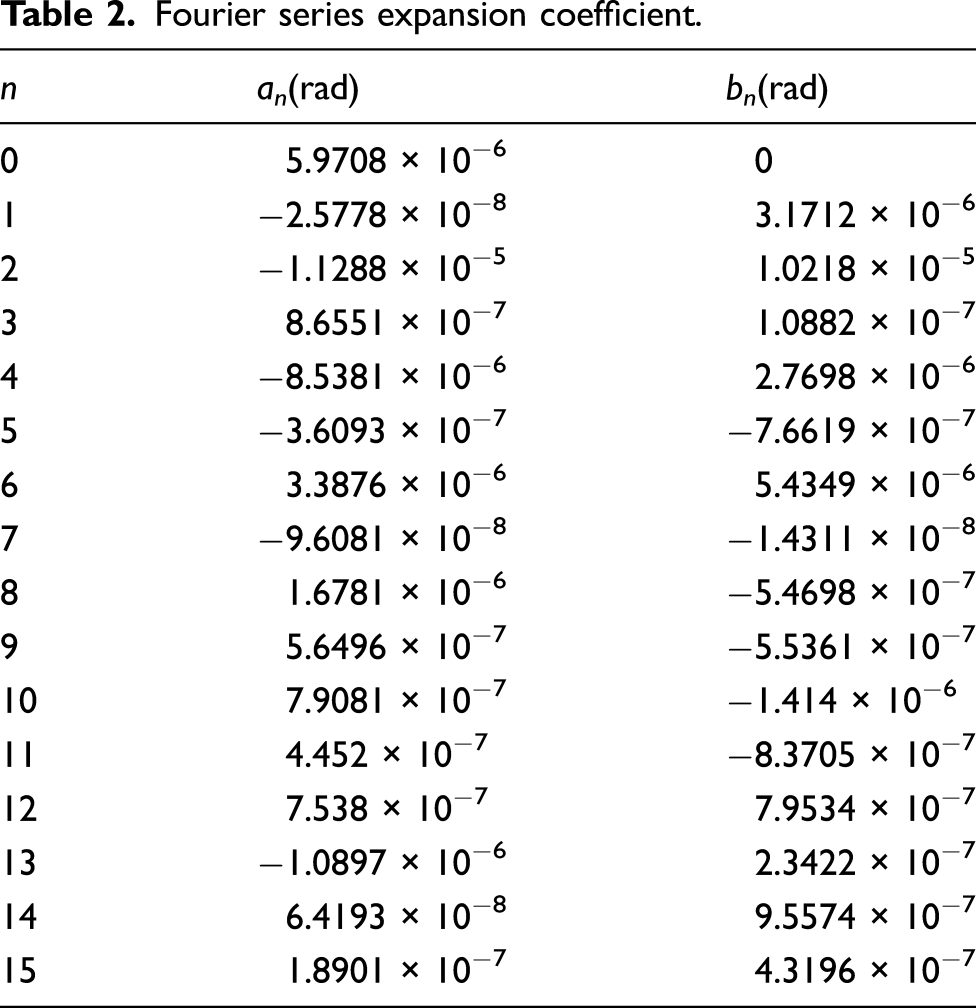
Figure 5 shows the root mean square difference of the Fourier series expansion of different orders. It can be observed that before the 15th order, the root mean square difference decreases rapidly with the increase of the order. Within the entire 20th order, the root mean square error reached a stable value at the 15th order (i.e., 7.7665 × 10⁻⁵), which basically achieves the required precision, so the 15th order can be used to fit the data reasonably and accurately. Root mean square error between experiment and fit curve.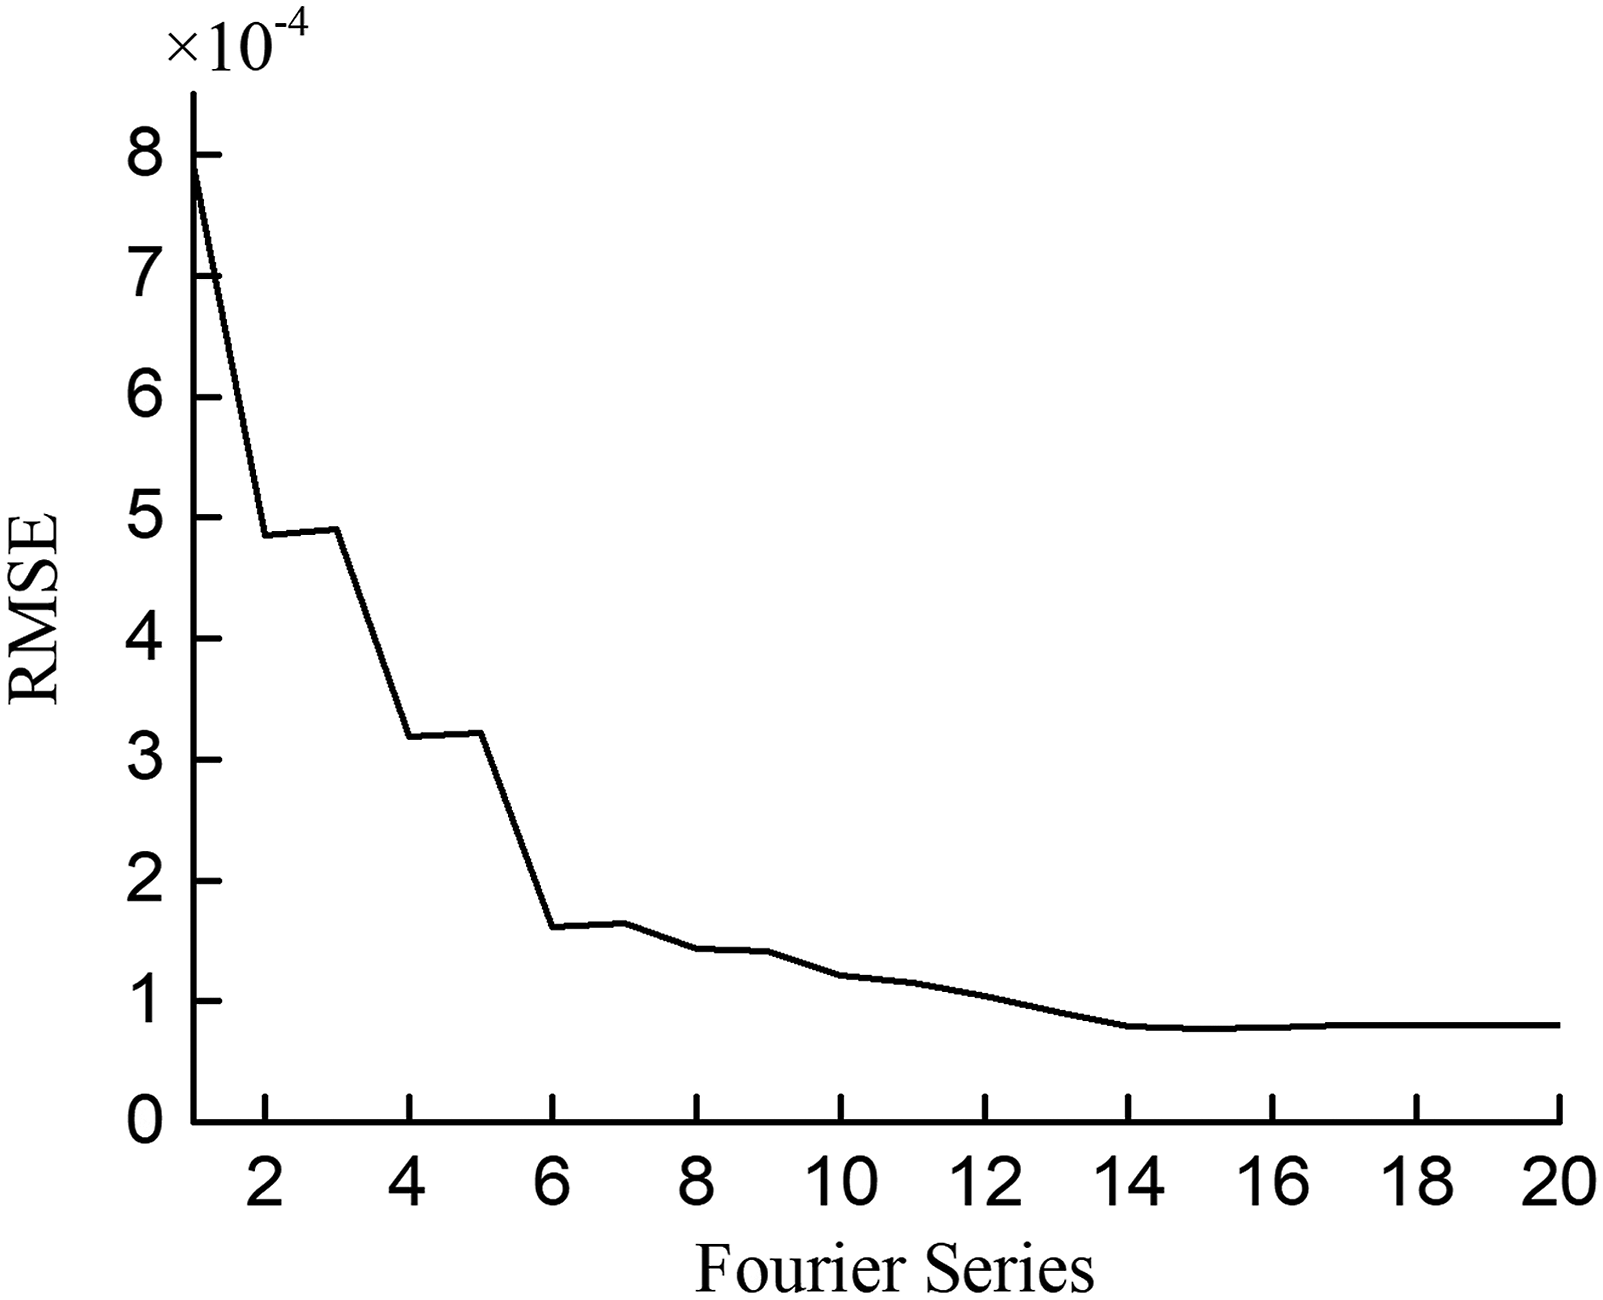
3.4. Comparison of model and experimental results
Relevant parameters obtained above were substituted into equations (7) and (8), and MATLAB functions were written to solve them. The correctness of the dynamics model was verified by comparing with the experimental results. For the same reducer, the transmission error is different at different speeds, so it is feasible and reliable to take the transmission error as the verification index, and the transmission error is also one of the main forms of vibration.
Since most of the harmonic gear reducers operate in aerospace at a very low speed, they were first verified at 15 r/min. The experimental results of the transmission error have been obtained as described above, taking a signal for analysis. As can be seen from Figures 6(a) and (b), there is a high-frequency component in the simulation transmission error, but not the experimental transmission error. Although the acquisition frequency under the experimental conditions did not reach the transmissive high-frequency component, the overall simulation curve was very close to the shape of the experimental curve. Figures 6(c) and (d) show the phase–plane diagrams of angular displacement and derivative of angular displacement during 10 s of start-up. It can be seen that the drawing of phase–plane diagram diverges with no limit of spiral cycles. This shows that the input angular displacement signal and output angular displacement signal are non-periodic. Single cycle transmission error curve for 15 r/min: (a) test curve, (b) simulation curve, (c) phase–plane at pm (input angle), and (d) phase–plane at 15 pm (output angle).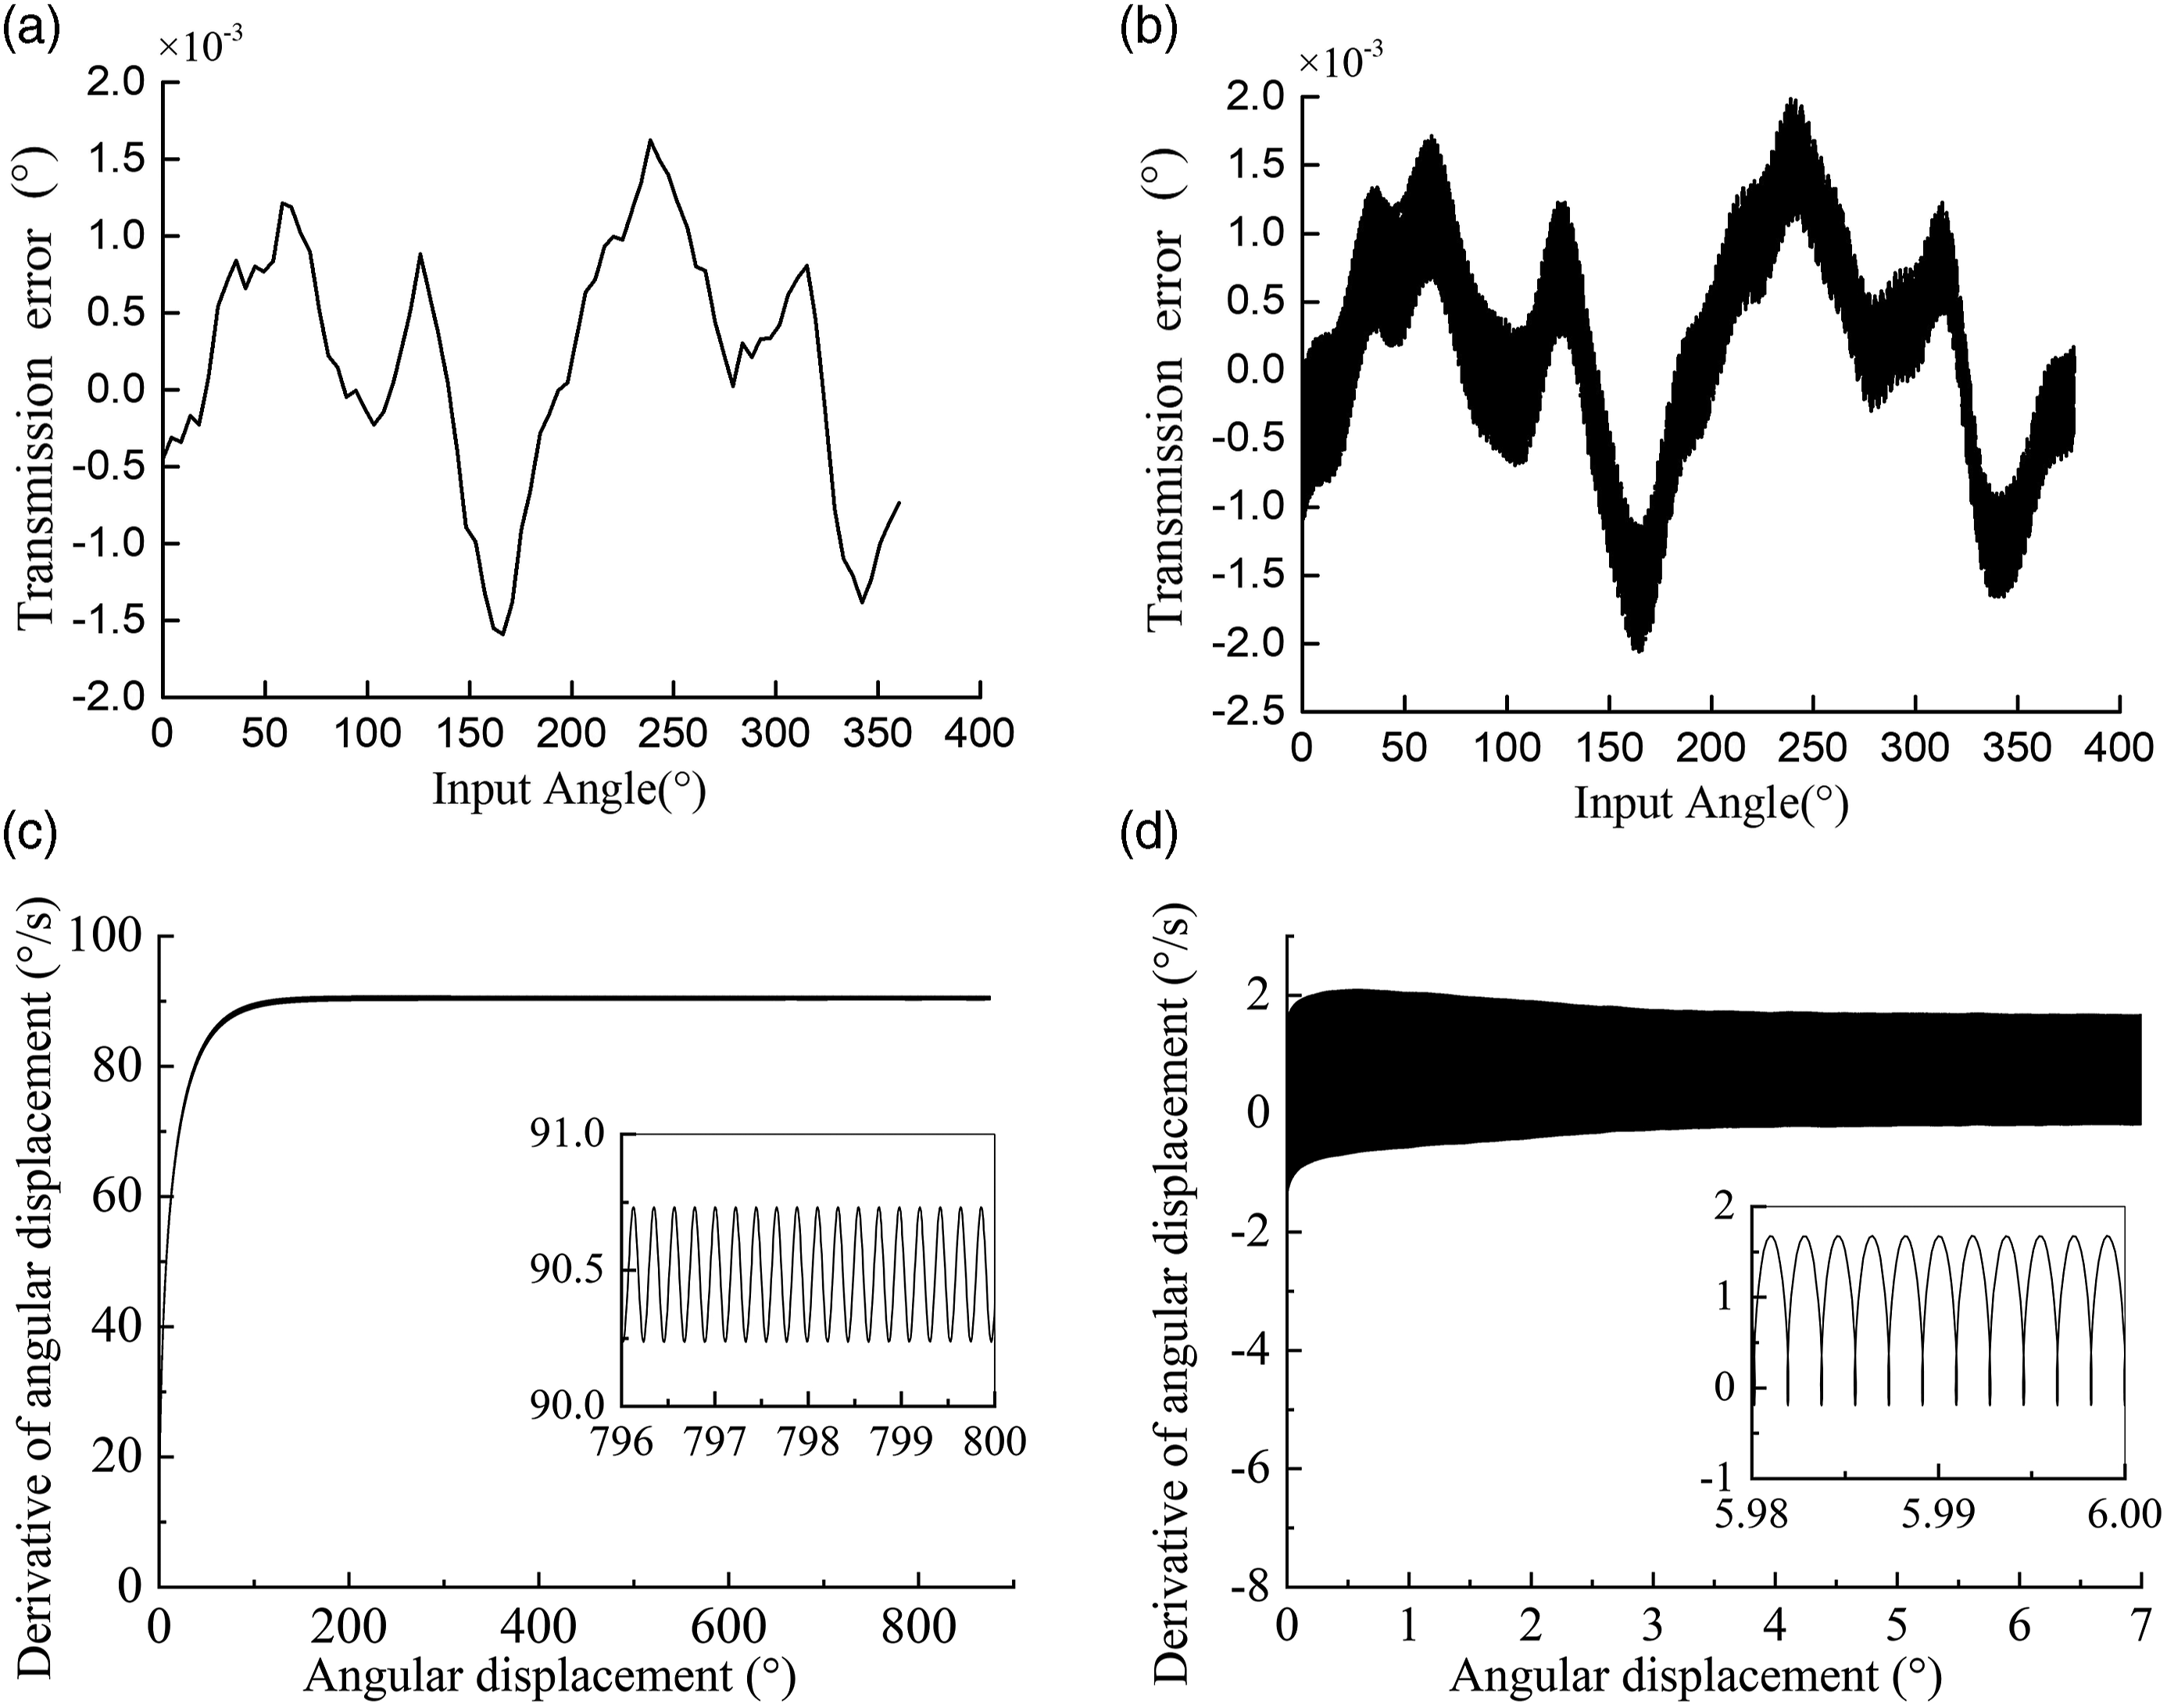
Then, the speed is increased and a condition at a speed of 50 r/min was analyzed. The test results of transmission error and simulation results are shown in Figures 7(a) and (b), respectively. Also, a signal of time was taken for analysis, and the average accuracy and peak value of the drive accuracy at 50 r/min were higher than that of 15 r/min. The overall response was more “chaotic” due to the higher speed. In addition, the meshing speed between the teeth increased, and the flexibility and friction of the system played an extremely important role in transmission errors. So compared with low speed, the dynamic nonlinearity is more obvious. It can be seen that the drawing of phase–plane diagram diverges with no limit of spiral cycles and the transmission error signal is also non-periodic. It’s just that the derivative of angular displacement in Figures 7(c) and (d) also increase compared with that at 15 r/min. Single cycle transmission error curve for 50 r/min: (a) test curve, (b) simulation curve, (c) phase–plane at 50 pm (input angle), and (d) phase–plane at 50 pm (output angle).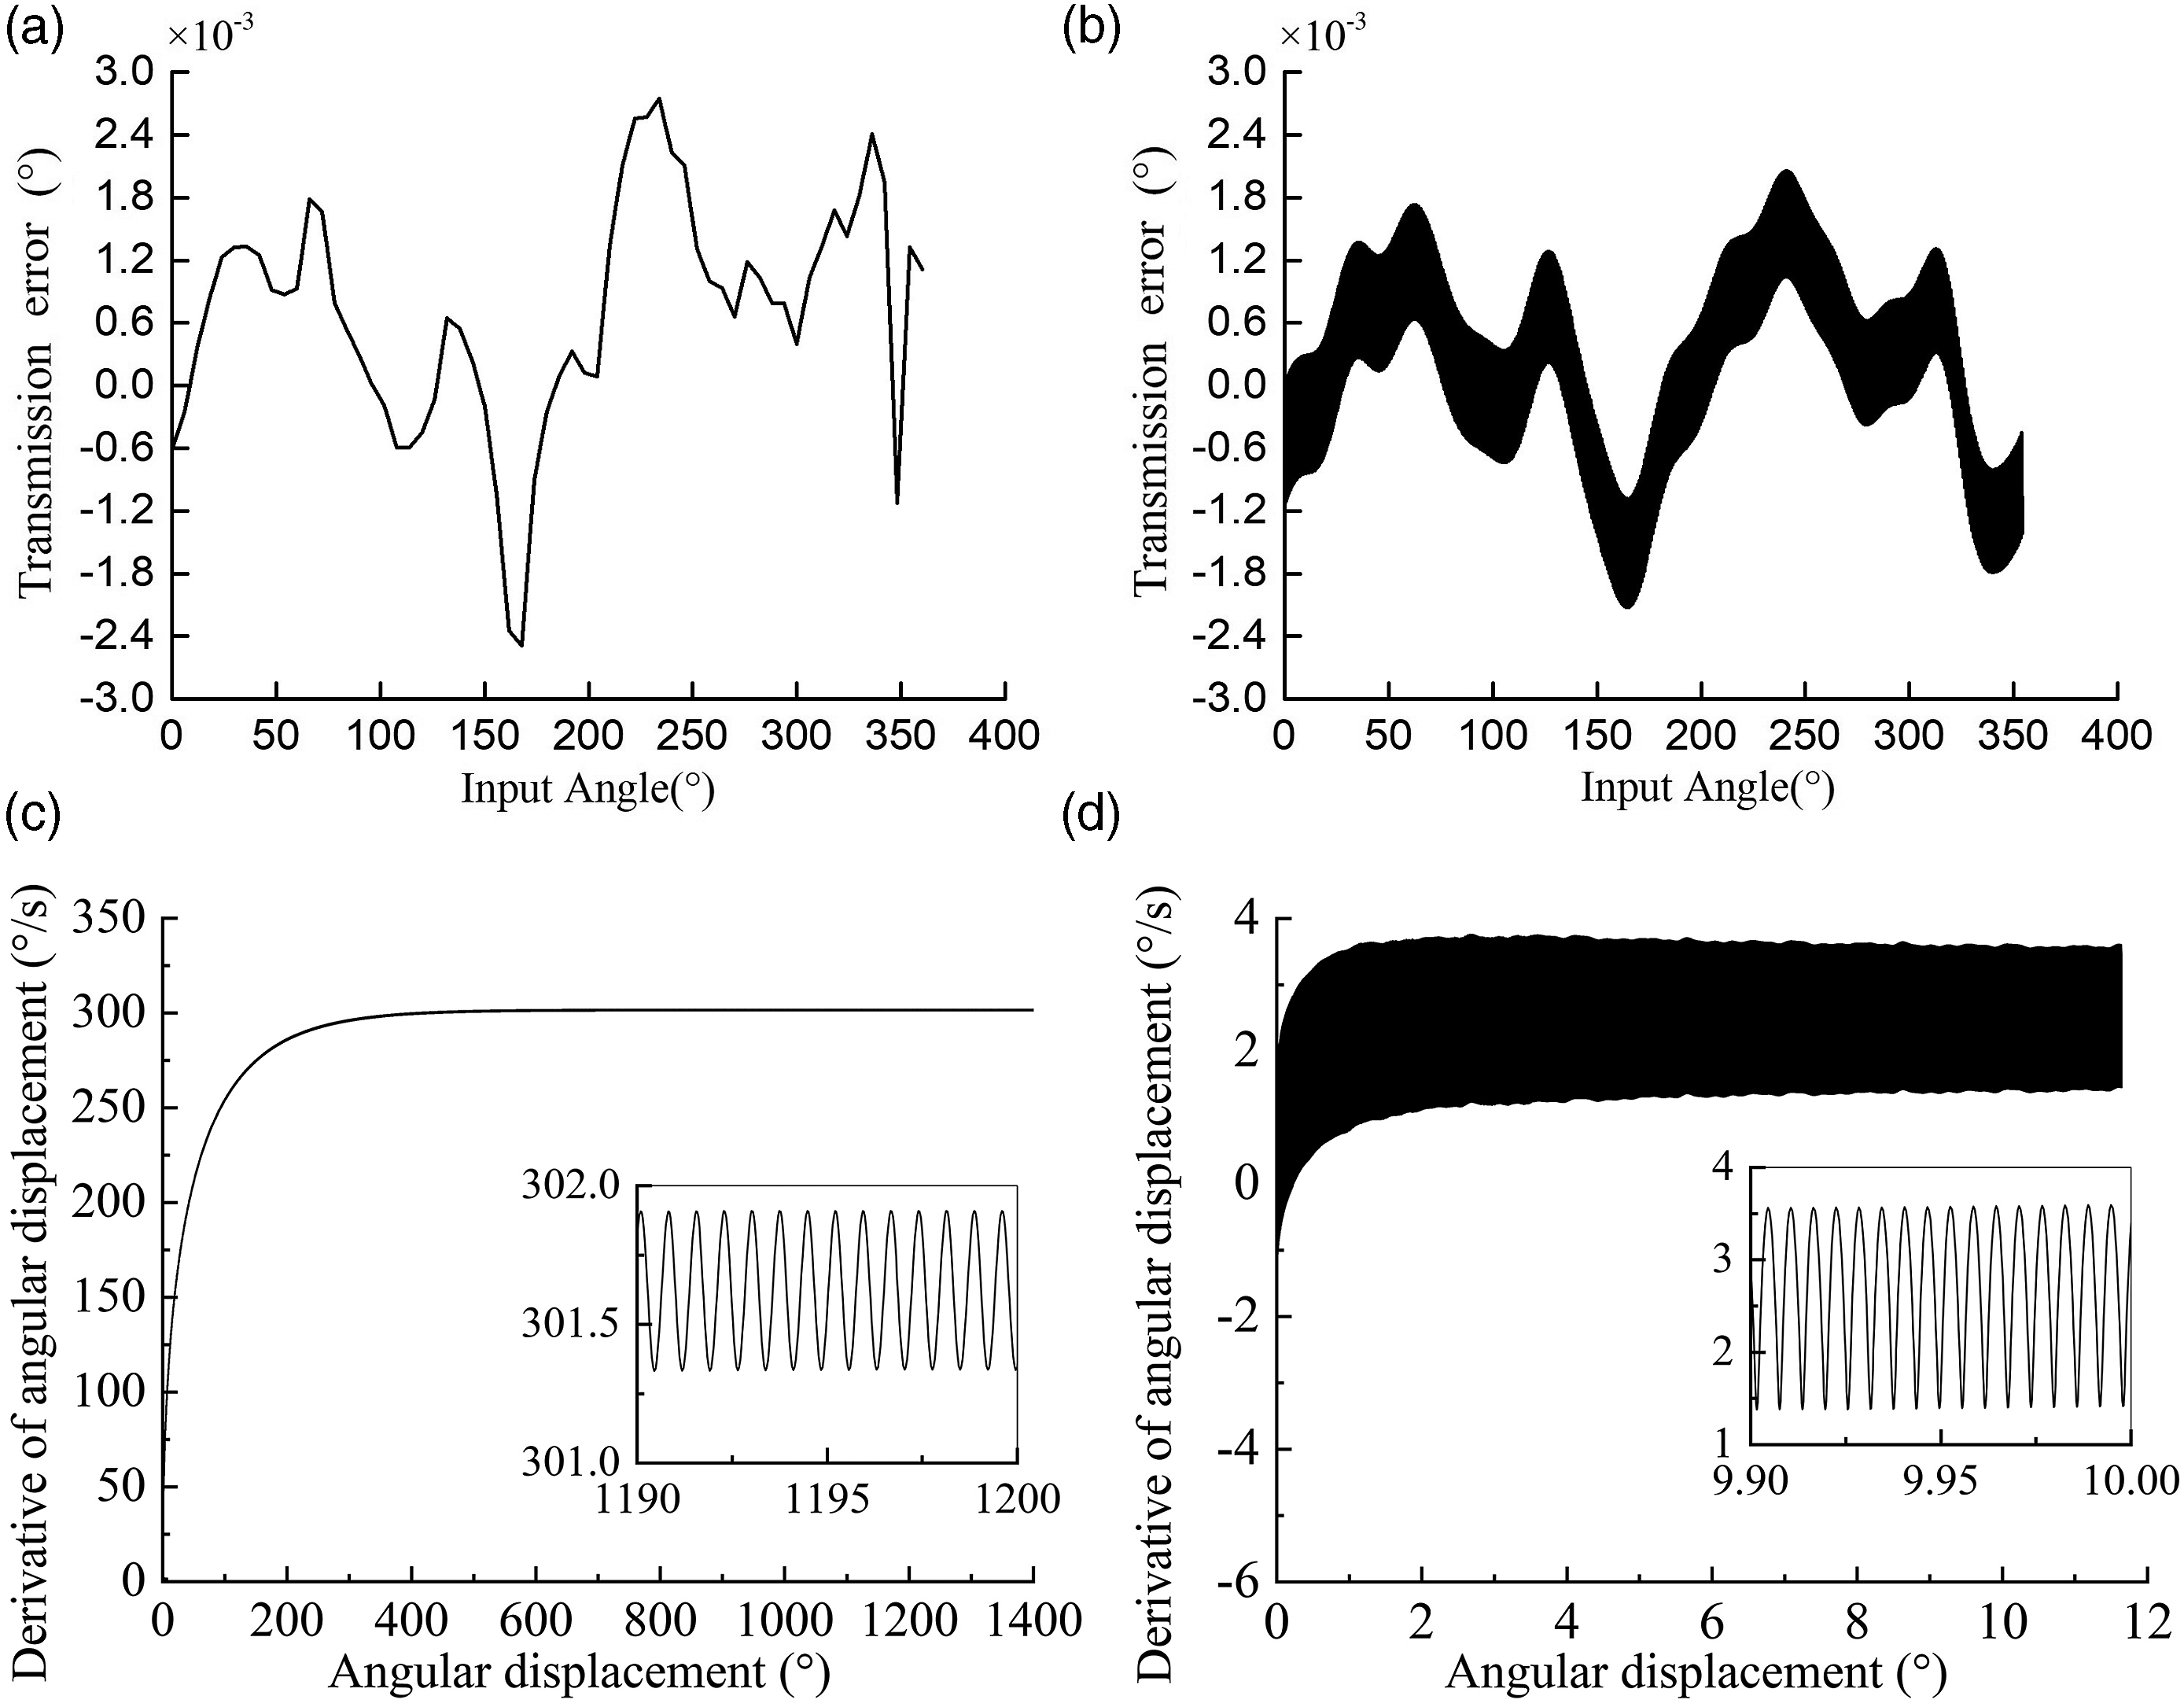
The verification was carried out at a speed of 100 r/min. The experimental curves and simulation curves of the transmission error are as shown in Figures 8(a) and (b), respectively. It can be observed that the test curve of the transmission precision at 100 r/min was more vigorous, the disorder enhanced, and the vibration intensified obviously. The transmission error at 100 r/min began at a higher peak than that of the former, which may be related to the non-linearities associated to the angular displacement and the inter-tooth friction during the meshing process, and also related to the rotation of the input end itself. The vibration at higher speeds induced by inertia affects the overall transmission error of the system, which was consistent with the previous conclusions. Similarly, as shown in Figures 8(c) and (d), the angular displacement signal is also non-periodic at 100 r/min. Single cycle transmission error curve for 100 r/min: (a) test curve, (b) simulation curve, (c) phase–plane at 100 pm (input angle), and (d) phase–plane at 100 pm (output angle).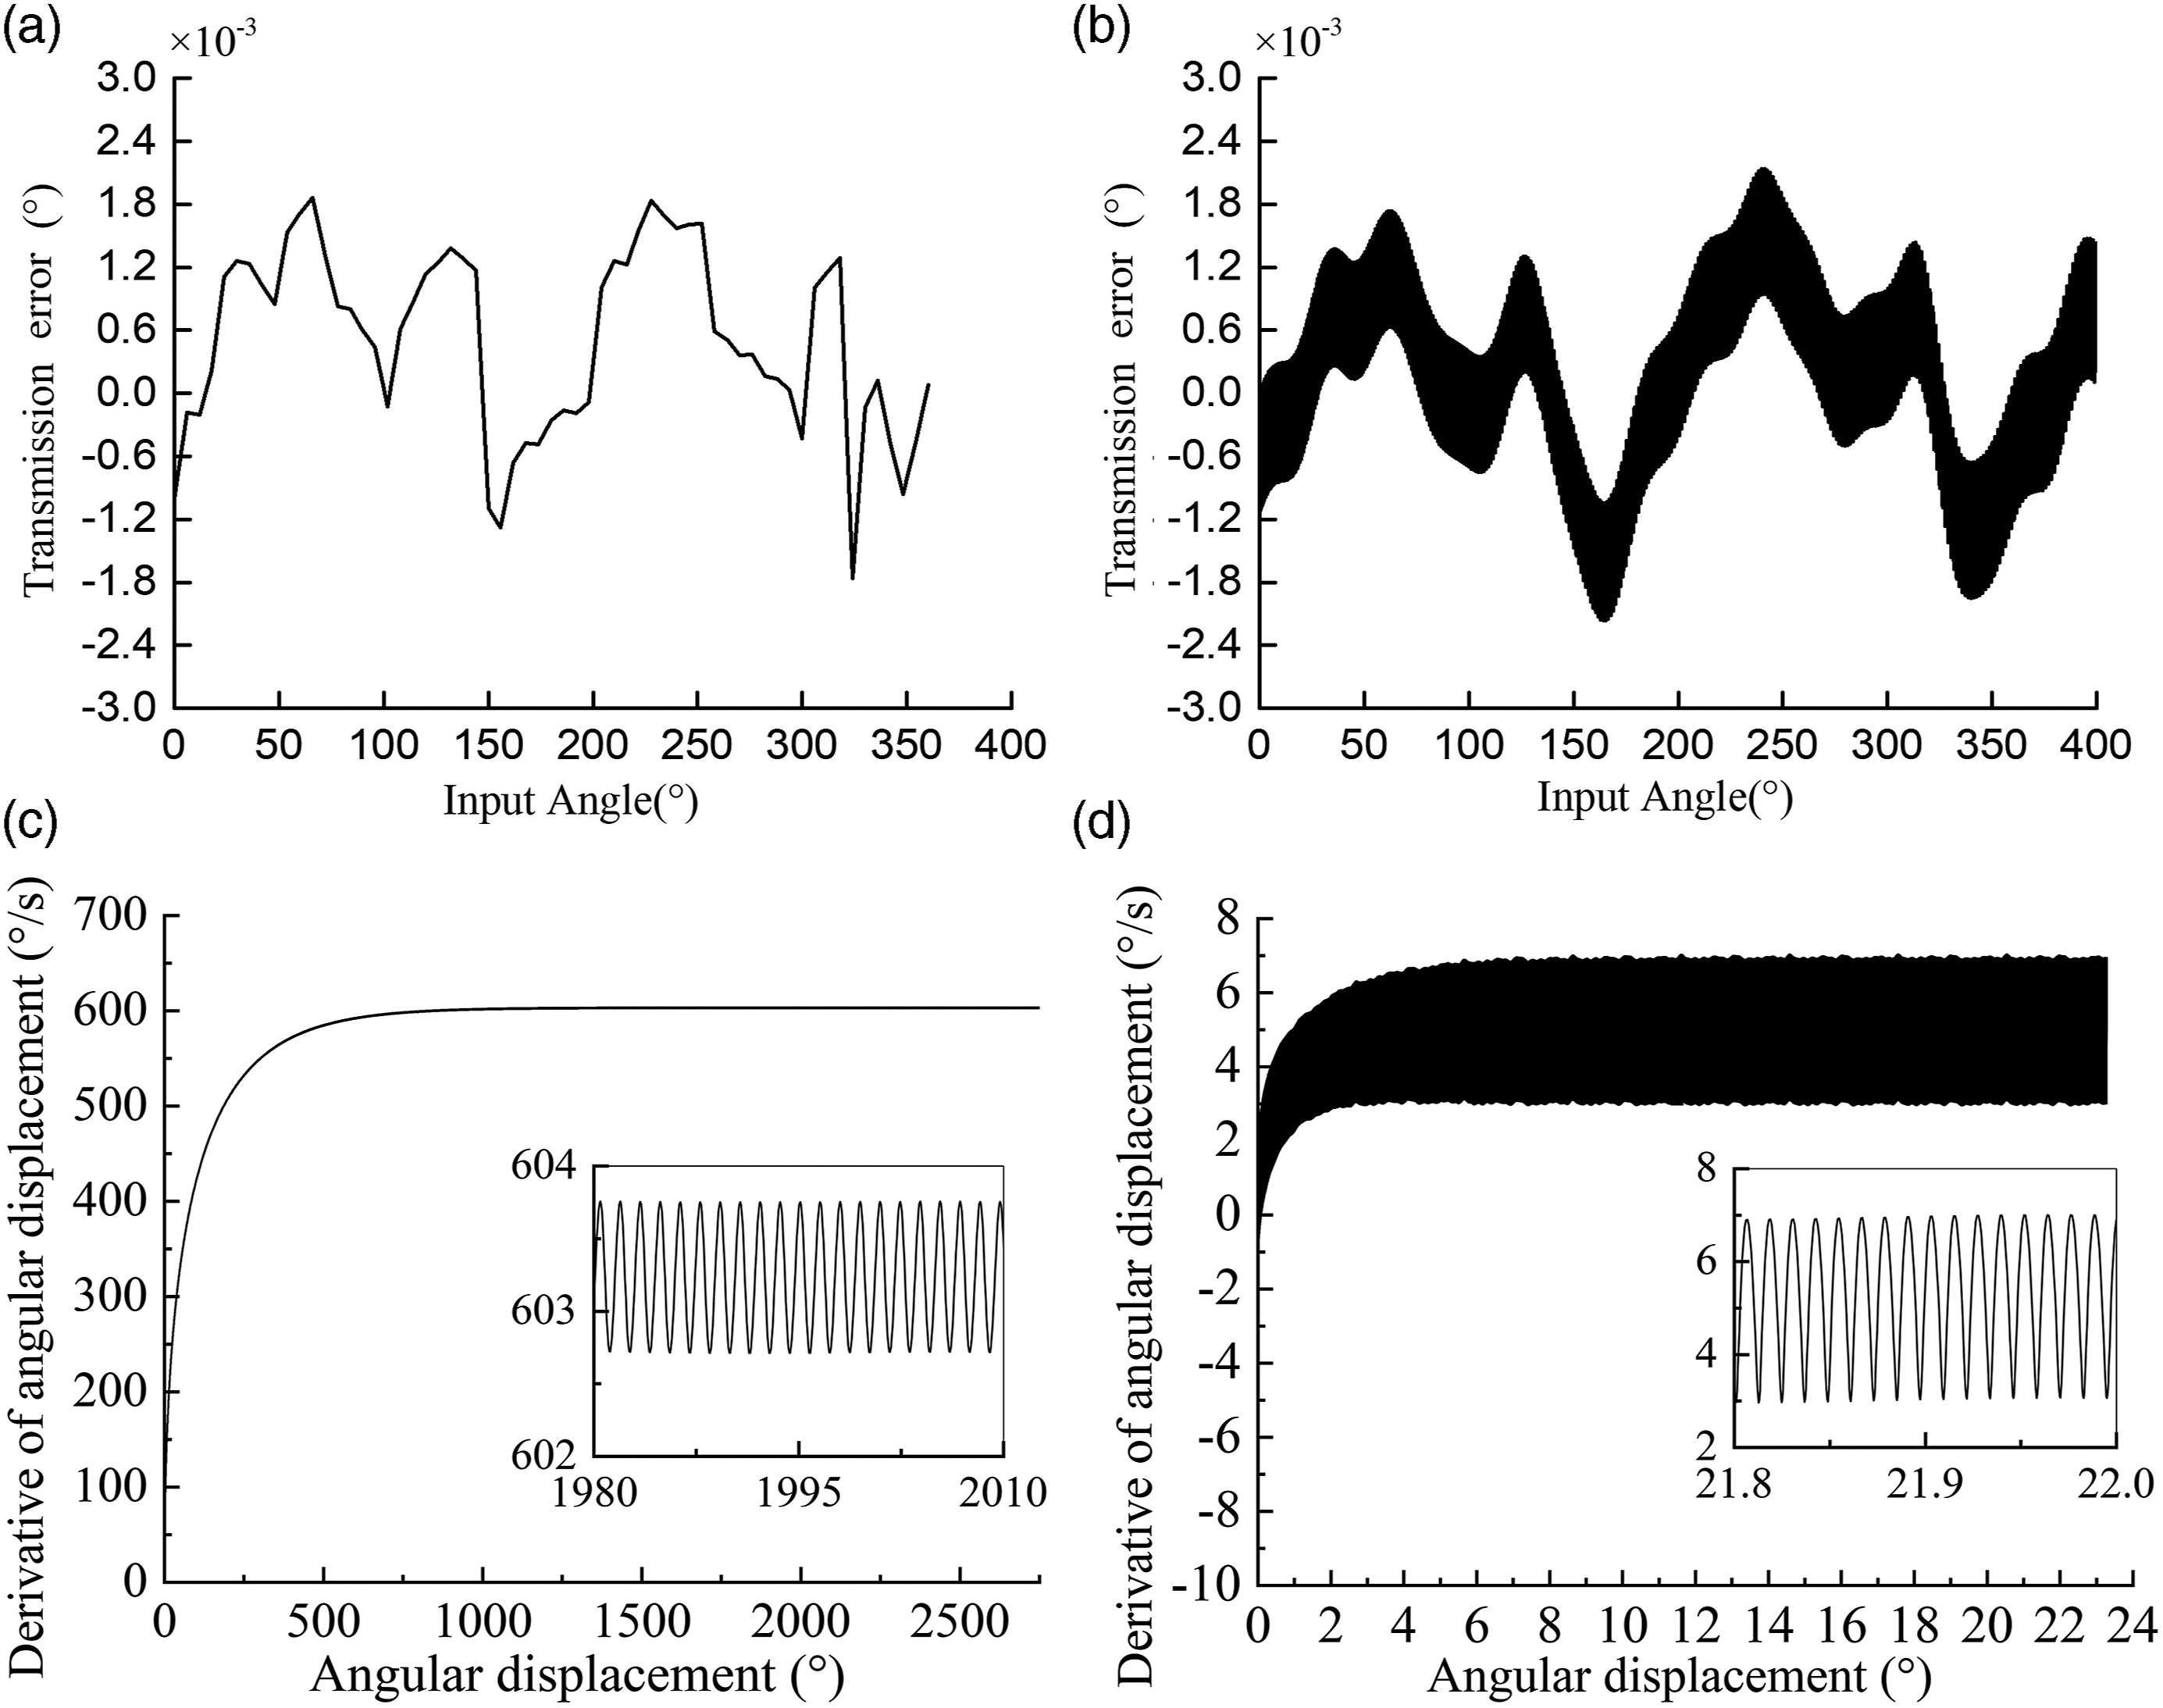
In order to visually observe the dynamic characteristics of the input, the angular velocity of the input and output at 100 r/min was extracted for comparative analysis, as shown in Figure 9. During the start-up of the harmonic gear reducer, the input and output speeds rose rapidly, reaching and then keeping a small fluctuation at 100 r/min and 0.8 r/min. Comparing the simulation curve with the experimental curve, it can be seen that the simulation results in the first 0.7 s increased faster than the experimental results, and the transition was smoother. Due to the friction from the entire transmission system, including the motor, reducer, coupling, etc., as well as manufacturing installation errors, when the motor starts, it is necessary to overcome this part of the torque first, and finally dissipate it. The specific value of the starting torque can be measured by gradually increasing the torque at the input end. The kinetic model did not fully consider all factors, so the solution is reliable within the tolerance of error. Input and output end start–stop angular velocity: (a) input start–stop angular velocity and (b) output start–stop angular velocity (experiment on the left and simulation on the right).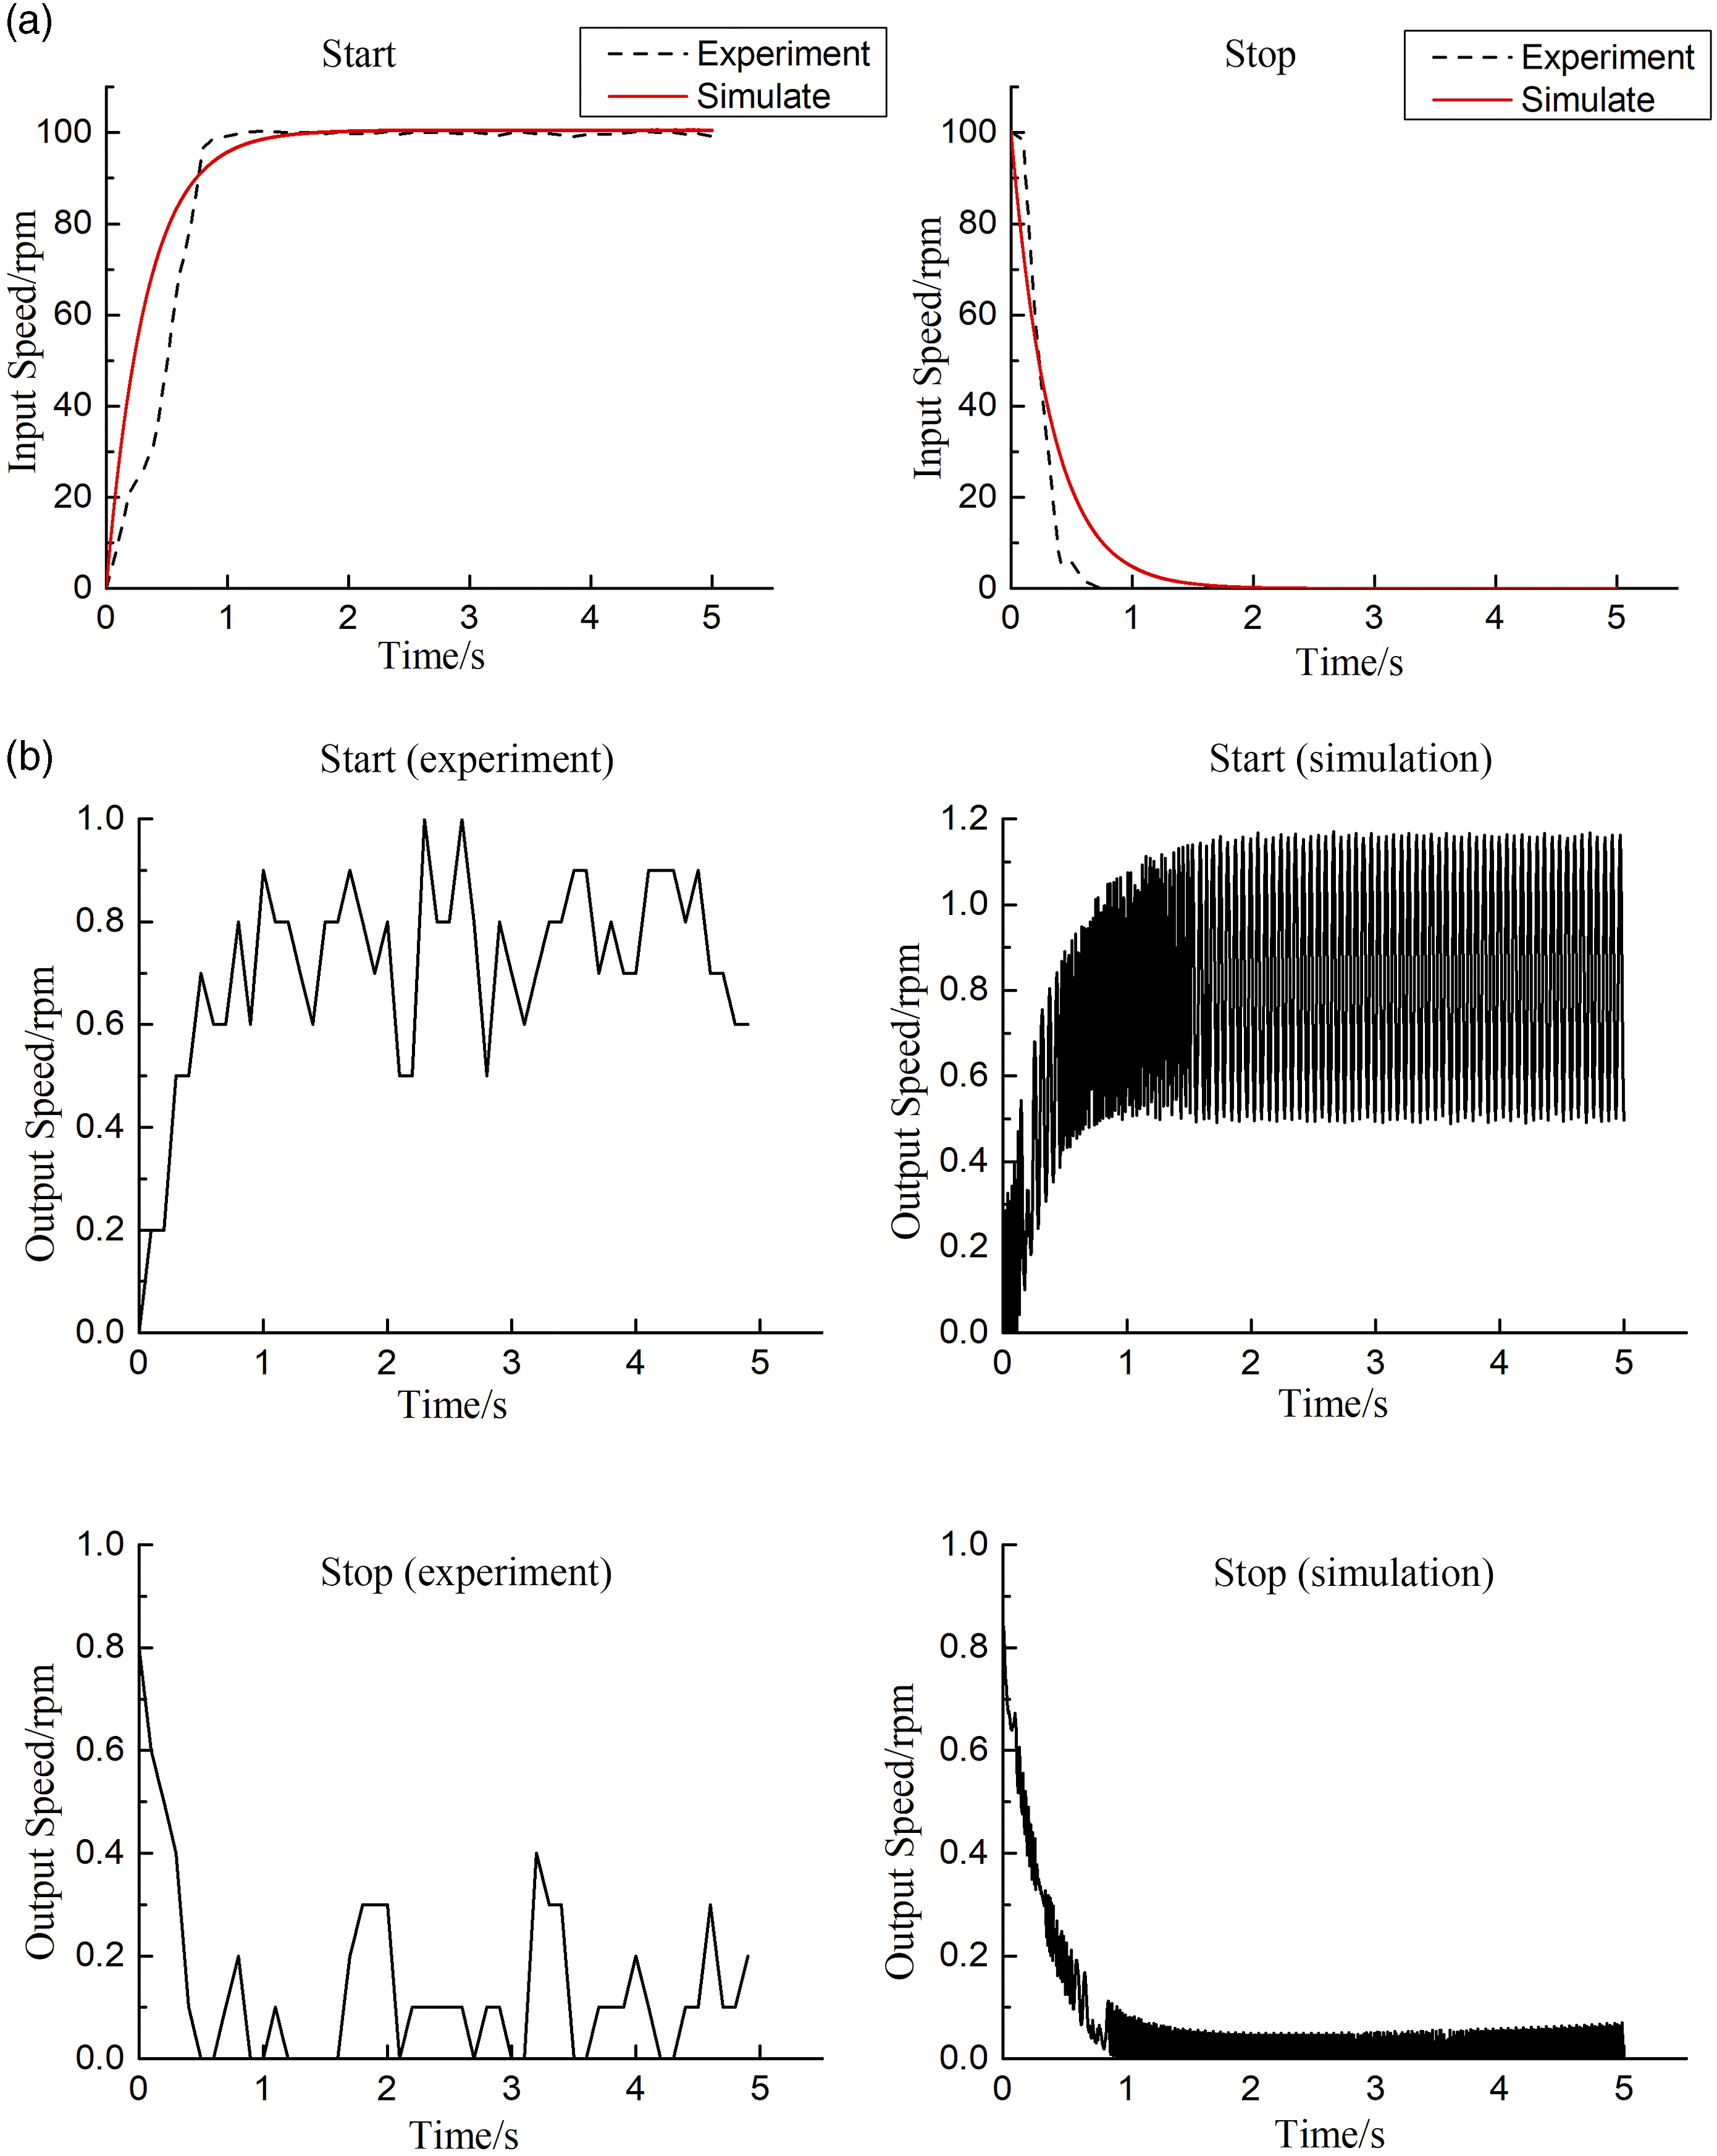
During the stop process, the speed of the experimental curve to zero was faster than the speed of the simulated curve because in the absence of input torque, the energy consumption under the experimental conditions is faster and the stop is faster. However, the overall simulation results, whether it is started or stopped, can simulate the speed of input and output well.
Since the harmonic gear reducer is a precision reducer, considering the uncertainty of the relevant parameters, the experimental value of the transmission error in the table is extremely small, and the relative error is also within the acceptable range, so it is reliable to establish nonlinear dynamic model. The dynamic characteristics of the harmonic gear reducer under the influence of nonlinear factors were simulated well, and the correctness of the nonlinear dynamic model was verified.
4. Results and discussion
The harmonic drive system is a nonlinear system affected by many factors. In order to understand the characteristics of system dynamic response, the study of vibration characteristics during start and stop under different factors was carried out by changing one of them. Parameters are used to quantitatively analyze its effect on the vibration characteristics of the system.
4.1. Influence of speed
The input speeds of the system were set to 90 r/min, 150 r/min, 300 r/min, 450 r/min, and 600 r/min. The vibration characteristics of the output during the start and stop process were studied, the differential equation was solved, and the time-domain signal of the speed response was obtained. The Fourier transform transformed it into the frequency domain. It characterized the effective value of the harmonic frequency and time-domain signal. It was the distribution of the vibration amplitude of the time-domain signal with frequency, which can conveniently analyze the amplitude and frequency. Figure 10(a) shows the time–frequency diagram of 300 r/min during the start–stop process. Figure 10(b) shows the changes of frequency and amplitude for all speeds. System response at different speeds: (a) the time–frequency diagram for 300 r/min, and (b) amplitudes and frequencies at different speeds.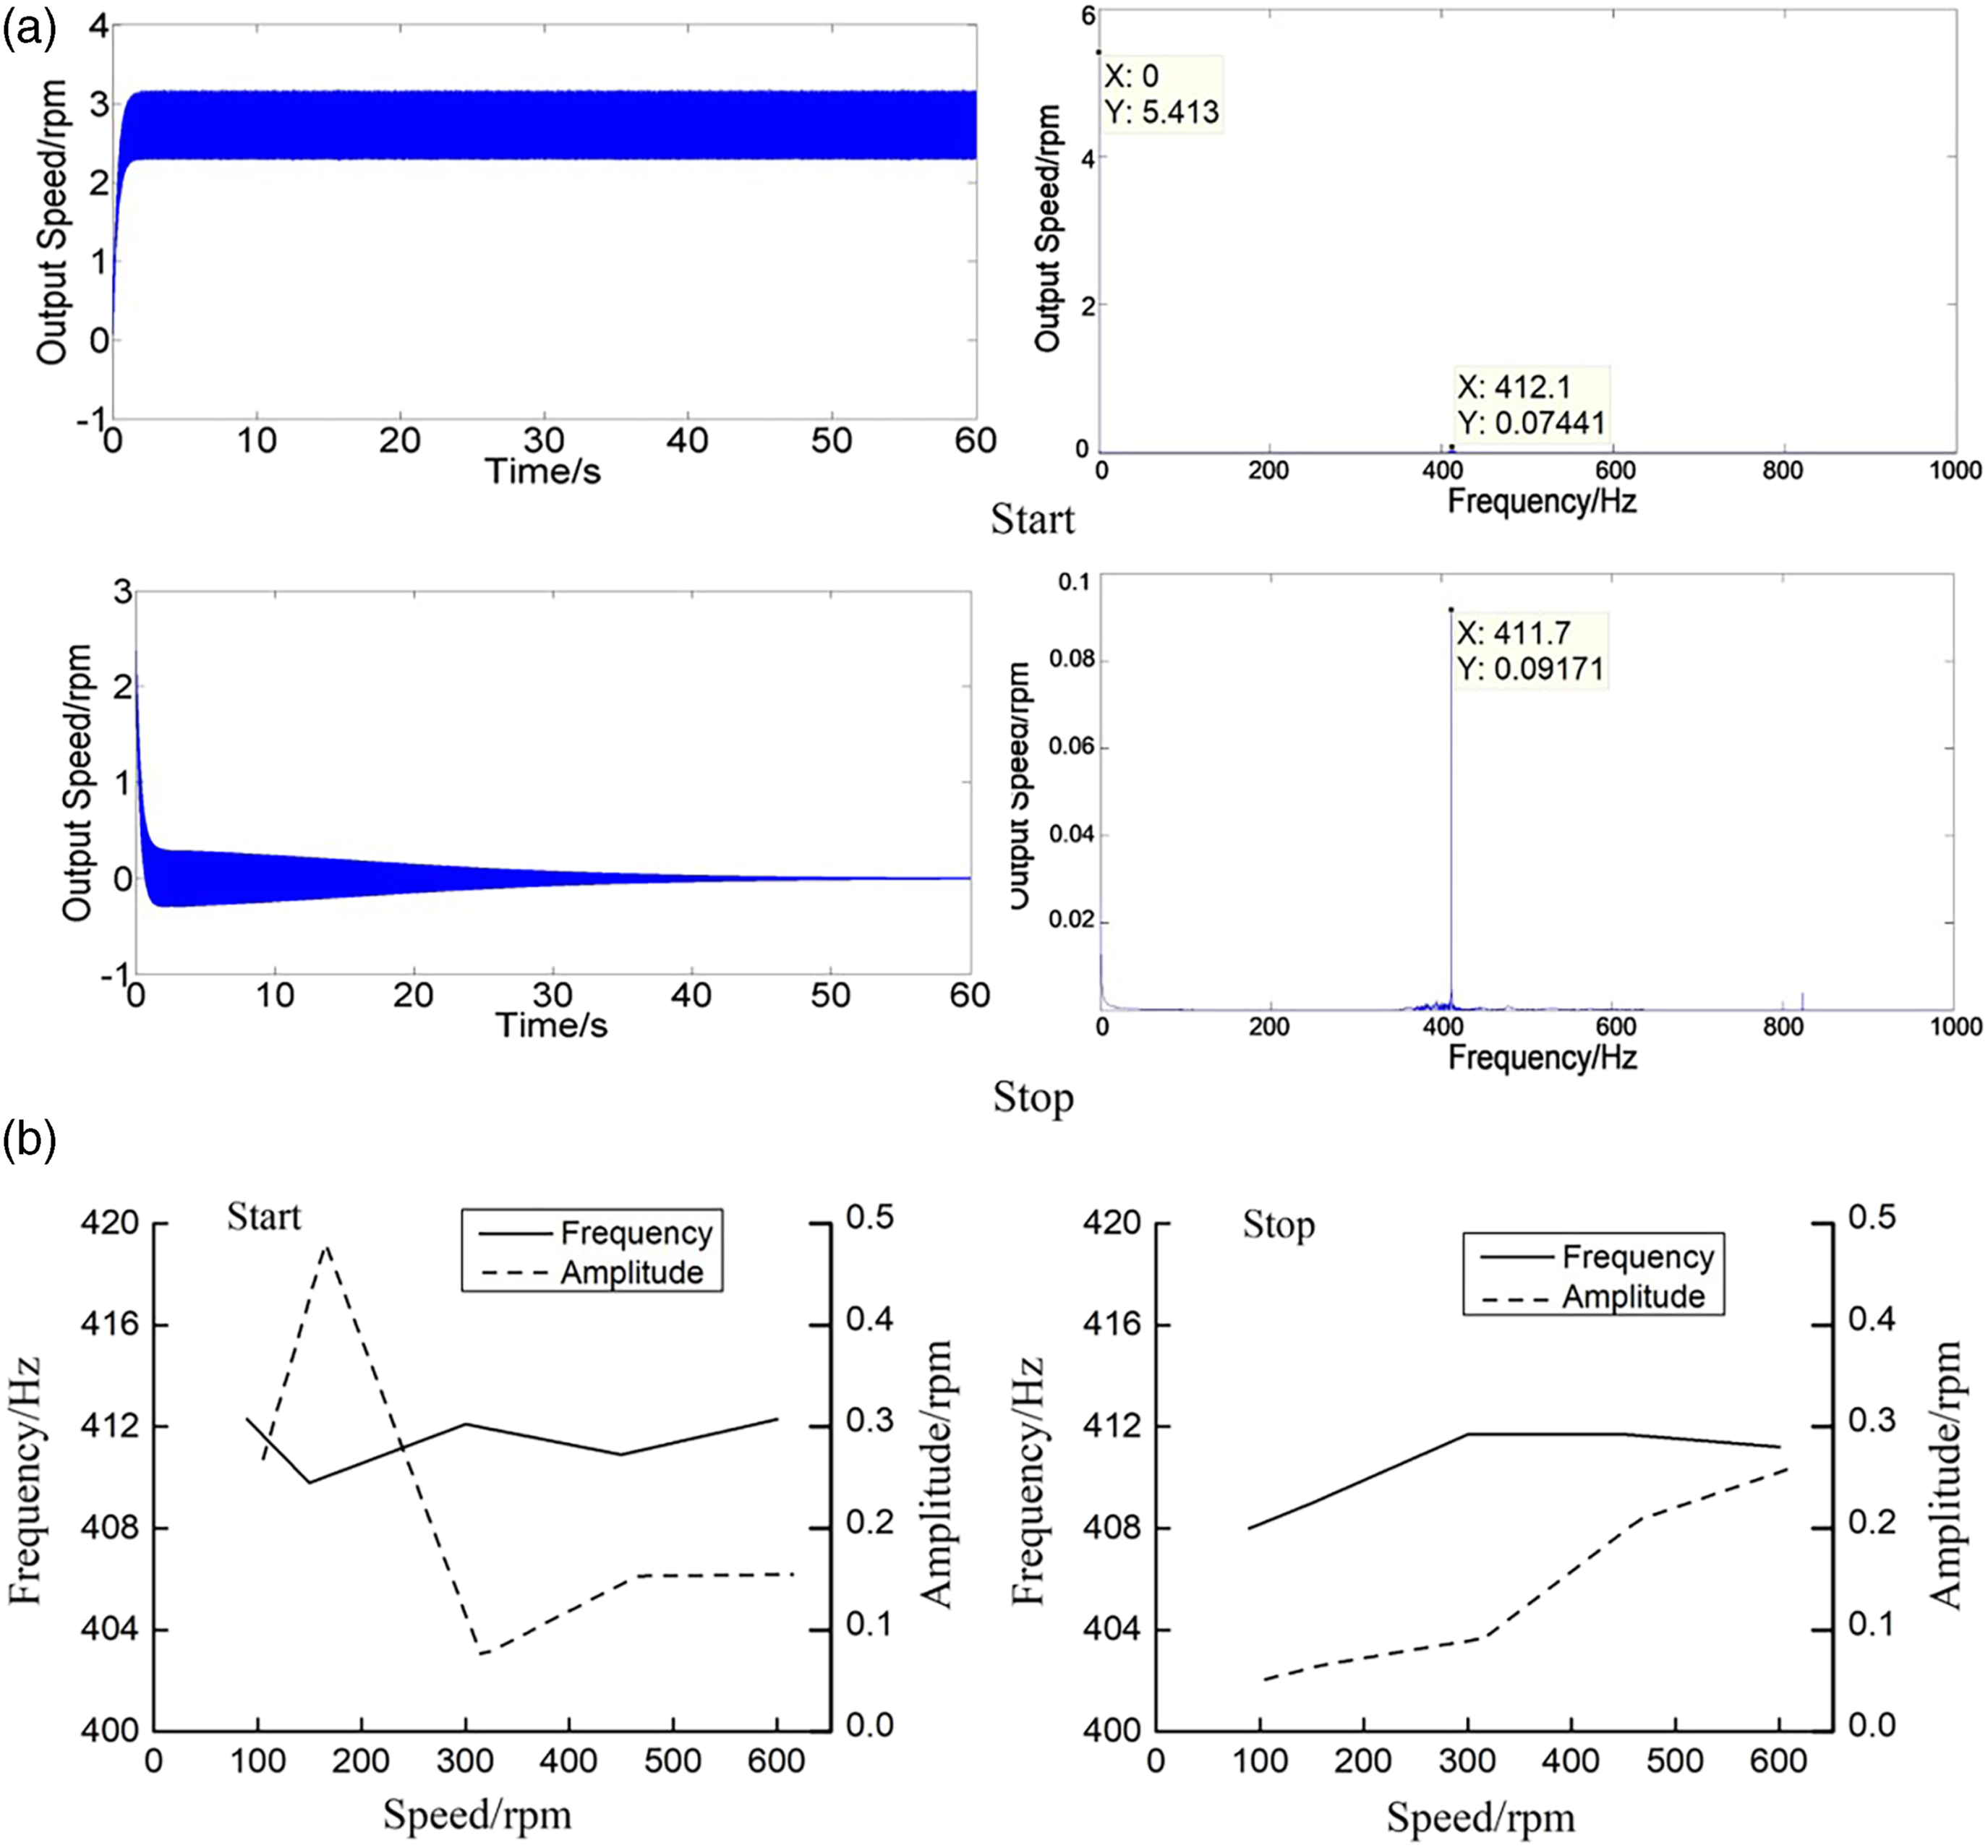
It can be seen intuitively from the figure that whether it is starting or stopping, or during the running process, the output speed had a certain range of fluctuations, which is torsional vibration in the actual work. At start-up, the output speed rapidly increased to the set speed within 1 s, and then kept fluctuating up and down at the set speed. The higher the speed, the more obvious the vibration phenomenon; when stopped, it also dropped rapidly to close to 0 within 1 s, but there was still a small range of fluctuations for a long time, and finally slowly decayed until it stopped completely. As the rotational speed increased, the vibration frequency was substantially constant, and the amplitude and vibration increased. But there is a suitable speed to reduce the vibration.
4.2 Influence of moment of inertia
The moment of inertia of the system includes two inertias, that is, the load moment of inertia J
l
and the driving moment of inertia J
m
. In the same way, the load moment of inertia was first set to 0.5 J
l
, 0.75 J
l
, 1 J
l
, 1.25 J
l
, 2 J
l
, and 5 J
l
. Figure 11(a) shows the frequency and amplitude under the different load moments of inertia. System response at different moment of inertia: (a) amplitudes and frequencies at different load moment of inertia and (b) amplitudes and frequencies at different motor moment of inertia.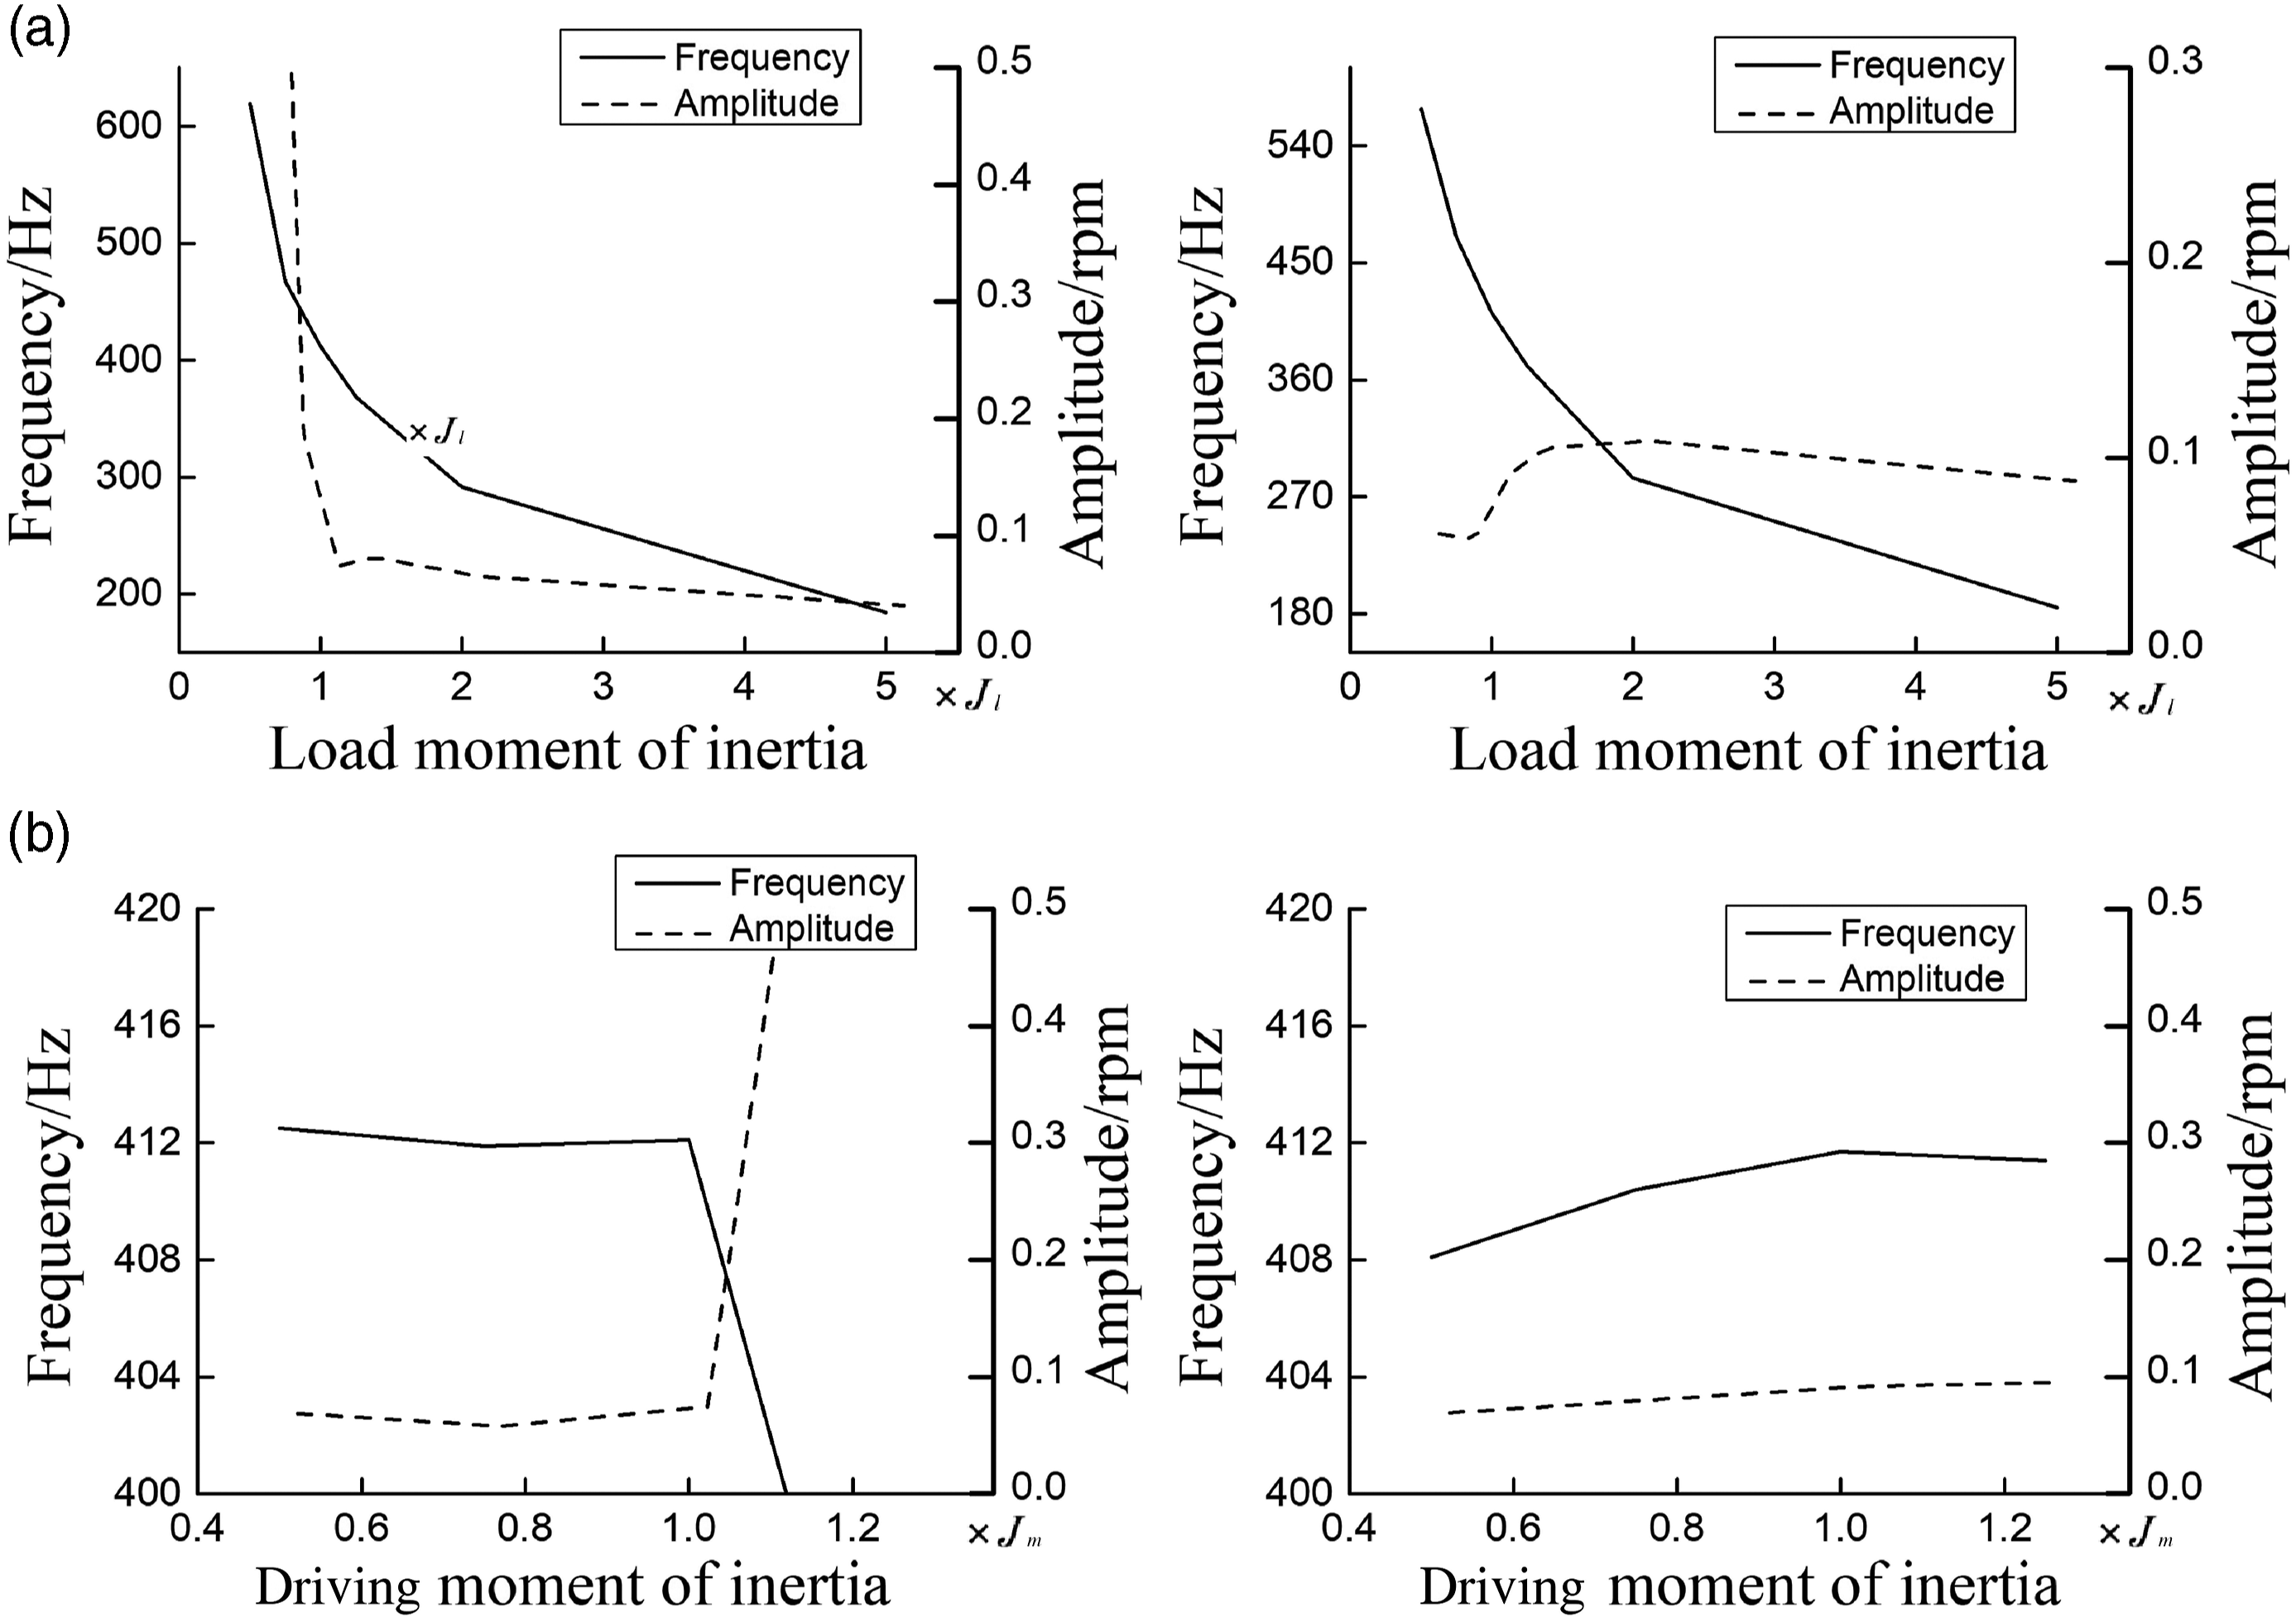
During the start-up phase, the load moment of inertia increased, and the frequency and amplitude decreased. Unlike the start-up phase, in the stop phase, as the load’s moment of inertia increased, the frequency decreased and the amplitude rose. The larger the kinetic energy stored at the same speed, the smoother the start-up and operation process. The more kinetic energy the system must overcome when it stops, the greater the vibration amplitude. Therefore, it is feasible to reasonably select the load moment of inertia to reduce the jitter of the harmonic gear reducer during its operation and stop.
The driving moments of inertia were set to 0.5J m , 0.75J m , 1J m , and 1.25J m . Figure 11(b) shows the frequency and amplitude diagrams of different driving moments of inertia. As can be seen from the observation, during the start-up process, as the driving moment of inertia increased, the frequency decreased, and the amplitude increased. The driving moment of inertia is too large to exacerbate the vibration. In the stop phase, as the driving moment of inertia increased, the frequency and amplitude increased gradually. Properly reducing the driving moment of inertia can make the harmonic gear reducer work more stable and the vibration amplitude smaller, but the vibration frequency will increase. It is necessary to avoid reaching the resonance frequency range of the system.
4.3. Influence of torsional stiffness
Set the torsional stiffness to 0.5 K, 0.75 K, 1K, and 1.25 K, and the frequency and amplitude are shown in Figure 12. Regardless of starting or stopping, as the stiffness increases, the vibration frequency and amplitude increase, which is basically consistent with the simple harmonic motion formula Amplitudes and frequencies at different torsional stiffness: (a) start and (b) stop.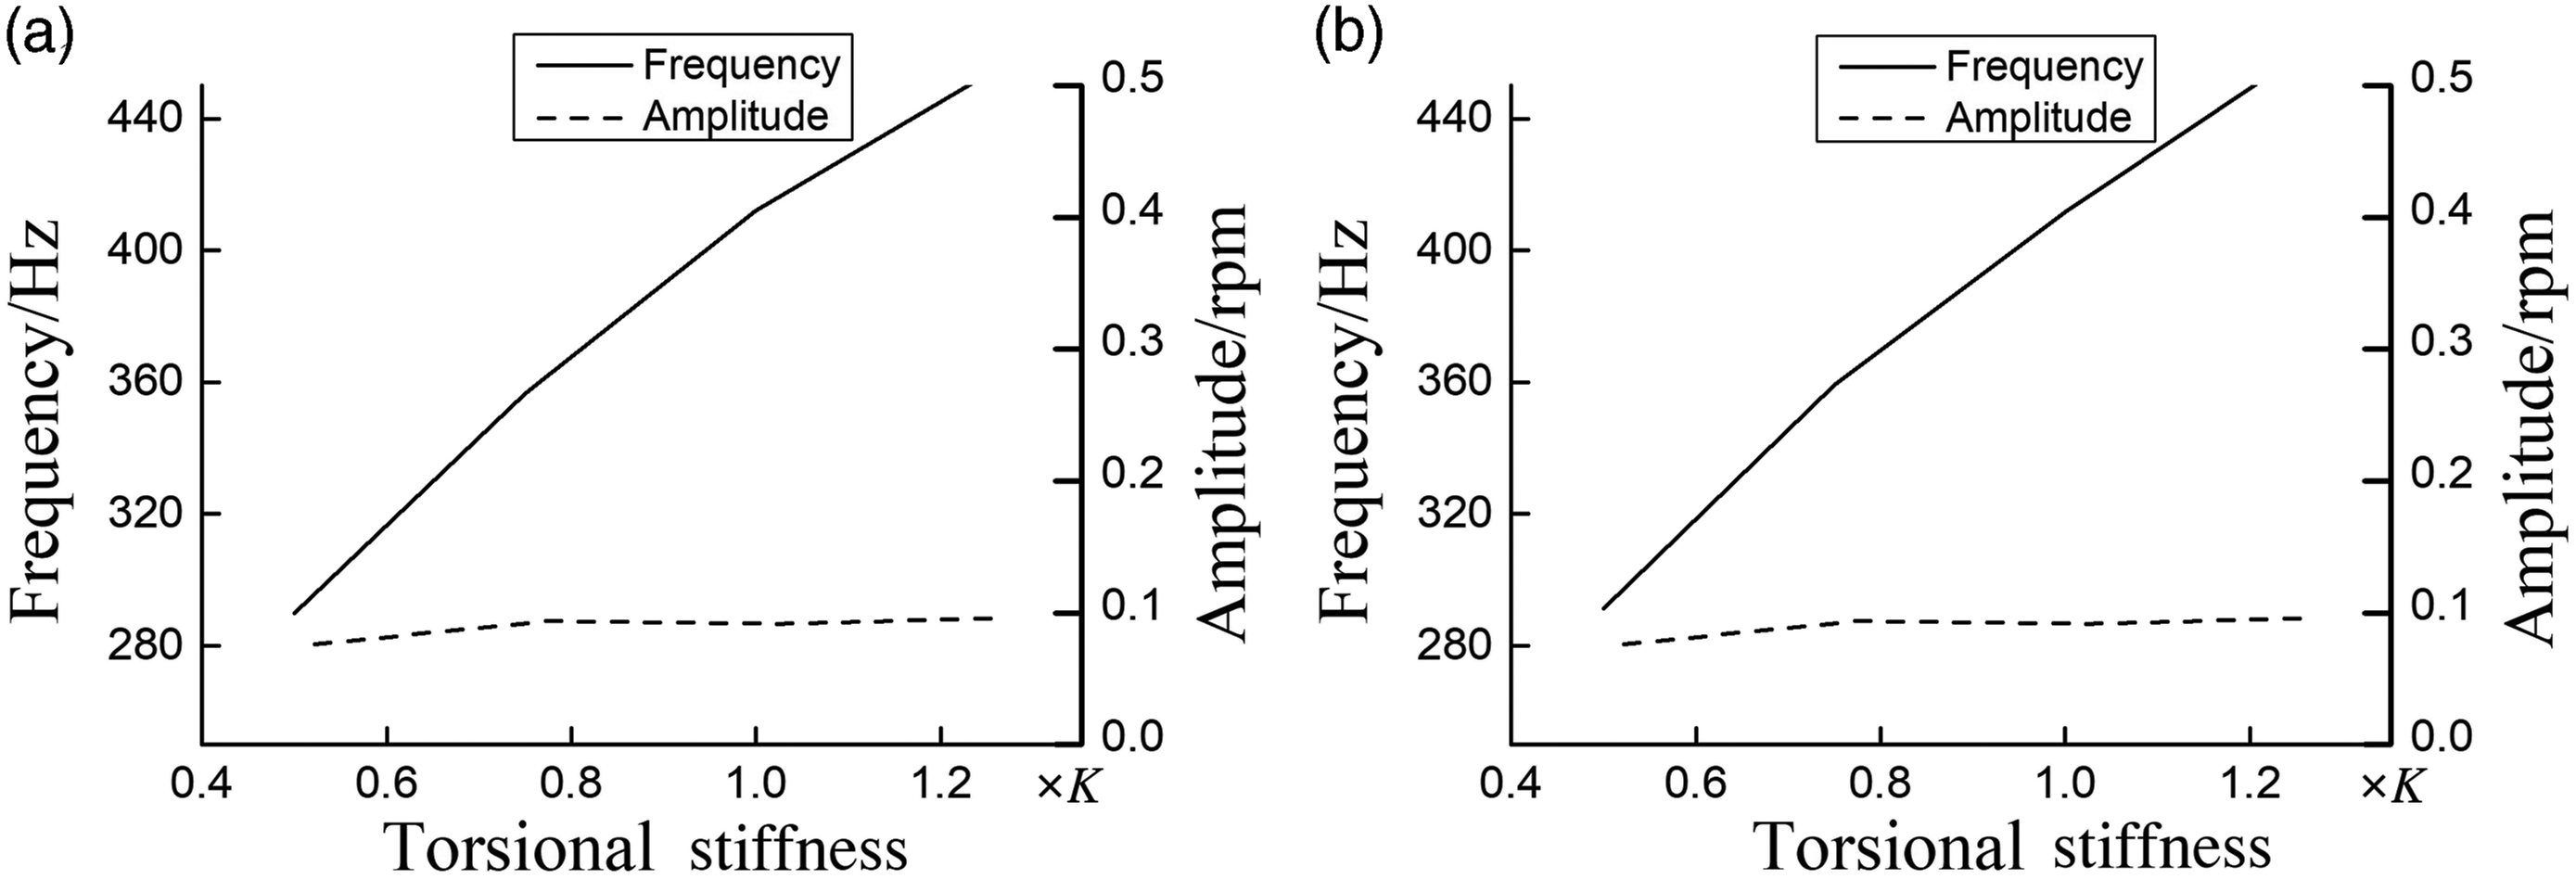
4.4. Influence of damping
As can be seen from the previous chapters, the damping of the harmonic drive system includes four aspects: the input end damping B
m
, the output end damping B
l
, the damping B
ml
at the cup-shaped flexible wheel, and the damping B
sp
at the rigid joint. The input end damping B
m
and the output end damping B
l
are the external damping of the harmonic gear reducer, which has little effect on the harmonic gear reducer itself. The damping at the cup-shaped flex wheel was set to 0.5B
ml
, 0.75B
ml
, 1B
ml
, and 1.25B
ml
. The damping at the rigid joint was 0.5B
sp
, 0.75B
sp
, 1B
sp
, and 1.25B
sp
. Figures 13(a) and (b) show the system under different damping. System response at different damping: (a) amplitudes and frequencies at different damping at the rigid joint and (b) amplitudes and frequencies at different damping at the cup-shaped flexible wheel.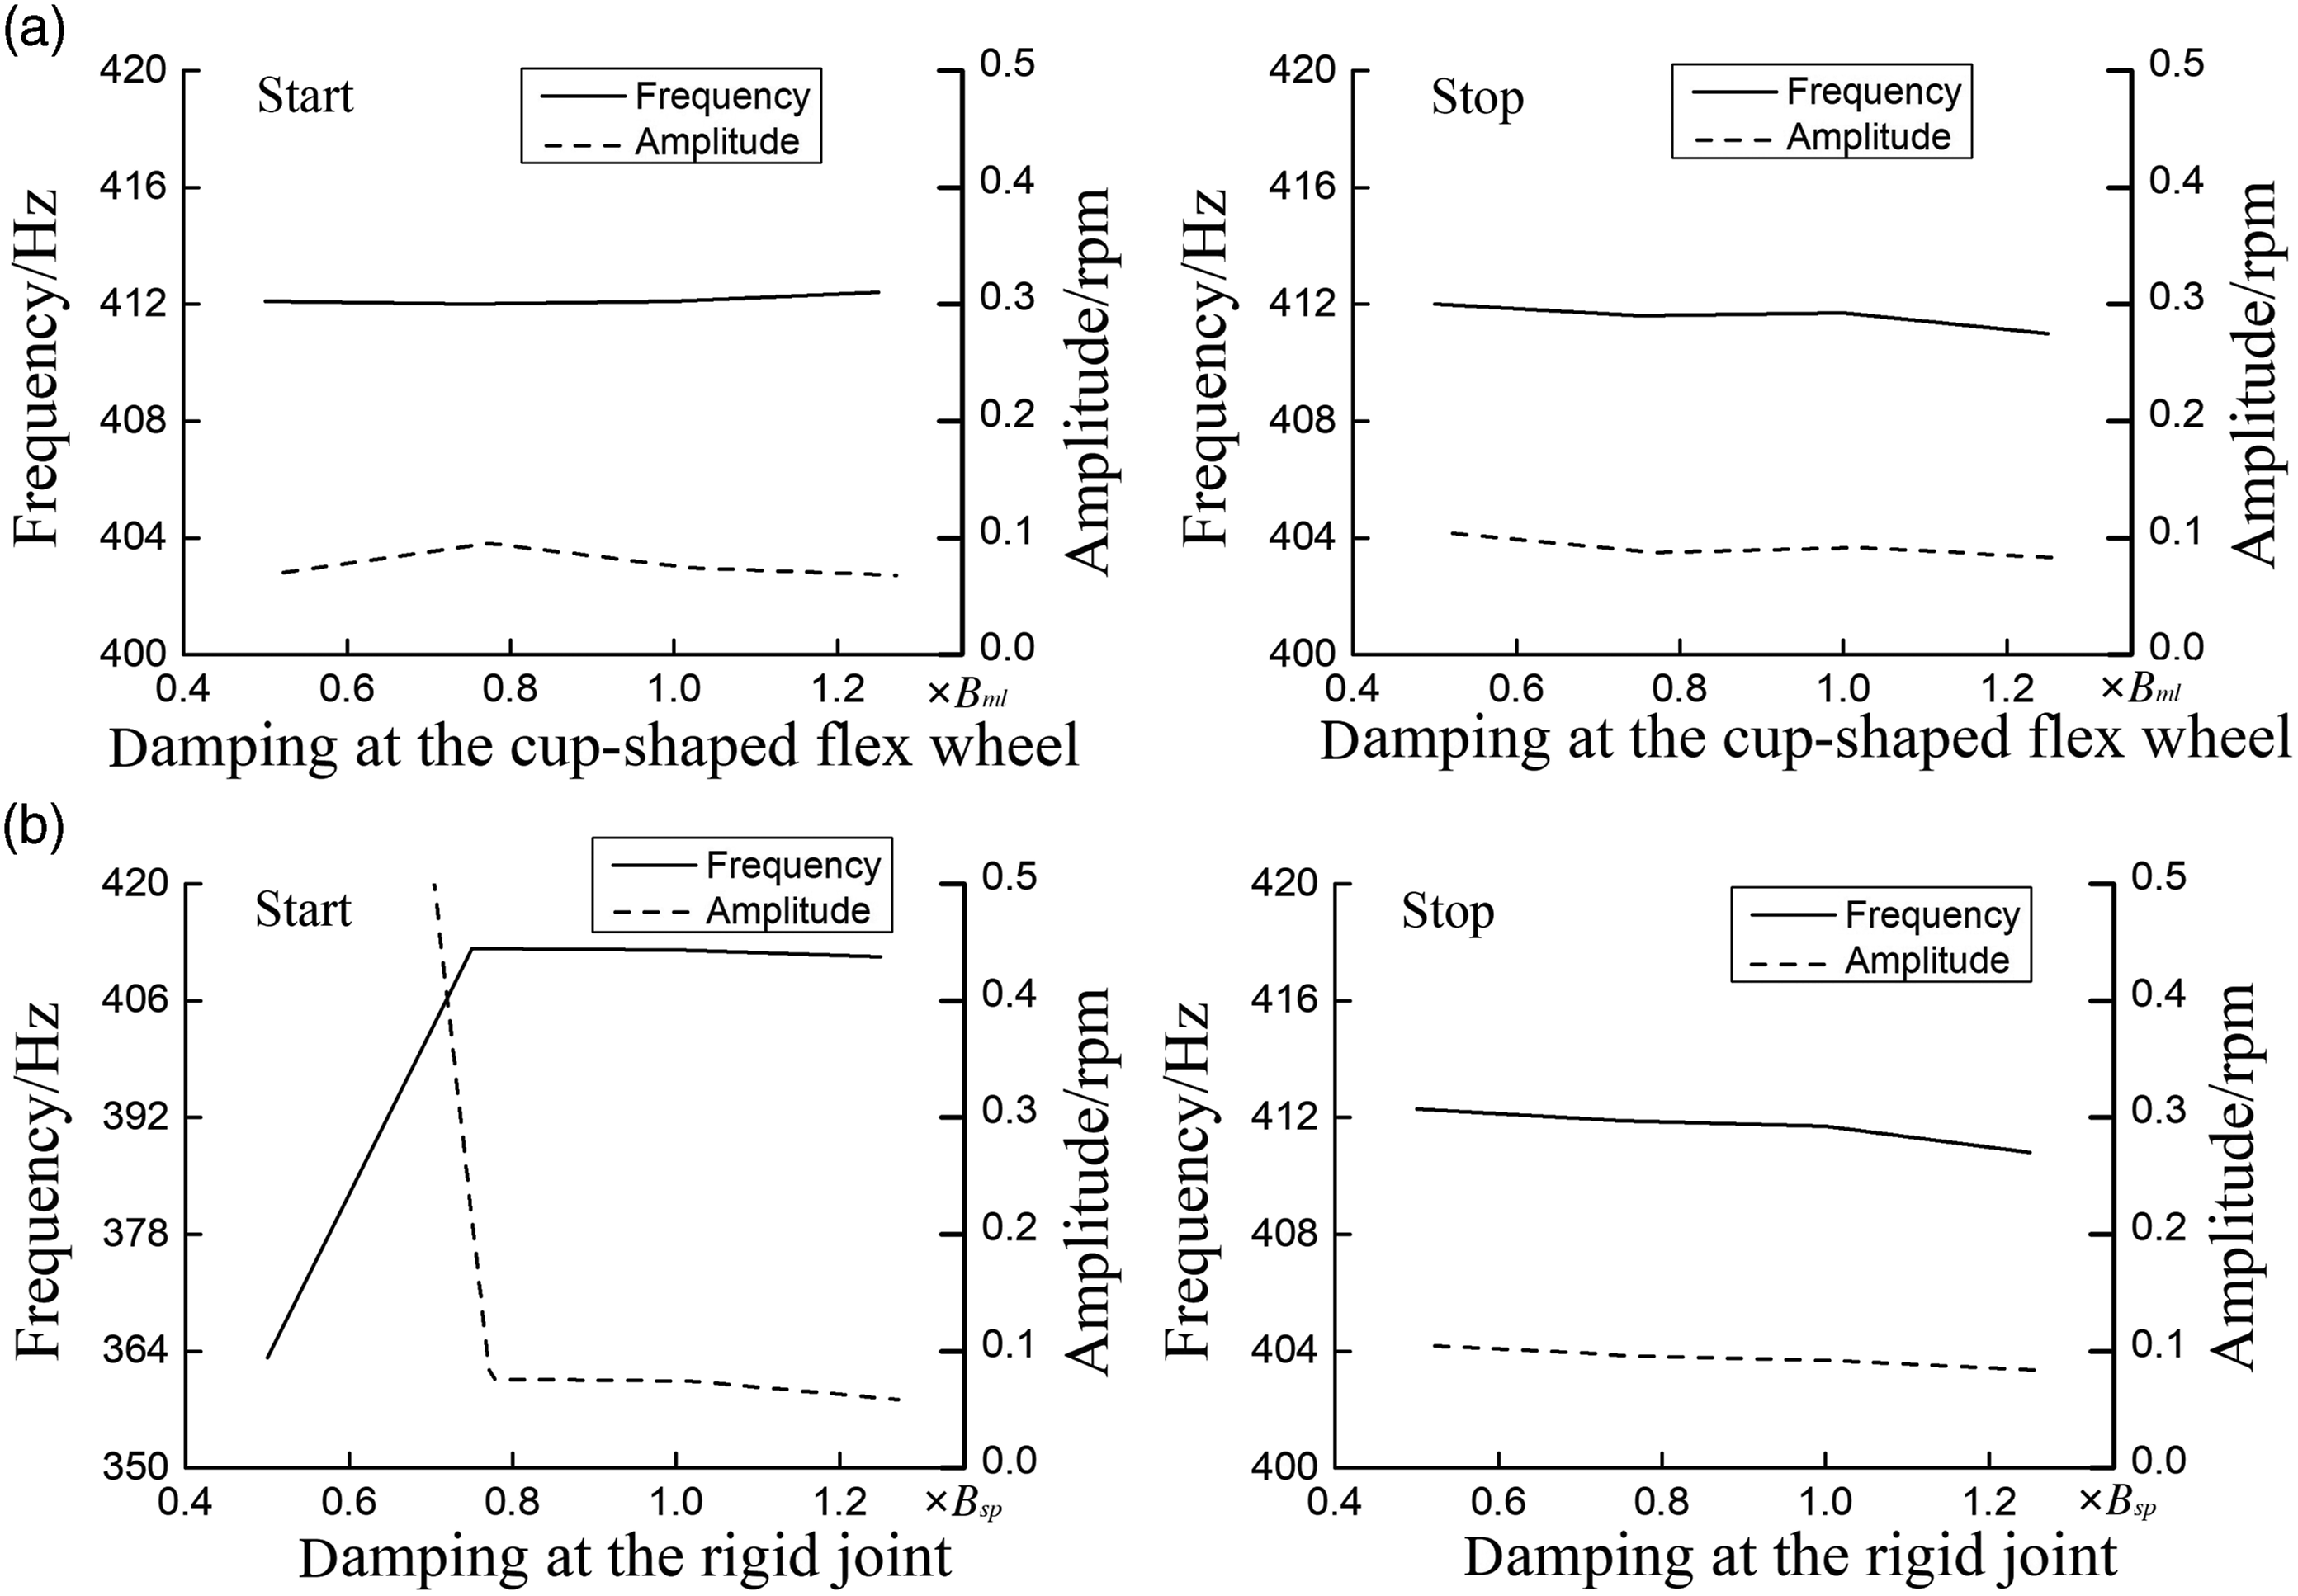
Increasing the damping at the flexible wheel can reduce the vibration amplitude of the transmission system, conforming to the vibration characteristics of the damper system, making the work more stable, and the vibration frequency is basically unchanged. But the greater the damping, the more energy is consumed when the system is started and running.
Similar to the damping change of the flexible wheel, the reduction of the damping of the rigid joint can lead to the reduction of vibration frequency and amplitude, which provides a reference for the design and material’s selection of the flexible wheel and the rigid wheel.
4.5. Influence of transmission error
Based on the transmission error obtained in the previous section, the system was set to 0.5 Amplitudes and frequencies at different transmission error: (a) start and (b) stop.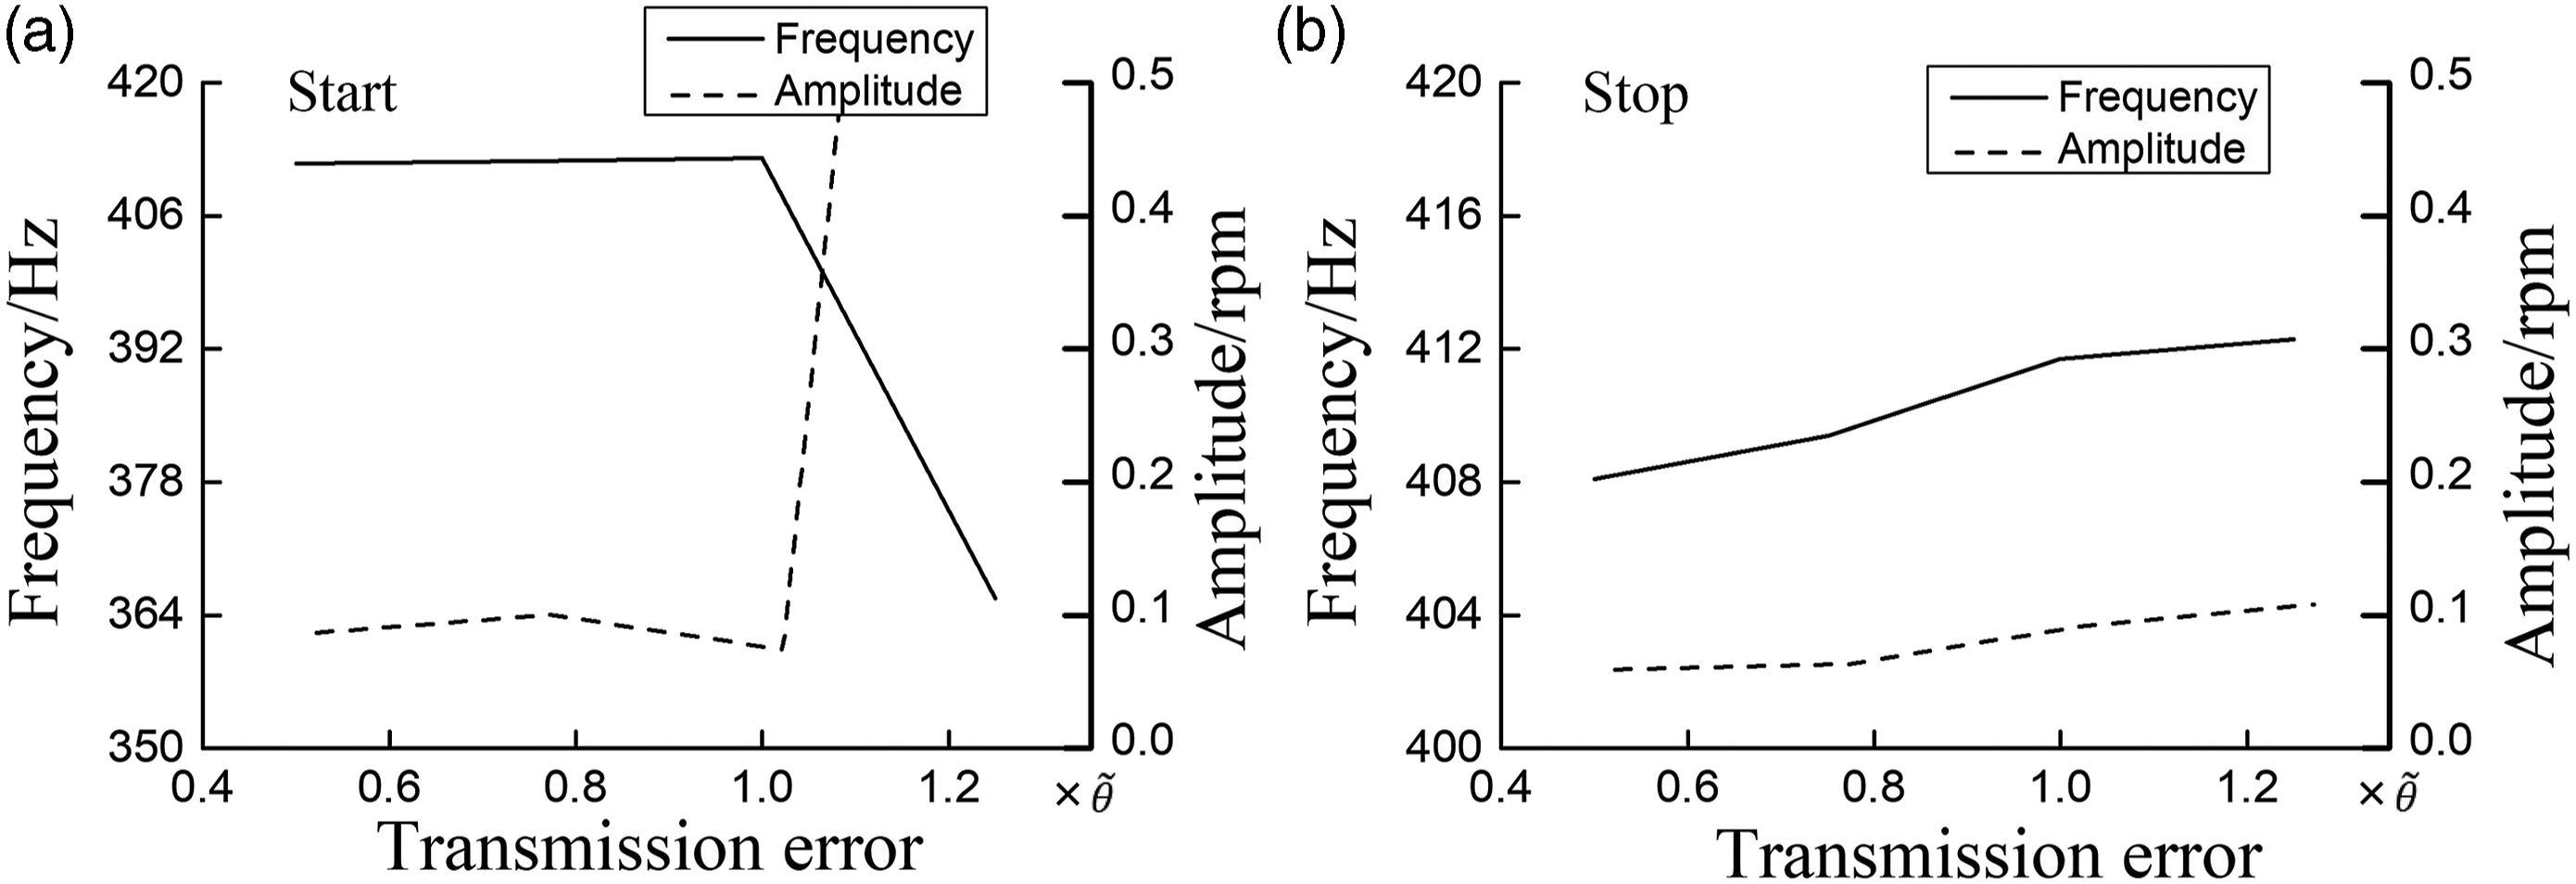
As the error increased, the frequency of the start and stop phases was basically unchanged, and the amplitude will increase. The error mainly comes from two aspects: dynamic error caused by static error and stiffness characteristics caused by processing, assembly, and other factors. At the same time, the error may appear as a rotational vibration of the load side inertia, so the vibration caused by the error excitation will be inevitable. In order to minimize the effect of the error on the vibration amplitude, the machining accuracy of the relevant components of the harmonic gear reducer can be appropriately increased, and the friction between the teeth and the backlash can be reduced for the influence of the error excitation.
5. Conclusion
The amplitude of the harmonic gear reducer increases as the speed increases. The moment of inertia of the motor has little effect on the vibration frequency, and the amplitude increases with the increase of the moment of inertia of the motor. The vibration frequency increases with the torsional stiffness, but the torsional stiffness mainly acts on high-frequency vibration components. Similar to other damping vibration systems, the damping effect of the harmonic gear reducer on vibration is mainly in the amplitude, which decreases with the increase of damping. As the transmission error increases, the amplitude gradually increases. When the transmission error is too high, it may even cause system instability and severe vibration.
Footnotes
Declaration of conflicting interests
The author(s) declared no potential conflicts of interest with respect to the research, authorship, and/or publication of this article.
Funding
The author(s) disclosed receipt of the following financial support for the research, authorship, and/or publication of this article: This study was supported by the National Key R&D Program of China (2018YFB1304800), Project Funded by China Postdoctoral Science Foundation (No. 2018T110971 and 2017M623027).