
Abstract
The torsional vibration signals of rotating shafts are multimodal non-stationary noisy signals. The harmonics and attenuation characteristics of these non-stationary signals cannot be obtained effectively by the ordinary short-time Fourier transform algorithm. Although Prony analysis can accurately fit and identify the characteristic coefficients of such non-stationary signals, it is still sensitive to noise. In this article, we propose a system for denoising and identification of torsional vibration signals. In particular, the improved complete ensemble empirical mode decomposition with adaptive noise (ICEEMDAN), wavelet transform, and robust independent component analysis methods are used to denoise the torsional vibration signals, and then, Prony analysis is used to obtain the characteristic parameters of these signals. The proposed algorithm has good denoising performance and it can improve the identification accuracy and reduce the order of the Prony analysis.
Keywords
1. Introduction
In mechanical systems, the torsional vibration signals (TVS) of rotating shafts are multimodal non-stationary noisy signals. Taradai et al. (2018) have described three experimental methods to determine the lowest natural frequencies of torsional vibration excited in the shaft system, Lv et al. (2016) used a T-like beam structure to measure the torsional vibration, Xue and Howard (2018) used the TVS as a diagnostic tool for planetary gearbox faults detection, and Janssens et al. (2011) developed a zebra tape butt joint algorithm for torsional vibrations. Although harmonic analysis of these signals based on the short-time Fourier transform (STFT) can be carried out, the higher frequency resolution can be obtained only through a large sampling window. Also, it is difficult to obtain the attenuation characteristics of these non-stationary signals. The wavelet transform (WT) (Daubechies and Heil 1998; Daubechies 2002) and the Hilbert–Huang transform (HHT) (Huang et al., 1998; Huang and Wu, 2008; Wu and Huang, 2009; Yeh et al., 2010) are good alternatives for the analysis of such non-stationary signals. However, the results of wavelet analysis depend on the selection of the wavelet basis and are affected by the frequency-domain aliasing, and hence are not accurate enough. For the HHT, a signal is decomposed into intrinsic mode functions (IMF) by empirical mode decomposition (EMD). The signal parameters are thus obtained by means of Hilbert transform (HT). This transform can process non-stationary signals, and the generated parameters are independent of the selection of basic functions, but there are problems of modal aliasing and limited accuracy. Prony analysis can accurately fit and identify the characteristic coefficients of non-stationary signals. However, for noisy signals, the fitting results of this analysis are typically distorted (Marple, 1989; Okamoto et al., 1996). The WT combined with EMD can be used for signal denoising, but the obtained signal-to-noise ratios (SNR) are usually limited. The robust independent component analysis (ICA) algorithm (Zarzoso and Comon, 2010) exploits the mutual statistical independence between mixed source signals to blindly separate such signals and uses the historical data similarities to match the separation results. Nejad and Rizi (2018) used the joint method of ICA, ICEEMDAN, Wavelet Shrinkage to extract and anlysis an adaptive FECG. Nevertheless, the signal transmission in the shaft torsional vibration testing is random and uncertain, thus it is difficult for this algorithm to get the ideal independent signal components. In this article, we developed a joint algorithm to analyze the signal. The signal can be divided by EMD into IMFs, which can be used as the input for the robust ICA algorithm, which can produce physically meaningful signals. Then, wavelet thresholding is used to denoise the robust ICA output and obtain a higher SNR. The denoised signals can be analyzed by the Prony method to obtain higher identification accuracies.
2. Signal parameter identification based on the Prony method
2.1. The Prony method
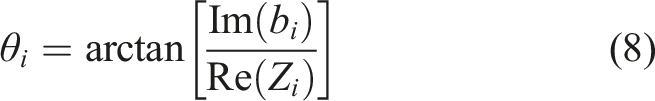
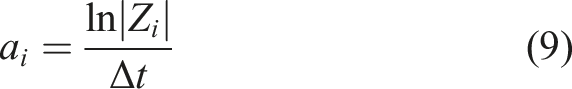
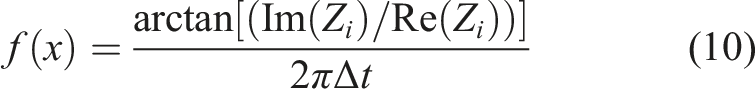
The Prony method can be used to identify the modal parameters of a signal as well as the signal frequency, amplitude, phase, and attenuation factor (Marple, 1989; Okamoto et al., 1996). In this work, we essentially use a linear combination of exponential functions to fit the equal-interval sampled data, for which the fitting coefficients can be found by the singular value decomposition and the total least-square regression (SVD-TLS). The steps of this approach are as follows:
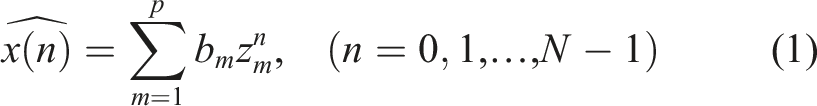
Suppose the time series of the TVS can be represented as the following linear combination of complex exponentials
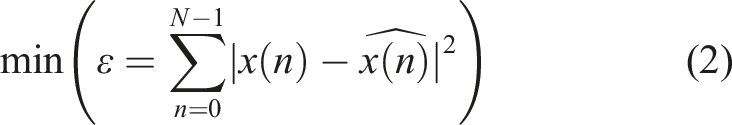
To make a good fit to the actual signal, minimize the sum of the squared errors, that is
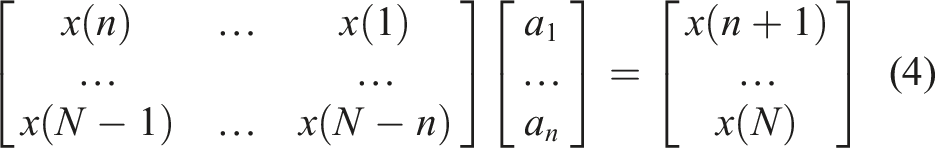
The solution of the minimization problem in (2) can be regarded as the homogeneous solution of a difference equation with constant coefficients. Hence, a linear prediction model can be constructed as

For sampled data, the linear prediction model can be written in matrix form as
As for the given
By computing the eigenvalues of the characteristic equation of the system in (4)

The eigenvalues can be replaced, and the coefficients
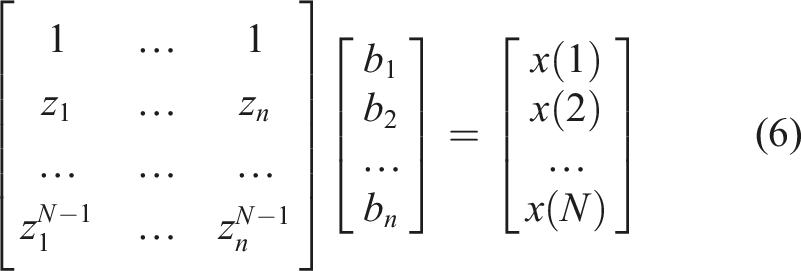
By solving the amplitude

2.2. Prony analysis of TVS
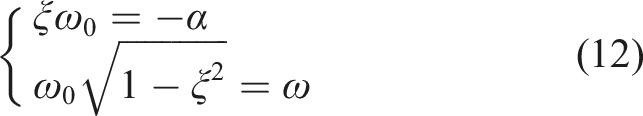
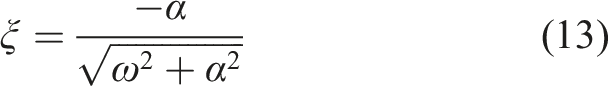
The damped TVS of a rotating shaft can be given as
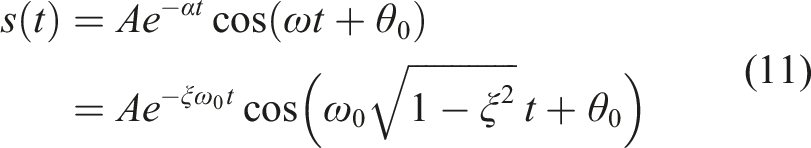
In this expression,
For example, consider the TVS

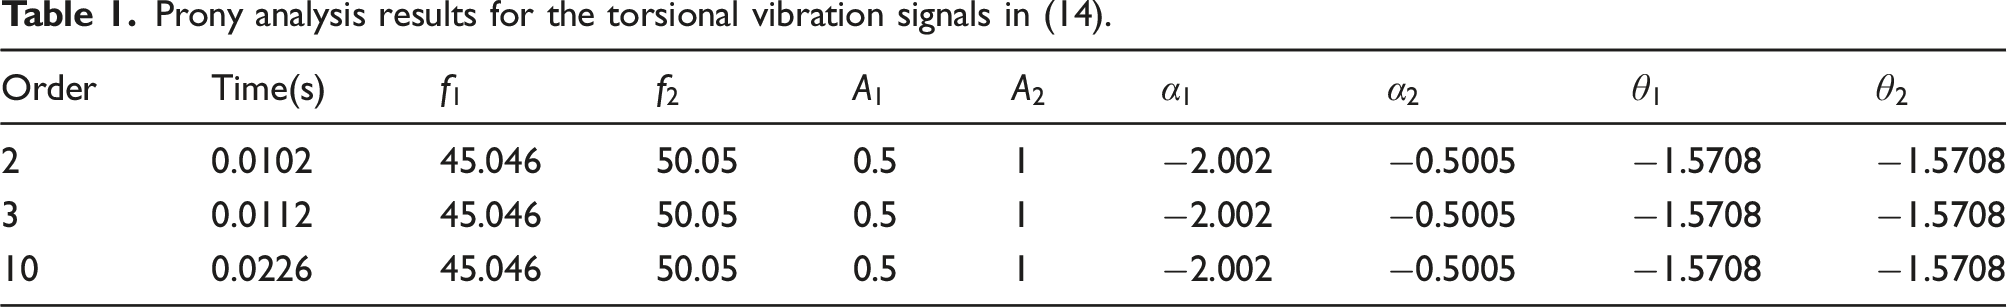
We show here the experimental results of applying the Prony analysis to the signal in (14). For the experimental setup, we used a ThinkPad X270 machine with an Intel Core i7-7500U CPU, a 2.7-GHz processor, an 8 GB memory, a 64-bit Windows 10 operating system, and a MATLAB R2018b environment.
Prony analysis results for the torsional vibration signals in (14).
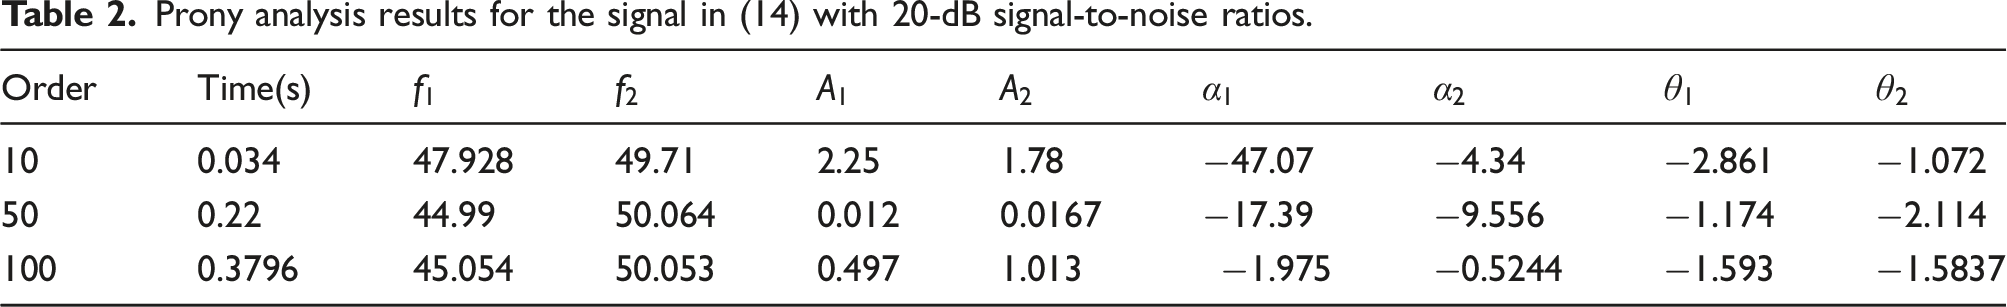
Prony analysis results for the signal in (14) with 20-dB signal-to-noise ratios.
Prony analysis results for the signal in (14) with 30-dB signal-to-noise ratios.
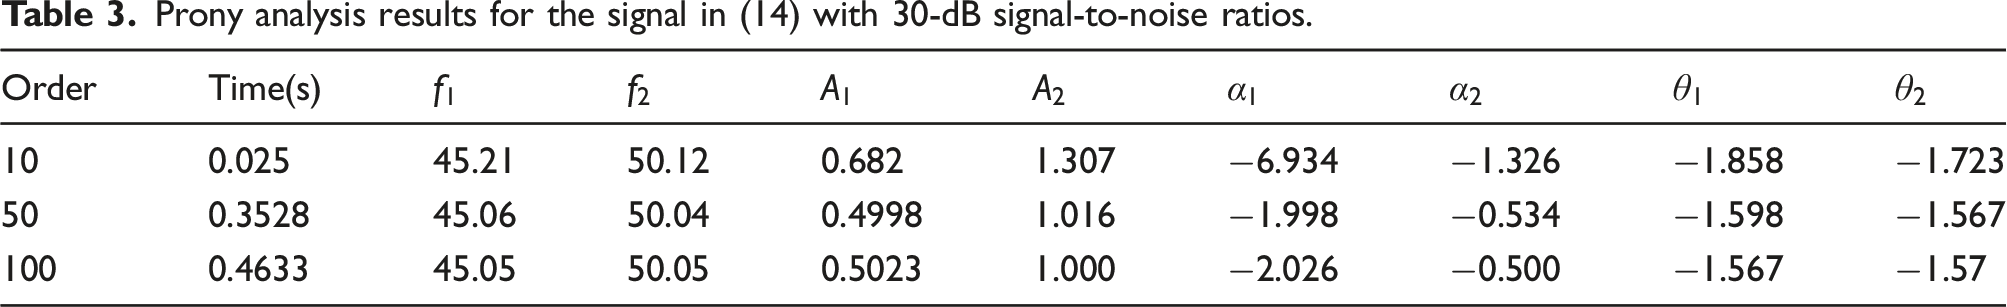
As can be seen from Tables 1, 2, and 3, when the signal is noisy, the Prony method with lower orders shows inferior identification performance. The performance generally improves as the Prony order increases. Also, for the signal with high SNR, Prony fitting accuracy is higher under the same sampling rate and sampling time.
3. Prony analysis with ICEEMDAN-based denoising
3.1. The ICEEMDAN method
The EMD is a time–frequency signal processing method (Huang et al., 1998, Huang and Wu, 2008; Wu and Huang, 2009; Yeh et al., 2010) that decomposes nonlinear non-stationary signals into IMF. However, there are endpoint effects and pattern aliasing problems with this approach. Wu and Huang (2009) developed the noise-assisted ensemble empirical mode decomposition (EEMD) to solve the above-mentioned EMD problems. The EEMD method performs EMD decomposition on multiple contaminations of the original signal with white noise and averages the results of the multiple decompositions to obtain the final IMF. The quality of the reconstructed signal is affected by the addition of noise in EEMD. Yeh et al. (2010) adopt the complementary empirical mode decomposition (CEEMD) method that mixes two complementary white noise signals with the input signal, decomposes the noisy signals, and performs EMD analysis. This method can significantly reduce the influence of noise on the reconstructed signal. With the addition of noise in the EEMD and CEEMD methods, the EMD computational complexity increases. Also, since a lot of pseudo components may be produced after EMD completion, the EMD-generated components may need to be reanalyzed and reprocessed. For the actual EEMD implementation, the number of iterations is limited. Consequently, it is likely that the decomposition iteration limit is reached while the IMF termination condition is not met. Torres et al. (2011) proposed an improved complete EEMD with adaptive noise (ICEEMDAN), which can reduce decomposition times by improving the noise added in the EEMD analysis, and reducing the noise impact without affecting the signal quality. Terrien et al. (2011) estimated the noise content in the first IMF by energy statistics and extracted effective signals for noise estimation correction.
The steps of the ICEEMDAN algorithm are as follows:


Calculate the 
Repeat Steps 4–6 until the termination condition is met.
3.2. Prony analysis after ICEEMDAN denoising
We added white Gaussian noise to the signal in (14), consequently that the SNR is 20 dB. The ICEEMDAN method was used to decompose this noisy signal. The decomposition results are shown in Figure 1. The improved complete ensemble empirical mode decomposition with adaptive noise–based decomposition of the signal in (14) with 20-dB signal-to-noise ratios.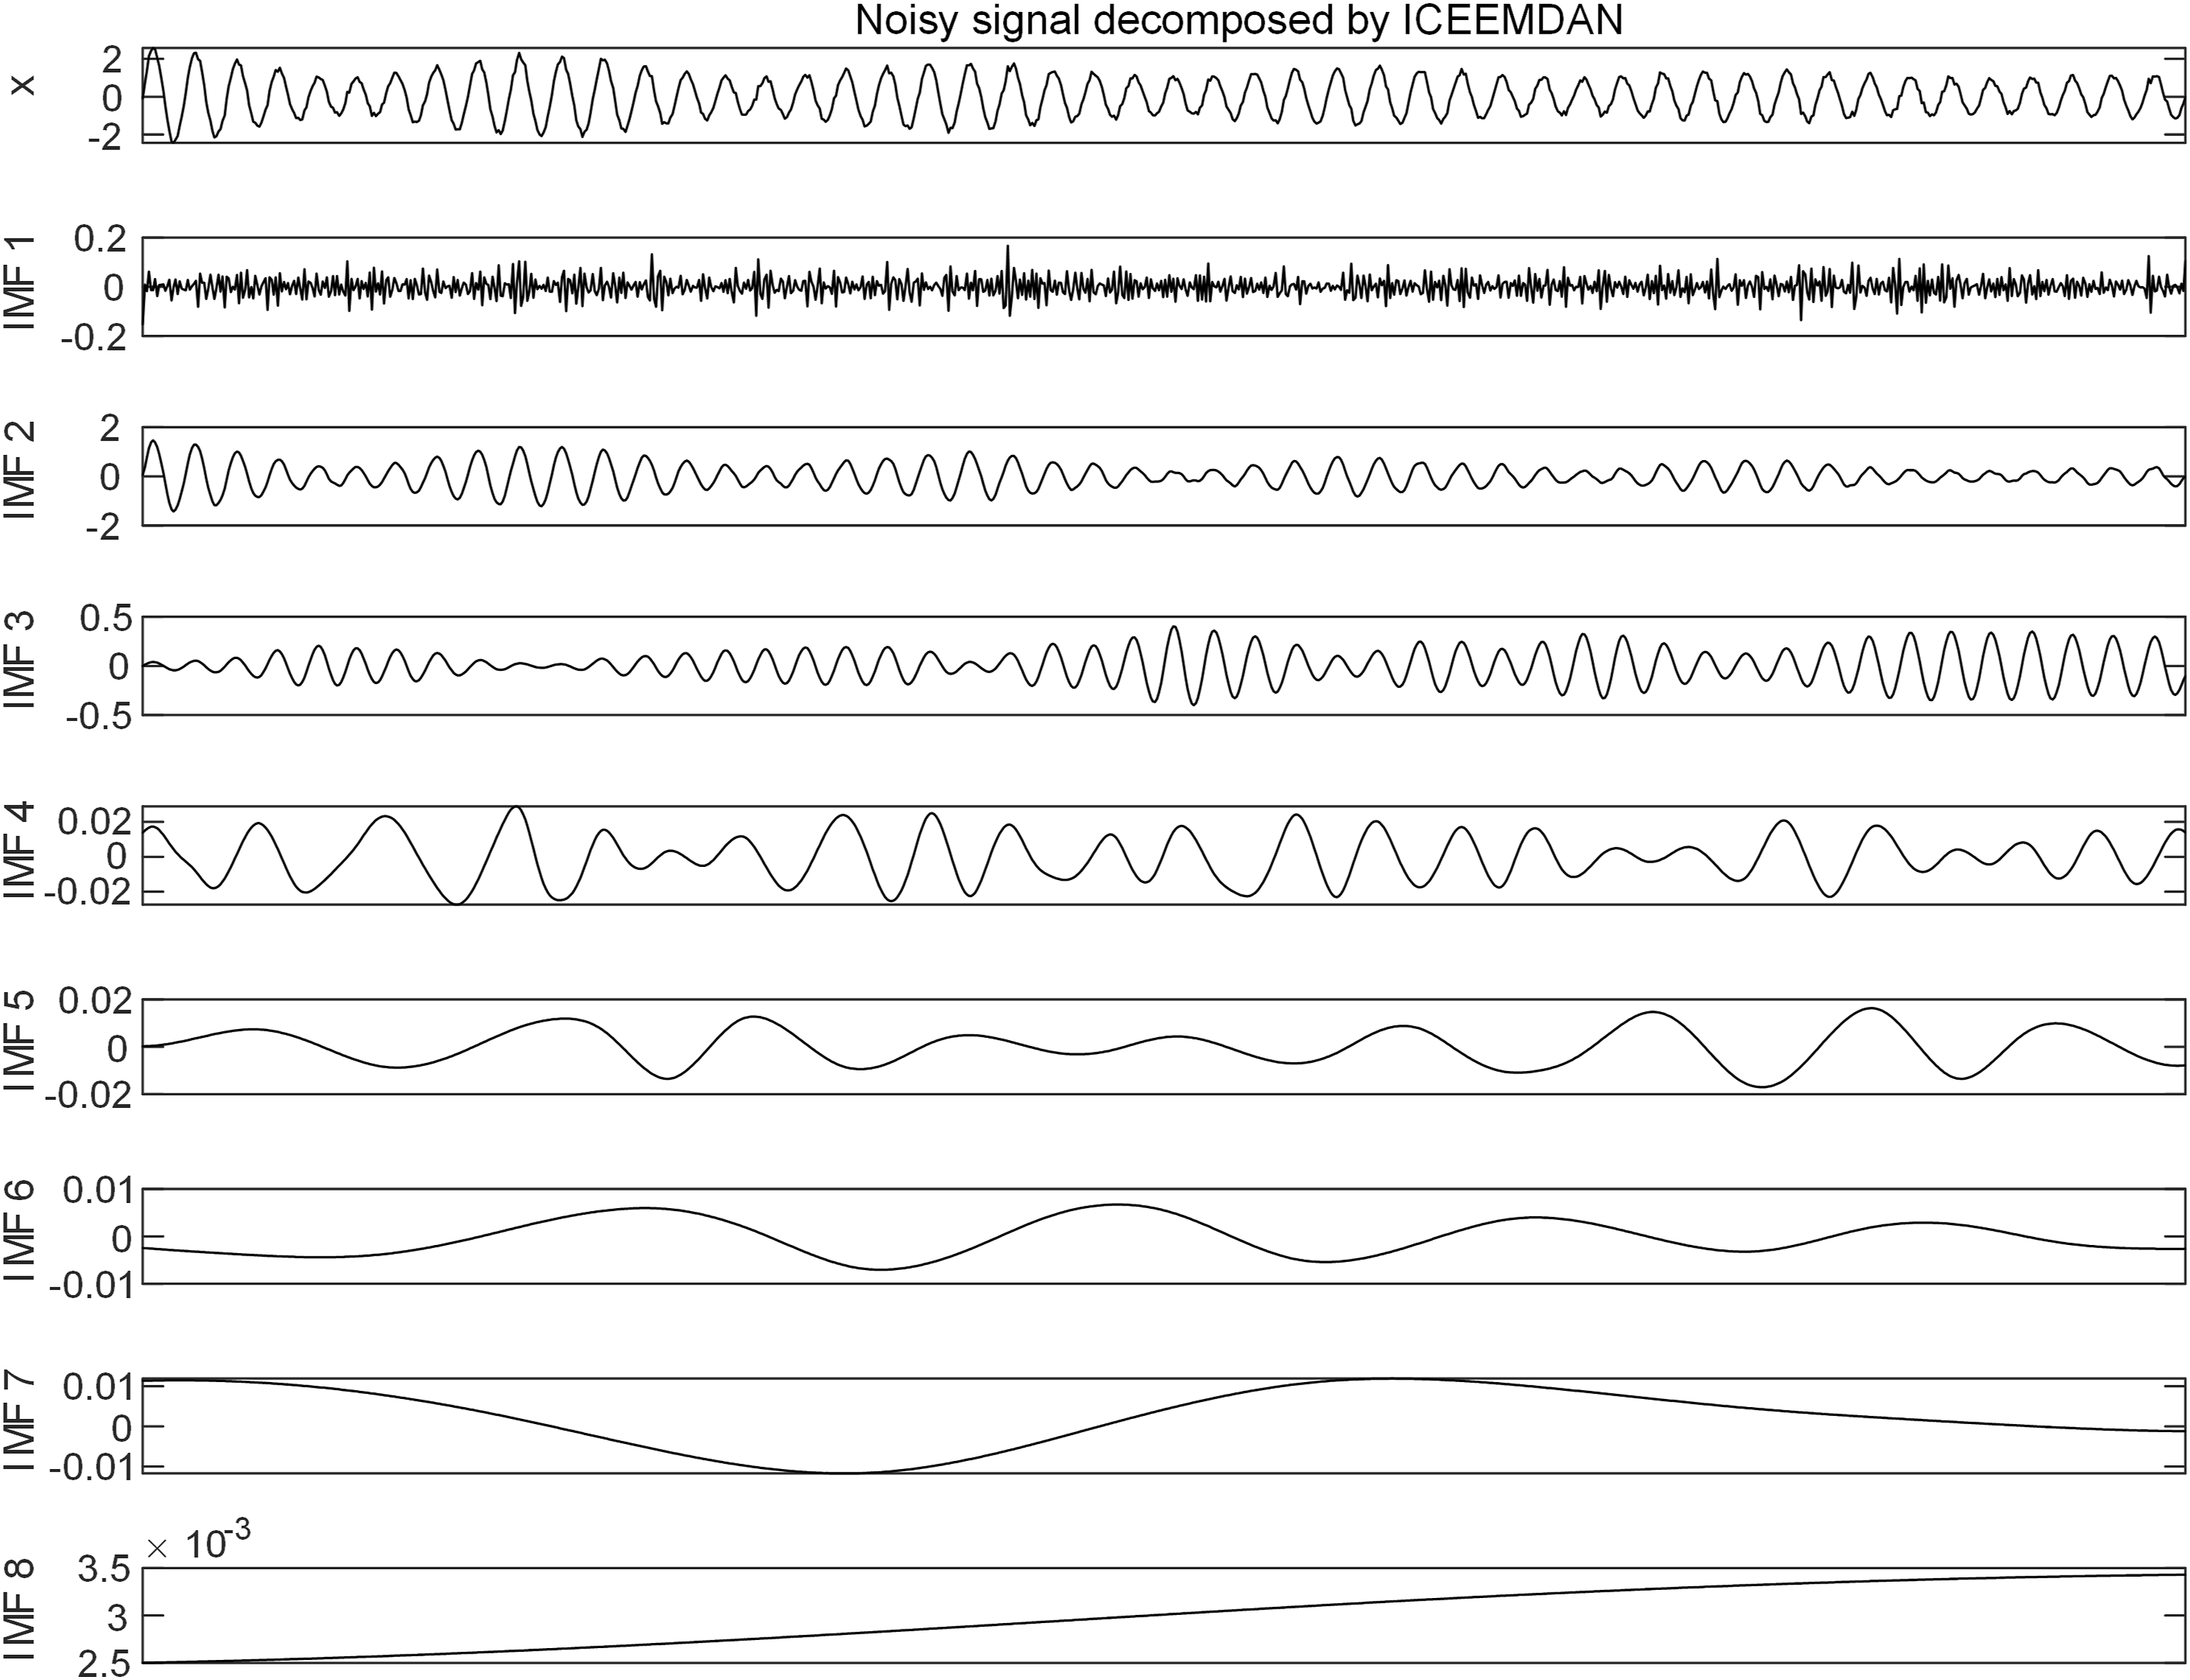
As shown in Figure 1, the signal and the noise can be separated from the modal components by the ICEEMDAN-based decomposition. However, the decomposed signal is a time-varying inter-harmonic signal, whose frequencies are comparatively close. Thus, the ICEEMDAN-based signal decomposition is mixed to a certain extent.
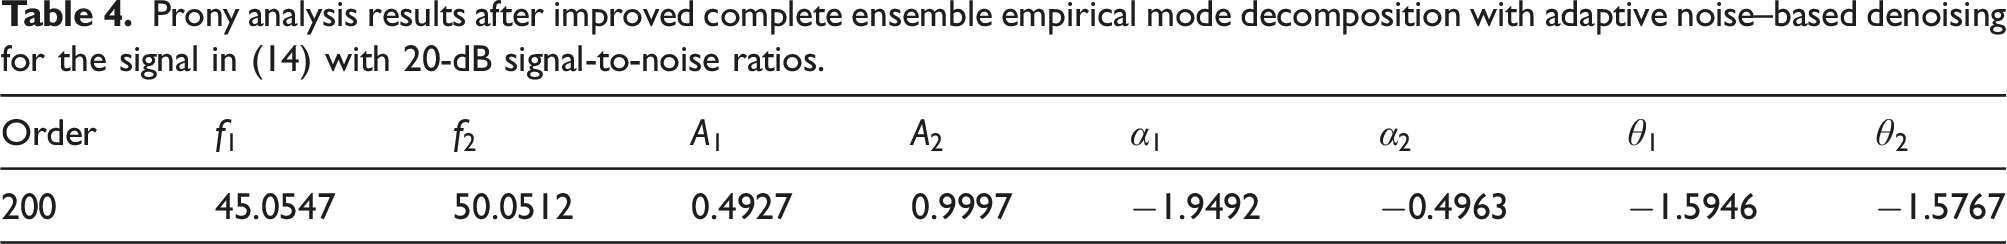
Prony analysis results after improved complete ensemble empirical mode decomposition with adaptive noise–based denoising for the signal in (14) with 20-dB signal-to-noise ratios.
4. Prony analysis with wavelet-based denoising
Weaver et al. (1991) proposed the wavelet-threshold noise reduction method. Then, Daubechies (2002) made a more refined analysis of this denoising method, which is simple, convenient, and widely applicable. The main steps of the wavelet denoising method are as follows:
The wavelet thresholding is used to extract the ground signal from the noise-contaminated signal. The discrete Meyer wavelets are selected as the wavelet basis functions, and the decomposition tree has a height of three layers. When the heuristic threshold is 4.29, the denoising performance is relatively good. The reconstructed waveform is shown in Figure 2. After wavelet denoising, the SNR is 24.87 dB, the correlation coefficient is 0.9998, and the RMSE is 0.0336. Compared with the ICEEMDAN method, the SNR and the correlation coefficient are improved, and the RMSE is reduced. This indicates that the denoising performance with wavelet thresholding is better than that of the ICEEMDAN algorithm. The reconstructed signal is analyzed by the Prony method and the results are shown in Table 5.
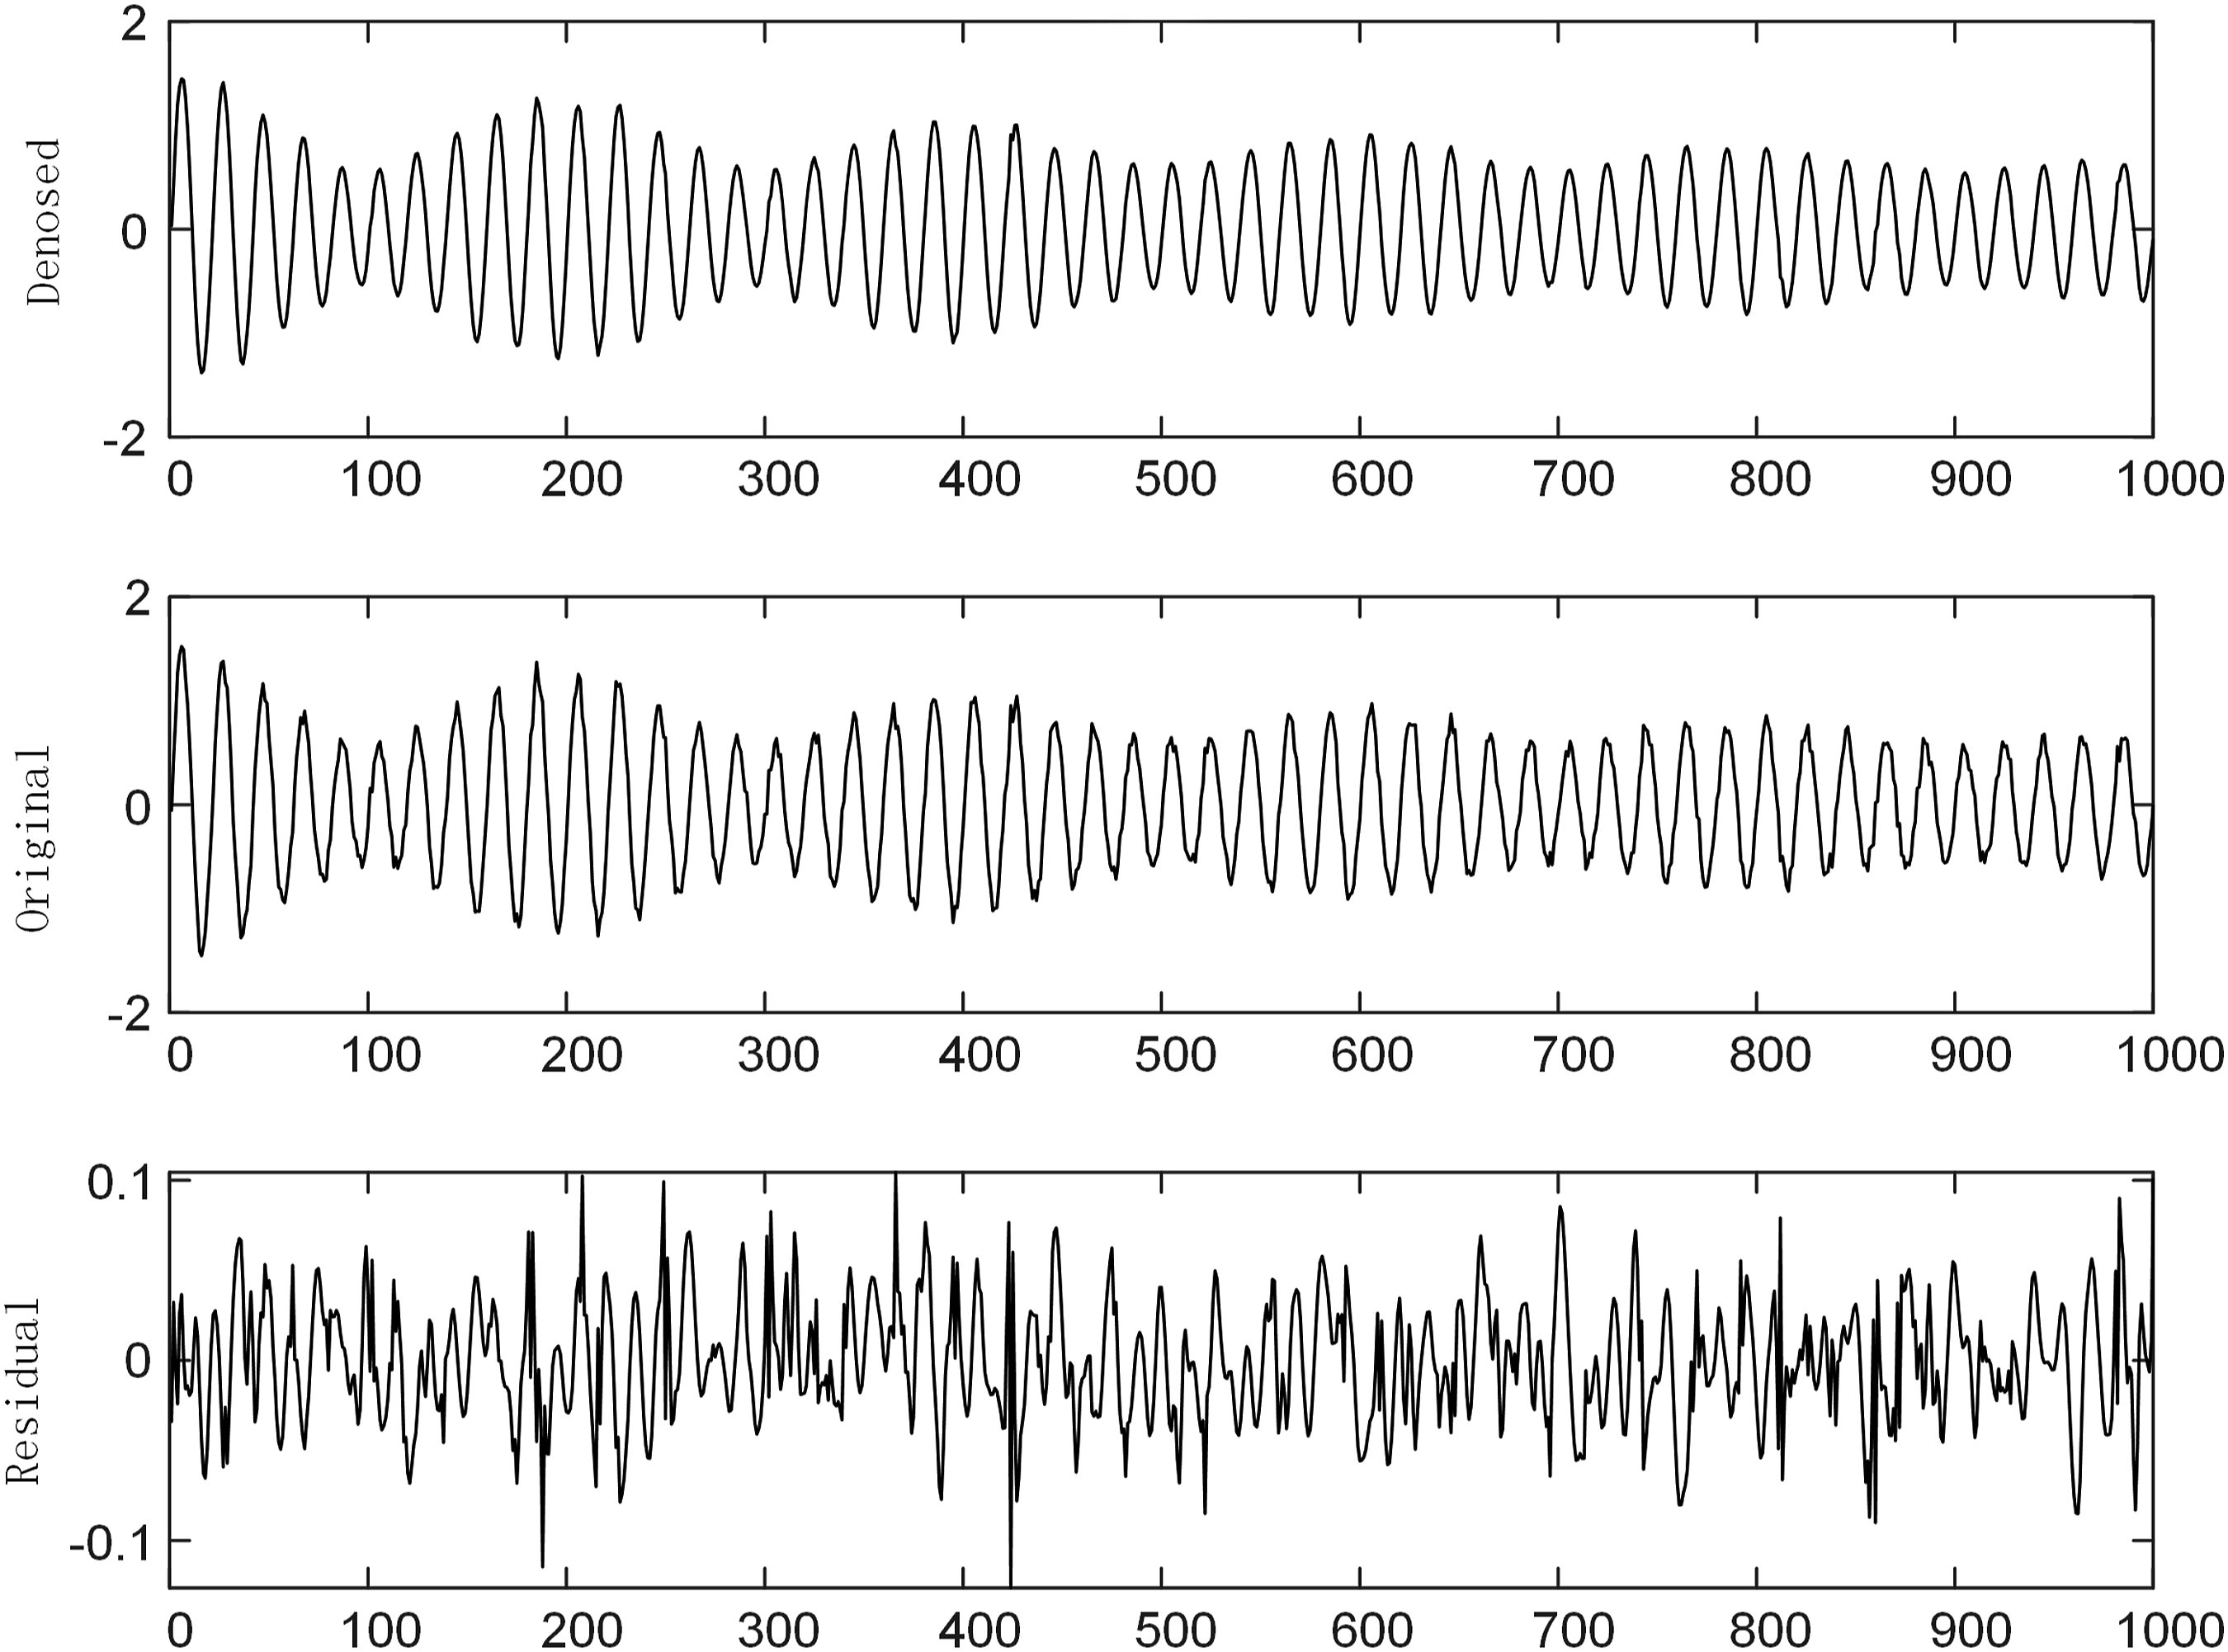
The wavelet-based denoising output for the signal in (14) with 20-dB signal-to-noise ratios.
Prony analysis results after wavelet-threshold denoising for the signal in (14) with 20-dB signal-to-noise ratios.

5. Time–frequency analysis based on the ICEEMDAN, WT, Prony, and robust ICA methods
5.1. Prony analysis with joint denoising based on ICEEMDAN and WT
For signal analysis, the modal components are first decomposed by ICEEMDAN and then denoised by wavelet thresholding. Again, a discrete Meyer wavelet basis and a wavelet tree of three layers are selected. The effect of the denoising of each modal component by using the heuristic threshold is shown in Figure 3. Signal decomposition and denoising with Improved complete ensemble empirical mode decomposition with adaptive noise and wavelet thresholding.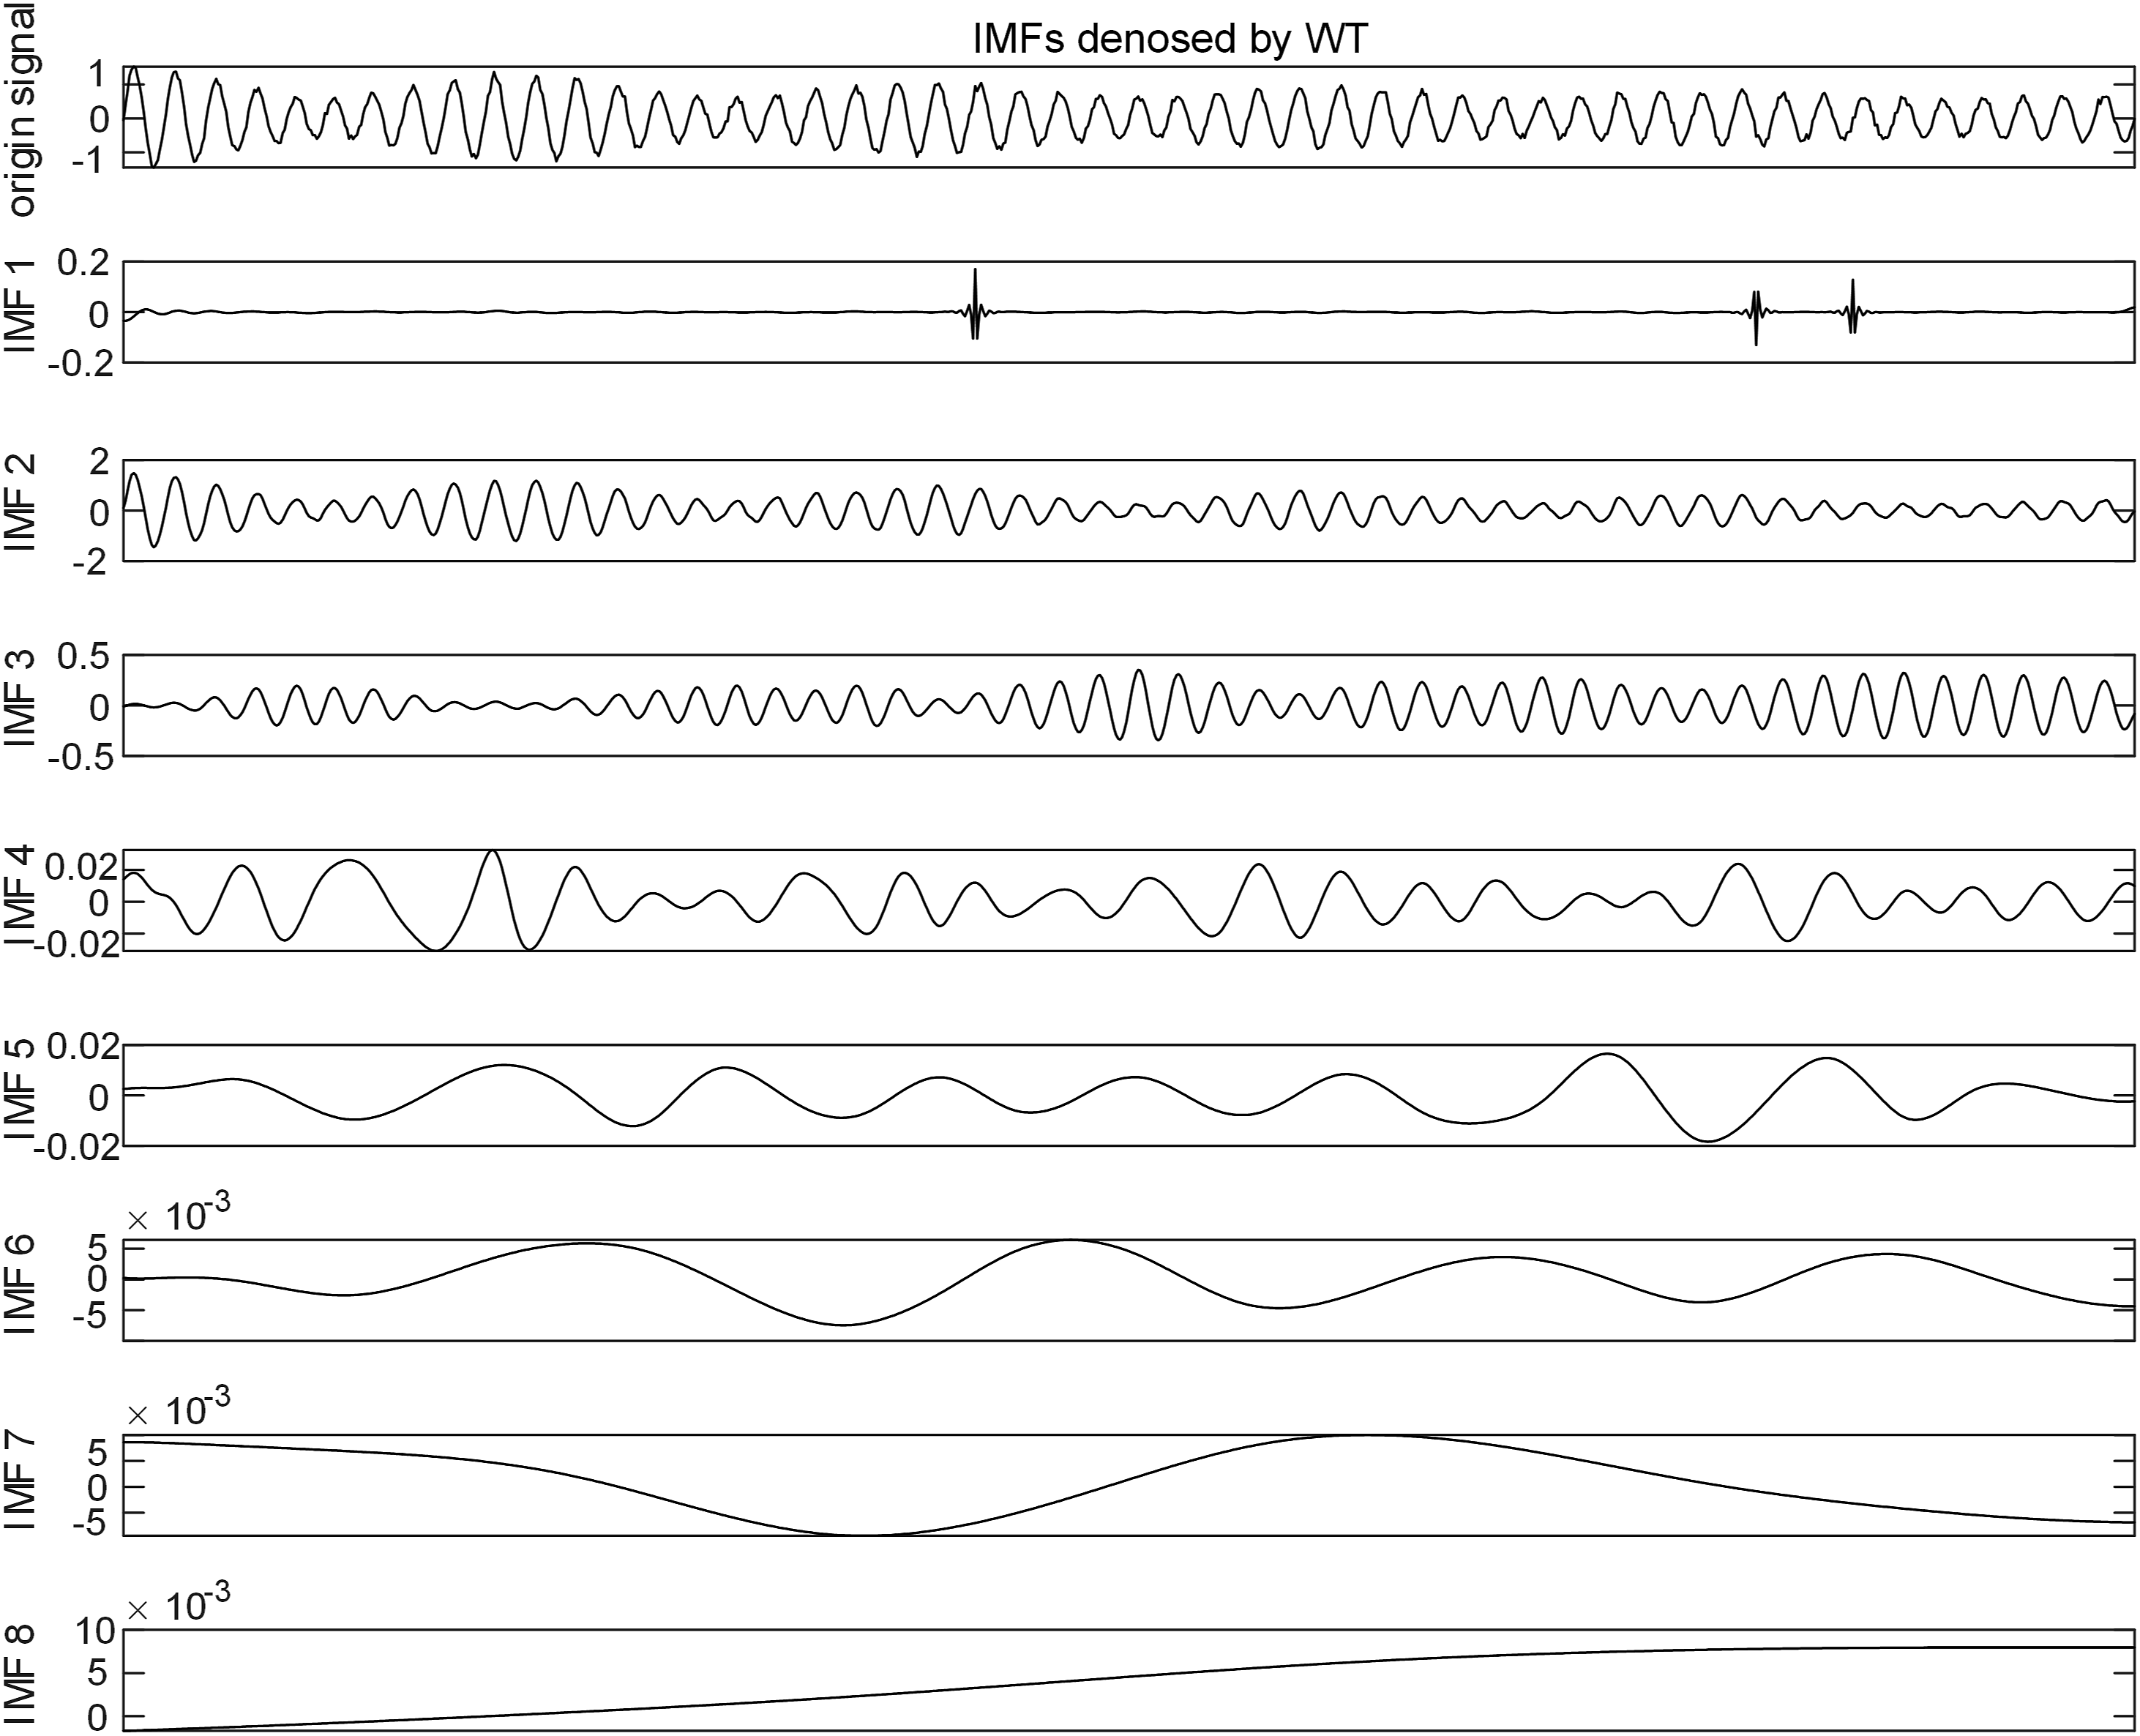
After the wavelet-threshold denoising, the SNR is 24 dB, the correlation coefficient is 0.998, and the RMSE is 0.037. Compared with the ICEEMDAN-based and wavelet-based methods, the correlation denoising index is slightly reduced. When the wavelet thresholding is used, many influencing factors are involved. When denoising the ICEEMDAN components, there is a modal aliasing problem in the ICEEMDAN decomposition. In the denoising of each modal component, the effective components are also removed. This leads to the unsatisfactory results.
5.2. Prony analysis with joint denoising based on ICEEMDAN, robust ICA, and WT
5.2.1. Robust ICA
Zarzoso et al. (2010) proposed a robust independent component analysis (robust ICA) algorithm based on the kurtosis and the optimal step size. In this algorithm, the optimal step size search is carried out by a kurtosis control function, the unmixing matrix is obtained, and the source signal is estimated.
Let the mixed noisy signal observations be 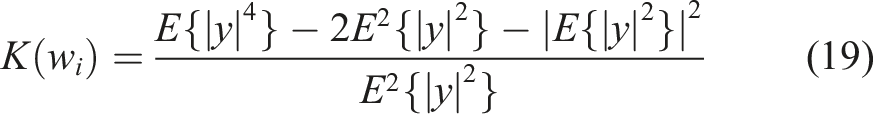
In (19), 
The typical search direction is the direction of the gradient 
This gradient can be computed as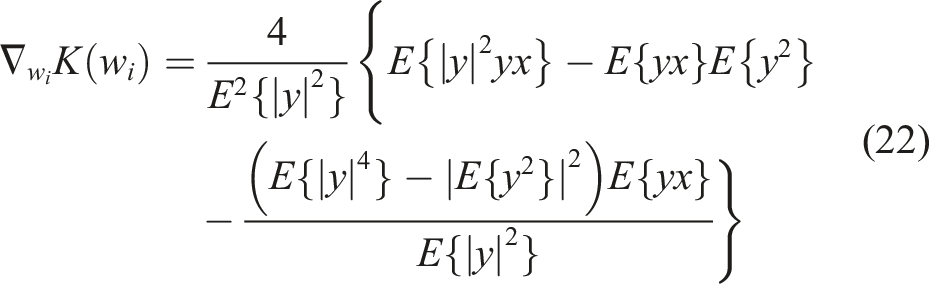
Some other restrictive conditions are introduced into the exact linear search, which is very computationally intensive. Hence, this optimization approach is difficult to be applied in practice. For more practicality and accuracy, kurtosis can be converted into a functional relation in the step size where we seek to maximize the absolute value of kurtosis. The calculated step size value can be optimized by iterating to obtain the global optimal step size OS. The optimization steps are as follows:
In each iteration, the coefficients 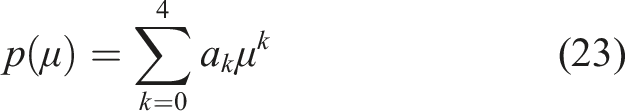


5.2.2. Prony analysis with joint denoising based on ICEEMDAN, robust ICA, and WT
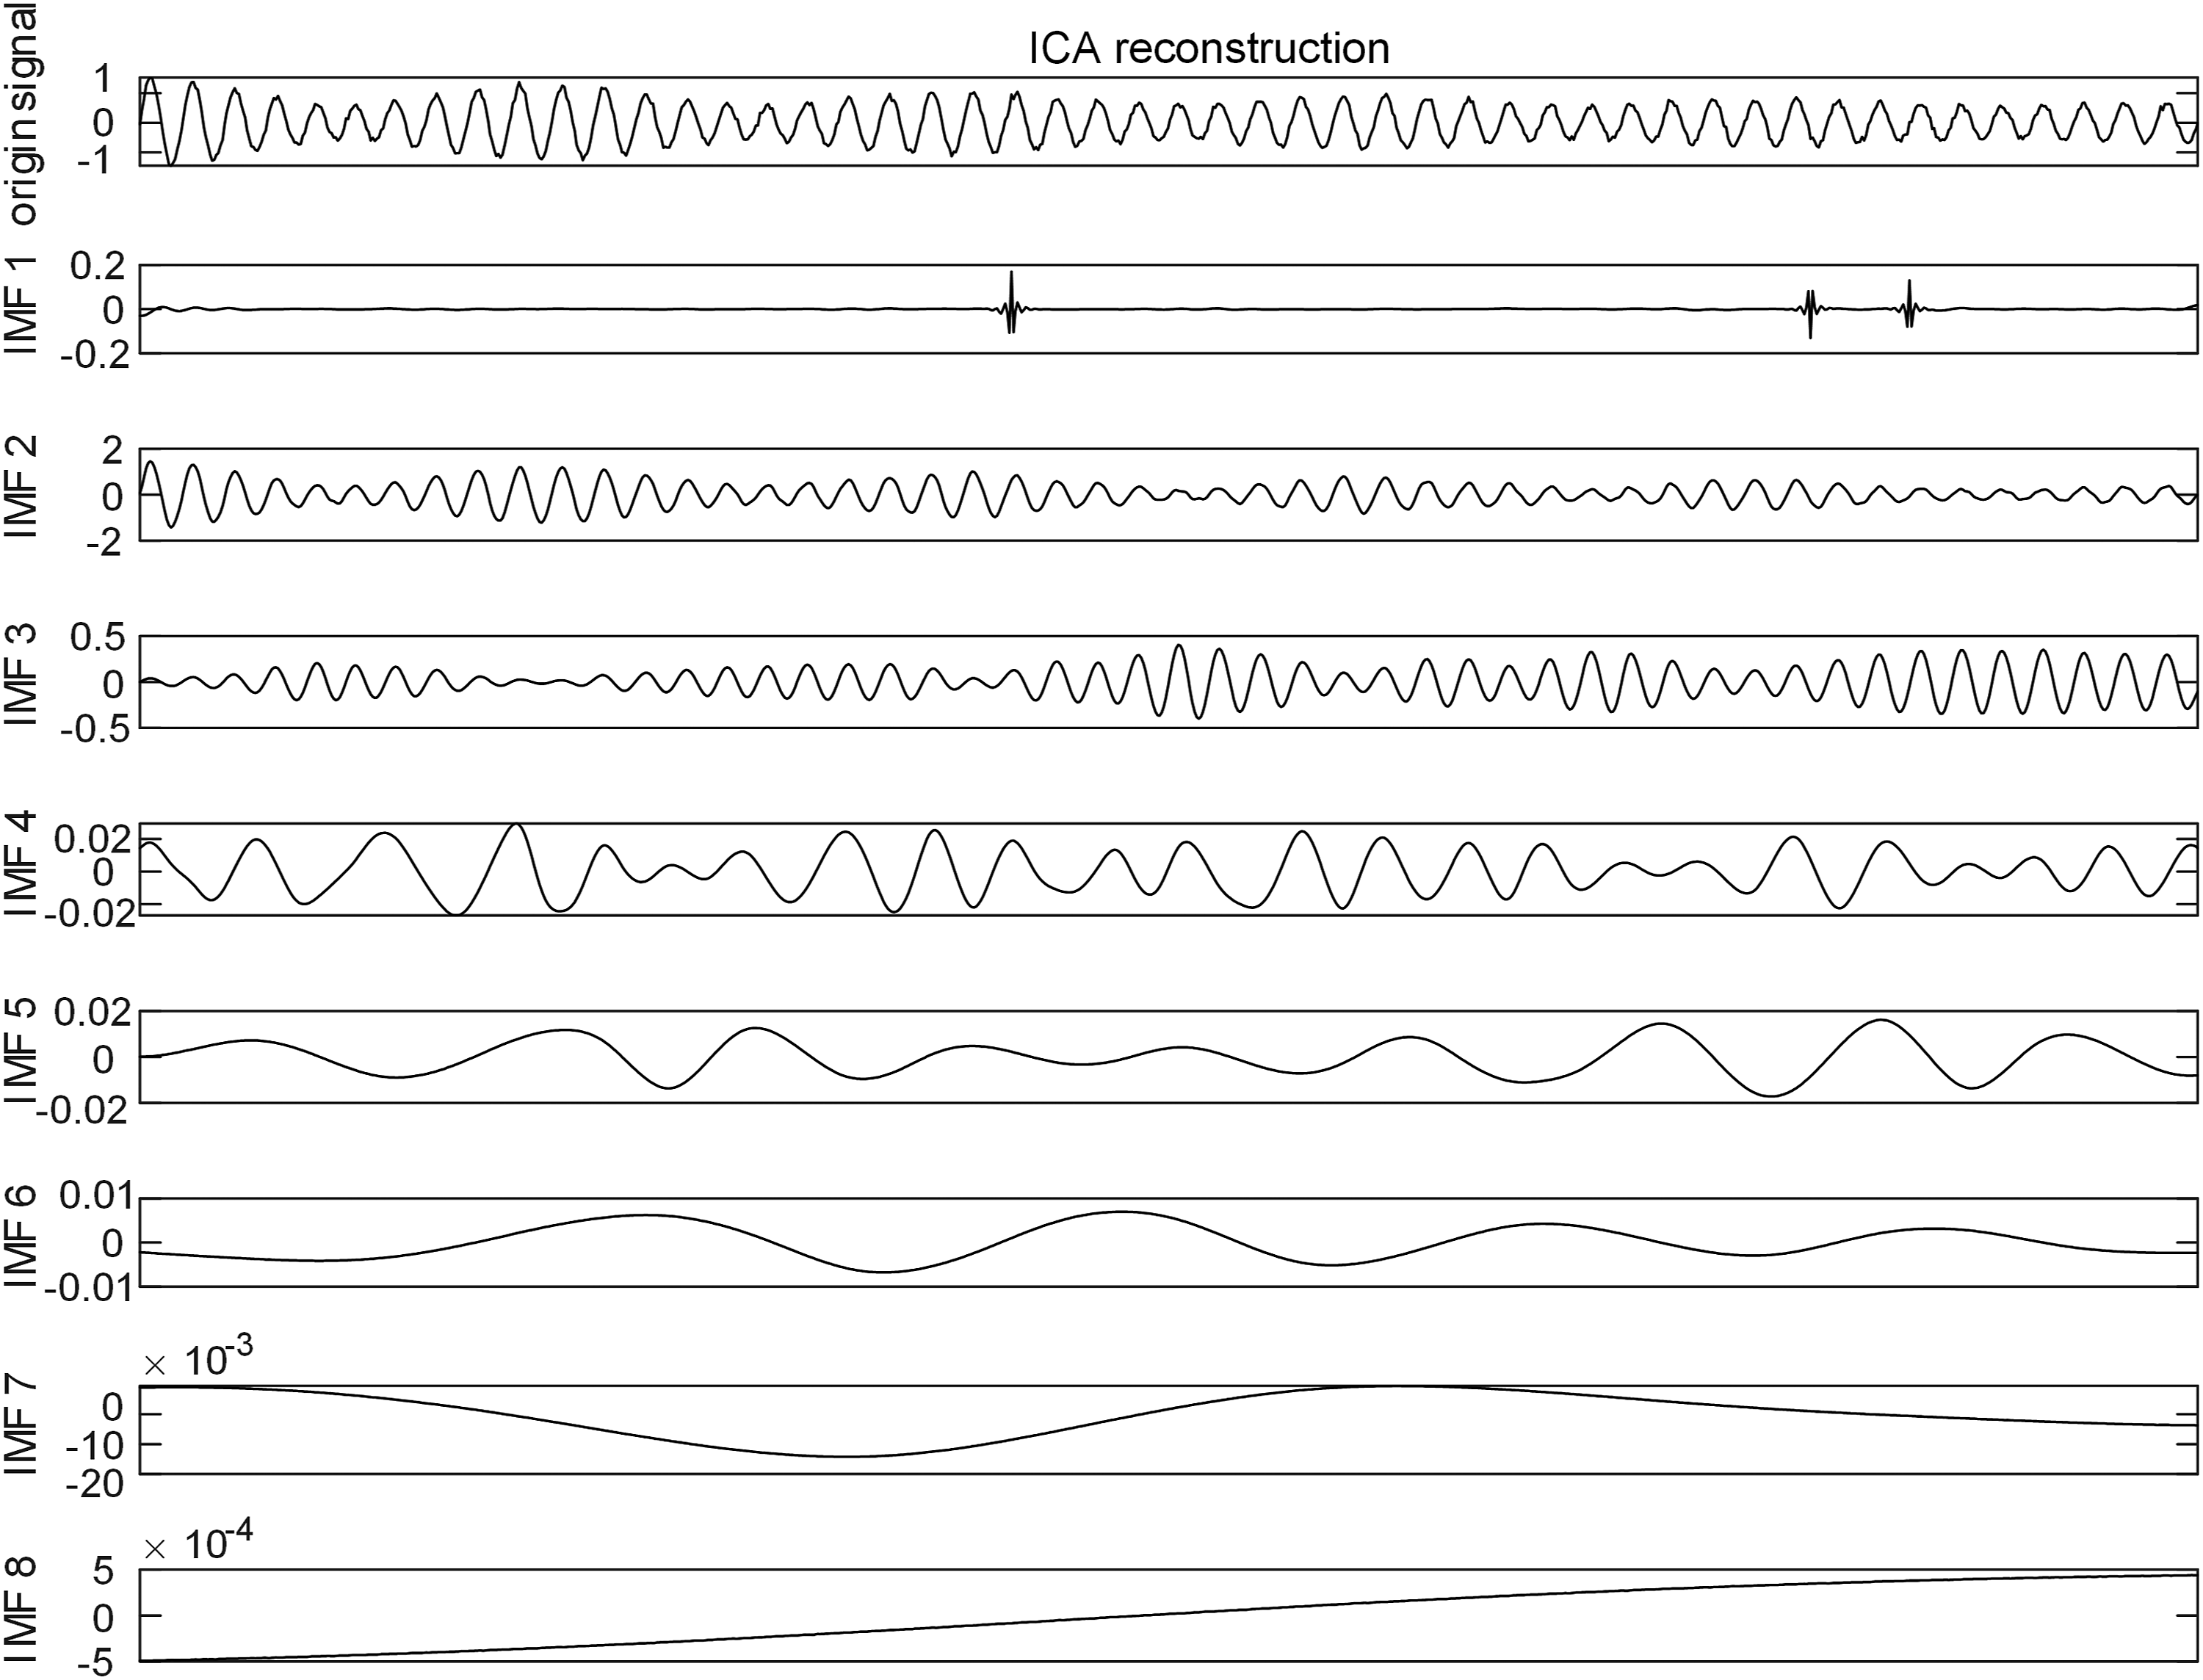
First, the noisy signal is decomposed by the ICEEMDAN method. Then, the obtained components are then used as a multi-sensor input to the robust ICA algorithm. The independent components obtained by the robust ICA analysis are shown in Figure 4. After this analysis, the obtained signal is still irregular because of its time dependence, and there is modal aliasing in the ICEEMDAN outcome, but the shape of the output signal is obviously different from that of the ICEEMDAN input signal. The independent components are thus denoised by wavelet thresholding with a discrete Meyer wavelet basis, a wavelet tree of three layers, and a heuristic threshold. The denoised signal is then mixed with the mixed matrix to reconstruct the updated IMFs, as shown in Figure 5. The SNR is 25.22 dB, the RMSE is 0.0322, and the correlation coefficient is 0.9995. The denoising performance index is higher than that of the methods described above. Independent component analysis components for the signal in (14). Independent component analysis components after denoising.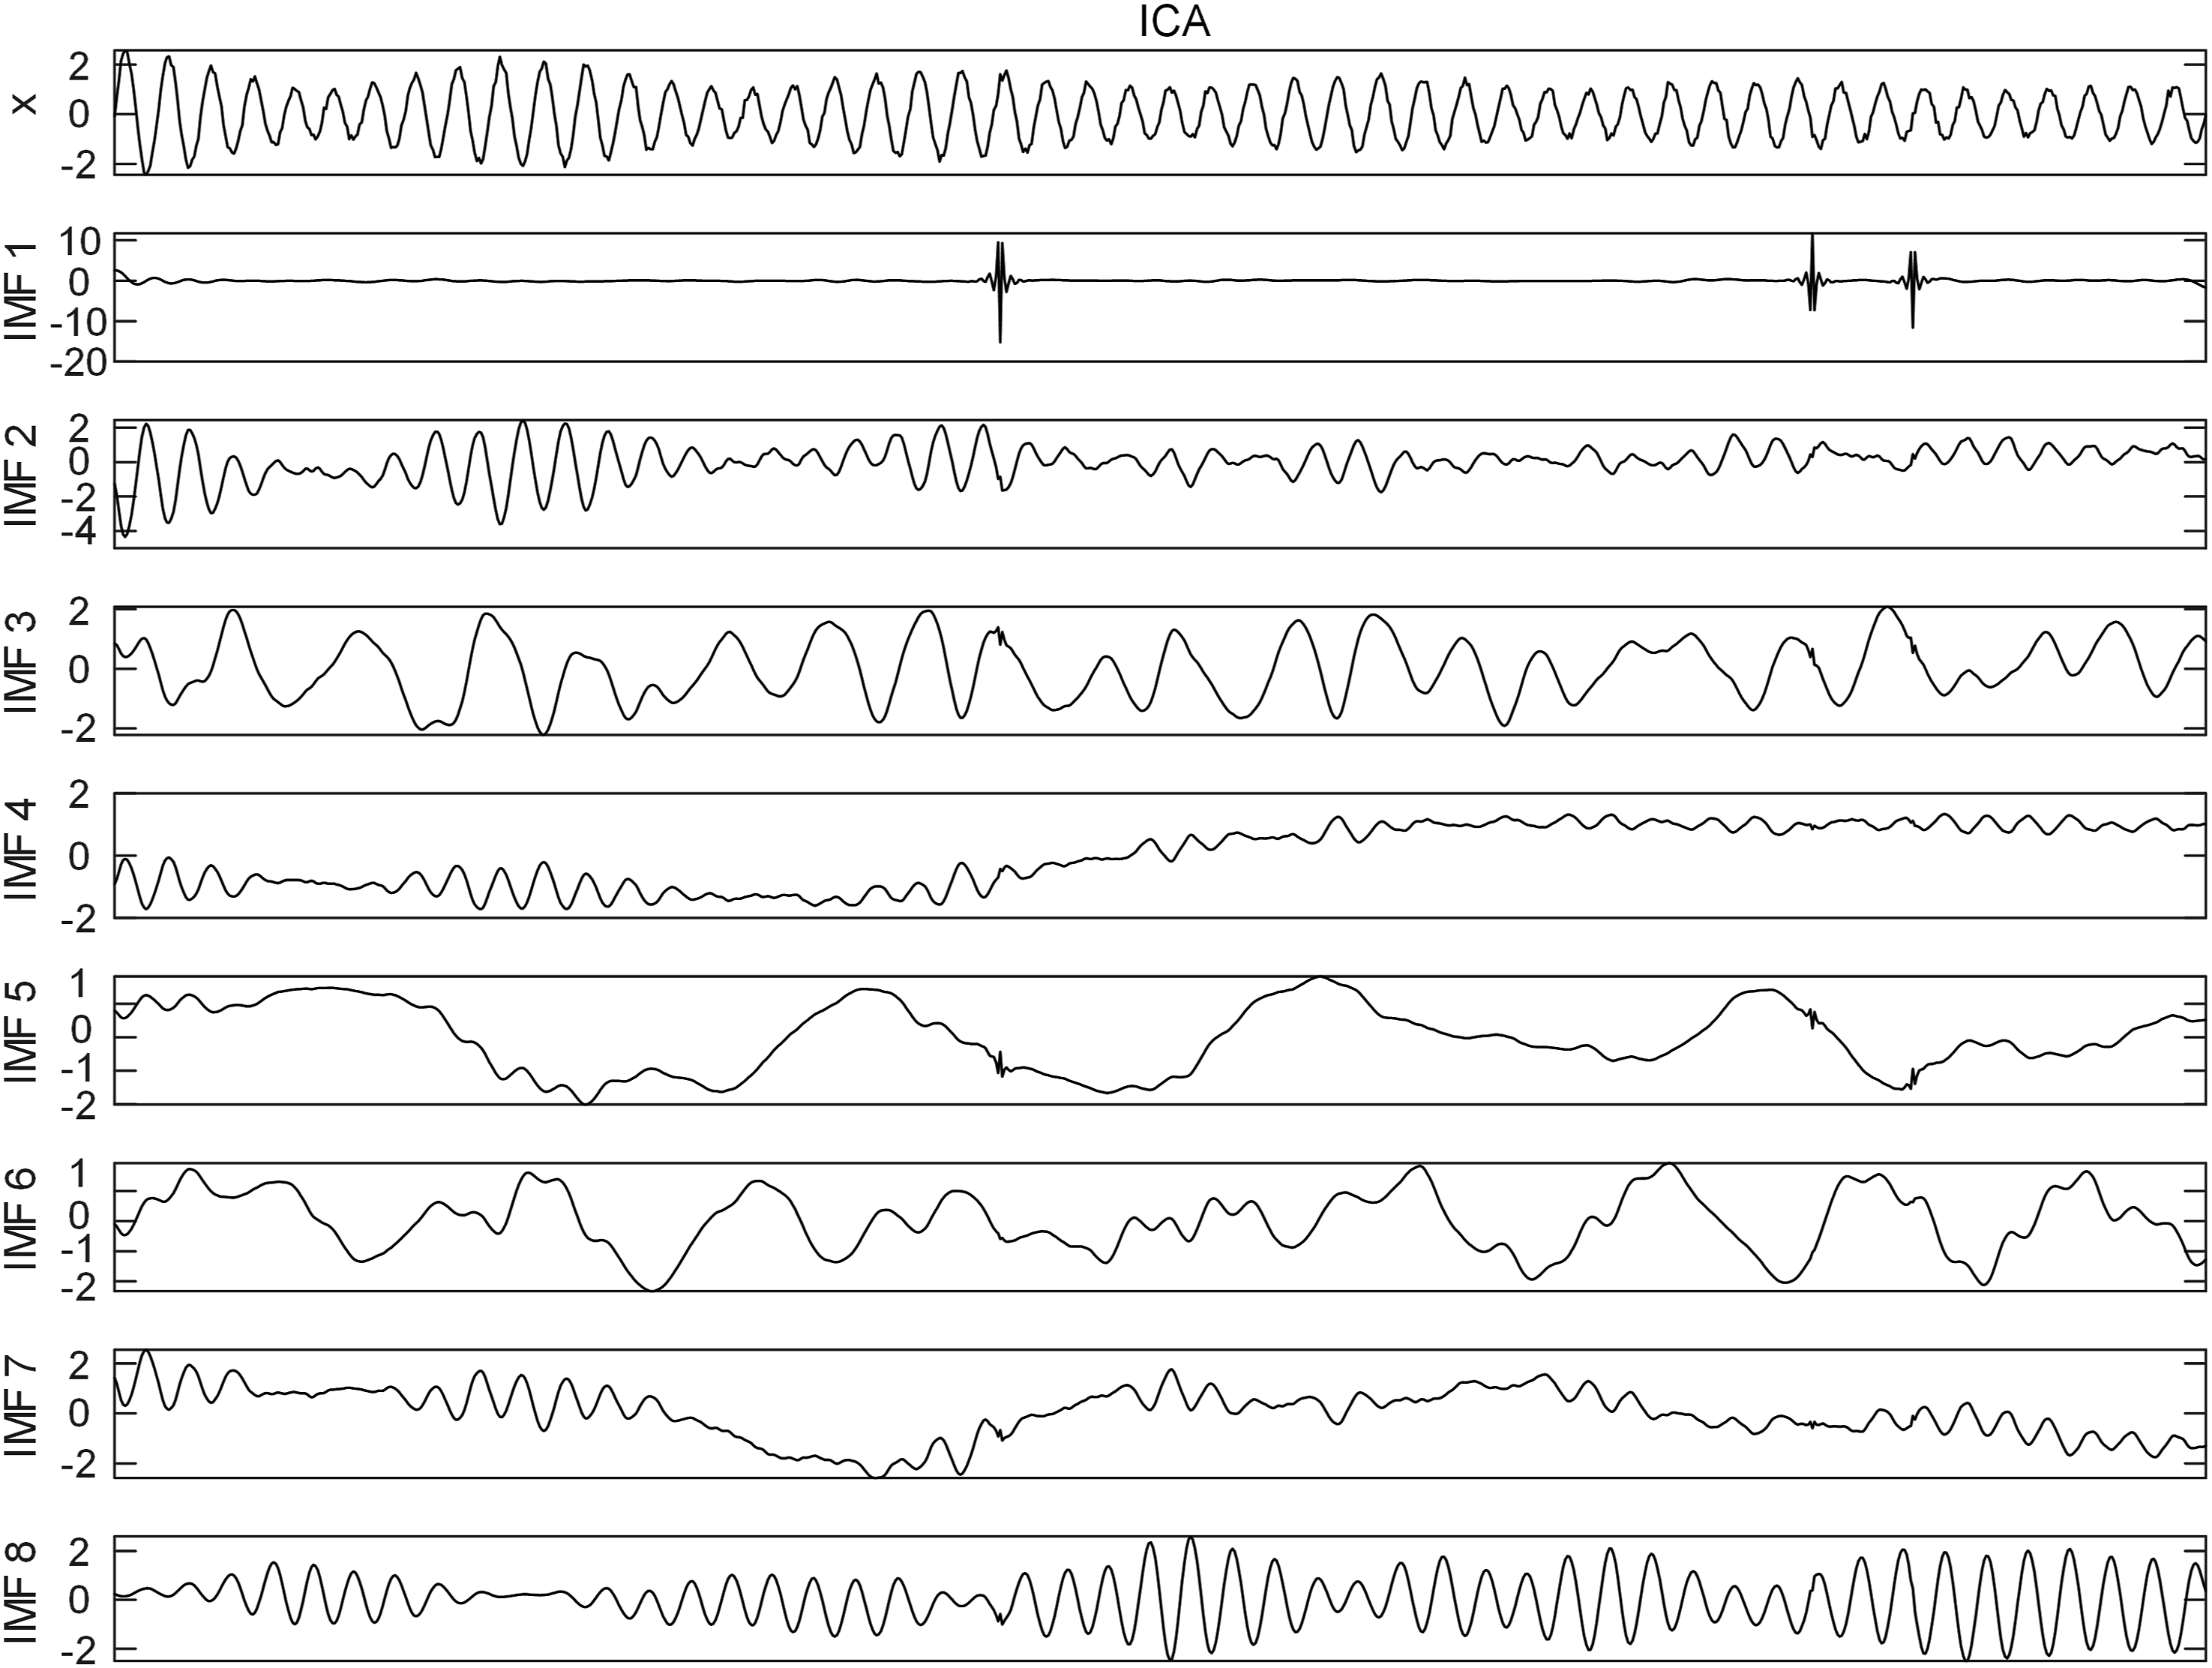
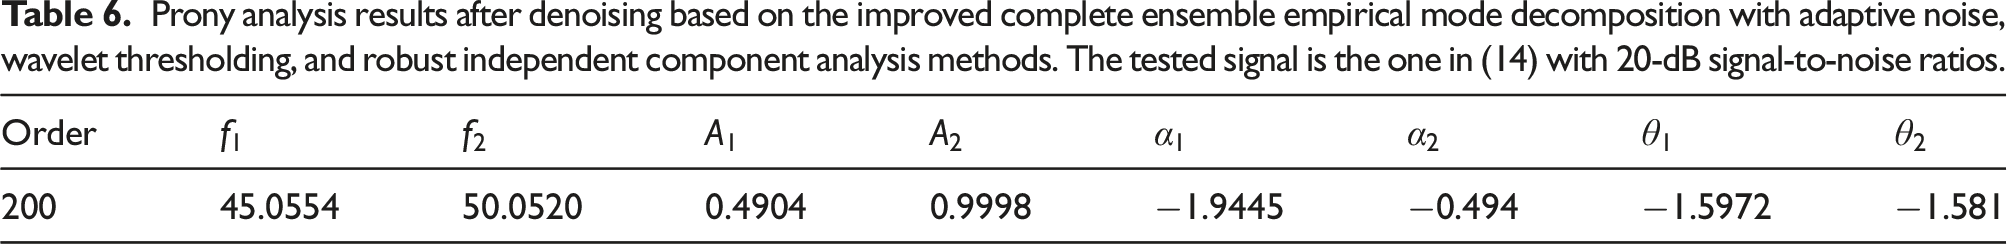
Prony analysis results after denoising based on the improved complete ensemble empirical mode decomposition with adaptive noise, wavelet thresholding, and robust independent component analysis methods. The tested signal is the one in (14) with 20-dB signal-to-noise ratios.
The signal is segmented into 300, 300, and 400 ms. Then, the signal is analyzed by the method of the fourth experiment. The ICEEMDAN outcome for the former 300 ms is divided into noise and signal components as shown in Figure 6. (a). Because the two frequency segments of the test signal are in the frequency-doubling adjacent ranges, the EMD method is generally not suitable, and the ICEEMDAN components can be identified by the robust ICA algorithm. As a result, as shown in Figure 6(b), the obtained independent components are subjected to wavelet threshold denoising, whose results are shown in Figure 6(c). The denoised signal is multiplied with the mixed matrix to obtain the updated IMFs components, which are then added to complete the signal reconstruction. The residual error of the reconstructed and original signals is shown in Figure 6(d). The horizontal axis in Figure 6 is the time and the vertical axis is the signal amplitude. The SNR is 26.67 dB, the RMSE is 0.0315, and the correlation coefficient is 0.999. Compared with the results of the previous methods, the denoising index is obviously improved. Joint algorithm results after segmentation.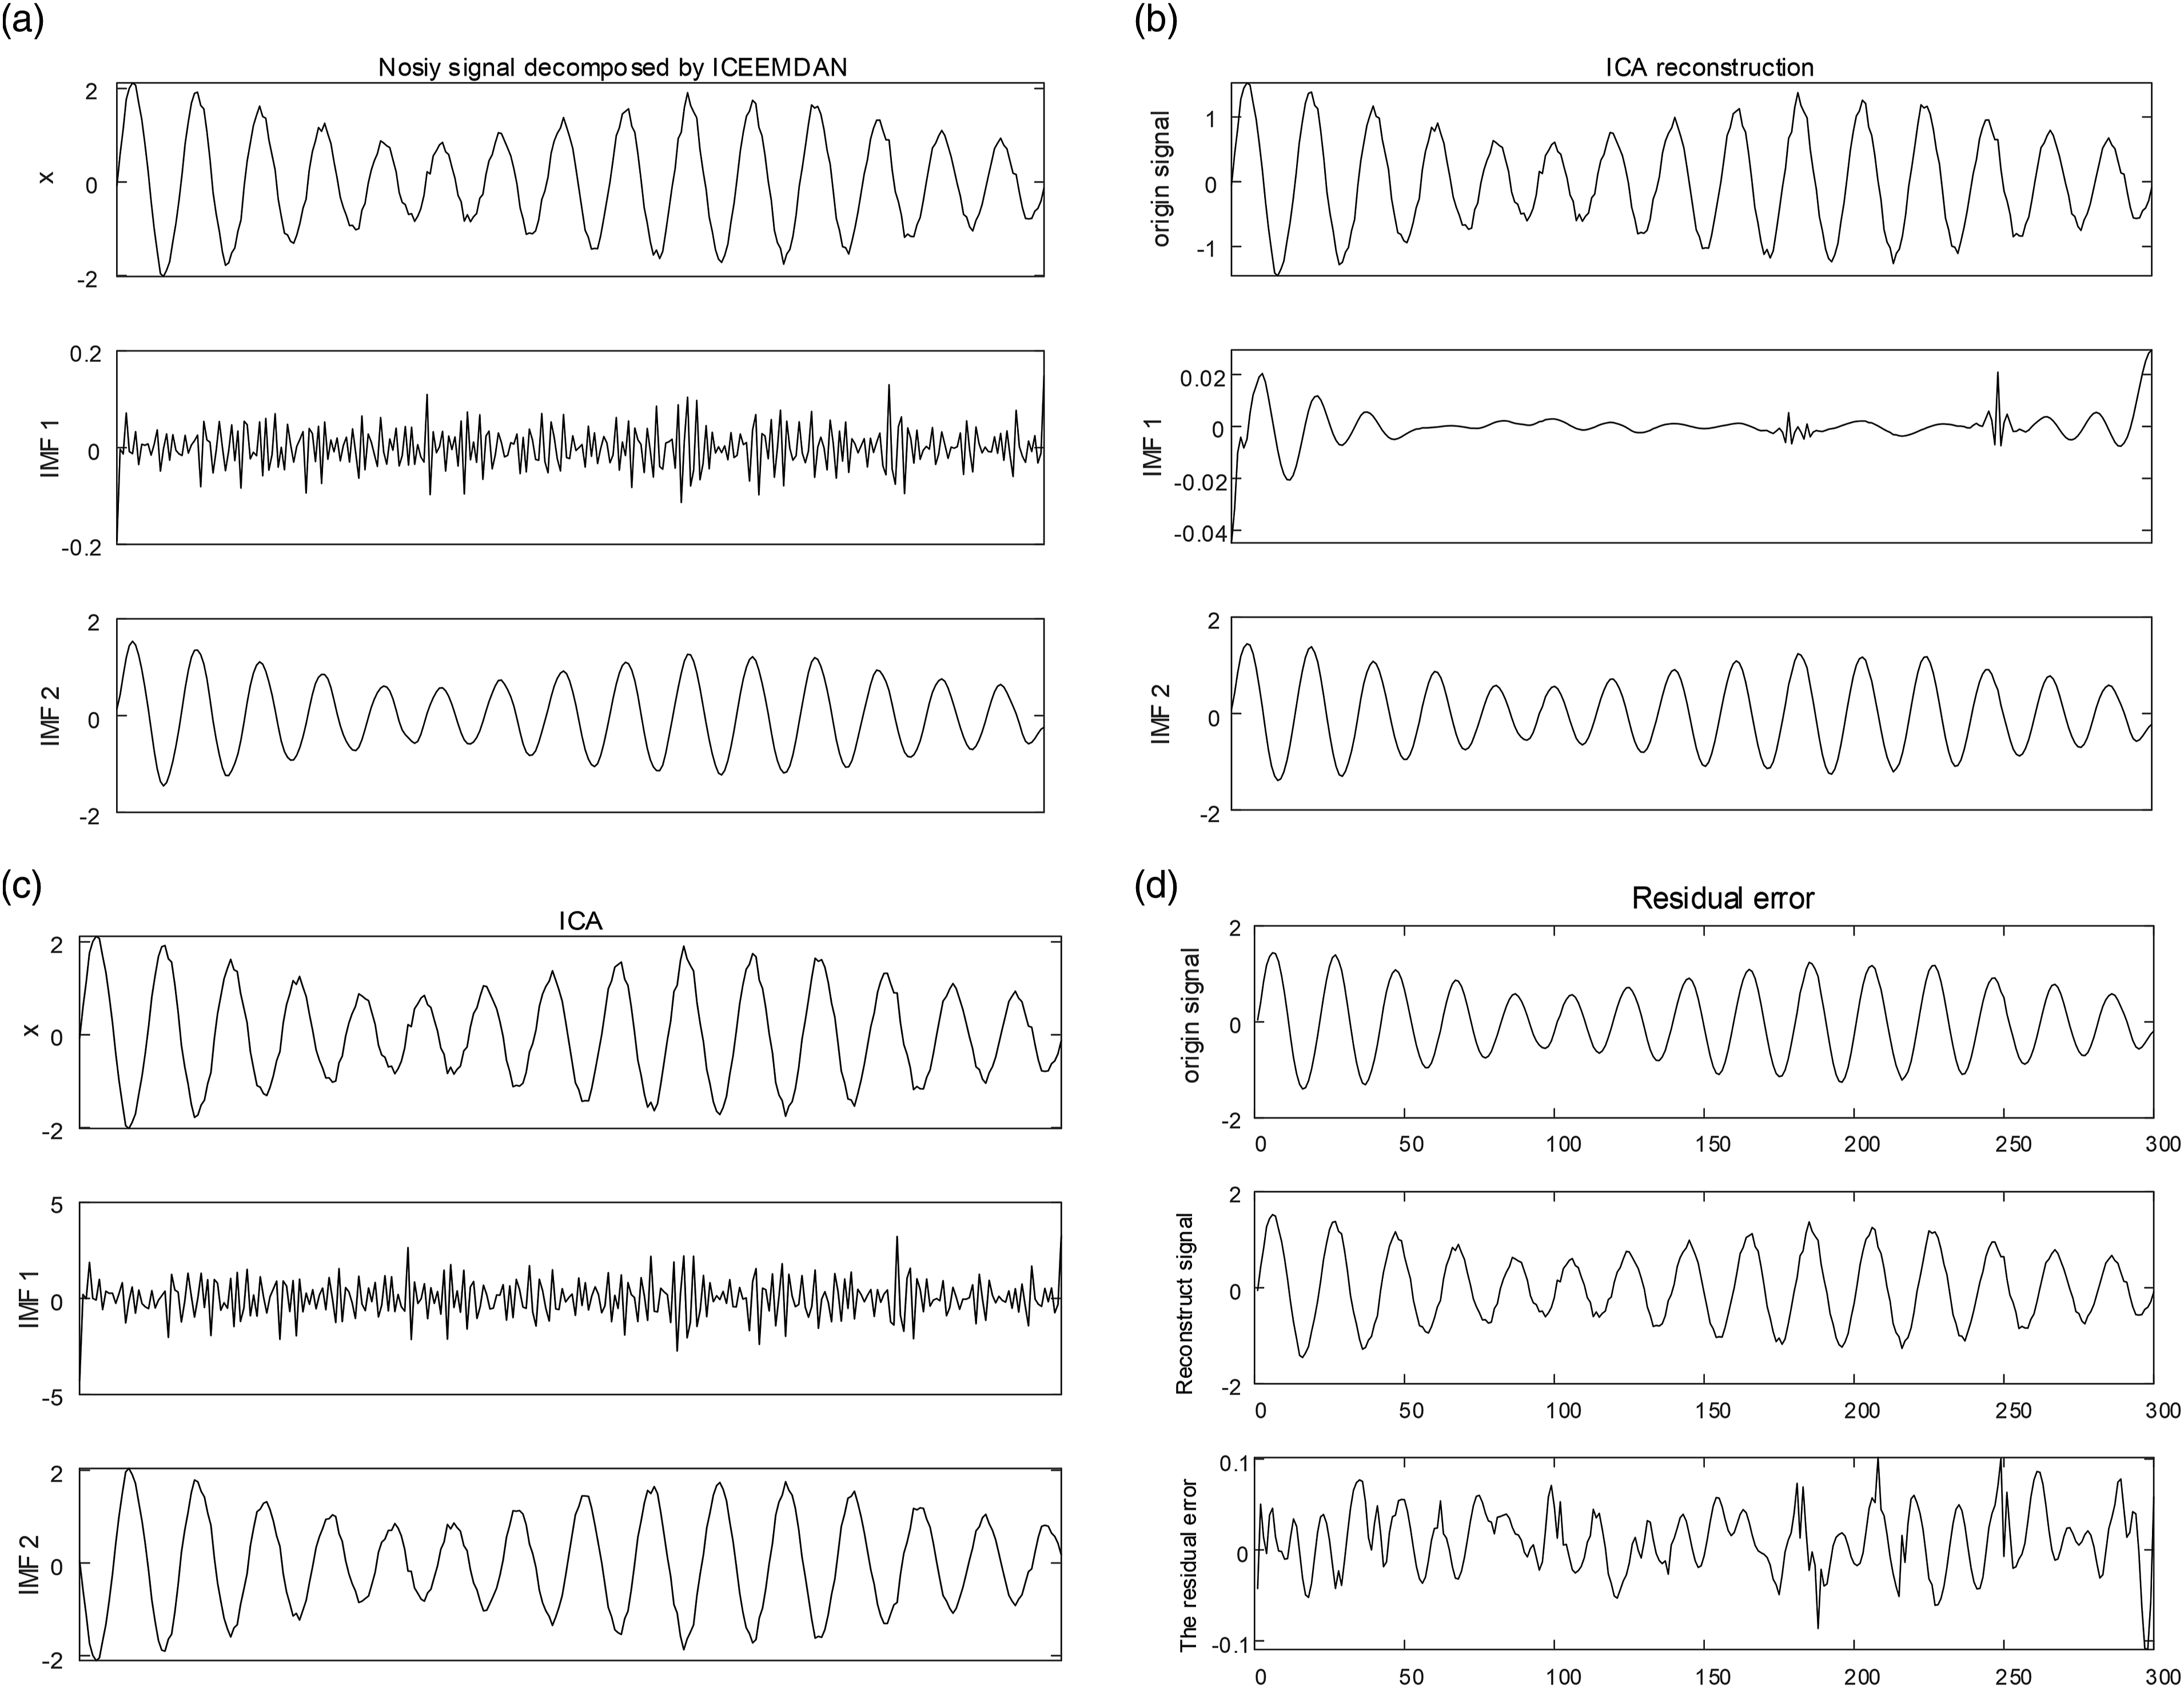
Prony analysis results after segmentation.

6. Analysis of real TVS
We investigate here the analysis of real TVS in a power plant. As shown in Figure 7, the intermediate shaft of an induced draft fan is broken after its setup with a frequency converter. Cracks in the intermediate shaft of an induced draft fan.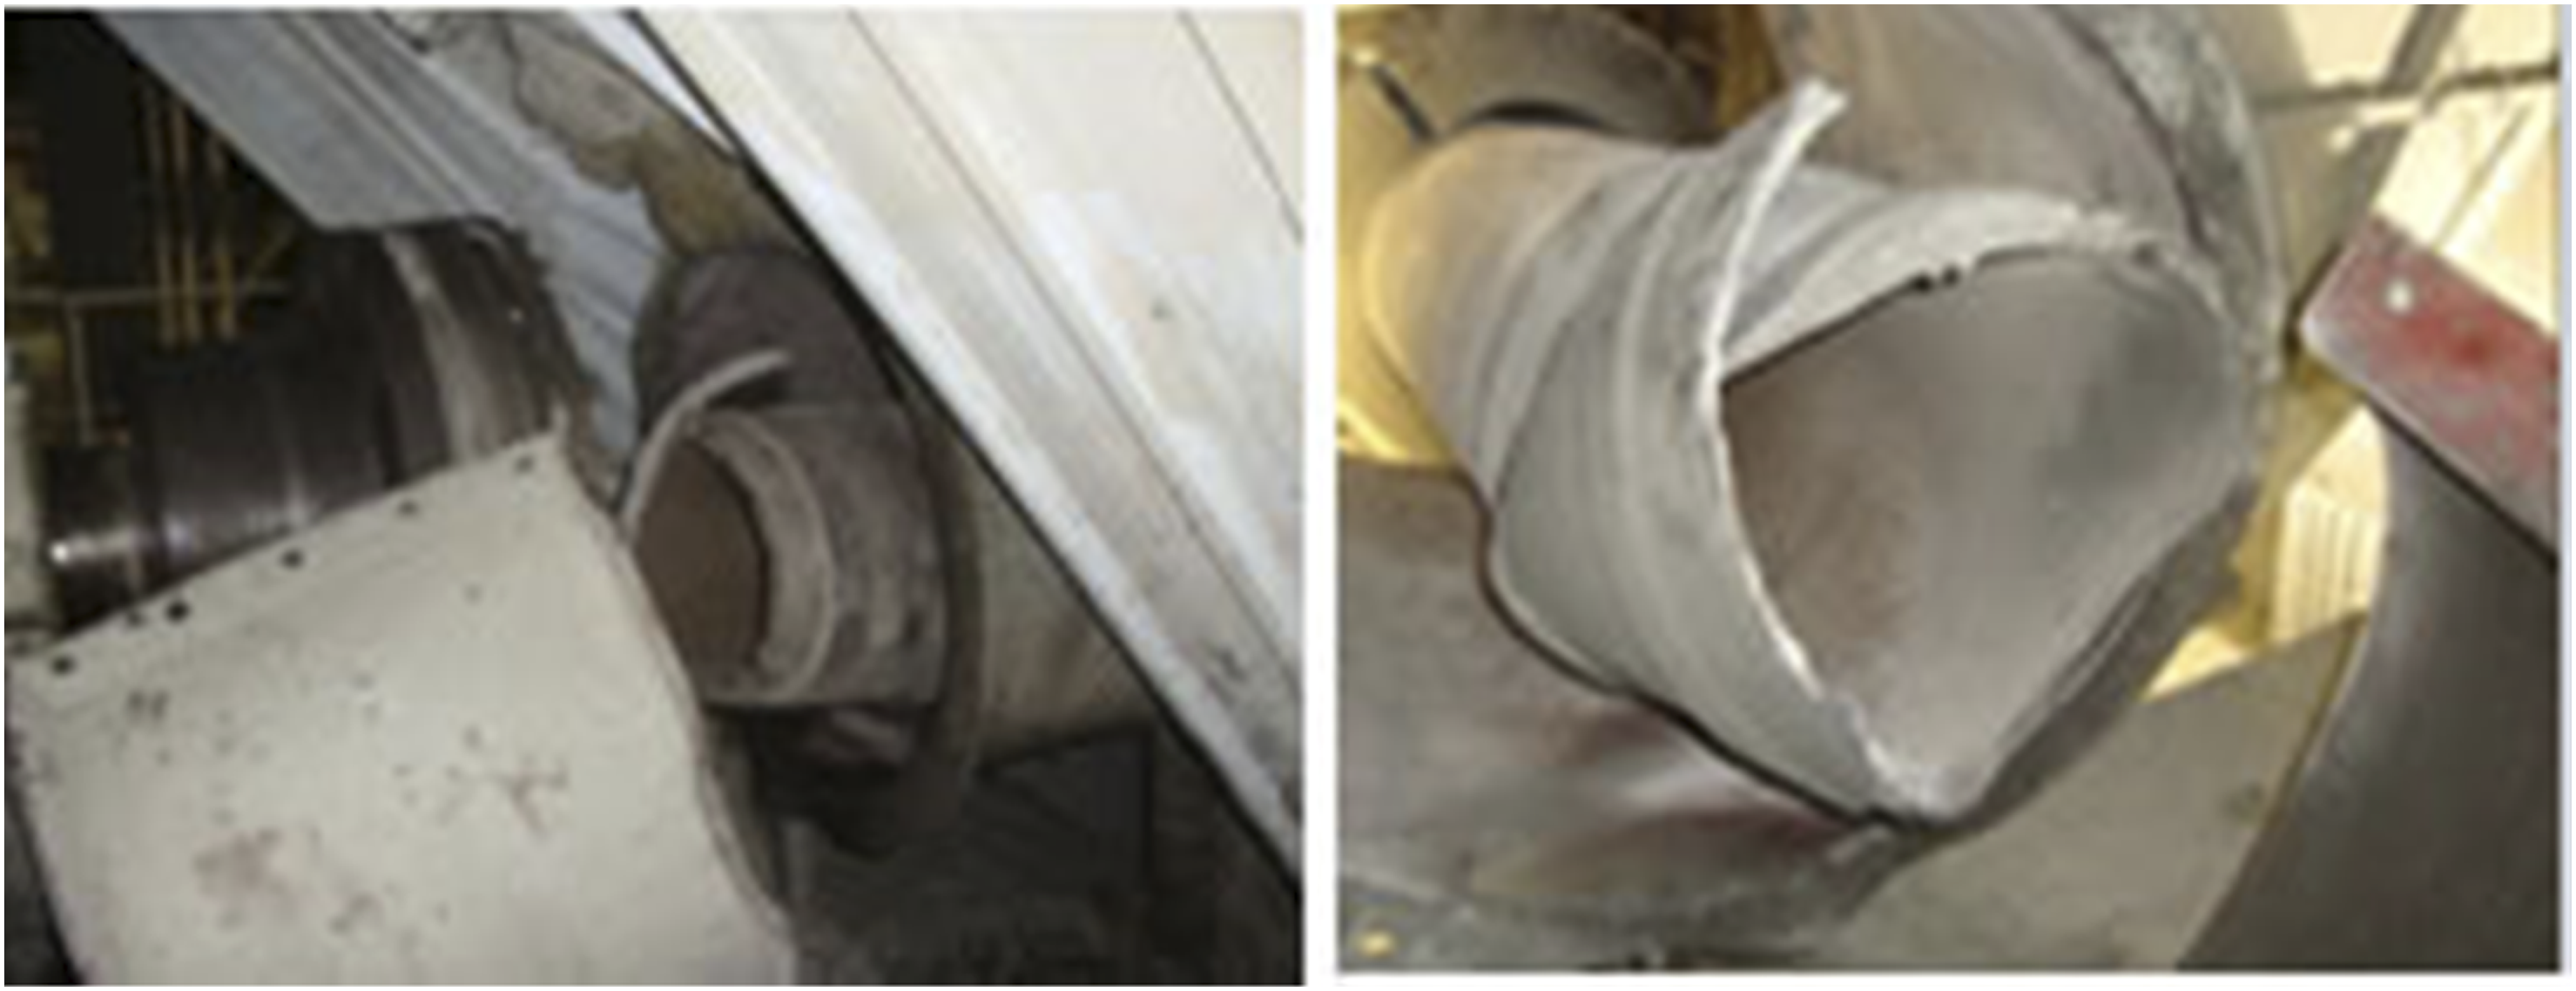
After the shaft is replaced or repaired, the frequency converter is put back into operation. When the operating frequency reaches 22 Hz, the system vibration is significantly enhanced. As shown in Figure 8, the torque signal is collected through a wireless torque sensor with a sampling rate of 2 kHz. Torque signal of the induced draft fan unit.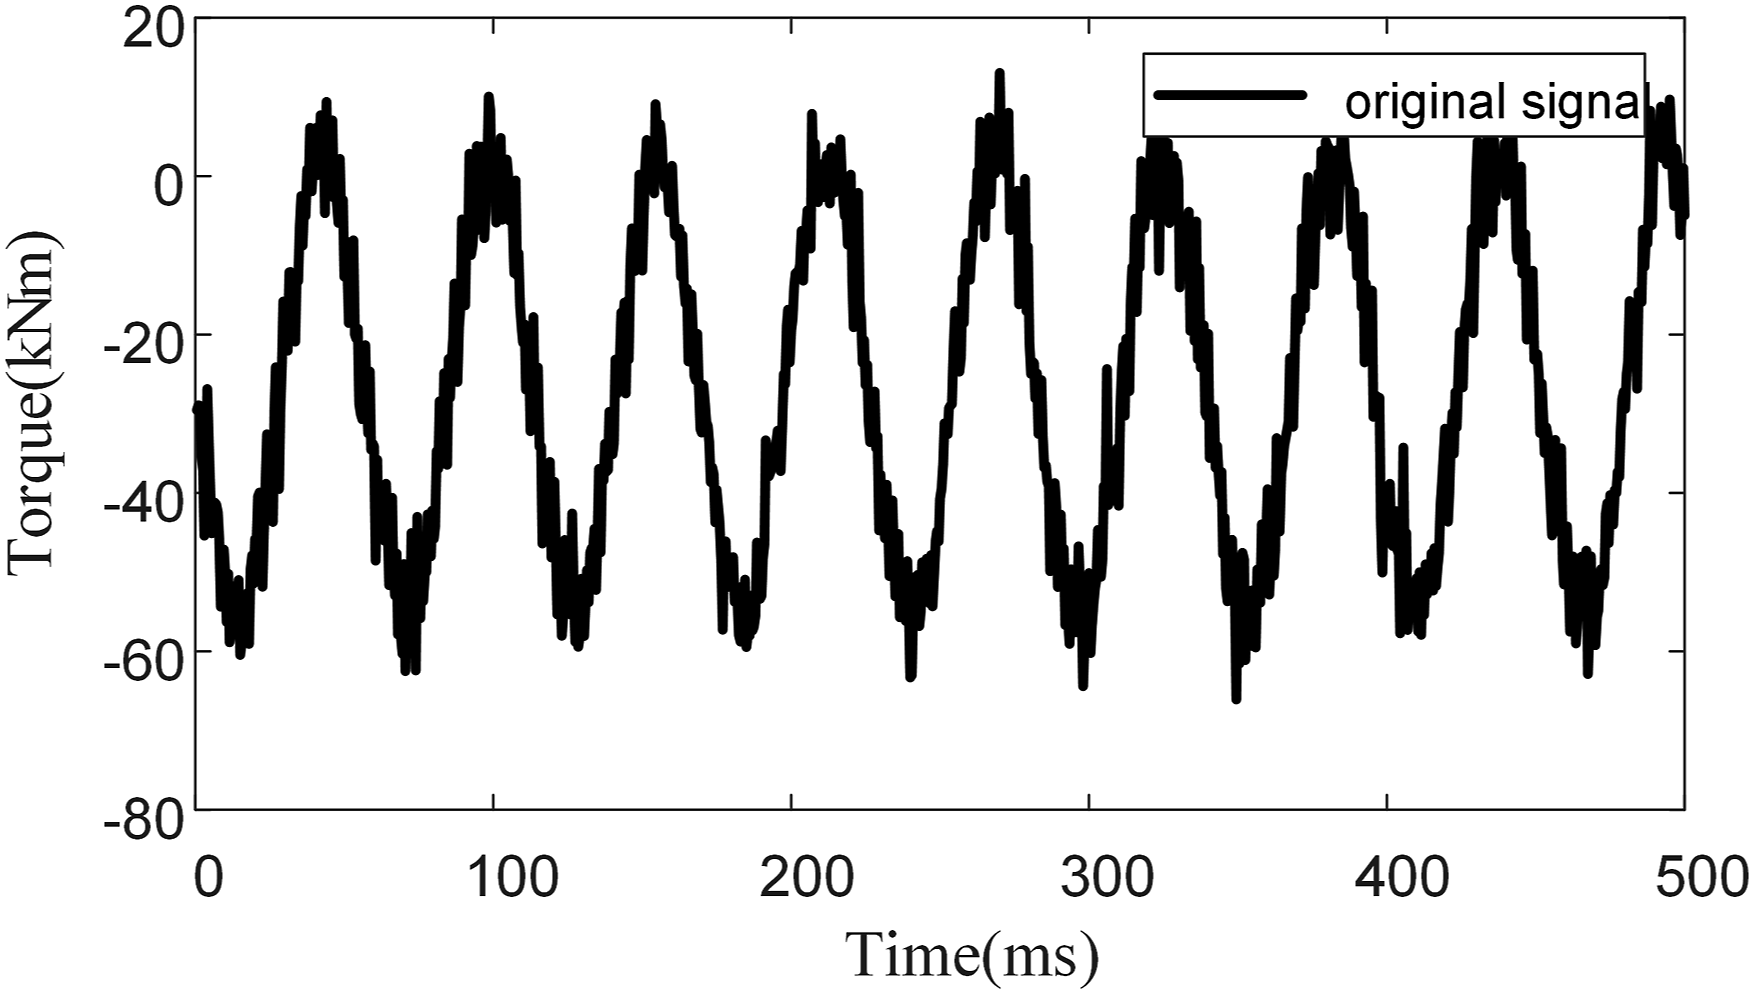
As shown in Figure 9, the signal with a sampling period of 0.5s is captured and denoised by the proposed joint algorithm of this article. This denoising algorithm takes about 12.7s; Fig. 9(a) shows the ICEEMDAN decomposition results, while Fig.9(b) shows the robust ICA analysis results. Fig.9(c) exhibits the results after wavelet denoising, while Fig.9(d) shows the robust ICA reconstruction results. De-noising of real torsional vibration signals with the proposed joint algorithm.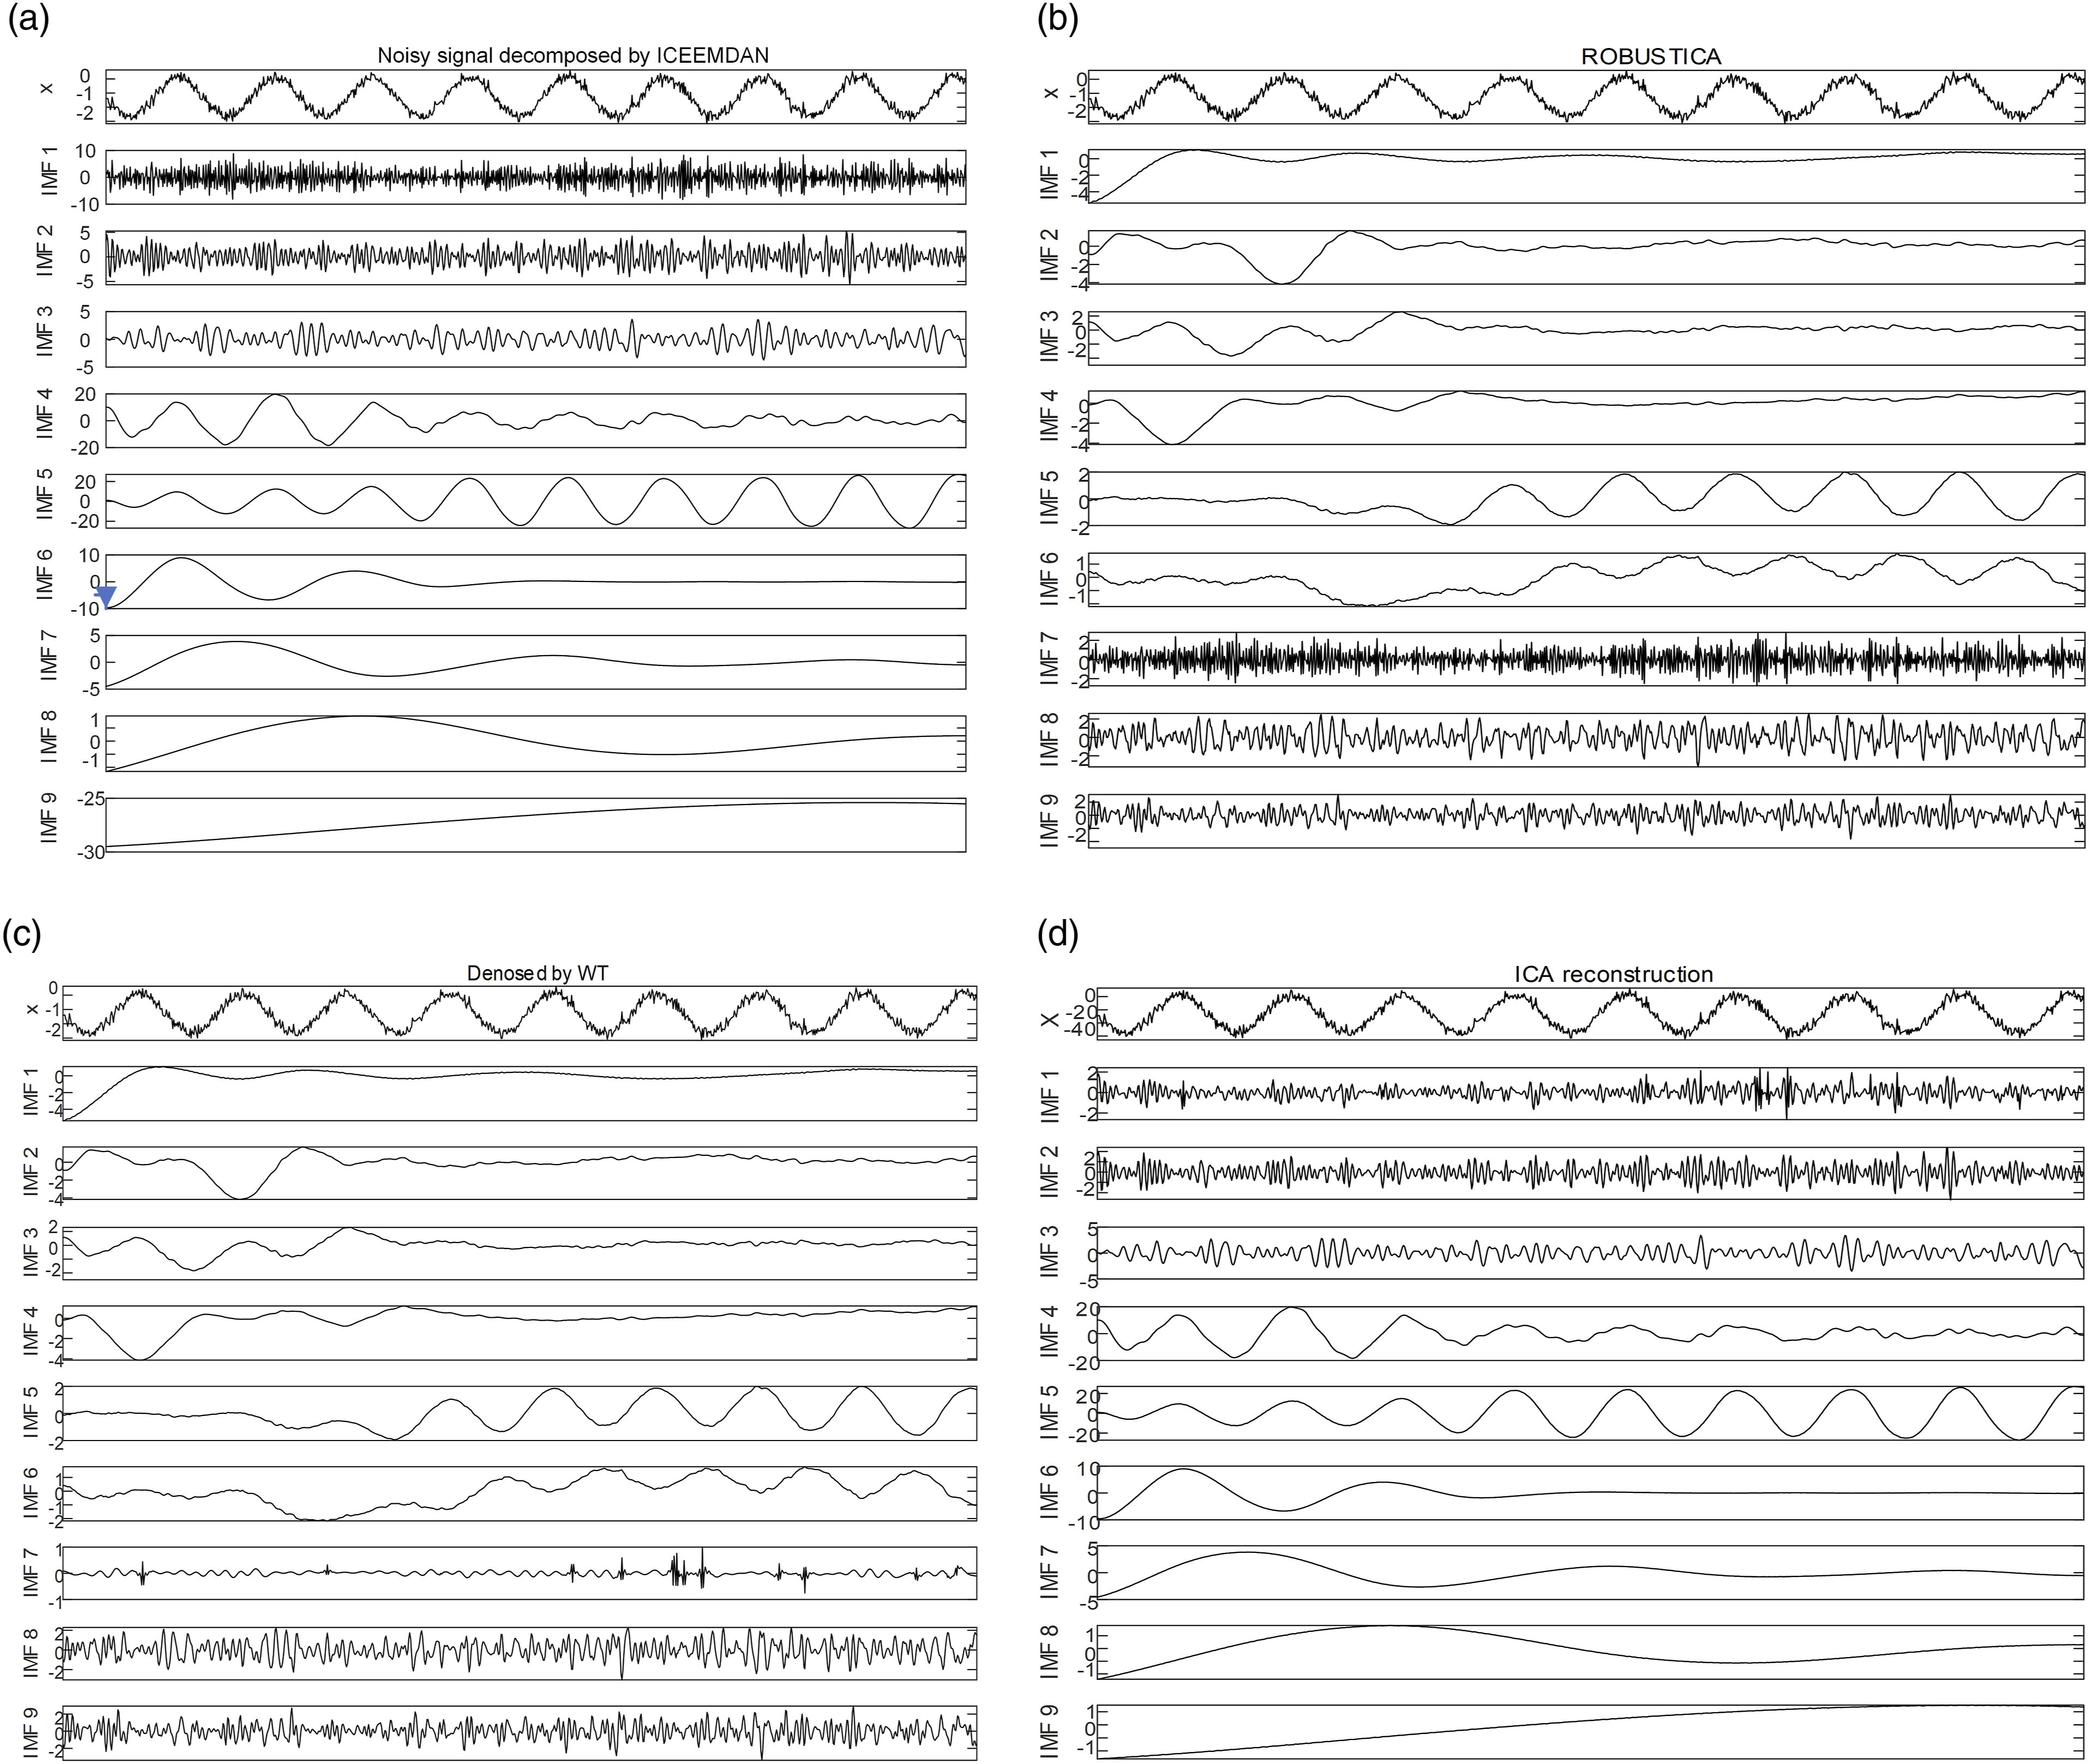
Prony analysis results.
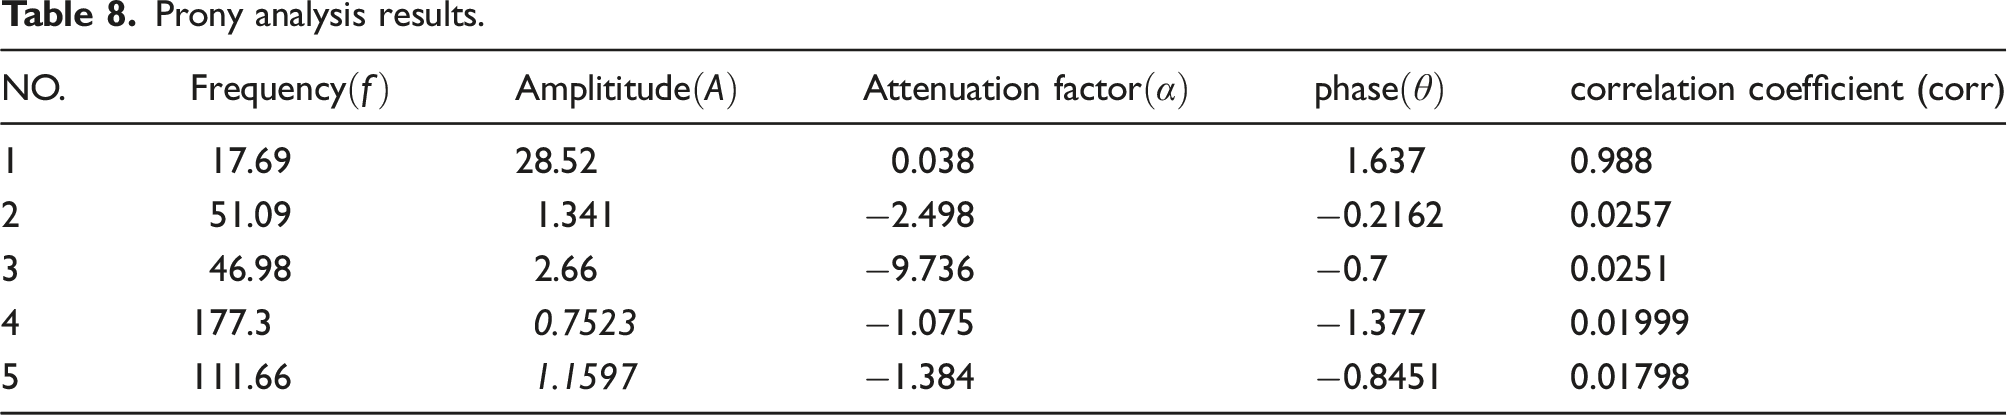
The inertia constant of the induced draft fan 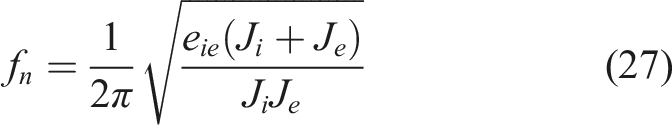
7. Summary
For a multimodal noisy non-stationary signal, the signal can be decomposed by ICEEMDAN, and then, the abnormal component can be judged by permutation entropy and the signal is reconstructed after removing the abnormal component. Thus, signal denoising can be realized. While SNR is improved, the RMSE will increase. Also, while the noise modal component is deleted by the EMD method, the noise modal component still contains the effective signal that has not been decomposed, and the wavelet threshold is used to denoise the signal. The selection of wavelet basis function has a large workload and SNR is improved, and at the same time, the RMSE will not increase significantly. The selection of wavelet function, the number of decomposition layers, and the selection of threshold have influence on the denoising effect. The signal is first decomposed by ICEEMDAN and then denoised by wavelet threshold for each modal component. The method can improve the SNR and the RMSE does not increase significantly. But compared with wavelet threshold denoising, this method has no significant advantage. The decomposed signal is decomposed first by ICEEMDAN, the independent components are analyzed by robust ICA method, and the wavelet threshold denoising is carried out on the obtained independent components. Under the same wavelet conditions, decomposition layer number and threshold selection method, this method provides the possibility of further improving the SNR. The SNR improvement effect is related to the signal itself and the signal interception length. After the signal is segmented and then analyzed by the above methods, it is possible to further improve the SNR. The Prony analysis of the denoised signal can reduce the order of Prony analysis and obtain more accurate results.
We try to use this combined method to analyze the torsional vibration of shafting and the subsynchronous oscillation harmonics of power system. We get more accurate resonant frequency and related parameters. This combined method is suitable for analyzing signals with low SNR and complex inter-harmonics. In our experiments, we found that the segmentation of time-varying signals can get better results, but with the change of signals, we will make further efforts to study how to segment more reasonably.
Footnotes
Acknowledgments
This research was supported by Department of Electrical Engineering, College of Engineering, Nanjing Agricultural University, Nanjing, China, SCHOOL of Electrical Engineering, Southeast University, Nanjing, China, School of Automation, Nanjing Institute of Technology, Nanjing, China.
Declaration of conflicting interests
The author(s) declared no potential conflicts of interest with respect to the research, authorship, and/or publication of this article.
Funding
The author(s) received no financial support for the research, authorship, and/or publication of this article.
Data Availability Statement
The data used to support the findings of this study are available from the corresponding author upon request.