
Abstract
The original partial coherence analysis method can be used to analyze the contributions between different noise sources and field points under steady-state conditions. Nevertheless, coherence analysis cannot be used to deal with unsteady-state signals because the signals are time-varying. In this paper, the method of panel contribution under unsteady-state conditions based on wavelet coherence analysis is proposed to determine the largest noise contribution in the cab. First, the unsteady-state simulation signals are analyzed by wavelet coherence theory. This step not only verifies the effectiveness but also points out that wavelet coherence is more superior to crossed wavelet. Second, the measured unsteady-state signals of the eight measuring points are processed by time-frequency wavelet coherent analysis. According to the obtained two-dimensional time-frequency diagrams, the contribution of different panels to the noise of measuring field points in the continuous frequency range can be found out. Then, the total contribution coefficient sum of each panel in a certain frequency band is calculated. Finally, the above analysis results are used to determine the panels with the largest contribution to the cab noise. The corresponding noise reduction scheme is also proposed. The results show that the overall sound pressure level is obviously decreased after optimization. The noise in the cab is reduced by 4.5dBA ∼ 7dBA. The effectiveness of this method has been further verified by the above results.
Keywords
1. Introduction
For the rapid development of the automotive industry and increased market maturity, consumers pay more attention to ride comfort. The noise in the vehicle is one of the main factors affecting driving comfort (Pang et al., 2006). Low-frequency noises in the vehicle come from the vibration of the panel caused by various excitation sources (Brown, 1998). Therefore, it is necessary to find main noise contribution of sheet metal.
Partial coherence analysis is an effective method used to analyze the correlation of steady-state noise. This method can remove the mutual influence between the coupled panels. It can also identify and locate the noise source. Furthermore, it sorted and analyzed the contributions of different noise sources and different field points (Bendat, 1976; Trethewey and Koss, 2004; Wu et al., 2008, 2012; Zhao and Wang, 2005). However, most of the signals collected in engineering tests are unsteady-state signals. Their characteristics change with time. Therefore, the original partial coherent analysis method is not applicable to the unsteady-state signals signals’ analysis. The unsteady-state signal can be processed by wavelet transform. But it cannot explore the relevant relationship between two signals (Mallat, 1998). Therefore, some researchers had proposed a wavelet coherence method to analyze the correlation of unsteady-state signals. This method was first applied to meteorological, hydrology (Torrence and Webster, 1999; Zhang et al., 2016), and EEG research (Banerjee and Mitra, 2014; Rowley et al., 2007). With the continuous development of wavelet coherence algorithms, it had gradually been applied to engineering research. The magnitude and phase relationship of the coherence function between different unsteady-state noise signals were obtained (Jia et al., 2008) from the time and frequency domain. But it failed to further explain the phase relationship between the two signals. Some scholars (Wang et al., 2015) had simulated two unsteady-state signals based on coherent wavelet transform. The effectiveness in solving the phase difference between signals was verified. Some researchers (Huang et al., 2018) used this method to identify the noise source of the car in unsteady-state driving process. The noise inside the car was effectively improved by optimizing the suspension components. However, the detailed partial coherence coefficient and phase diagram had not been obtained either. The above-mentioned research on the unsteady-state signal was to solve the problem of noise in the car from the perspective of the noise source. But these studies rarely focused on the perspective of sheet metal contribution. As the cab was a closed space, the vibration of the cab panel will directly affect the noise in the cab (Mohanty et al., 2000). In addition, the vibration of the panel at different positions had different effects on the noise inside the car, which were the contribution of the panel (Liu et al., 2011; Yang et al., 2016). Therefore, wavelet coherence was introduced into the analysis of panel contribution. Then, the phase relationship between different unsteady-state signals and the contribution of different panels to noise can be solved.
Aiming at the noise proble in the cab of a certain heavy truck, this paper proposes the methods of panel contribution based on wavelet coherence analysis to research the contribution of the cab panel. First, the unsteady-state signals collected by one heavy truck are processed by wavelet coherence analysis. Second, the wavelet time-frequency coherence diagrams between two unsteady-state signals is obtained. From this foundation, the unsteady-state signals are analyzed. The relevant relationship between the panel vibration signals and the noise signals in the cab in the continuous frequency range is found. Furthermore, the concept of “total contribution coefficient sum” is introduced in this paper. It can calculate the total contribution coefficient sum of each panel to the whole system in a certain frequency band. Finally, the above analysis results are integrated to find the panels which have the largest contribution. Also, a reasonable noise reduction scheme is proposed. The results not only verify that is suitable for the correlation analysis of unsteady-state noise signals but also effectively improve the acoustic environment of the heavy-duty truck cab. It provides a certain reference for solving the problem of unsteady-state signals’ coherent analysis in engineering applications.
2. Wavelet coherence analysis theory
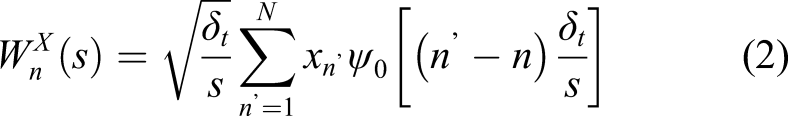
In this paper, when processing the unsteady signals the appropriate wavelet basis function should be selected first. In engineering applications, the amplitude wavelet Morlet wavelet is regularly selected to obtain the amplitude and phase information. The Morlet wavelet function is defined in the time and frequency domain as

The center frequency
For the signal
The two unsteady-state signals are processed by wavelet coherence analysis to study the relevant relationship in the time-frequency domain. This method can be used to calculate the correlation magnitude and phase relationship between two signals. The wavelet coherence analysis method is formed by combining wavelet transform and coherent analysis. It mainly includes two methods: cross wavelet transform and wavelet coherence. How to use these two methods for coherent analysis of unsteady signals will be discussed next.
2.1. Cross wavelet transform
Wavelet transform can be used to explore the inherent laws of unsteady-state signals. But it cannot distinguish the correlation between two unsteady-state signals in the time-frequency domain. The cross wavelet transform not only combines with the advantages of the wavelet transform but also targets the common high-energy region existing between two unsteady-state signals. Therefore, the amplitude and phase relationship between the two signals can be solved simultaneously in the time and frequency domain. The effect is remarkable.
According to formula (2), let

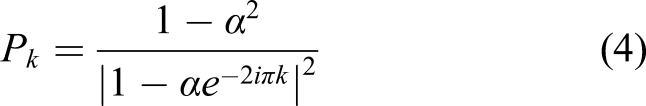
Cross wavelet transform is formed by combining the wavelet transform of formula (2) and cross spectrum analysis. Therefore, it is necessary to perform a certain level of significance test to ensure that the calculation results are accurate and reliable of the cross wavelet power spectrum. This is generally tested by comparing the cross wavelet power spectrum of the two signals with the red noise spectrum. The function of red noise is
2.2. Wavelet coherence analysis
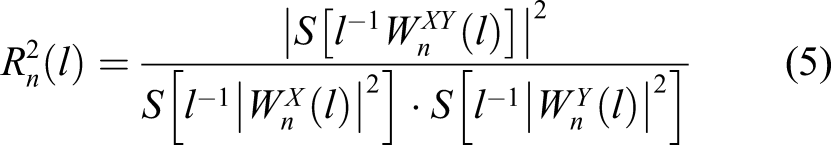
The research object of this paper is the cab of a heavy truck. However, in the actual driving process of the vehicle, most of the collected signals are unsteady-state signals. When two unsteady-state signals have a common high-energy part, the cross wavelet analysis method in the section 2.1 is frequently used to analyze the correlation between two signals. The effect of analysis is remarkable. But there are shortcomings in revealing the correlation between the two unsteady-state signals in the common low-energy region. Nevertheless, the wavelet coherent method can make up for the shortcomings of crossed wavelets. When processing the high common energy region of two unsteady-state signals, it can also consider low common energy regions. It can obtain the amplitude relationship and phase relationship of two unsteady-state signals in the time-frequency domain. Therefore, wavelet coherence can be used to describe the local correlation between two unsteady-state signals. According to formula (3), the wavelet coherent spectra of two unsteady-state signals
The basis of wavelet coherence analysis is the wavelet transform of formula (2). Therefore, it must be tested under a certain level of confidence after calculating the wavelet coherence spectrum. The commonly used test method is the Monte Carlo method (Zhang et al., 2007).
3. Total contribution coefficient sum
After the road test of the heavy truck, a suitable model is needed to calculate the collected data. When using the multiple-input single-output model for calculation, multiple-input signals should be sorted according to the certain rules (Hu et al., 2012). After replacing the original input signals with the sorted input signals, the multiple-input single-output system becomes a multiple-input single-output system. The specific process is shown in Figure 1. Multiple-input single-output model.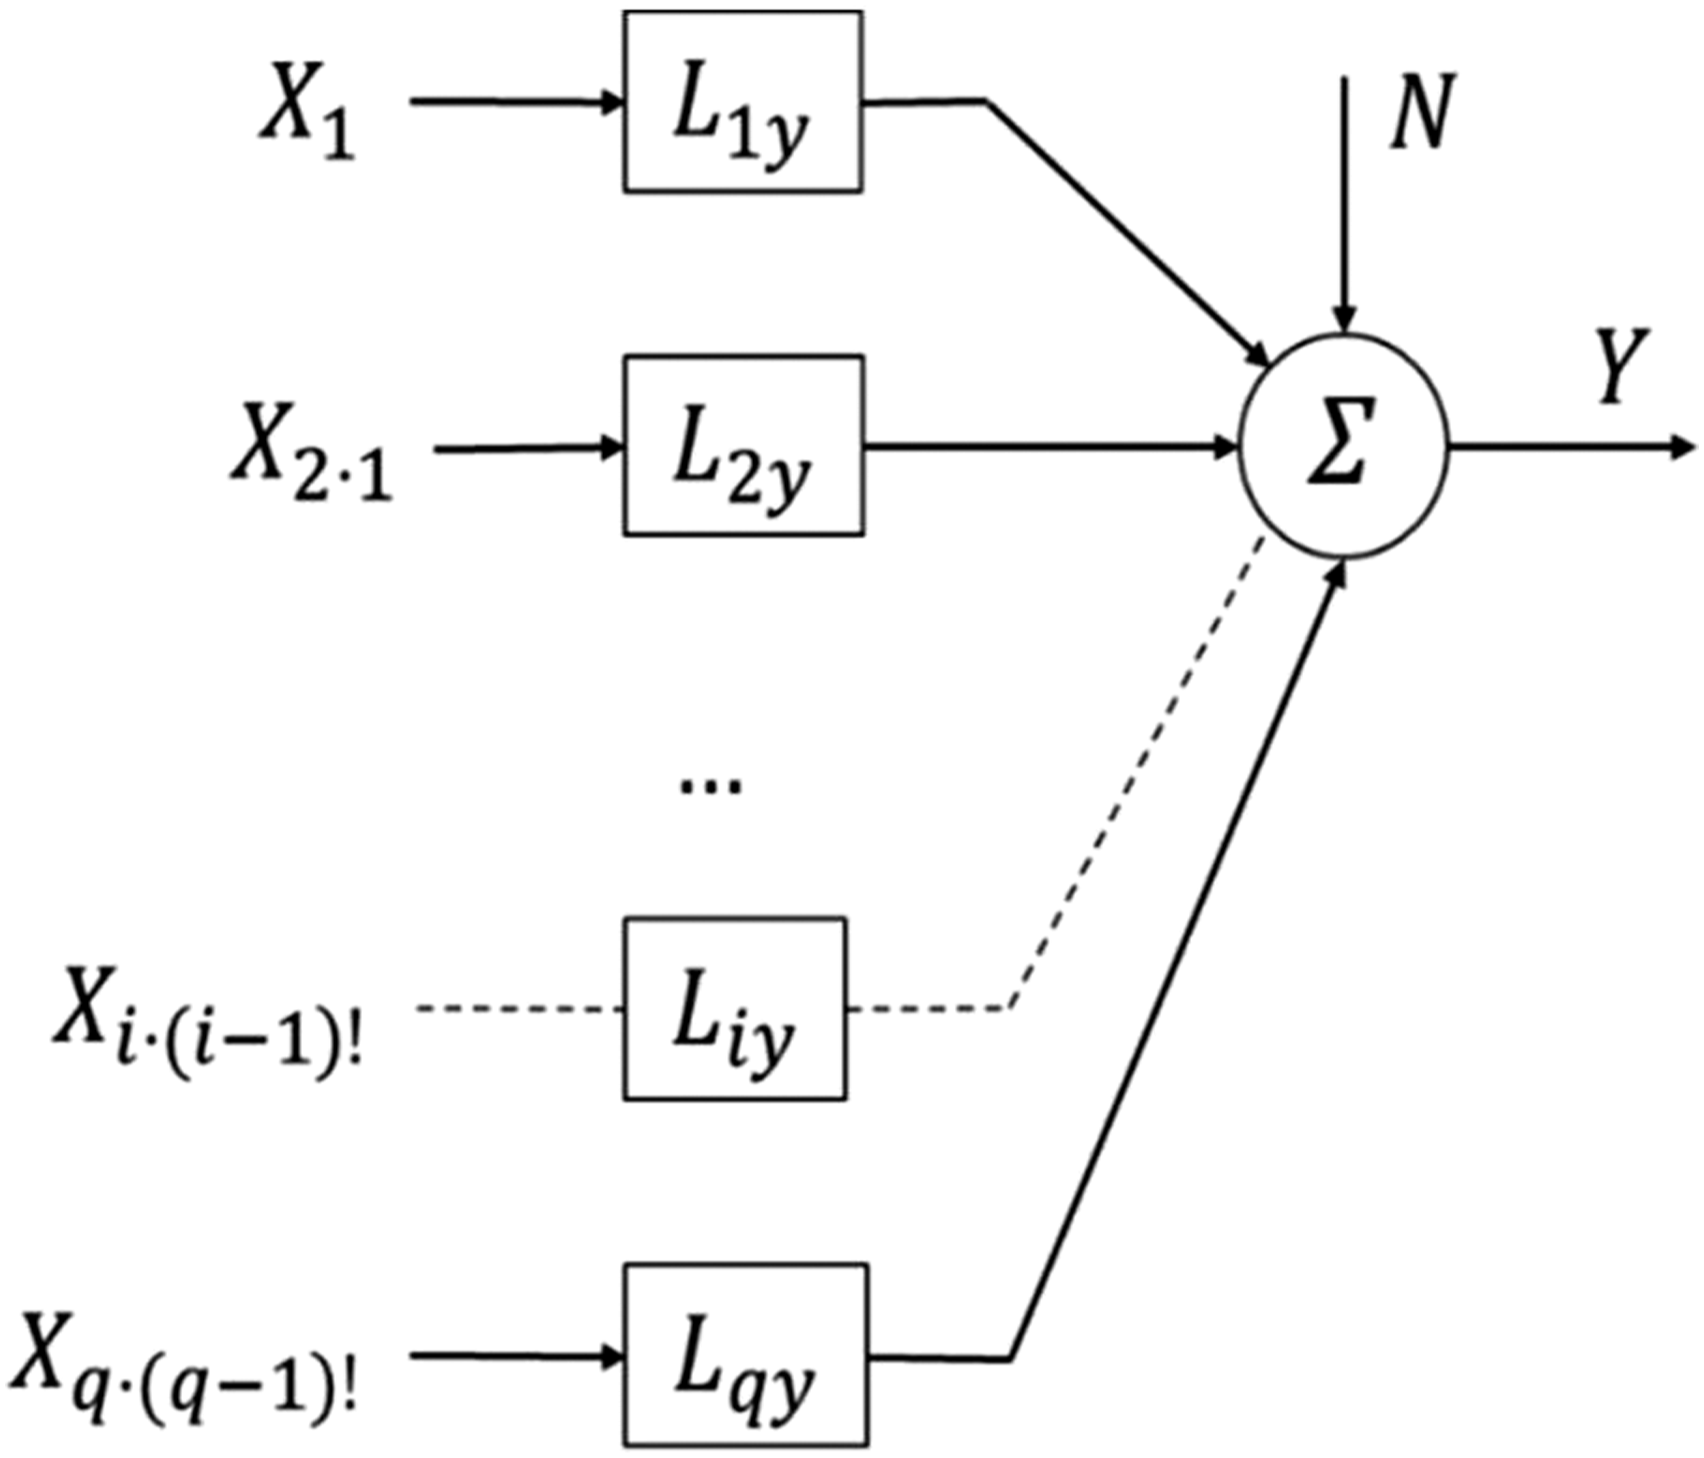
The capital letter
Aiming at how to measure the impact of each input overall, this paper introduces the concept of “total contribution coefficient sum.” Total contribution coefficient sum is the characterization of the sheet metal contribution. It is defined as the sum of the wavelet coherence coefficient values of a certain input signal
4. Wavelet coherence analysis of unsteady-state signal
4.1. Unsteady-state simulation signal
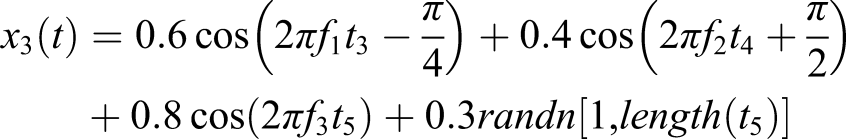
In this section, the non-orthogonal Morlet wavelet function of formula (1) is selected as the basis function when using the wavelet coherent analysis method to process the unsteady-state simulation signals. A set of non-stationary analog signals are designed to verify the effectiveness of wavelet coherence method. The input signals and output signal are as follows:
Input signal 1:
Input signal 2:
Output signal 3:
First, the method of cross wavelet transform is used to process the simulation signal. The correlation between the two unsteady-state signals can be obtained. Second, the two input signals Cross wavelet transform diagrams: (a) cross wavelet diagram of Wavelet coherence diagram of Wavelet coherence diagram of 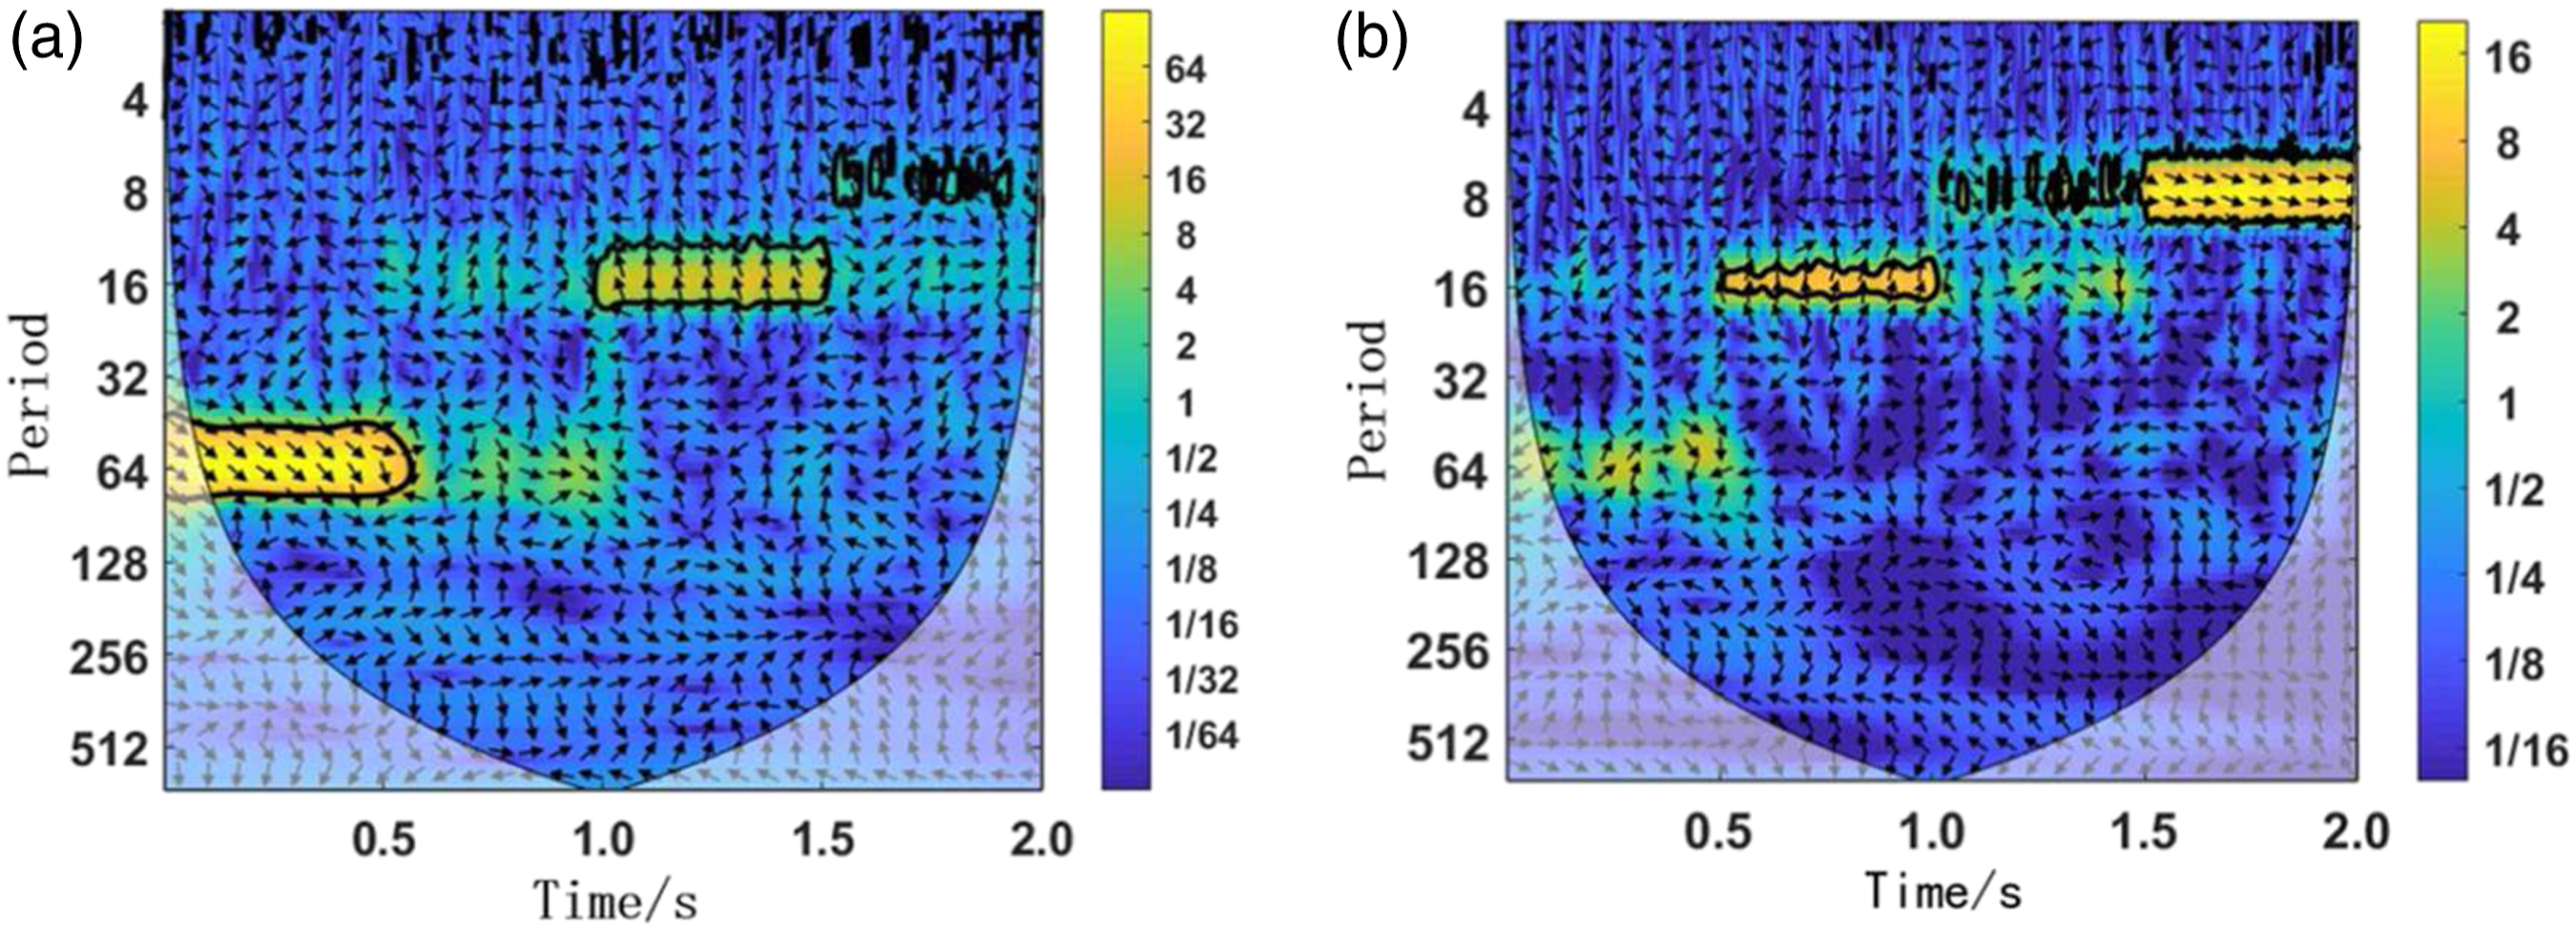
In Figure 2, the reciprocal of the period multiplied by the sampling frequency is the actual frequency of the signal. The sampling frequency here is
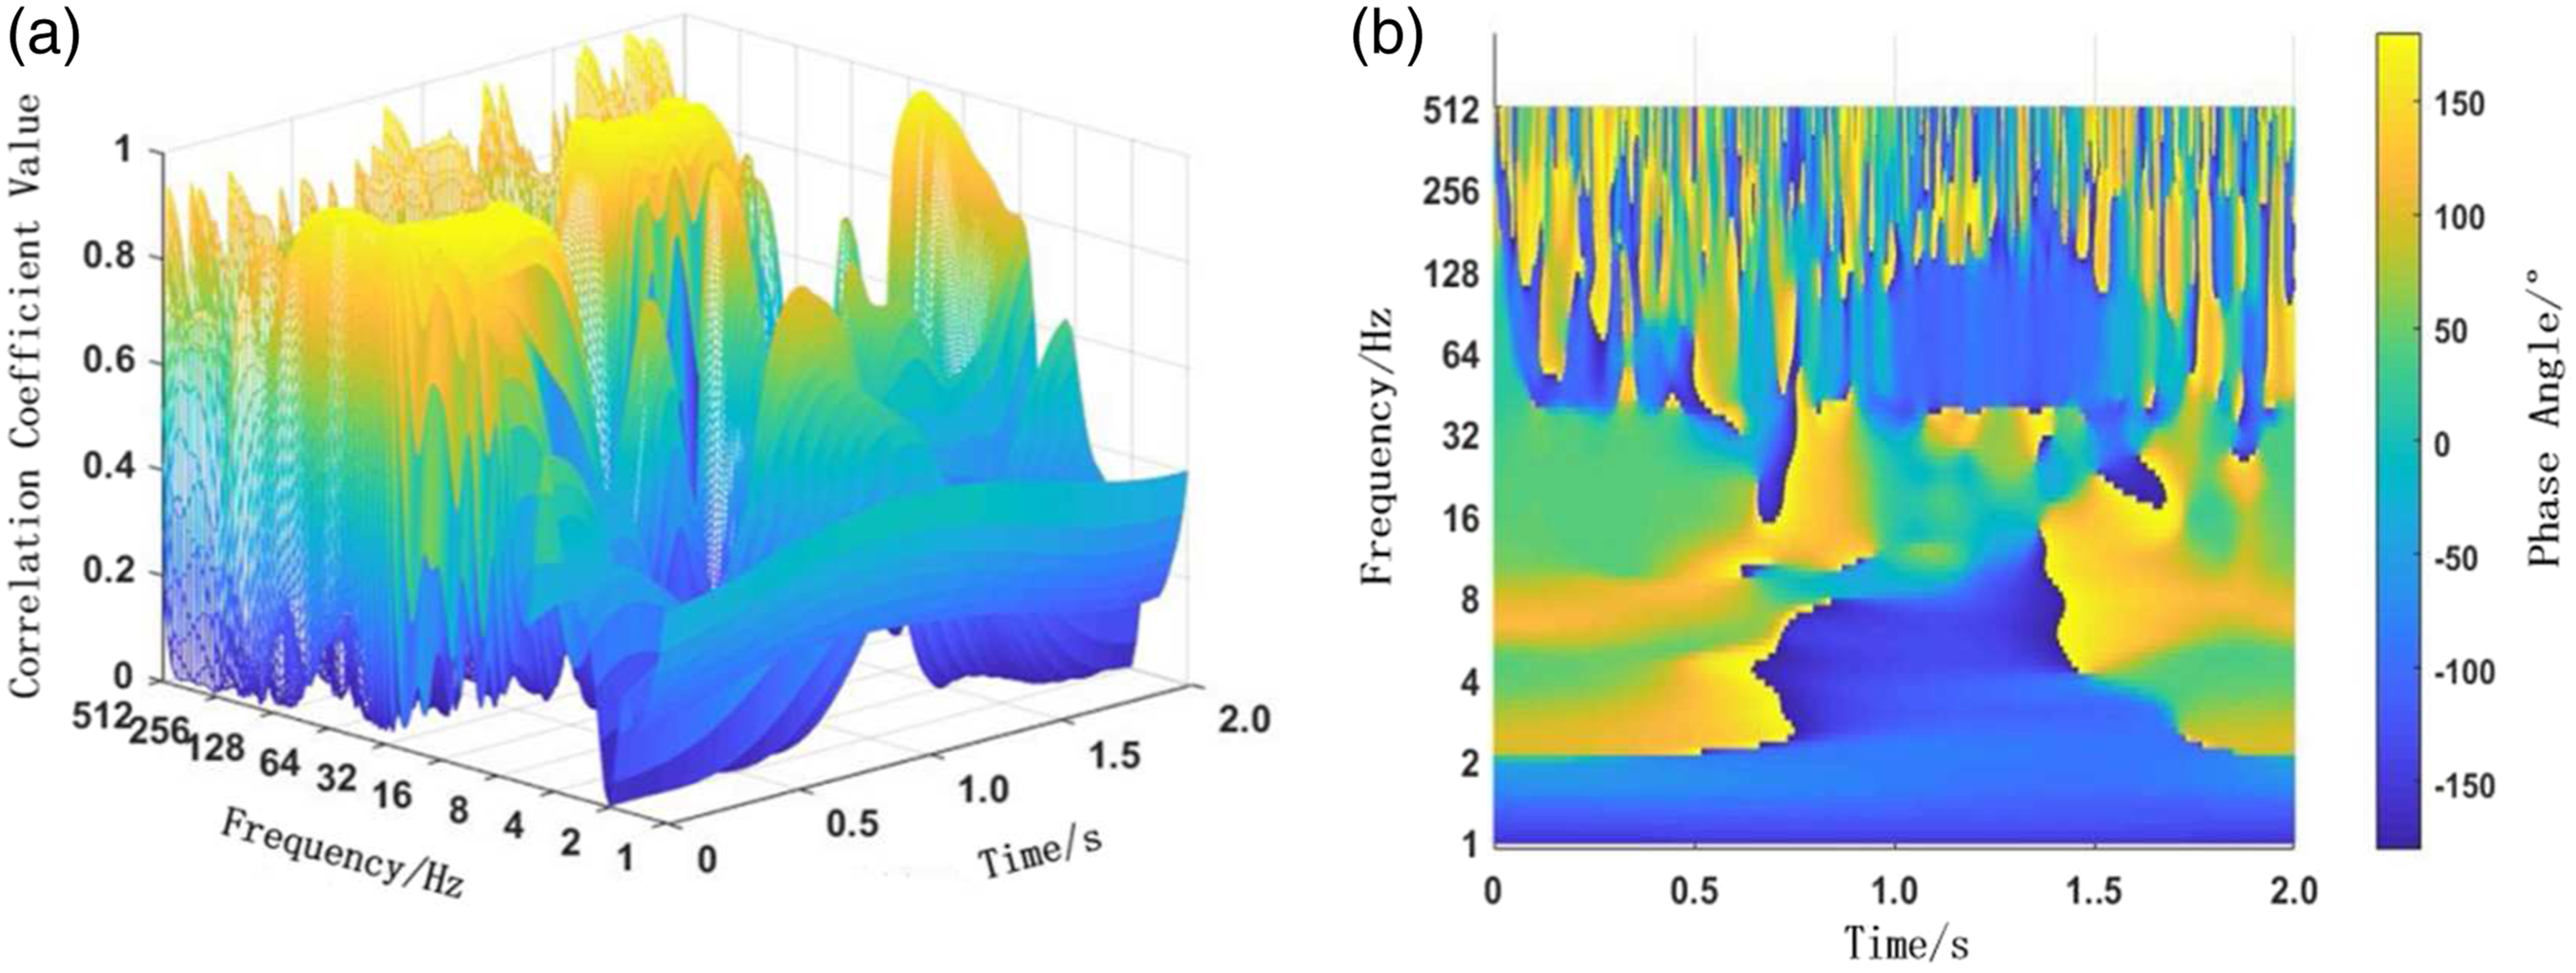
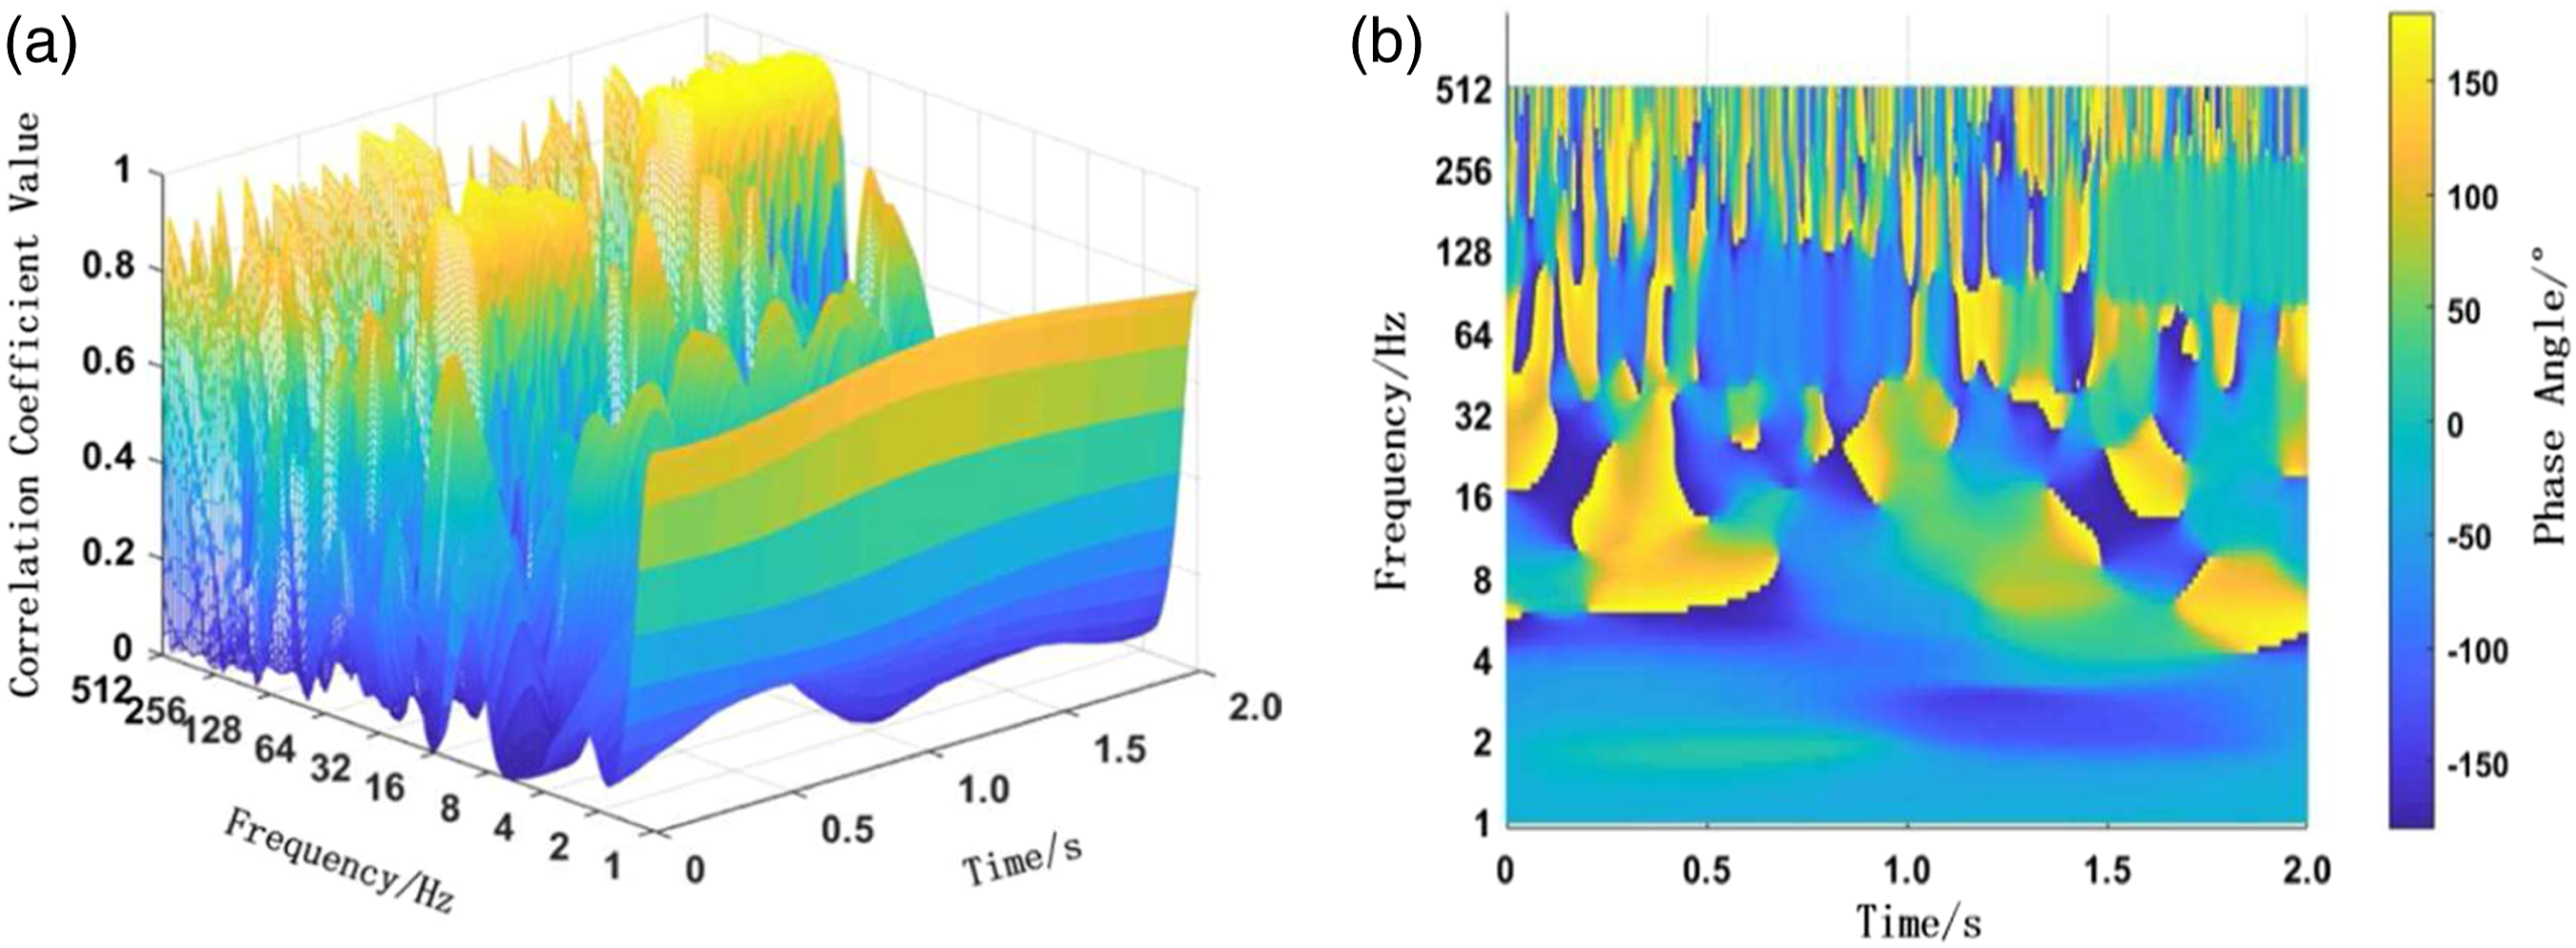
Figure 3(a) and Figure 4(a) are three-dimensional diagrams of coherence coefficient between the two input signals (
In practical engineering applications, the coherence coefficient diagram and the phase diagram are combined to facilitate judgment. The wavelet coherent time-frequency diagrams between Wavelet coherence diagram of simulated signal: (a) wavelet coherent time-frequency diagram of 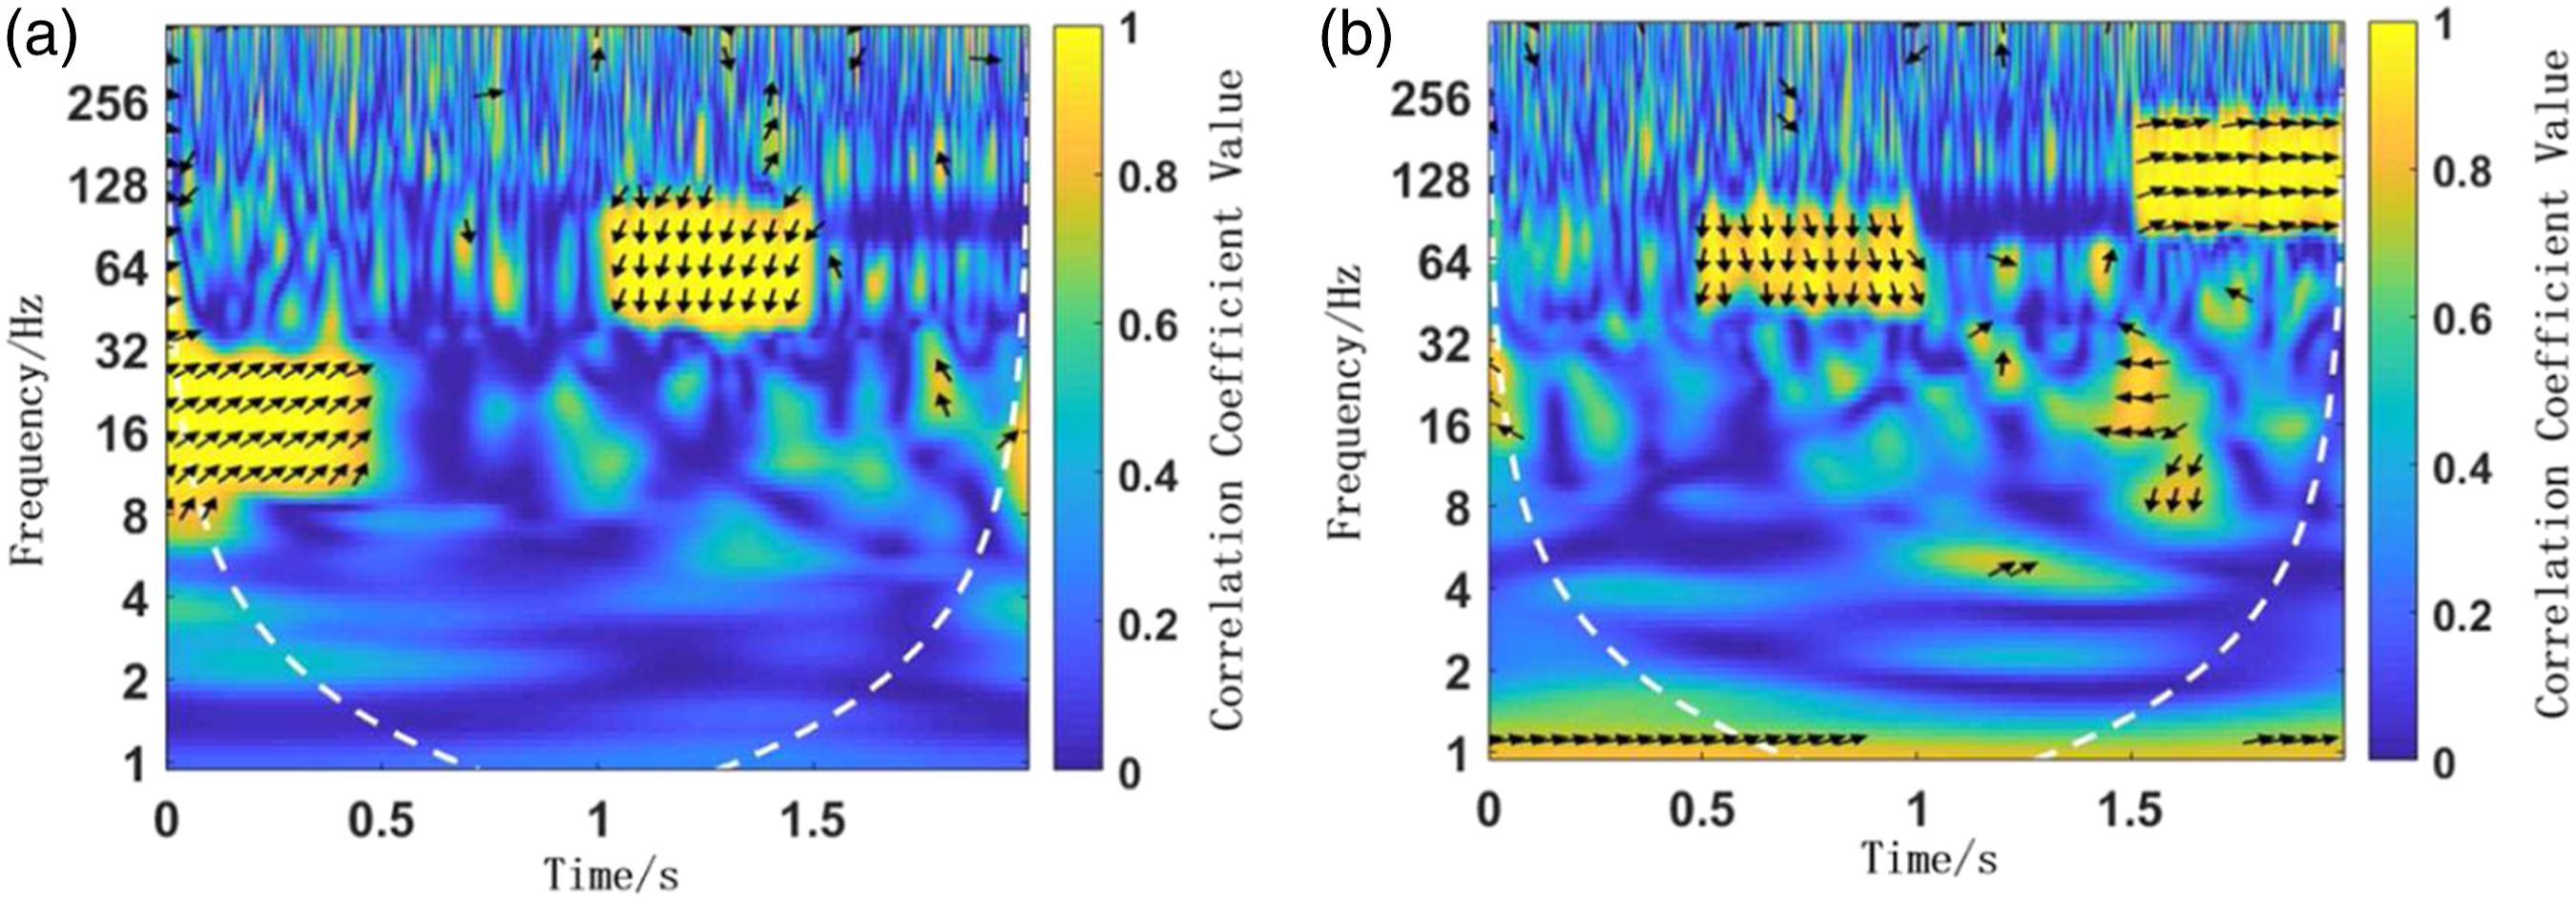
The lightness and darkness of the colors in the figure indicate the degree of correlation between the input and output signals. The color is brighter, and the correlation between the two signals is stronger (Huang et al., 2018). The arrow indicates the phase relationship between the two signals. The counterclockwise angle between the arrow and the horizontal line of the positive half axis indicates the phase value of the output signal lagging behind the input signal.
According to Figure 5, the input signals
4.2. Coherent analysis of vehicle acceleration signal
Taking the cab of one heavy truck as the research object, it is necessary to carry out a road test on the vehicle. The test is in accordance with the relevant operating specifications stipulated in the GB/T 18697-2002 “acoustics-measurement of noise inside motor vehicles.” The cab panel vibration and noise are collected.
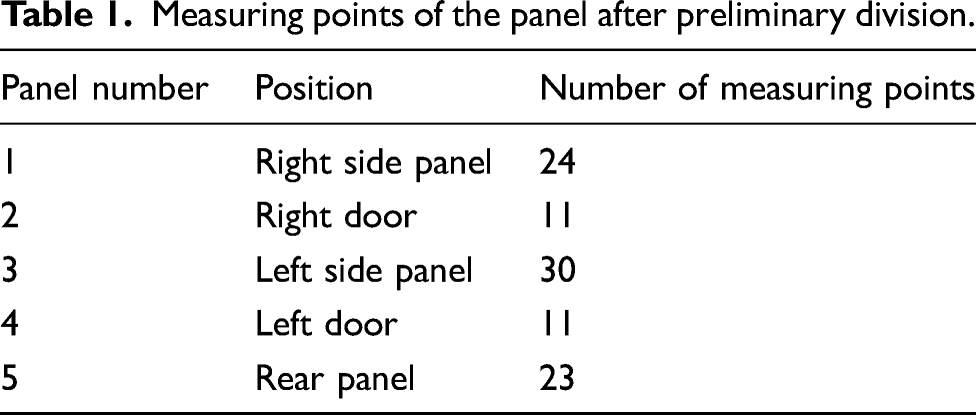
Measuring points of the panel after preliminary division.
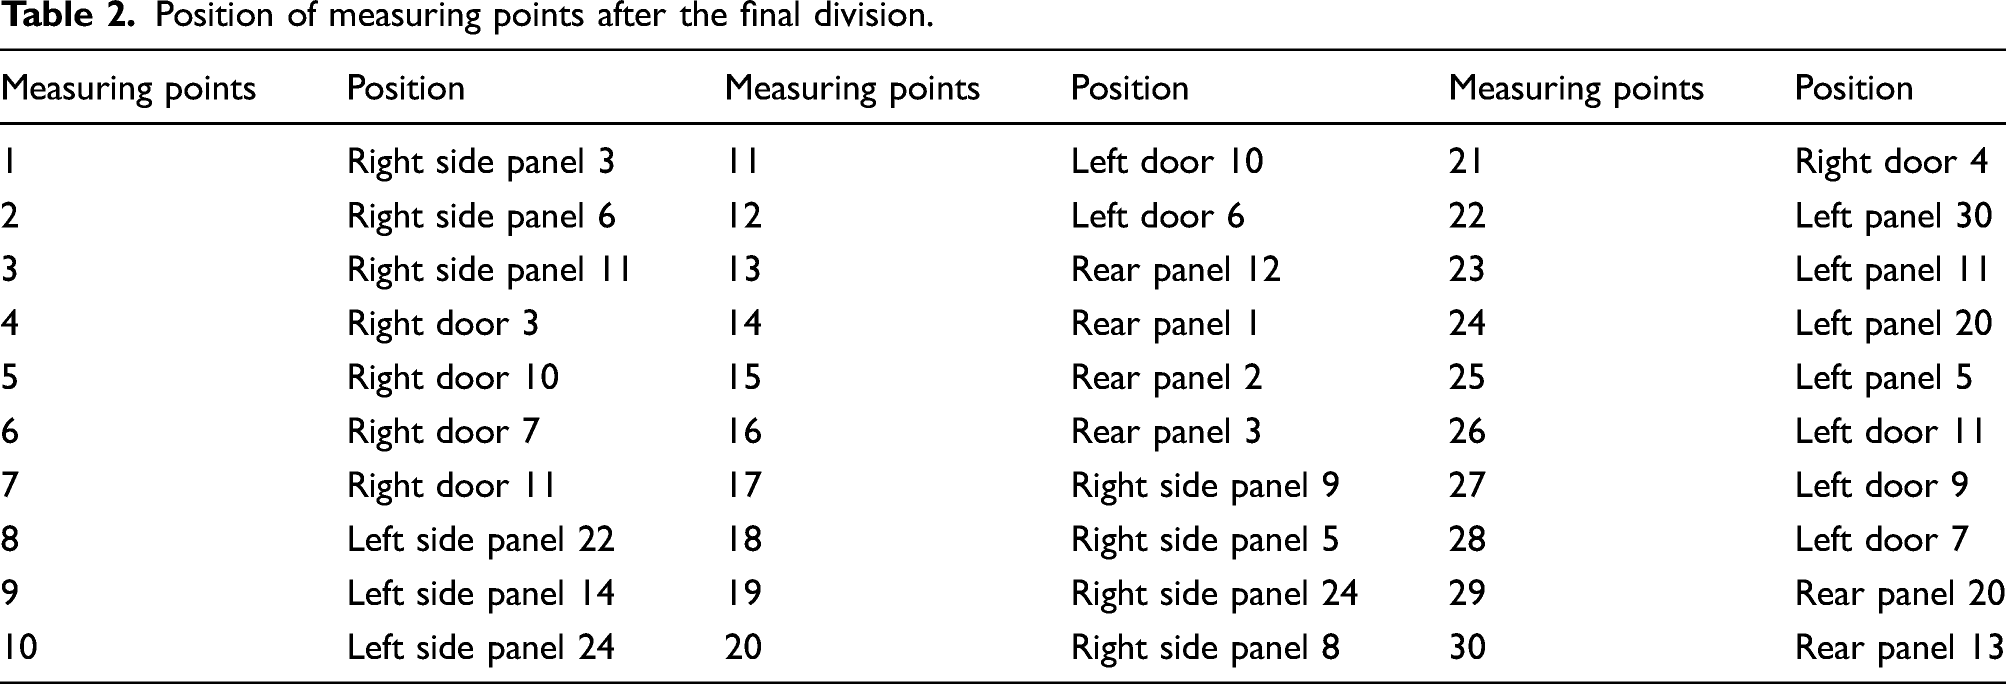
Position of measuring points after the final division.
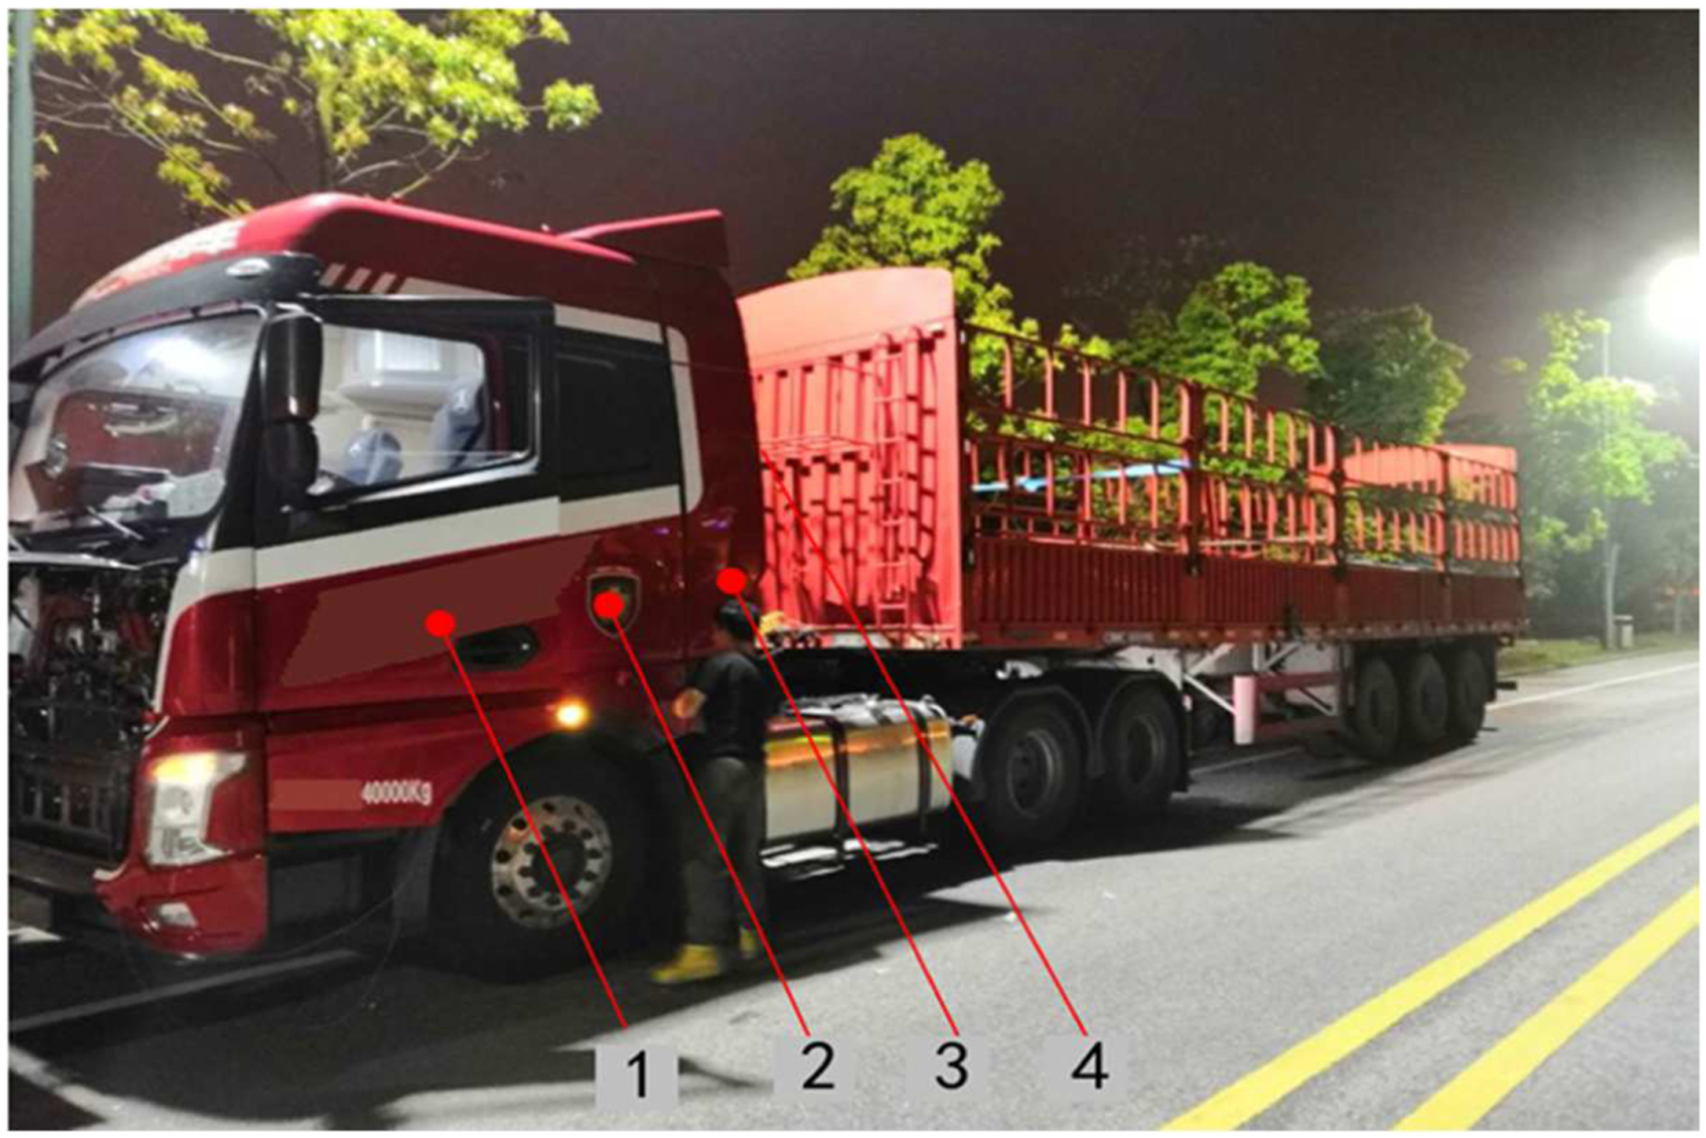
Test vehicle. 1. Left door; 2. left side panel; 3. left panel; 4. rear panel.
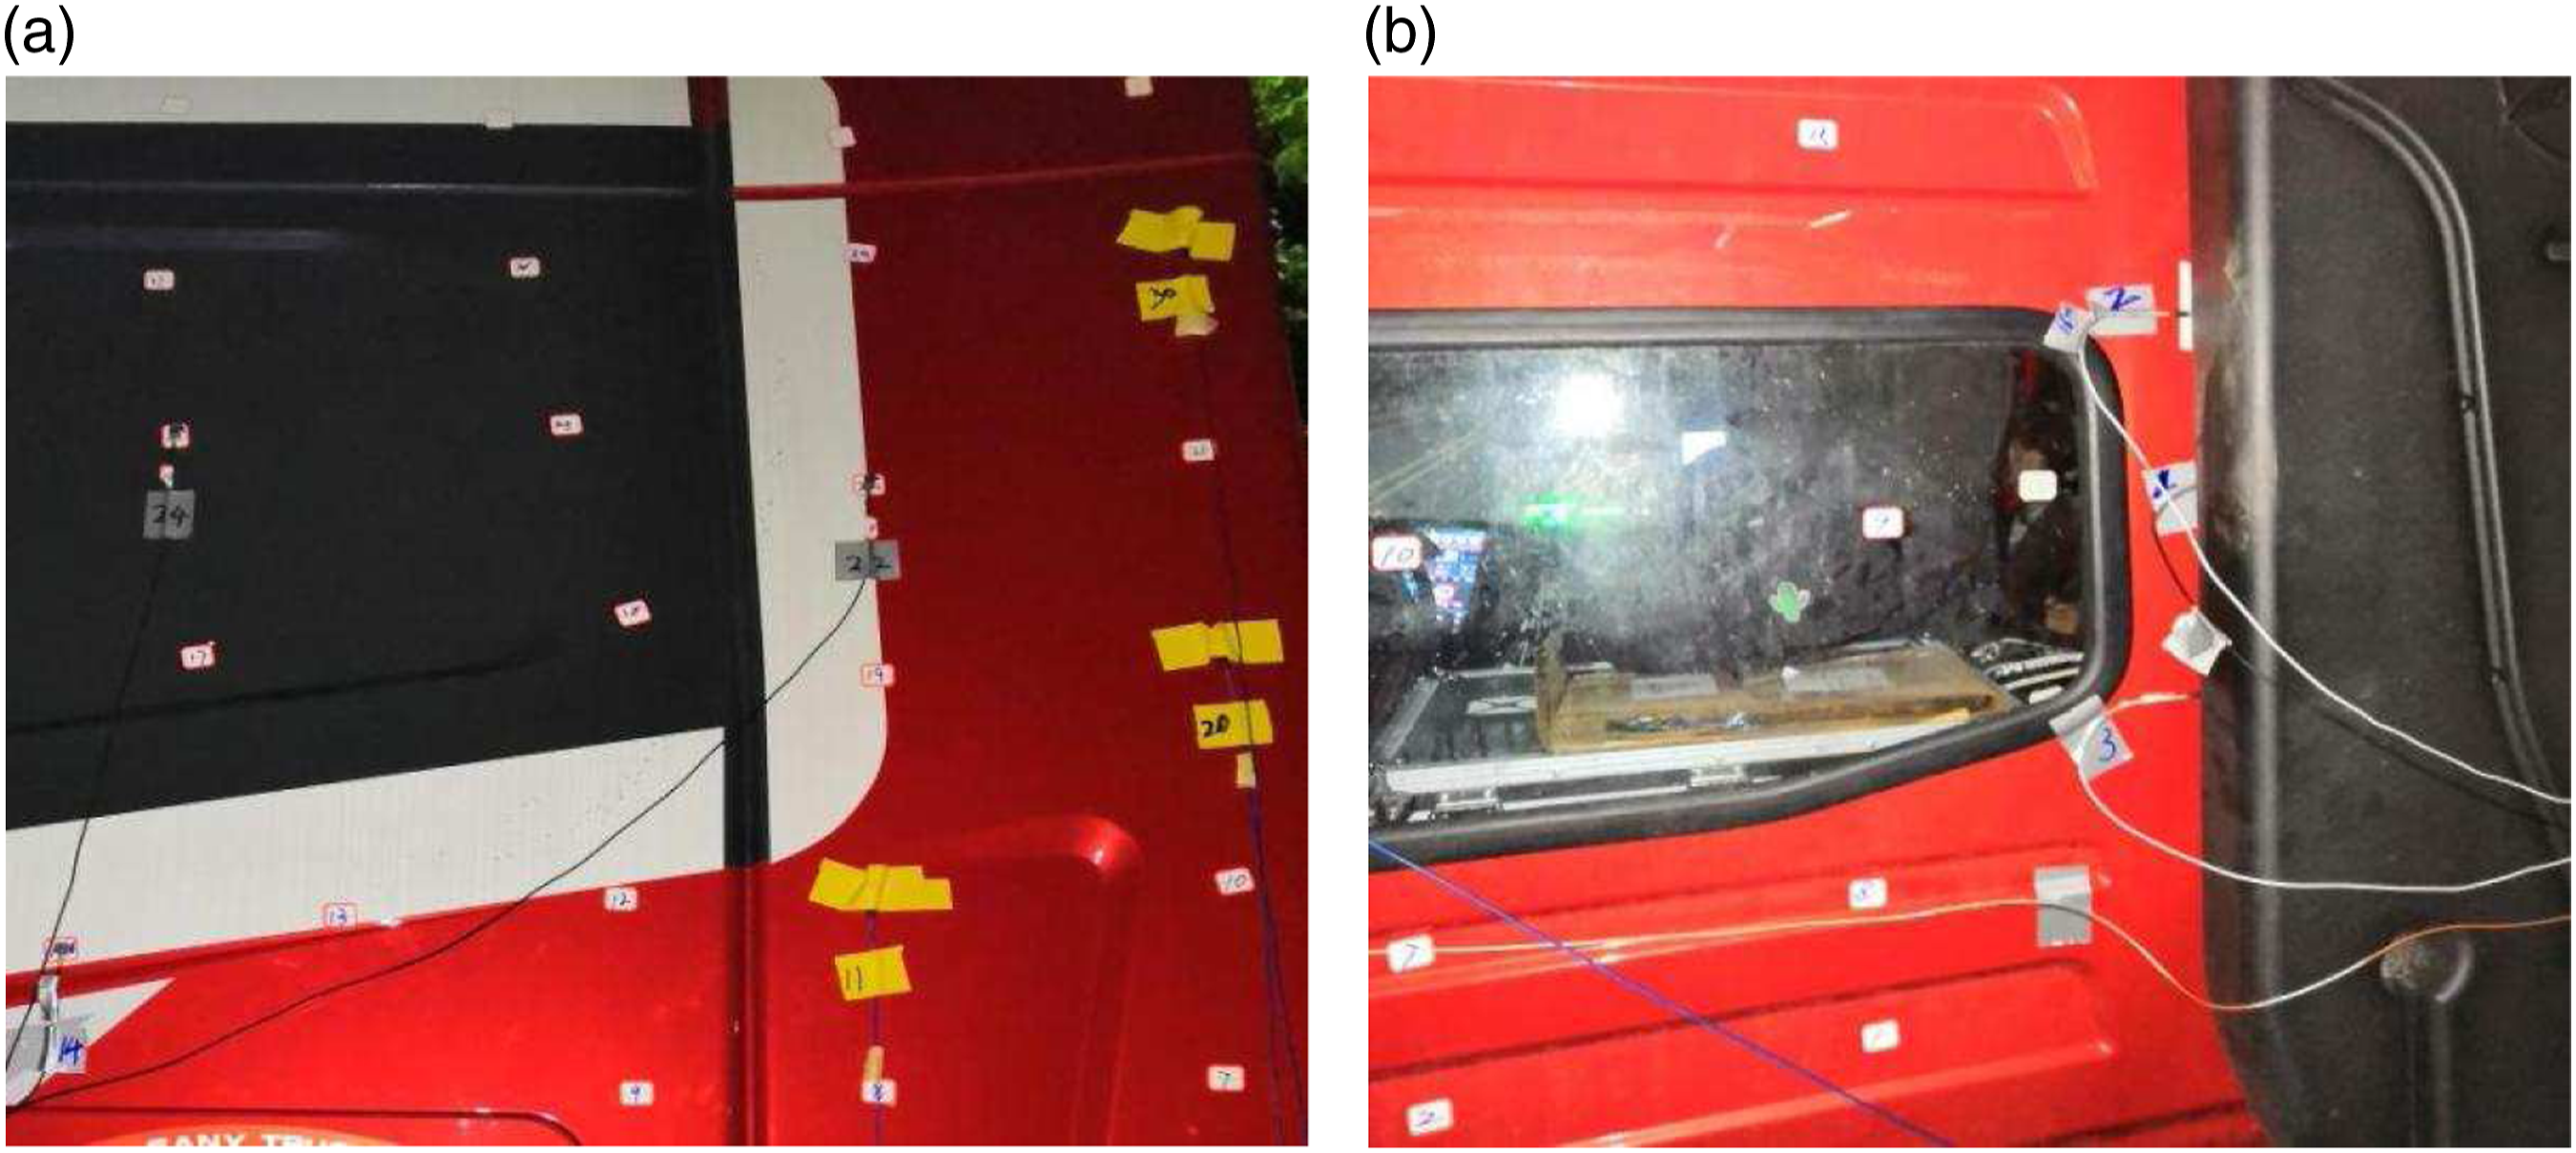
Location figure of measuring points for key panels: (a) right side panel and (b) rear panel.
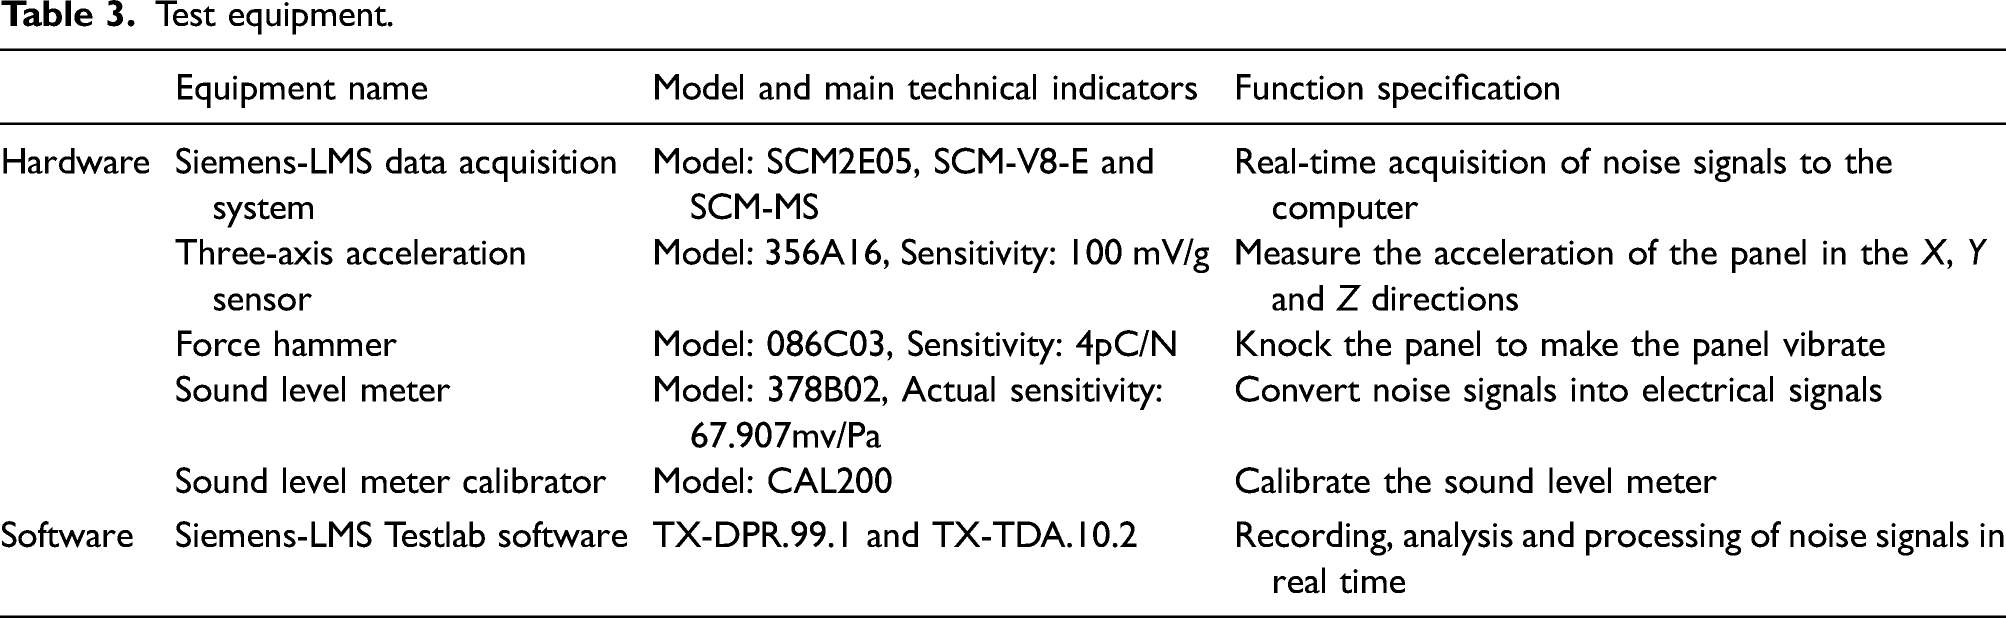
Test equipment.
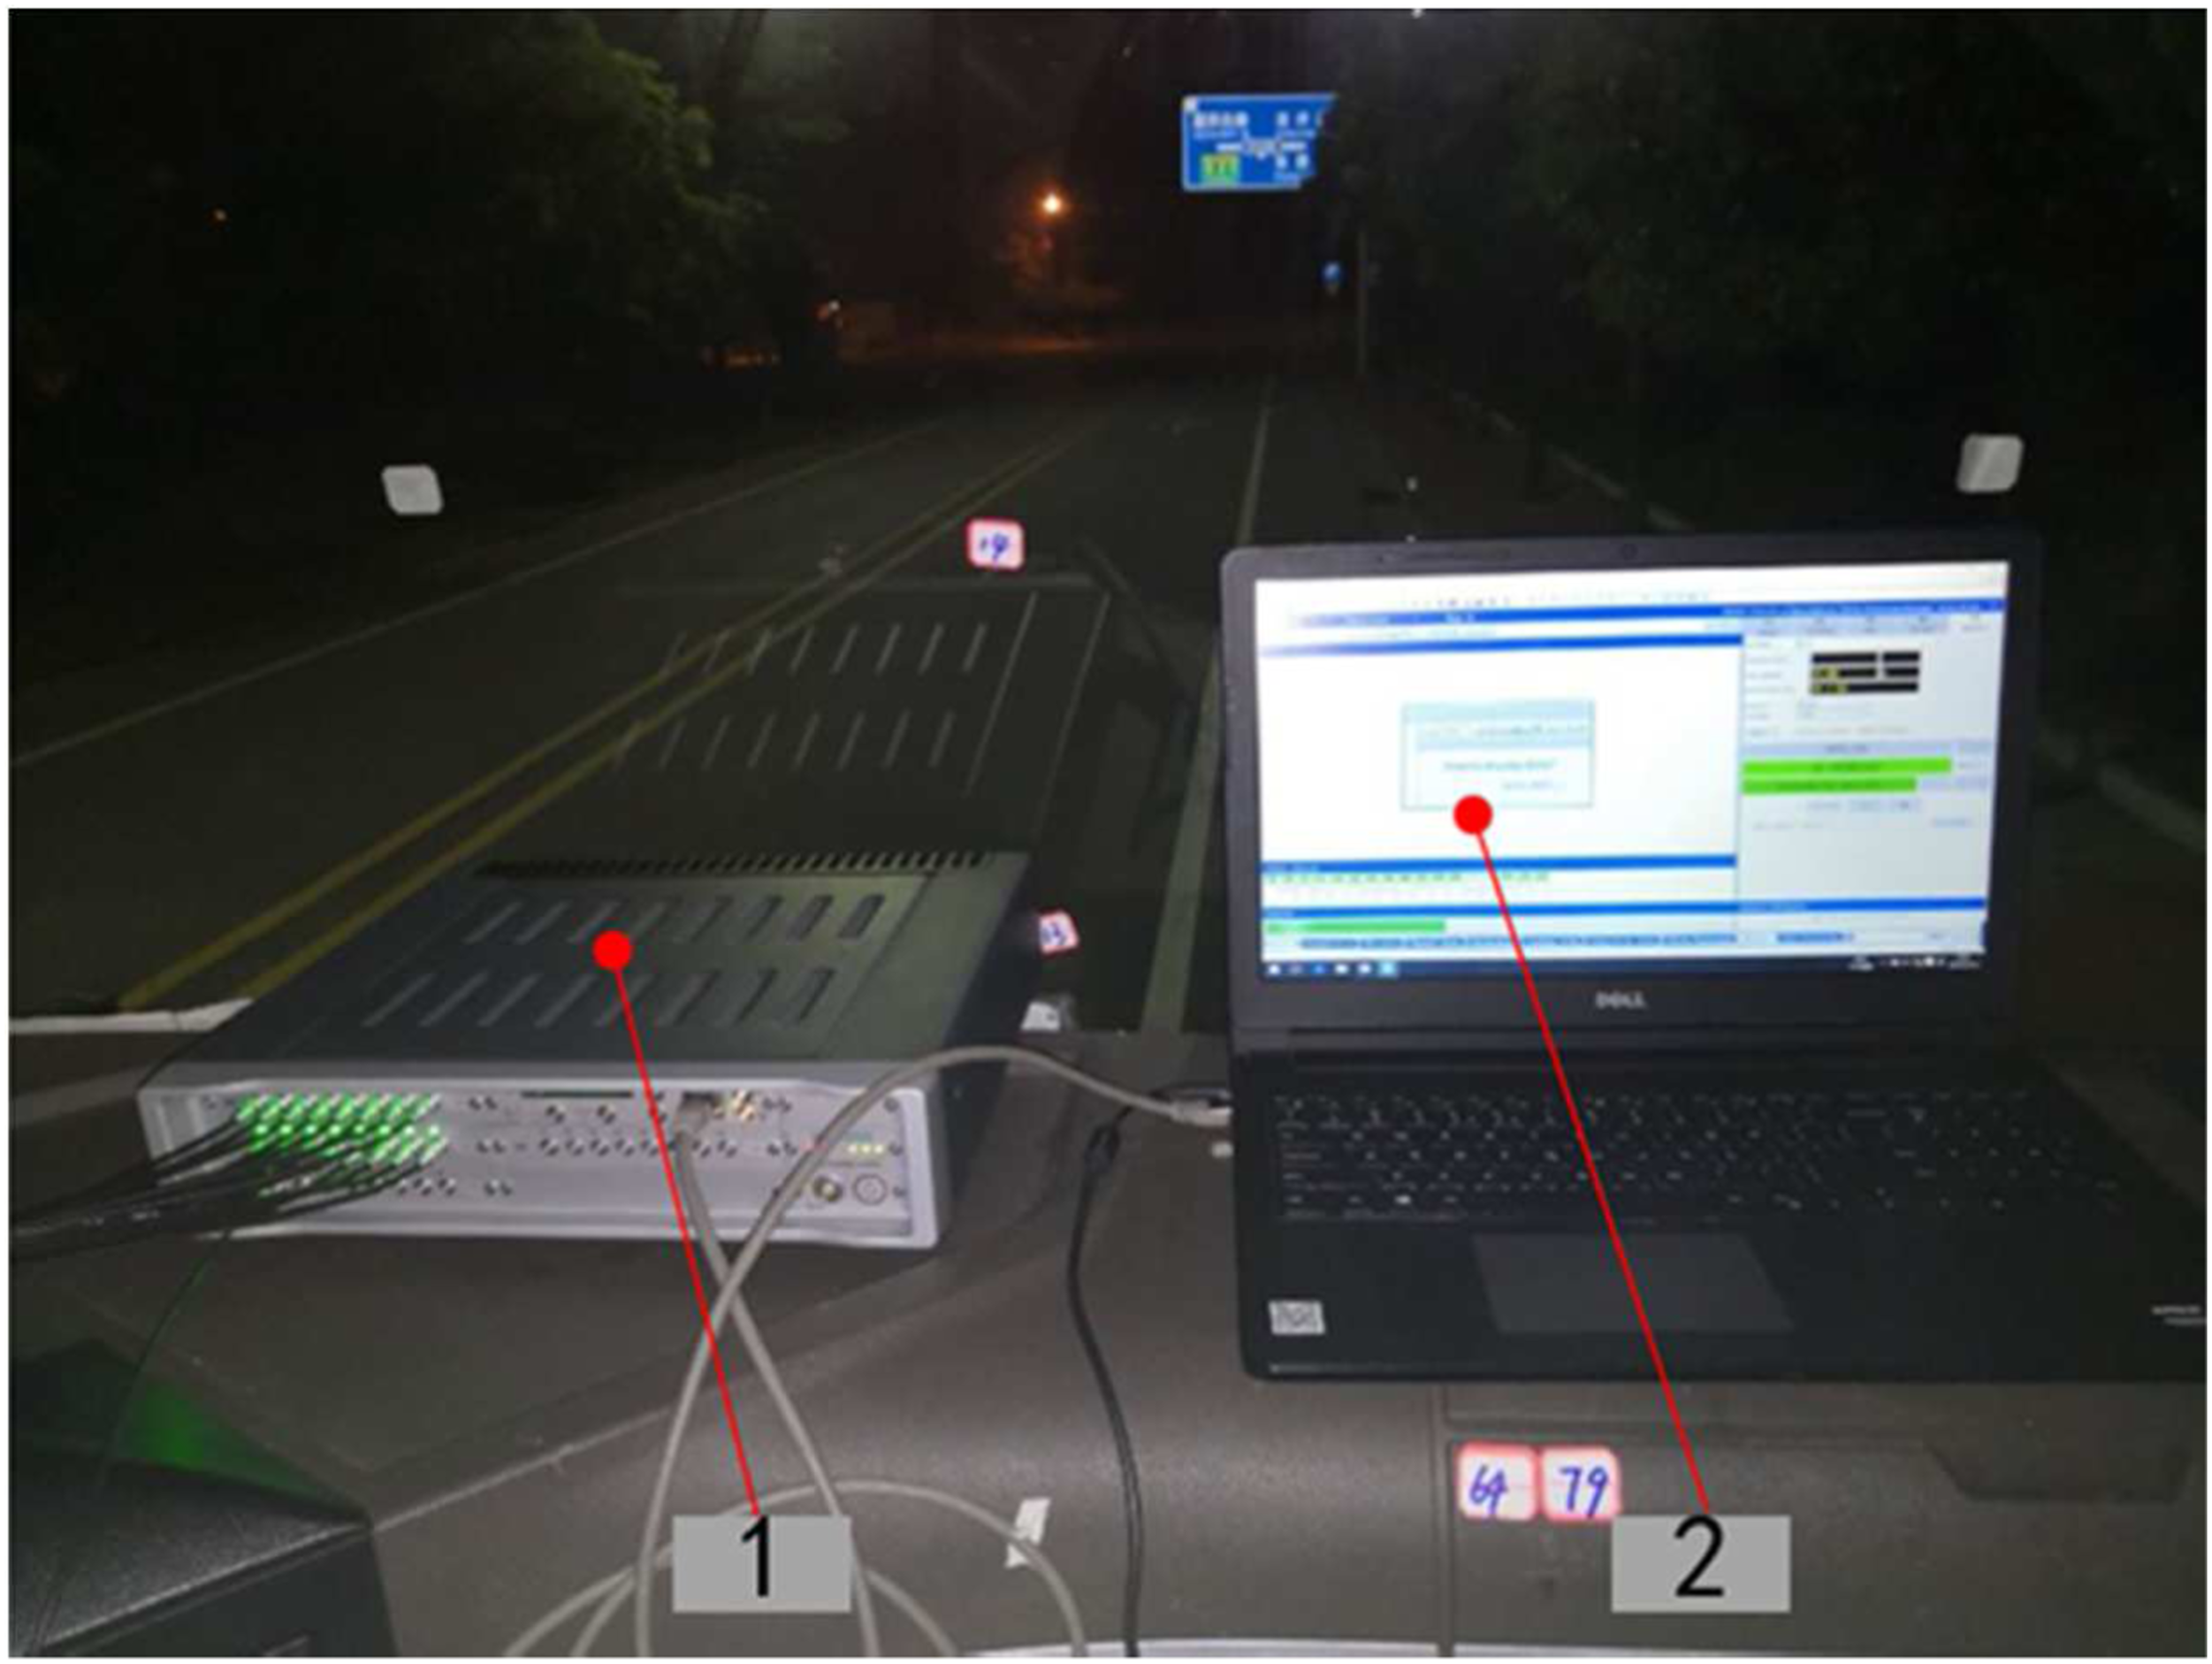
LMS data acquisition and analysis system: LMS data acquisition system and 2. LMS software.
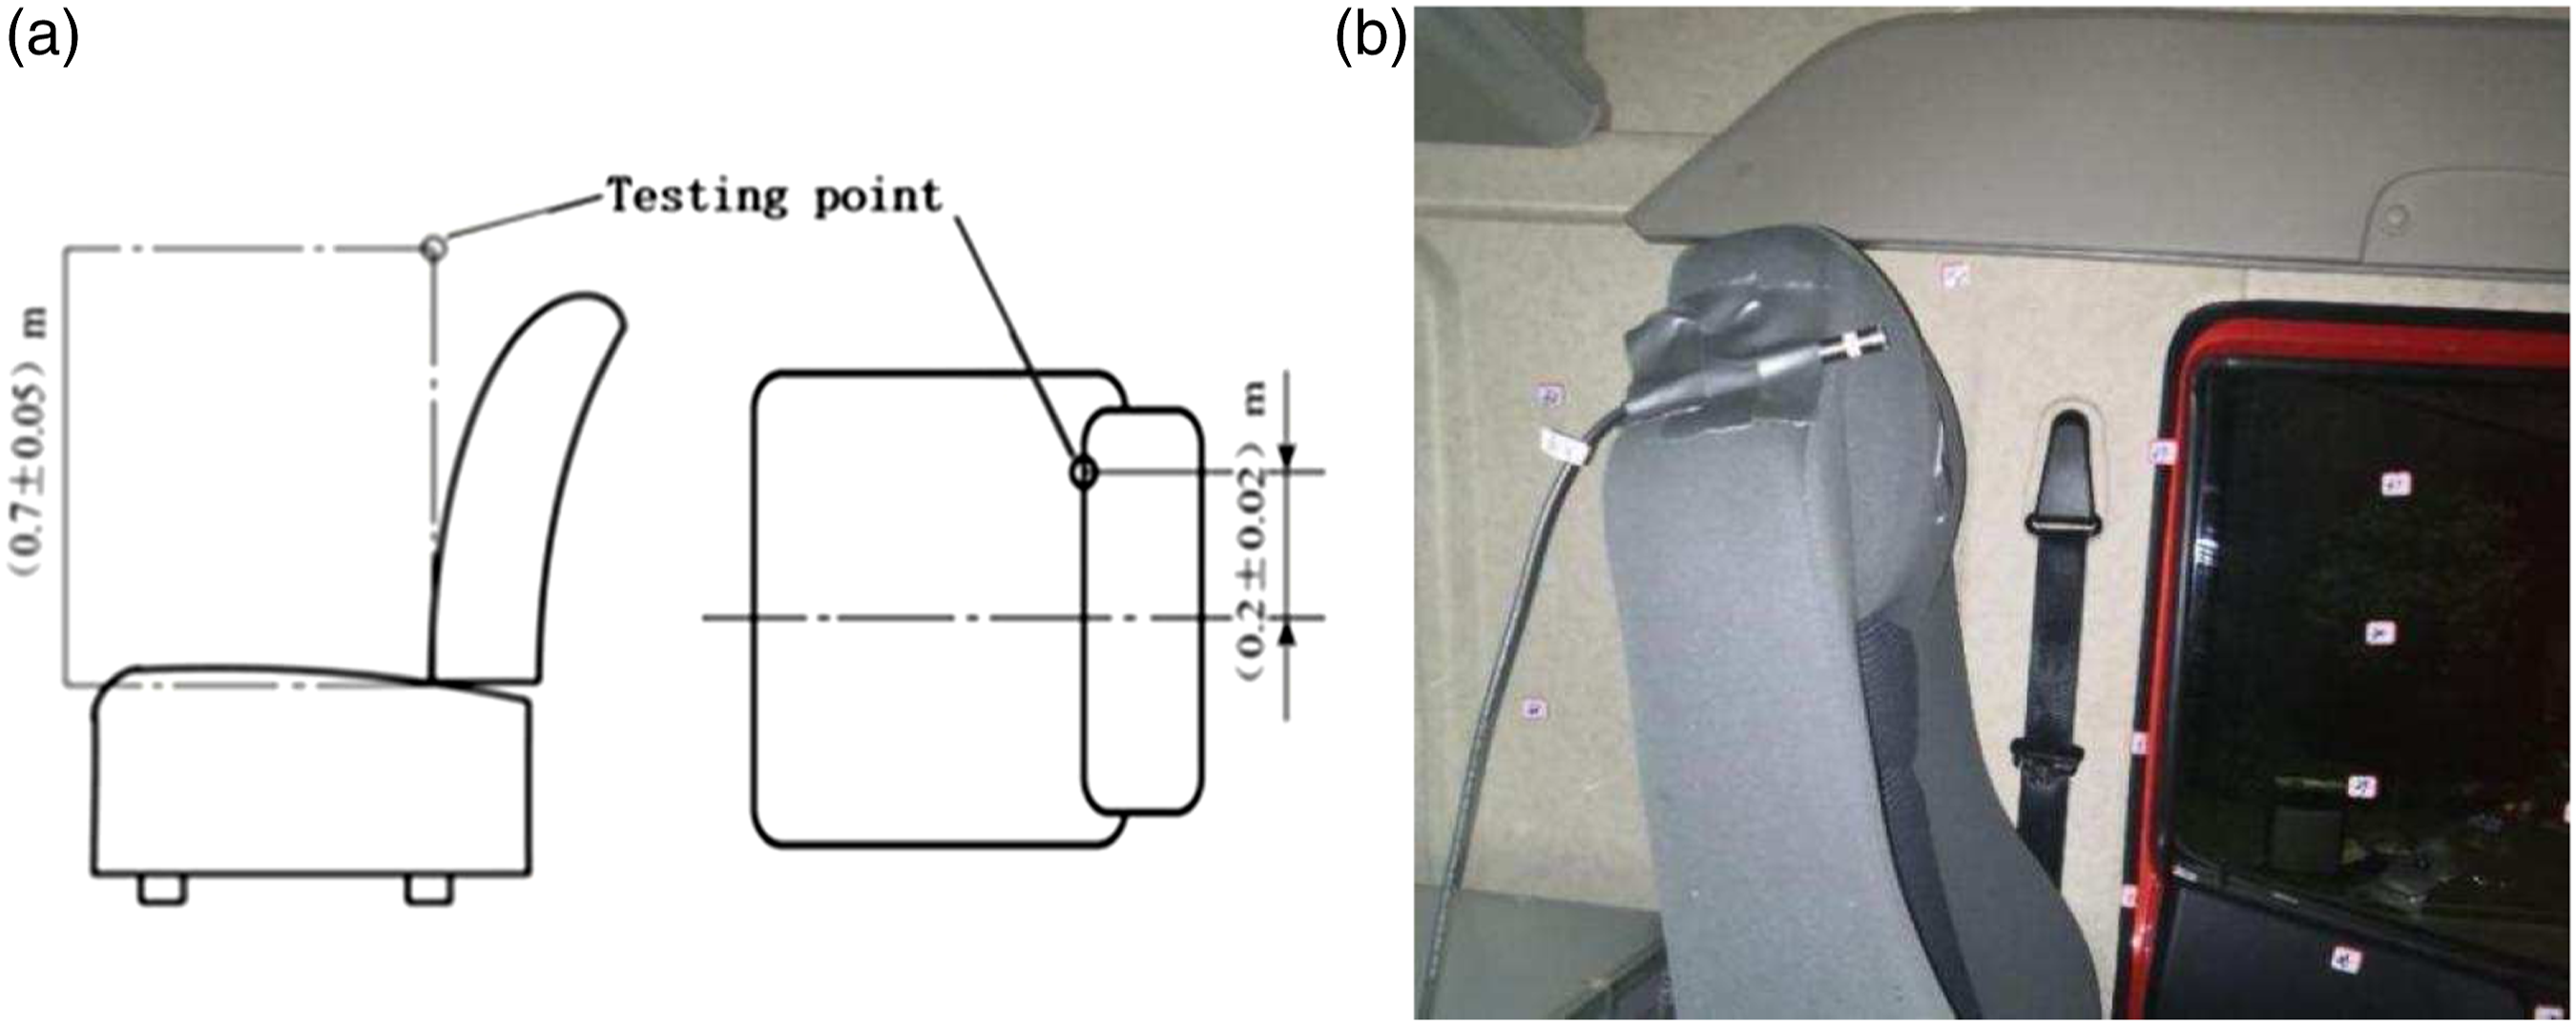
Installation diagram of the sound level meter: (a) location figure of sound level meter and (b) main driver’s right ear measurement point.
The test condition is that the speed of the heavy truck is accelerated evenly from 60 km/h to 70 km/h. The sampling frequency is
According to the recorded data of the LMS software, the data of each measuring point in the period of Wavelet coherence diagram between panel vibration and noise signal of the main driver’s right ear: (a) measuring point 6; (b) measuring point 9; (c) measuring point 12; (d) measuring point 15; (e) measuring point 18; (f) measuring point 19; (g) measuring point 23; and (h) measuring point 29.
It can be seen from Figure 10 that when the frequency is below
To sum up, when the left side wall of the cab is subject to low-frequency excitation, it has the largest contribution to the driver’s right ear. The rear panel has great influence on the interior noise in the whole low frequency band. Therefore, it is determined that the panels that have the largest noise contribution to the cab are the rear panel and the left side panel area.
Based on the above test results, the positions of the panel have been determined. The noise in the cab can be suppressed when sound absorption measures are taken on the corresponding panel.
5. Optimization verification of damping treatment
Through previous analysis, the panels that contribute significant noise in the cab are determined. These panels with excessive vibration must be optimized to reduce the noise in the cab. There are two commonly used noise reduction methods: active noise reduction and passive noise reduction. The manufacturing cost of active noise reduction is relatively high. Its algorithm is too complex to adapt to the improvement of mass-produced vehicles. Therefore, it cannot be used in heavy truck cab described here. The commonly used passive noise reduction methods include structural optimization and damping treatment (Li, 2005). In practical engineering applications, the optimal solution of structural optimization should be adjusted according to specific working conditions. The damping treatment can absorb vibration energy without affecting the overall dynamic and static characteristics of the car body, which makes the optimization simple. Therefore, sticking aluminum foil butyl rubber damping materials on the rear panel and left side area of the cab panel is adopted to reduce the low-frequency noise in the vehicle. The pasting positions of the material are shown in Figure 11. Damping paste diagram: (a) paste diagram of rear panel damping and (b) paste diagram of left side damping.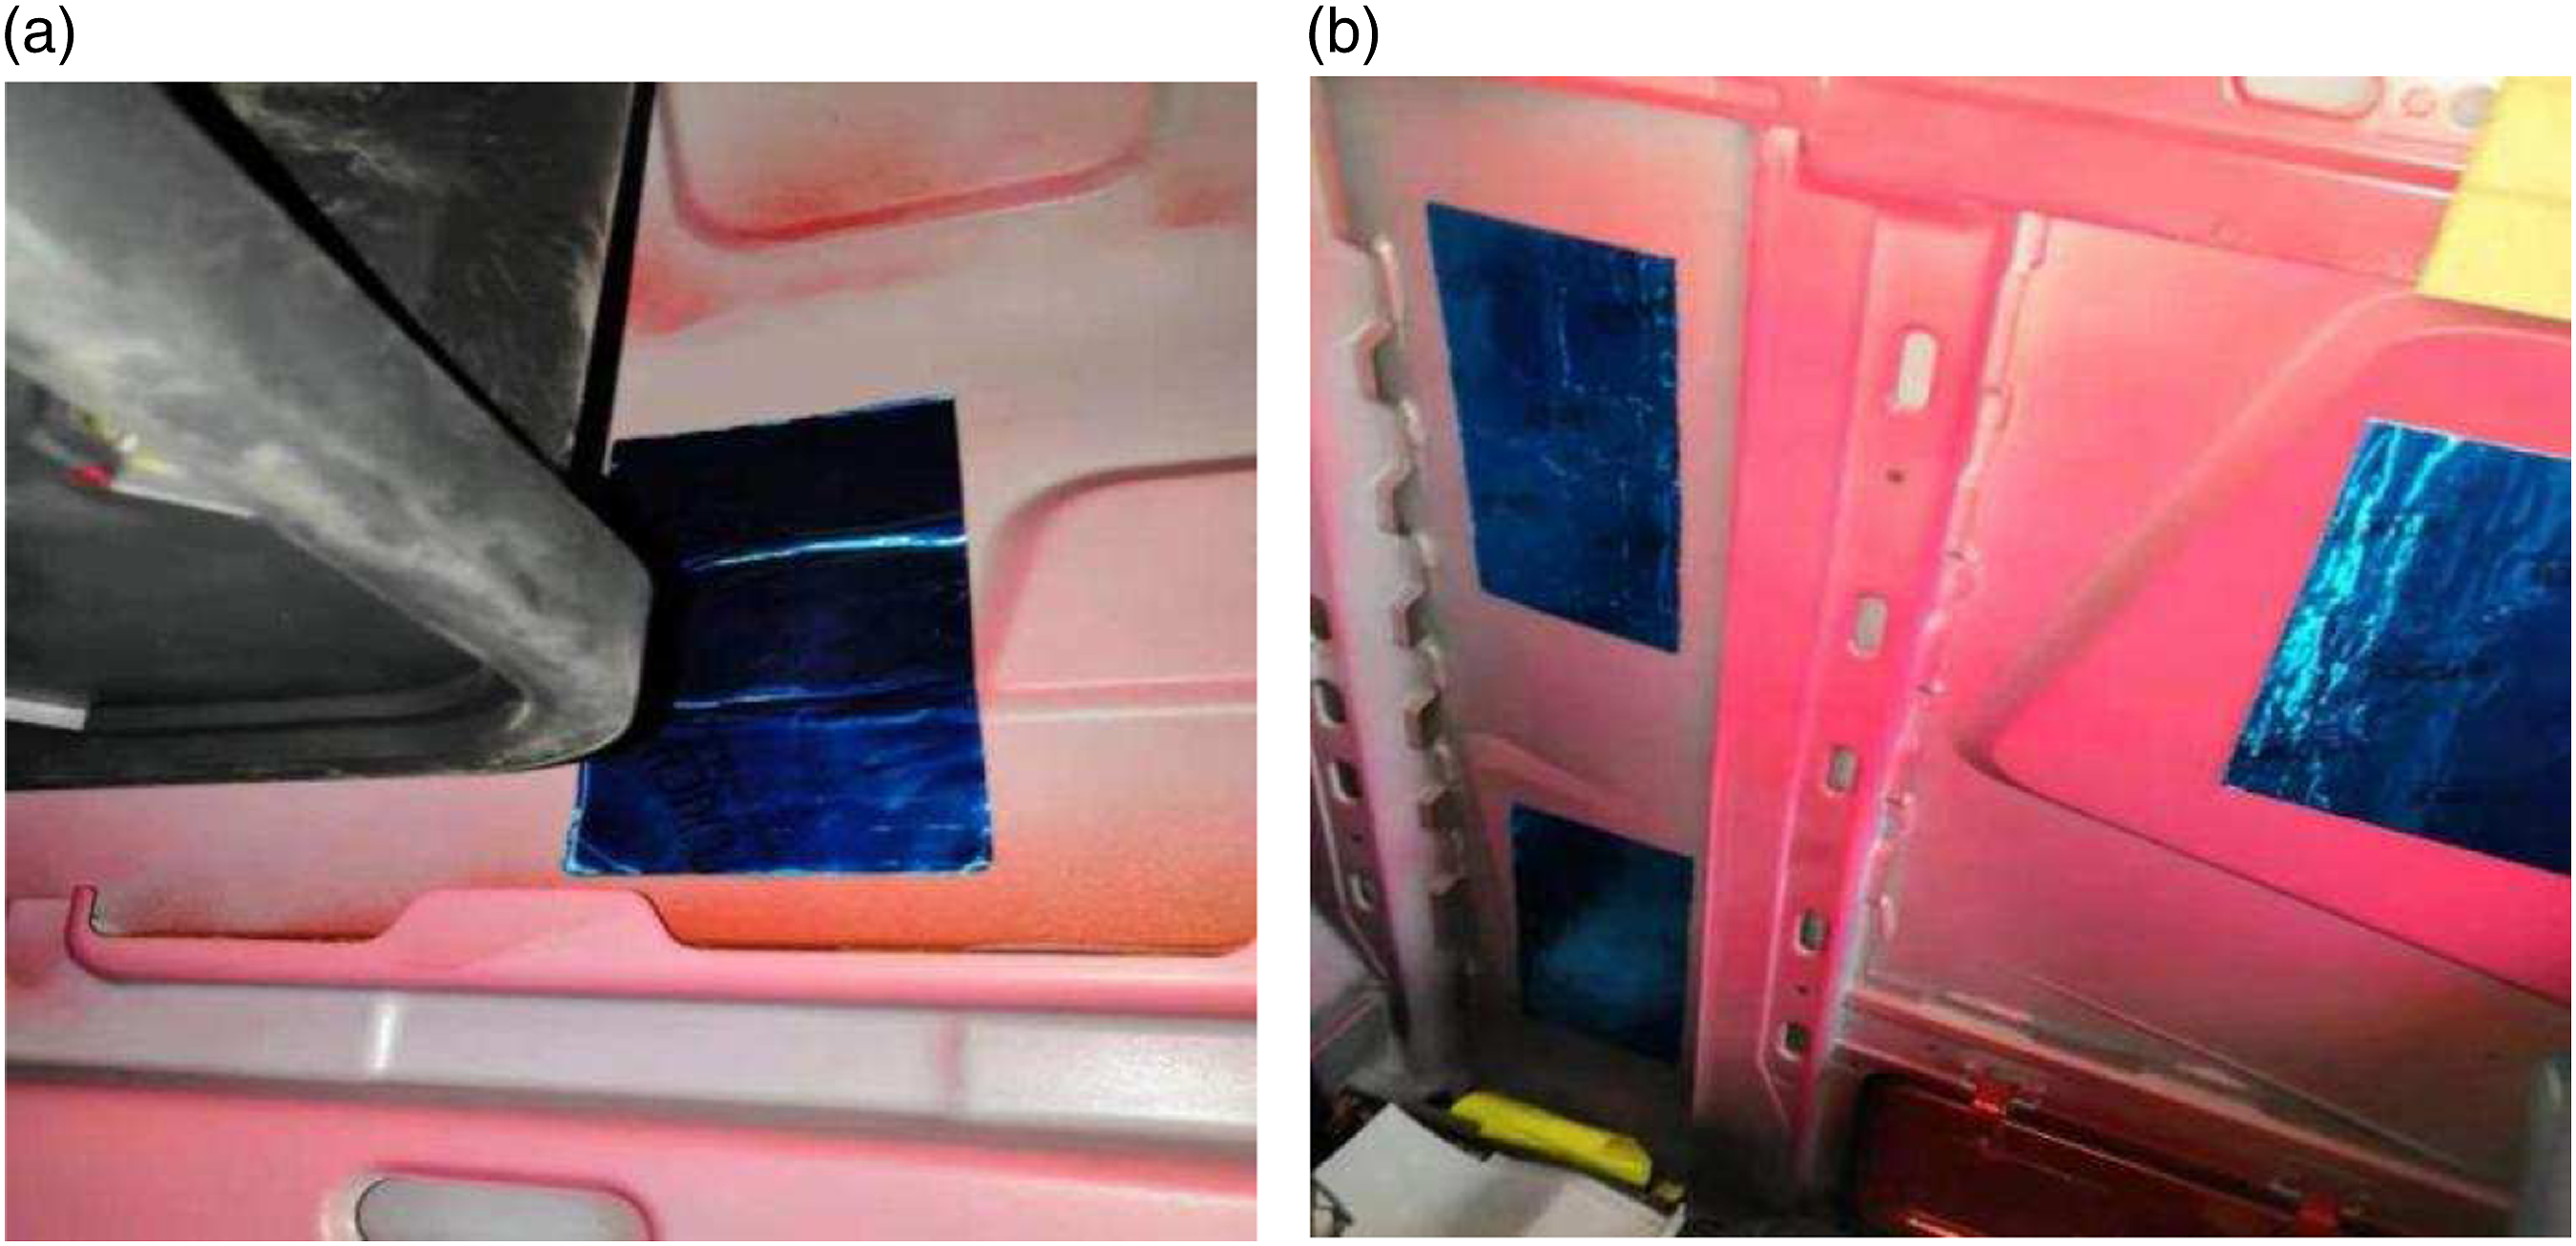
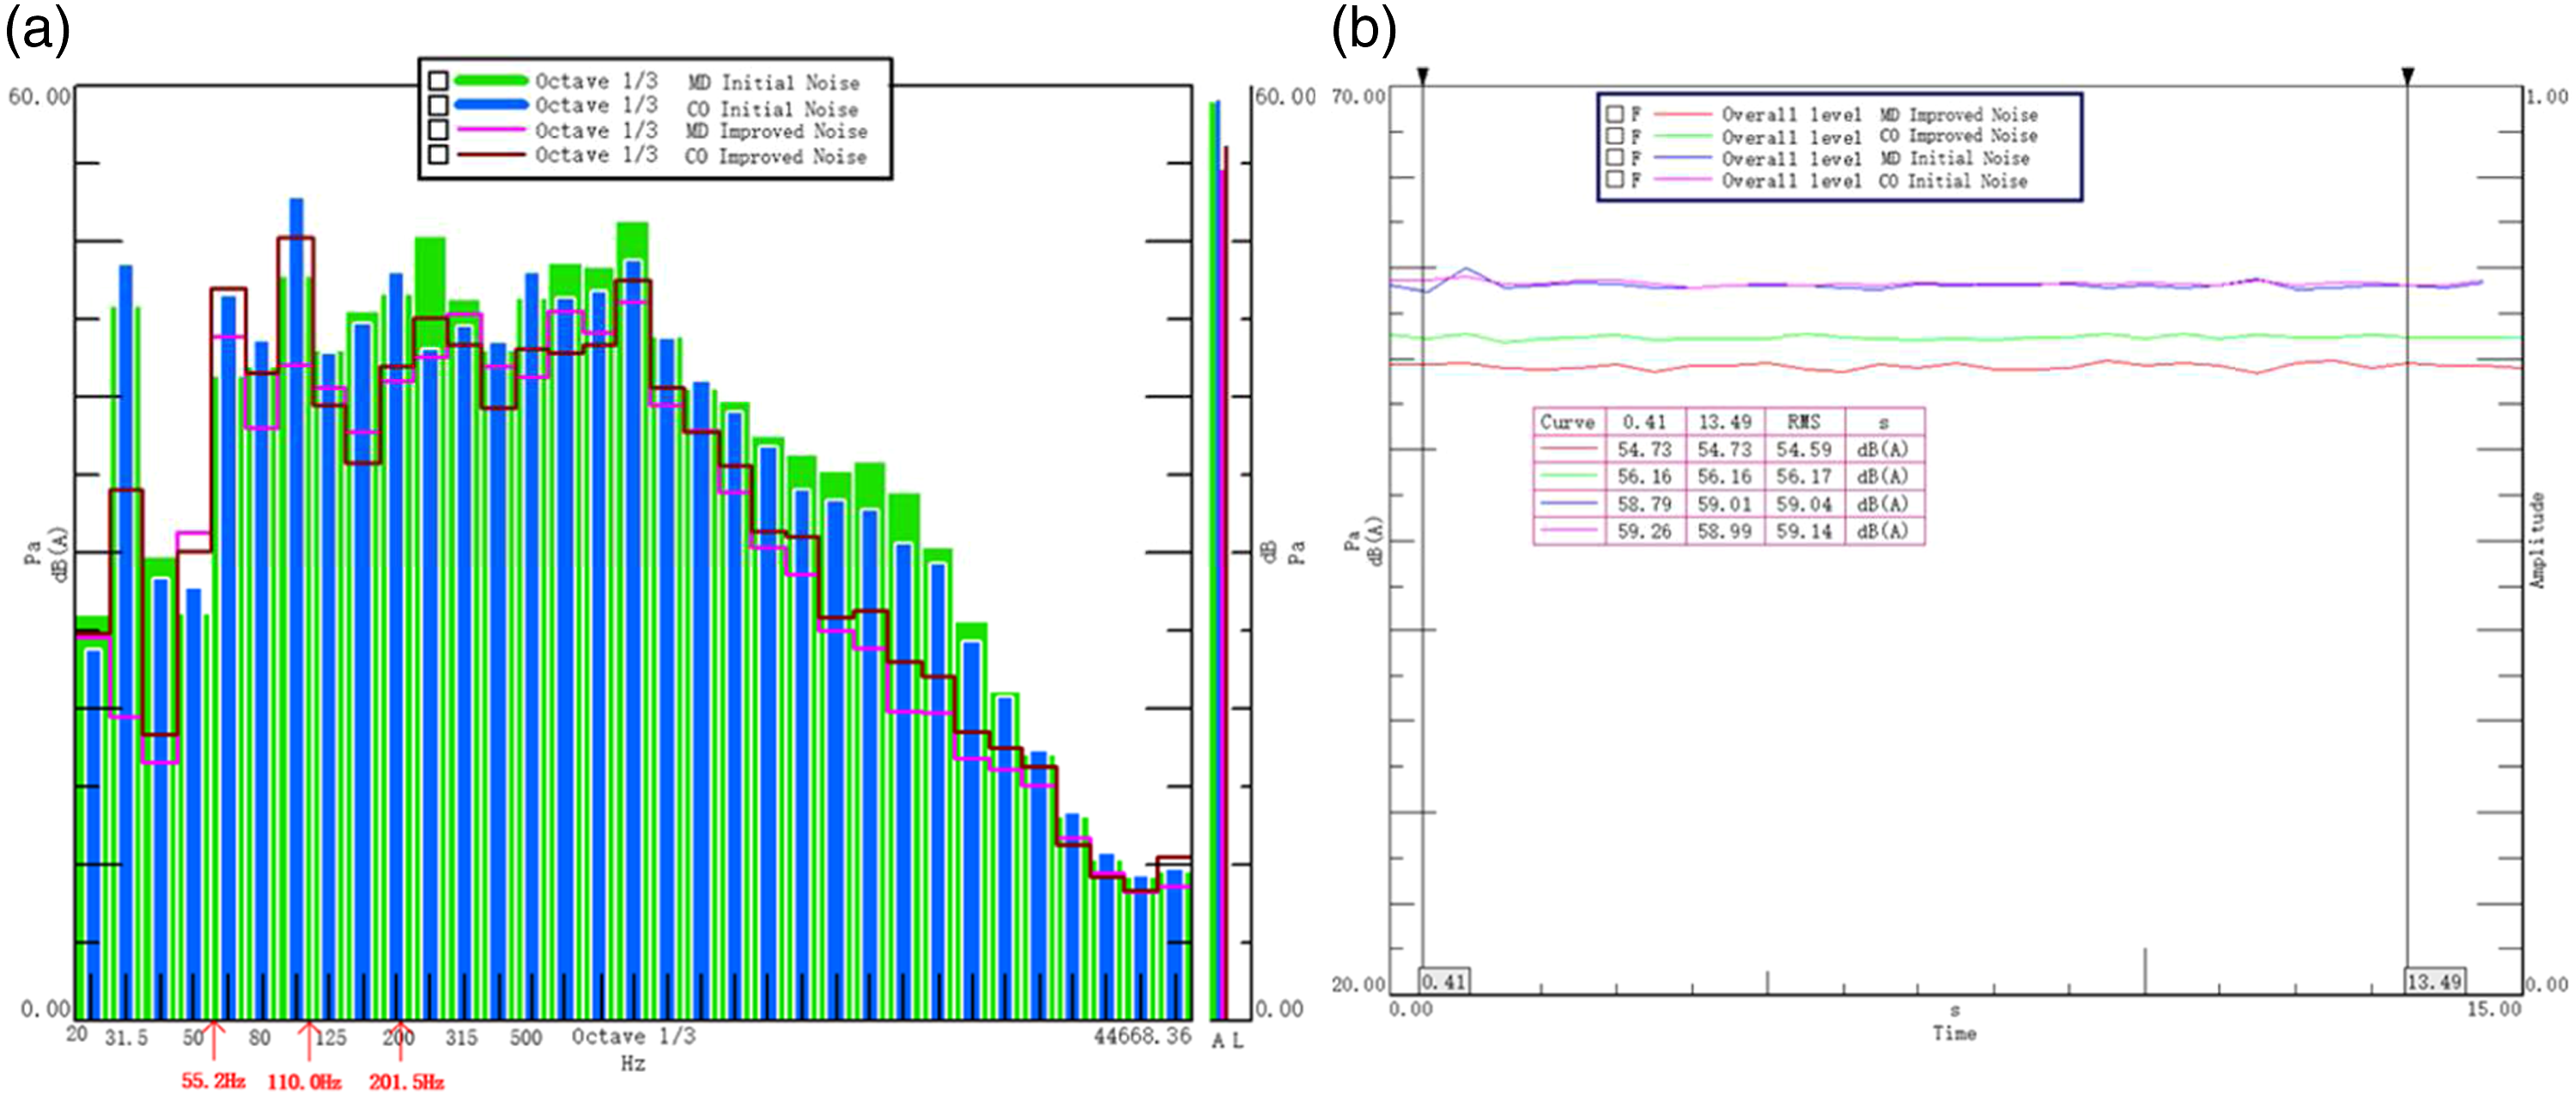
A road test is carried out with above optimization means to verify the feasibility of the method. The LMS equipment is used to collect and analyze the sound pressure signal at the position of driver’s right ear. By comparing the results before and after optimization of the sound pressure of the measuring point, we can see the noise reduction effect after damping treatment. The sound pressure signal is processed by spectrum analysis. The frequency spectrum of the sound pressure signals before and after the improvement is shown in Figure 12. Figure 13 displays the comparison results of the one-third octave power spectrum and overall sound pressure level before and after the improvement. Spectrum diagram of sound pressure level before and after optimization. Comparison diagram of one-third octave power spectrum and overall sound pressure level before and after improvement. “MD” represents the right ear of the main driver. “CO” represents the right ear of the co-pilot. (a) One-third octave power spectrum, (b) overall sound pressure level.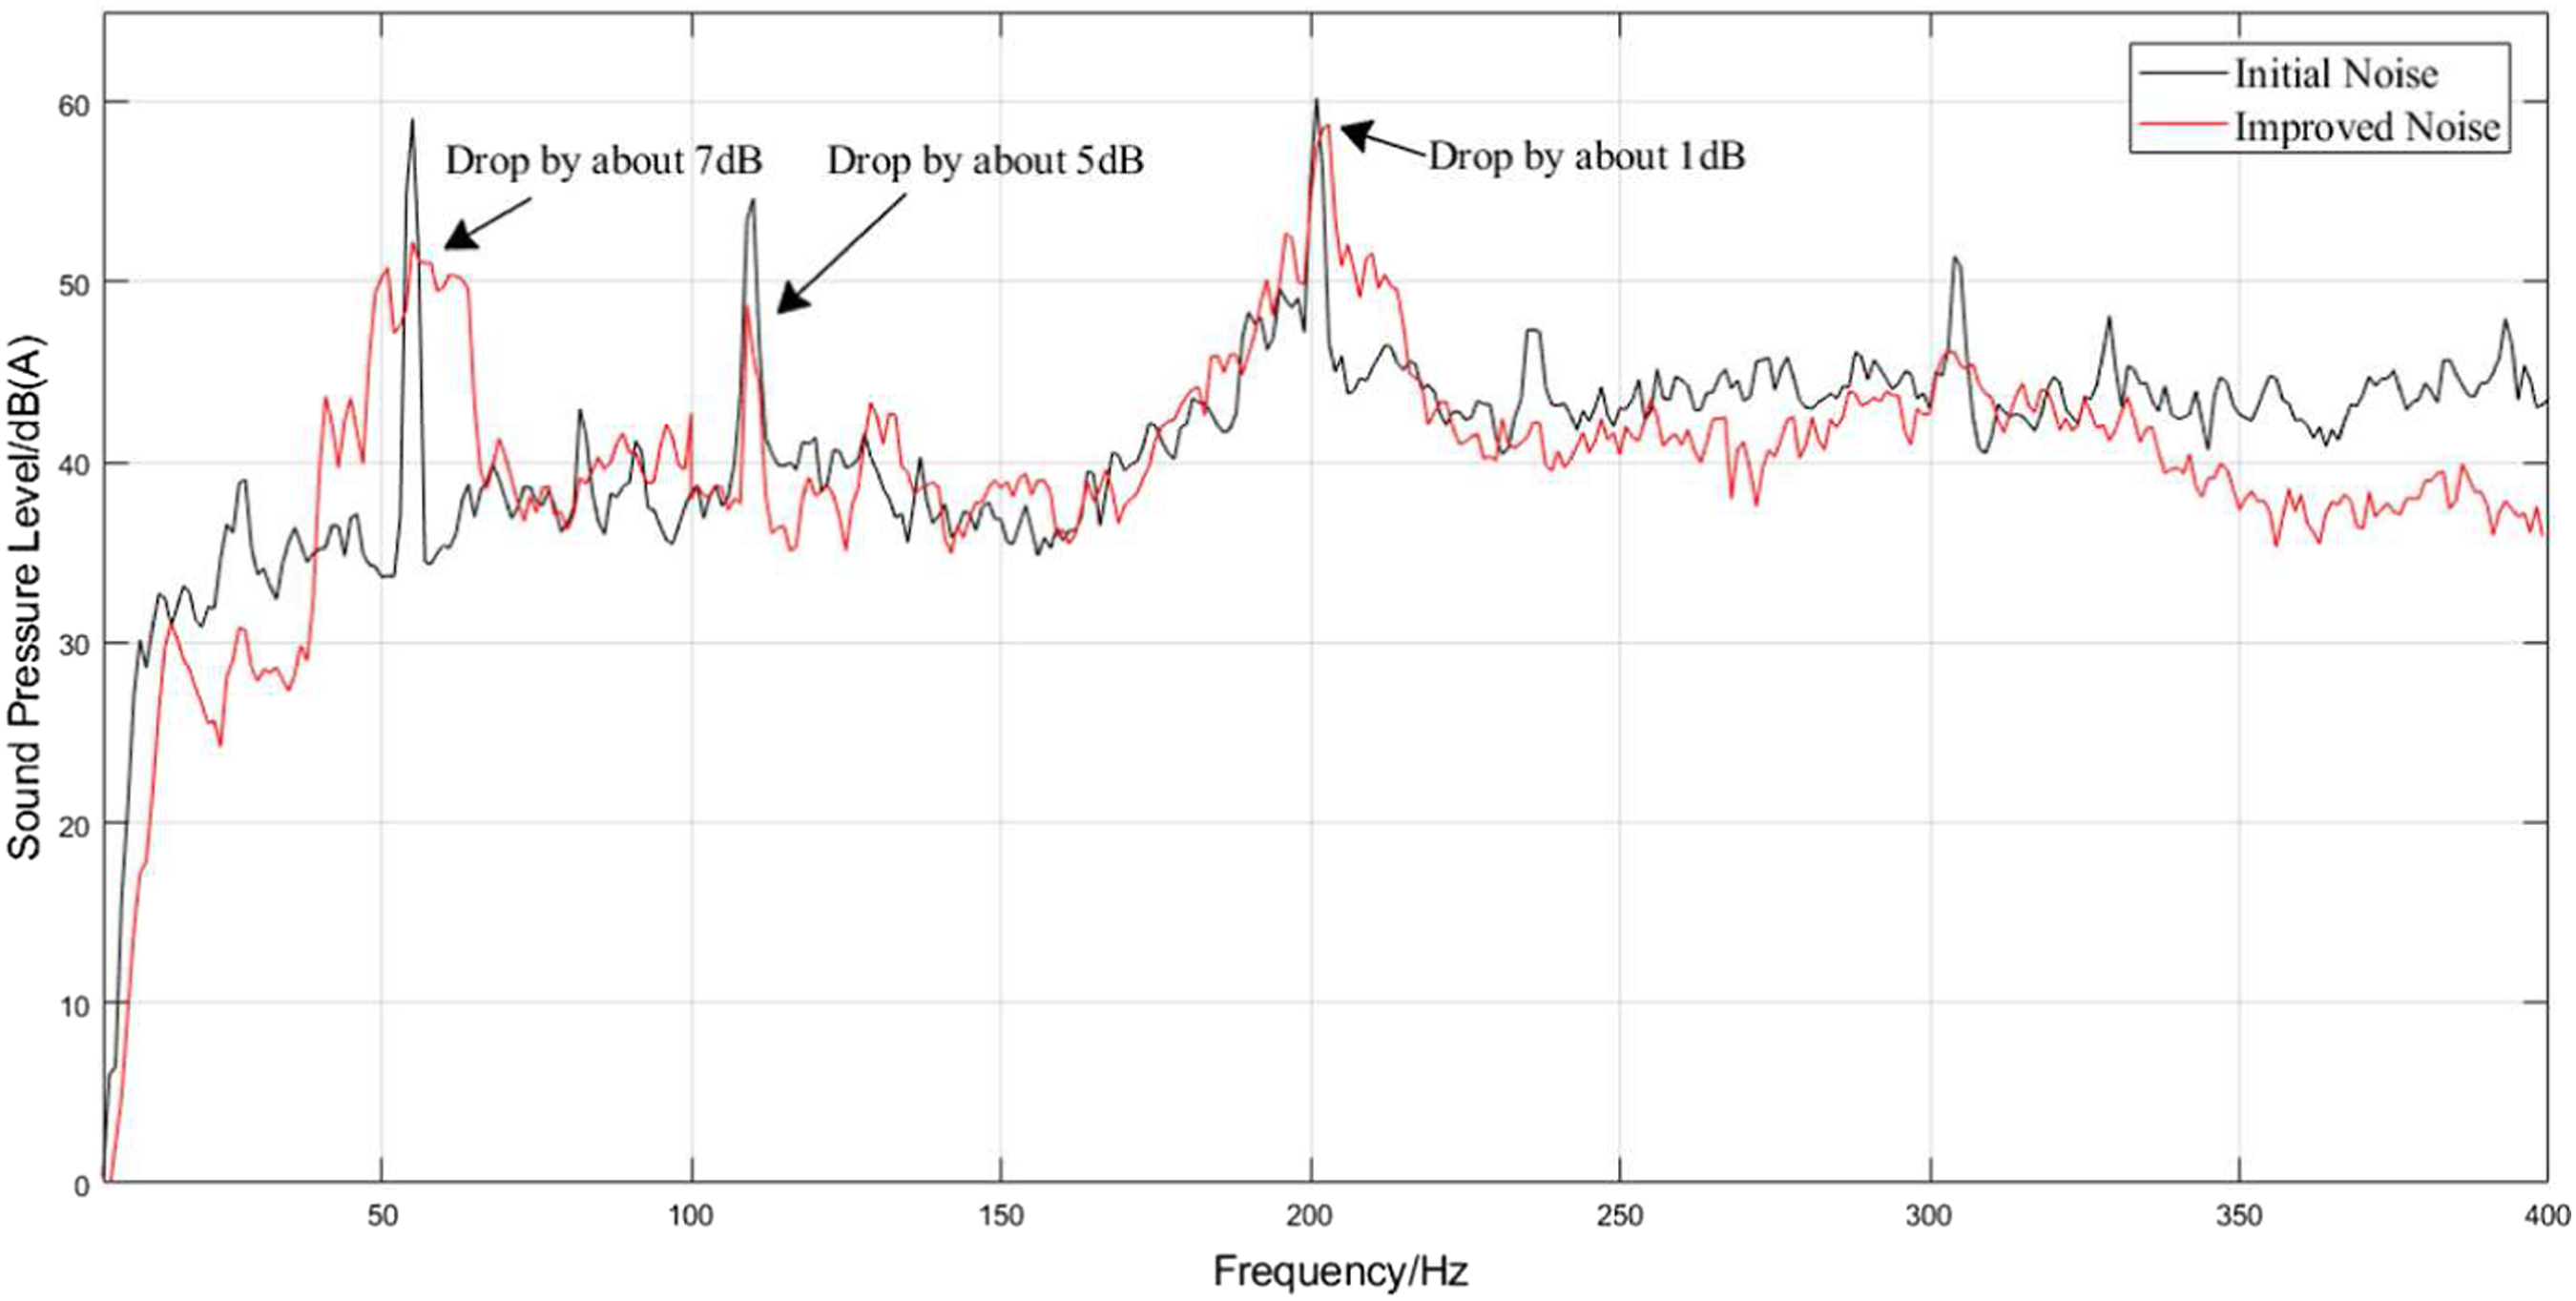
From Figure 12, in the main driving position, the sound pressure at the right ear drops by about
6. Conclusion
In this paper, the method of panel contribution based on wavelet coherence analysis is proposed to analyze the contribution of cab panels. The correlation magnitude and phase relationship between the two unsteady-state signals are obtained. The contribution of different panels to the noise of the measuring point can be found by this method in continuous frequency range. It also solves the problem that traditional methods are not suitable for solving continuous peaks on the time varying state. The effect is significant dealing with multiple peaks of low-frequency noise in the car. By combining with the contribution of sheet metals, the panels that had the largest contribution to the cab noise in the main frequency range are found. The road test shows that the noise level in the cab can be effectively reduced by pasting the damping material on the panels with the largest noise contribution. The effectiveness of this method is verified, and a reasonable noise reduction method in engineering applications is put forward. This paper provide a valuable reference for relationship analysis between different unsteady-state signals.
Footnotes
Declaration of conflicting interests
The author(s) declared no potential conflicts of interest with respect to the research, authorship, and/or publication of this article.
Funding
The author(s) received no financial support for the research, authorship, and/or publication of this article.