
Abstract
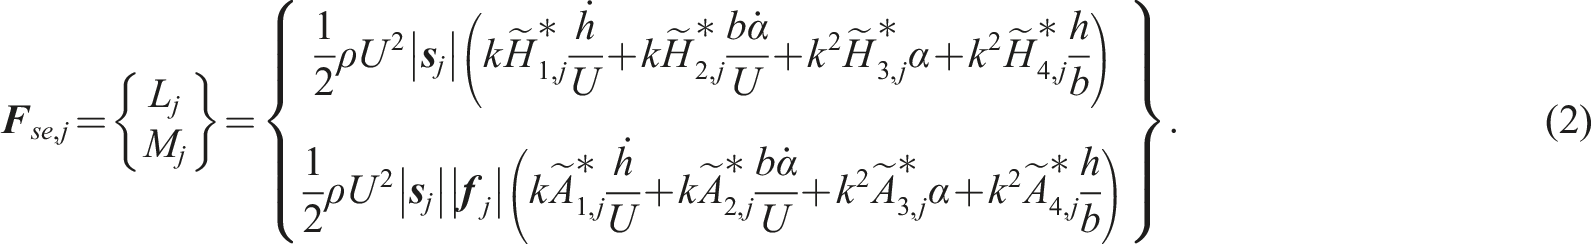
To investigate the influence of the wind attack on a bridge deck’s flutter performance, the concept of “pressure flutter derivatives” was introduced as a part of the “distributed aerodynamic characteristics” method, which can be used to visualize the dominant fluctuations of the pressure field. The distributions of the aerodynamic damping and stiffness under different wind attack angles were visualized, instead of using an overall force perspective. The analysis was carried out through two-dimensional computational fluid dynamics simulations based on a typical box deck section. Necessary data were obtained through the forced vibrations of the deck. The dominant pressure fluctuations were demonstrated, around which the wind attack angles’ impact on the Scanlan flutter derivatives was discussed. For the deck section used in this study, the wind attack angle was found to most affect the windward parts of the deck. When wind attack angle ranged from
Keywords
1. Introduction
Flutter is an aerodynamic instability phenomenon. Scanlan and Tomko (1971) developed a formula that contained eight parameters named flutter derivatives to describe the wind force acting on the bridge deck. Miyata and Yamada (1990) investigated the coupled flutter oscillations of a very-long-span bridge by using a complex eigenvalue analysis. Iwamoto and Fujino (1995) proposed a method based on the extended Kalman filter (EK-WGI method) to distinguish the eight parameters, which simplified the procedure significantly. Based on flutter derivatives, various researchers have studied the flutter mechanism of the bridge. Agar (1989) proposed a method to calculate the flutter’s critical wind speed, considering multiple degrees of freedom (DoFs). Ge and Tanaka (2000) introduced a multi-mode approach and a full-mode approach to calculate the flutter speed and frequency. Yang et al. (2007) introduced a two-dimensional three-degree-of-freedom method, and they investigated the flutter mechanism through comparisons of the aerodynamic damping and stiffness. Chen and Kareem (2006) derived closed-form solutions of the bimodal flutter, which could improve the understanding of a bimodal coupled flutter. Based on the closed-form solutions of the bimodal flutter, Li et al. (2019) introduced a concept of “surface flutter derivatives” as a part of the “distributed aerodynamic characteristics” method, to analyze the contribution from the girder’s surface to the modal characteristics. Based on this method, the control mechanism of a central stabilizer was studied.
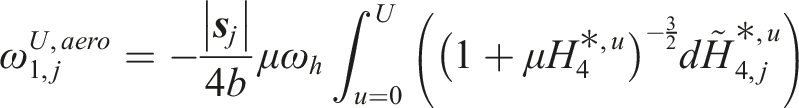
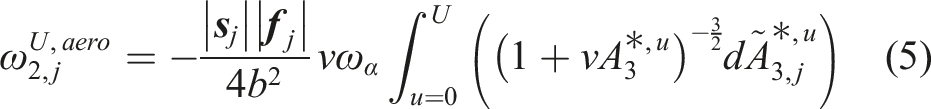
As for the research on the wind attack angle effect, Ouyang and Chen (2015) studied the change of the flutter’s critical wind speed with varying wind attack angles. Tang et al. (2017) experimentally investigated the flutter characteristics of a bridge deck at large wind attack angles, pointing out that the flutter was mainly controlled by the torsional mode. Li et al. (2018) discovered that the flutter of a flat box girder is dominated by the branch of the torsional mode when the angle is in the range of 0°–5°. Tang et al. (2019) discovered that vortices formed at the windward edge become larger with increasing wind speed. Wu et al. (2020) found that the flutter index is stable when the reduced wind speed is less than 6 and the wind attack angle is less than 3°.
As mentioned above, several effective methods have been created to analyze the total effect of the aerodynamic force in the flutter process. In this study, detailed information about the wind attack angle’s influence on the characteristics of the self-excited force and the flutter stability were revealed. First, a novel concept of “pressure flutter derivatives” was proposed to provide intuitive information about the dominant pressure fluctuations of the deck’s surrounding flow field. Combined with the previous surface flutter derivatives, a complete routine of the “distributed aerodynamic characteristics” method was established. Computational fluid dynamics (CFD) simulations were performed based on a typical bridge box deck. The figures of the pressure flutter derivatives were analyzed to understand the wind attack angles’ influence on the Scanlan flutter derivatives. Finally, the wind-induced changes of the modal damping and modal frequencies were visualized to explore the wind attack angle’s impact on the flutter stability. With these steps, a typical routine for applying this method to investigate the impact of the wind attack angle was demonstrated.
2. Theoretical derivations
Li et al. (2019) once proposed a concept of “surface flutter derivatives” to allocate the aerodynamic characteristics to the surface of an object, but how the surrounding pressure field contributed to the flutter stability was not mentioned. Therefore, a novel concept of “pressure flutter derivatives” was proposed in this study, which was used to build a connection between the pressure field’s fluctuations and the flutter characteristics.
Figure 1 shows the cross-section of a bridge deck with two DoFs: vertical and torsional. Displacements of these two DoFs are denoted as Positive directions of the forces, displacements, and wind velocity.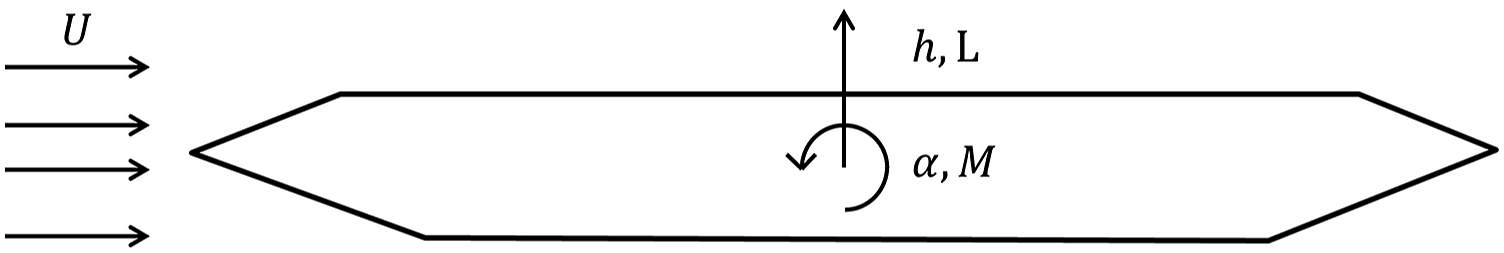
In quasi-steady theory, the relationship between the body’s oscillation state and the fluctuating pressure field depends only on the shape of the deck. Since the dominant fluctuation of the flow field is stimulated by the vibration of the bridge deck, the pressure’s fluctuations can be decomposed based on the deck’s motion. The pressure flutter derivatives are denoted as

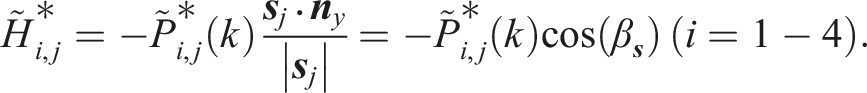
It is possible to calculate the surface flutter derivatives directly from the pressure flutter derivatives, as follows
Vector Demonstration of the vectors used to calculate surface flutter derivatives.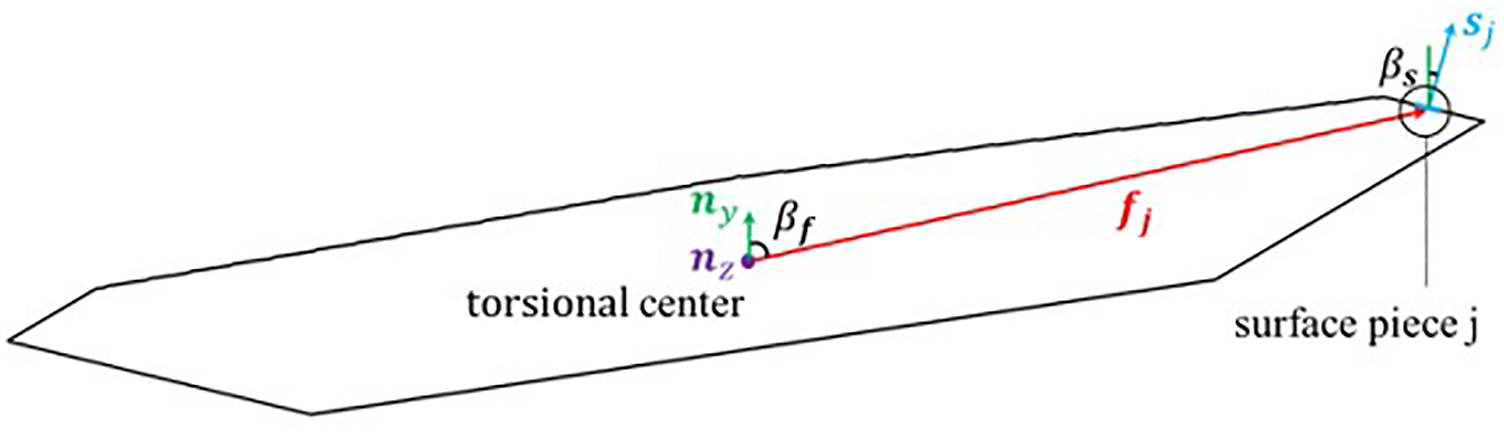
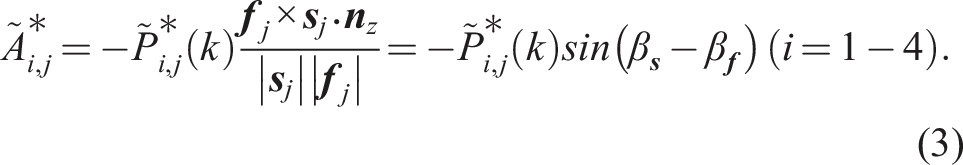
The deck section is assumed to be in the x–y plane.
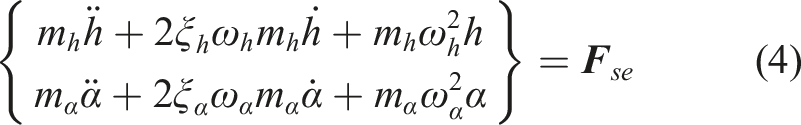
The kinetic expression of the bimodal system shown in Figure 1 is equation (4). The mass, structural damping ratio, and modal circular frequency are, respectively, denoted as
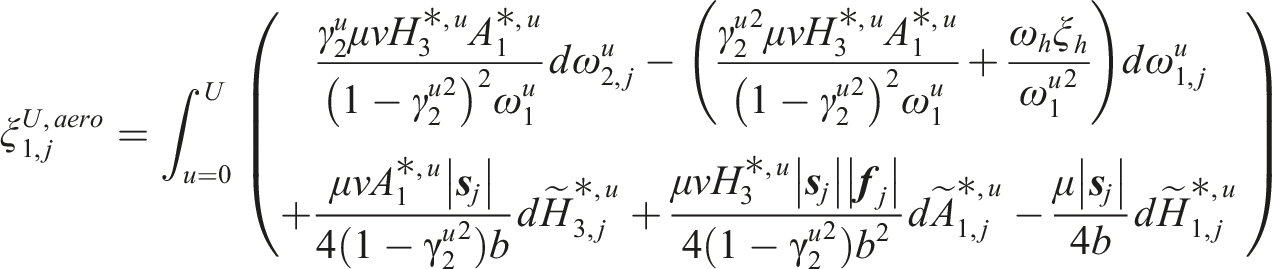
The wind-induced change of the damping ratios at the wind speed
Finally, the overall framework of the “distributed aerodynamic characteristics” method is demonstrated in Figure 3. Demonstration of the “distributed aerodynamic characteristics” method.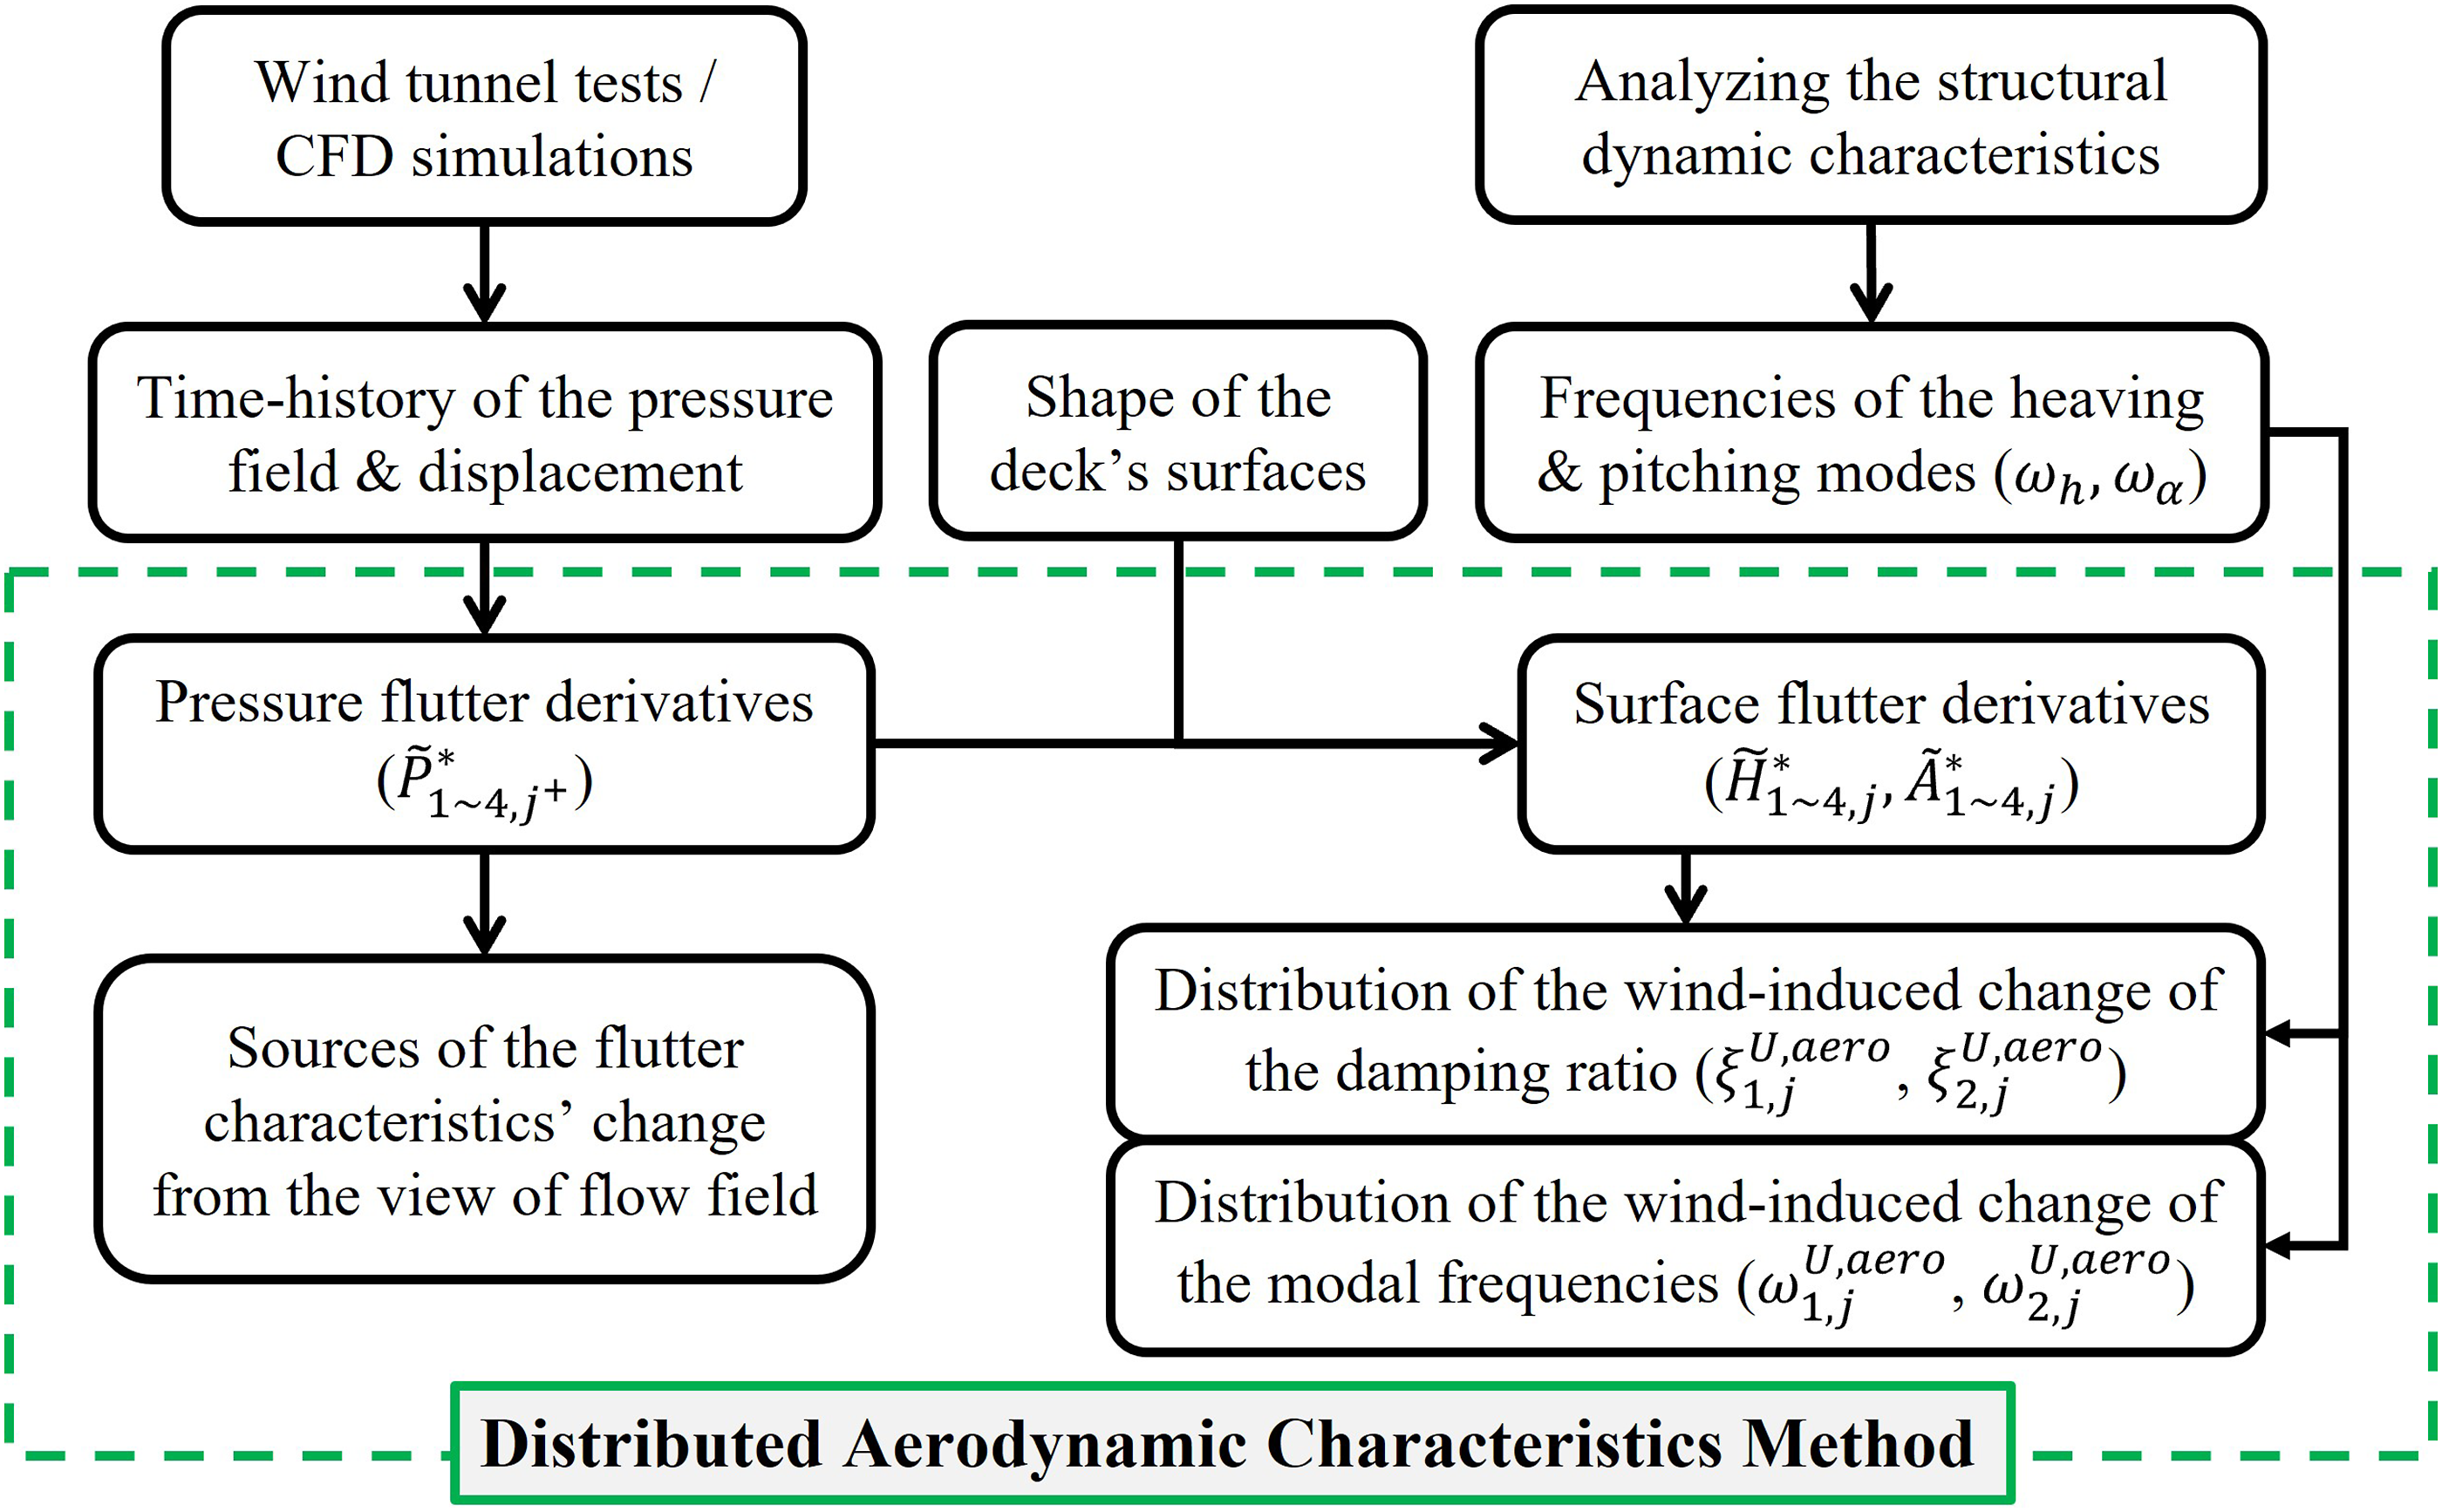
3. Settings of the calculation domain
A typical box deck of the Great Belt East Bridge (GBEB) was used as the basic case in the numerical examples. From the view of methodology study, the construction status without handrails were considered in this manuscript. The computational domain (shown in Figure 4) was with a blockage ratio of 0.95%. To avoid grid distortion near the deck surface during the oscillation process, three computational regions were defined (De Miranda et al., 2014; Patruno 2015). The details of the final mesh and corresponding Sketch of the two-dimensional (2D) computational domain. Detailed demonstration of the computational grid within the rigid zone.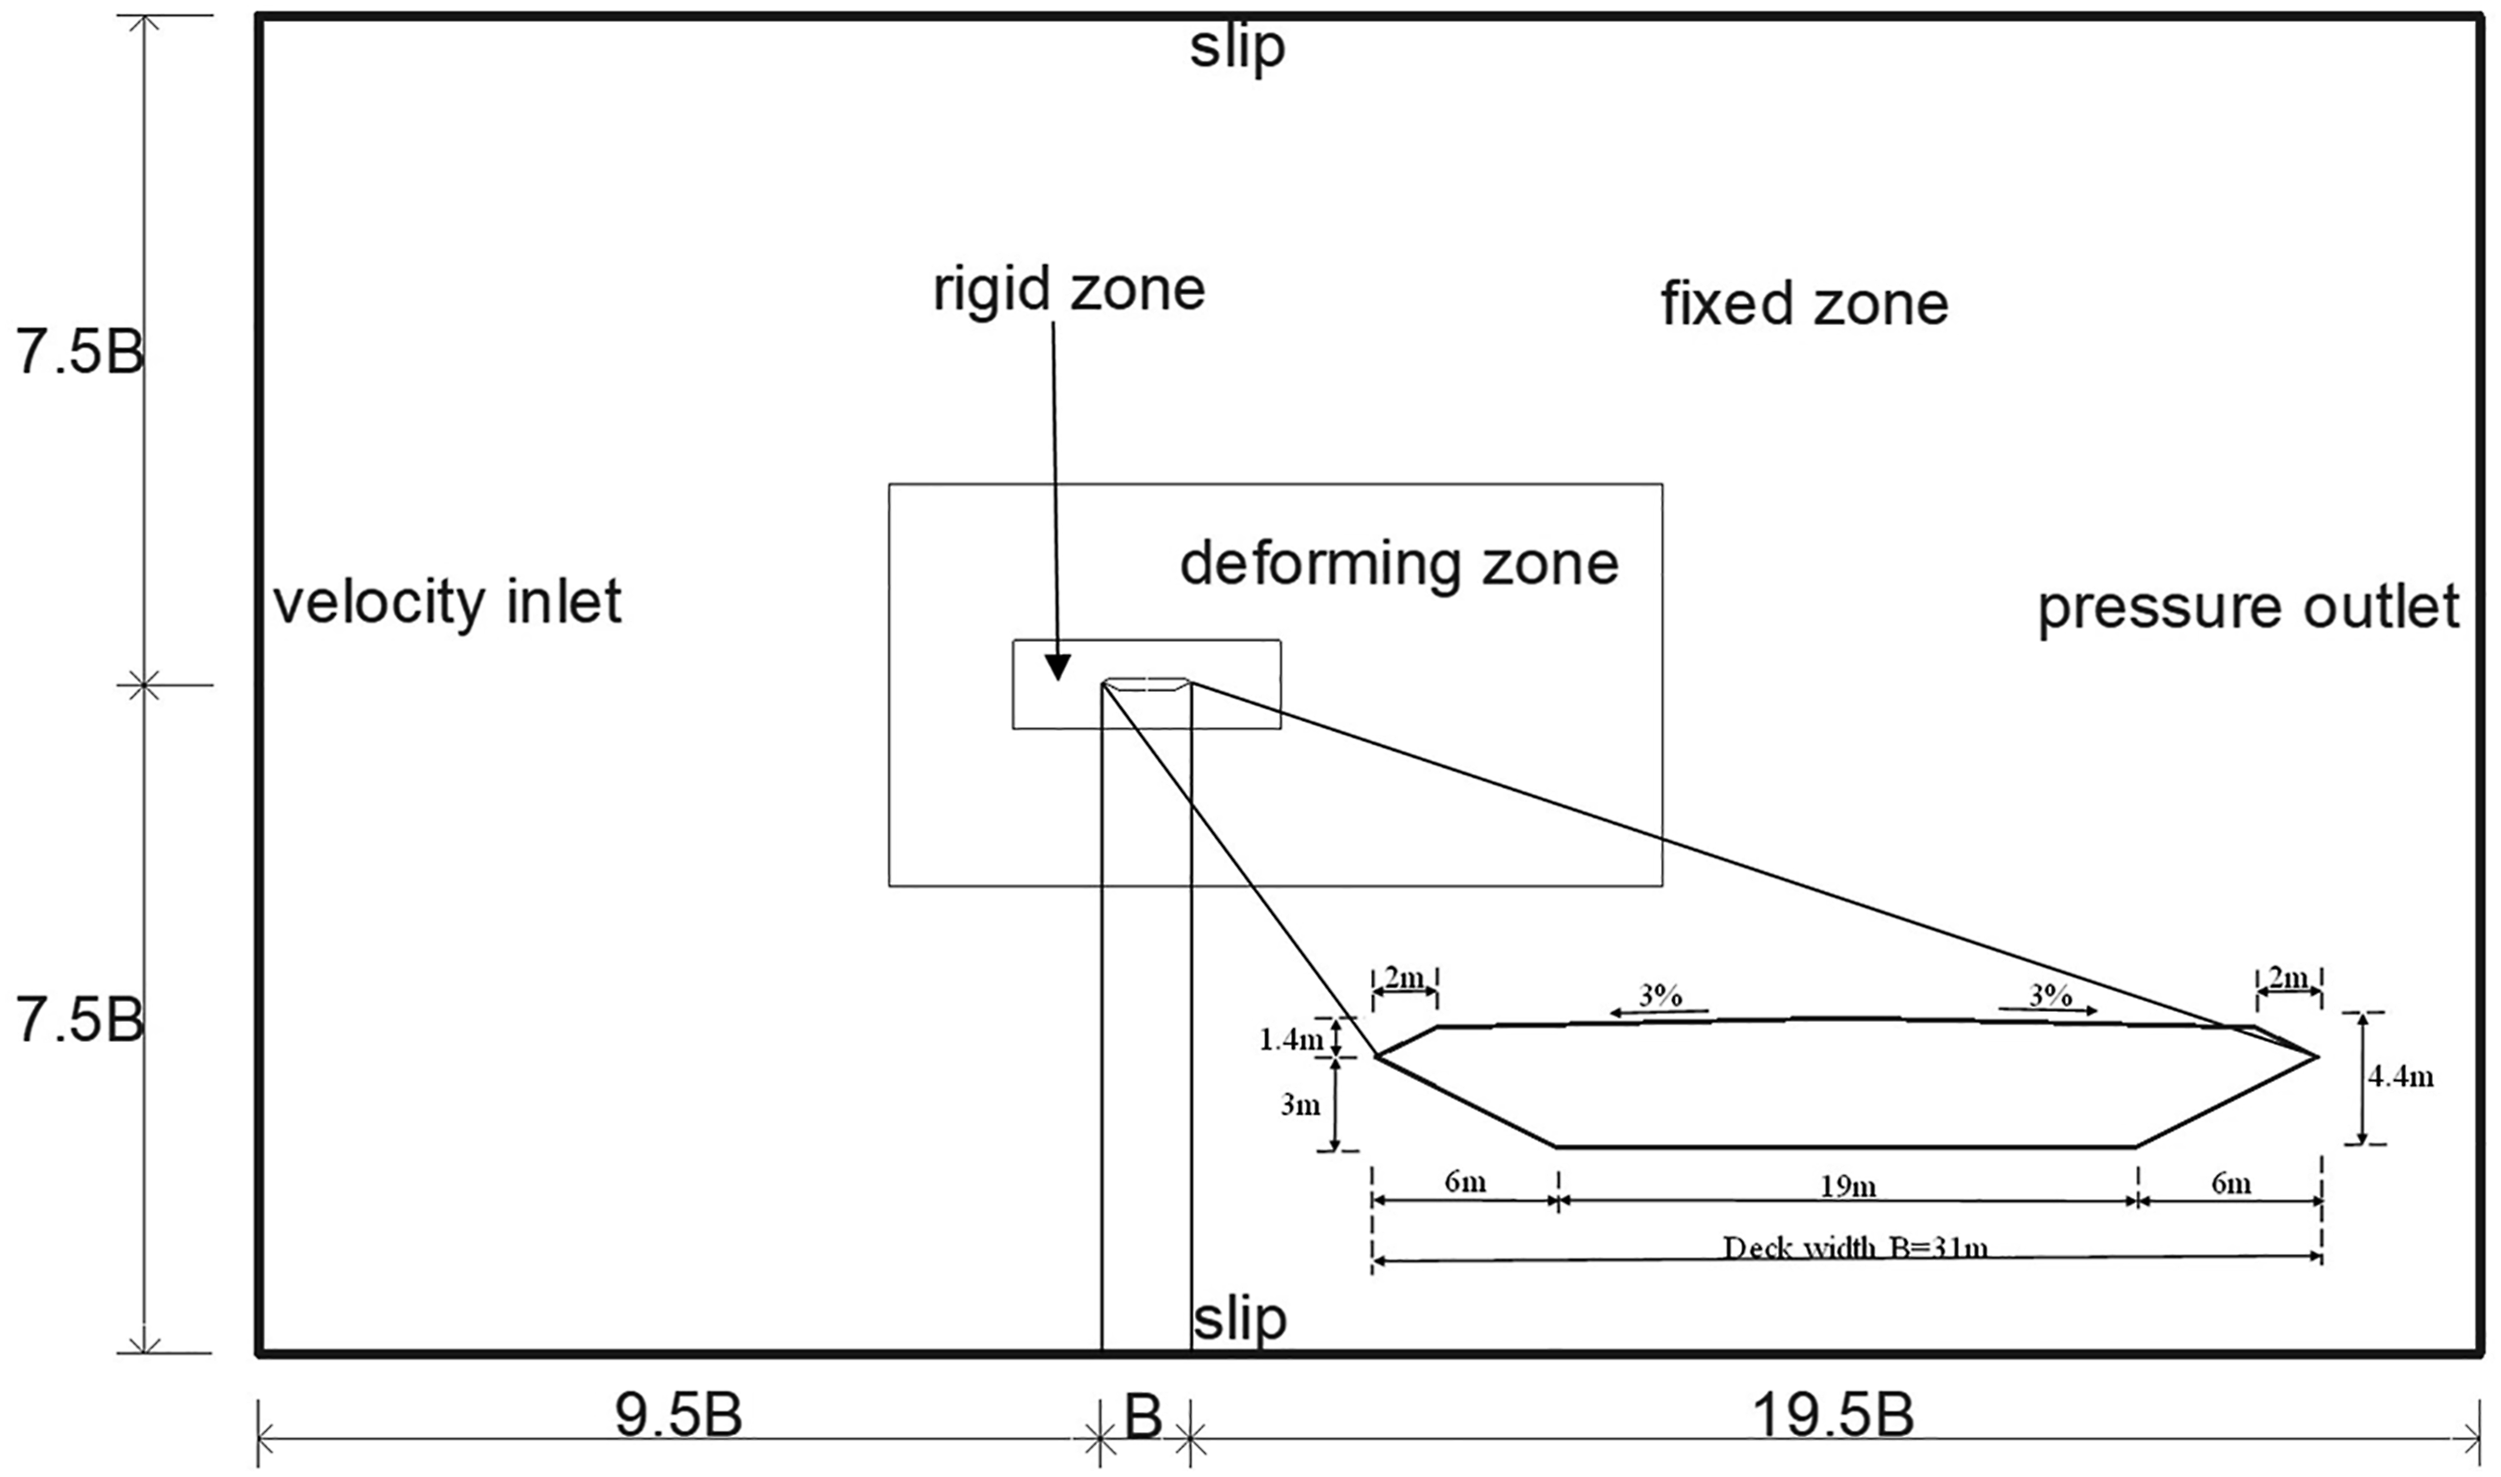
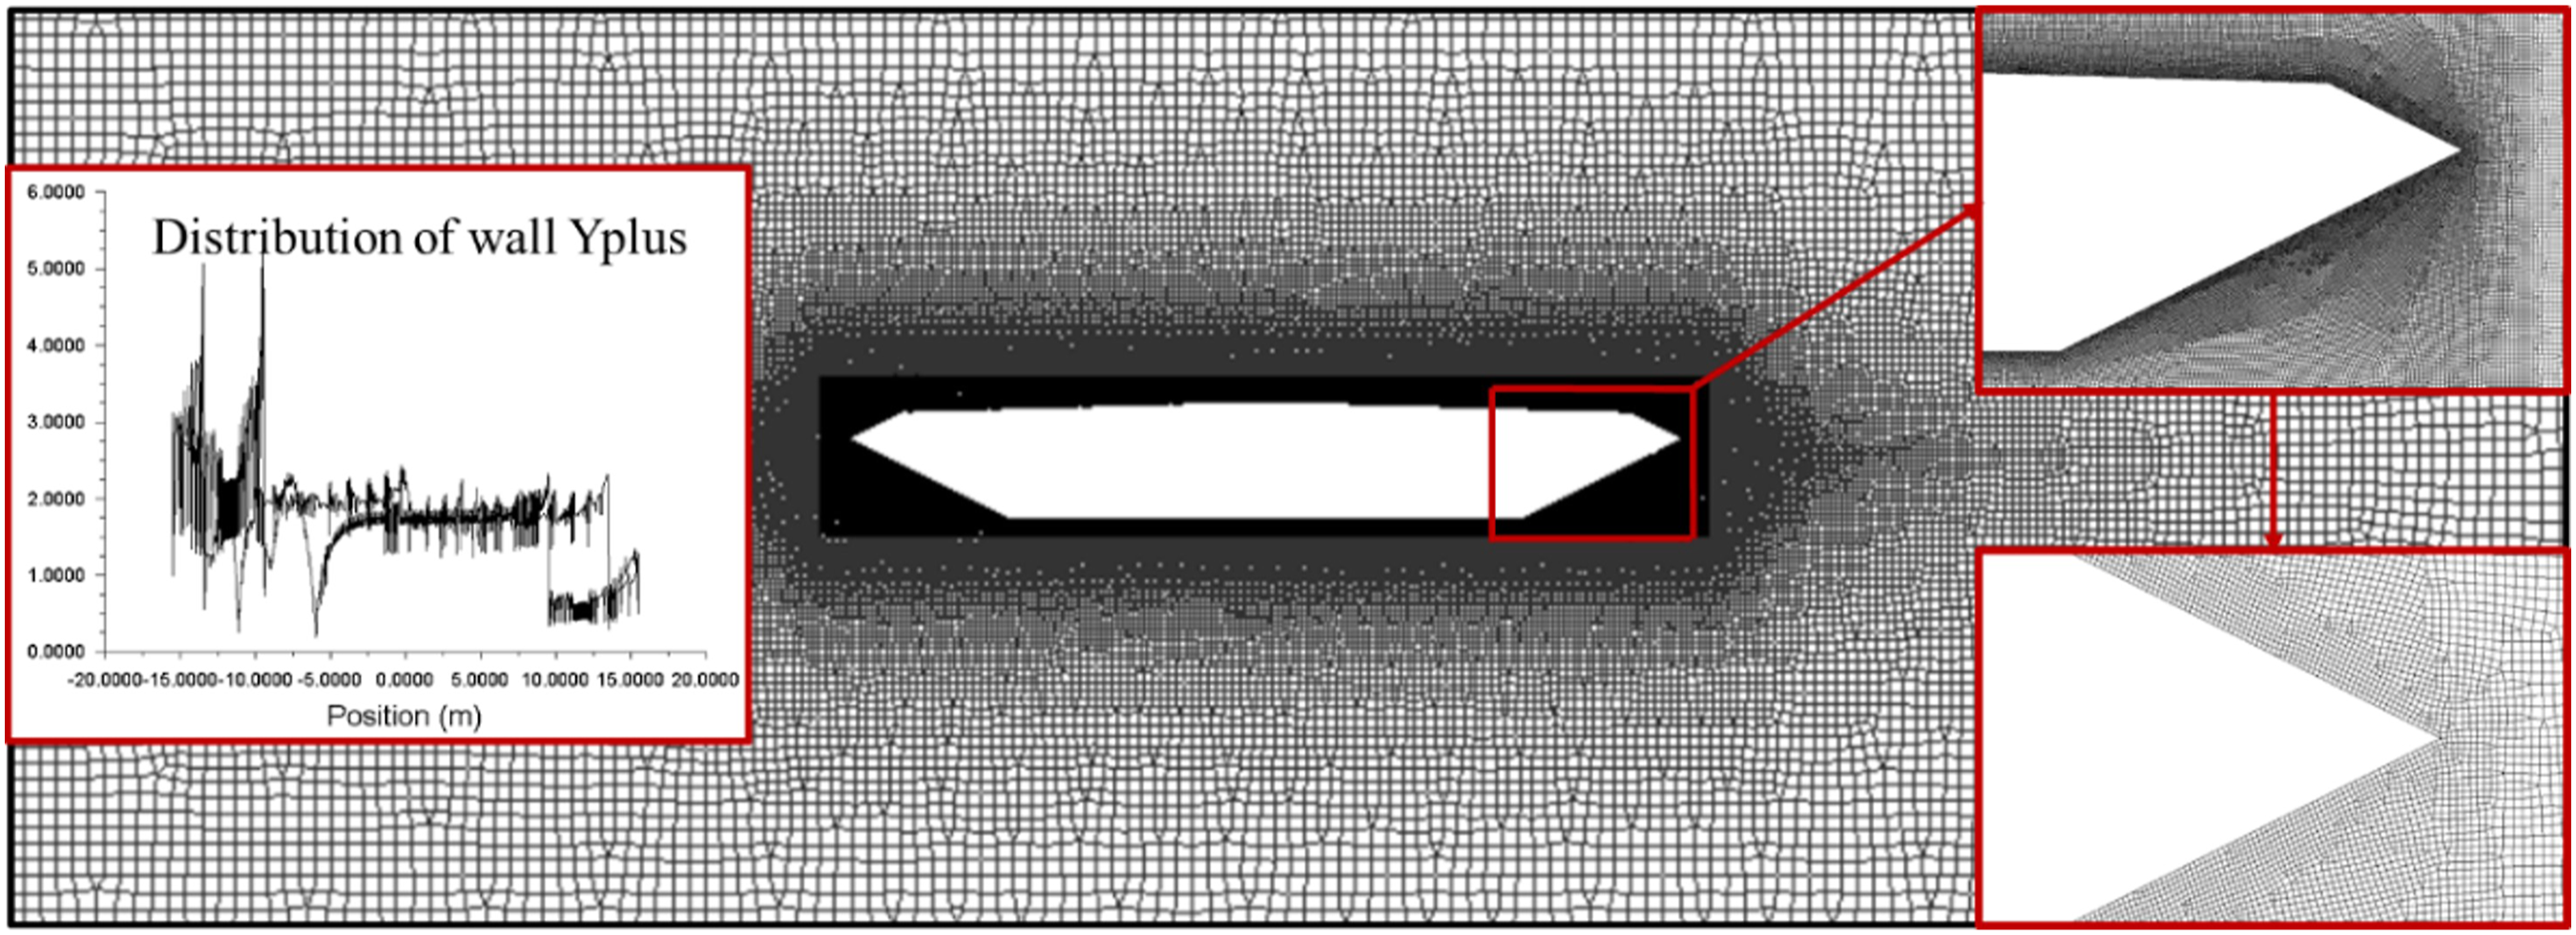
For the real bridge flutter problem, the Reynolds number (
The simulations were conducted using Ansys Fluent. The semi-implicit method pressure-linked equations consistent (SIMPLEC) algorithm was used to solve the velocity–pressure coupling problem. To obtain the appropriate numerical accuracy and stability, a second-order scheme was used for the pressure equation, and the second-order upwind scheme was used for the momentum equation, turbulent kinetic energy equation, and specific dissipation rate equation. The inlet boundary was set as a velocity inlet, the incoming turbulence intensity was set as 4%, and the viscosity ratio was set as two. The outlet boundary was set as a pressure outlet. The inlet wind speed was set as
4. Validations
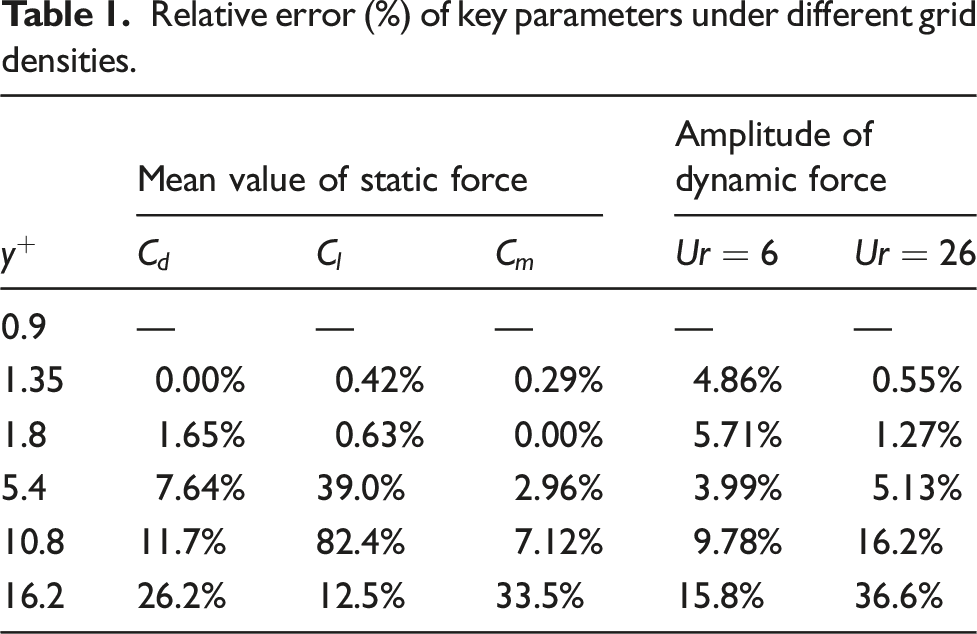
Relative error (%) of key parameters under different grid densities.
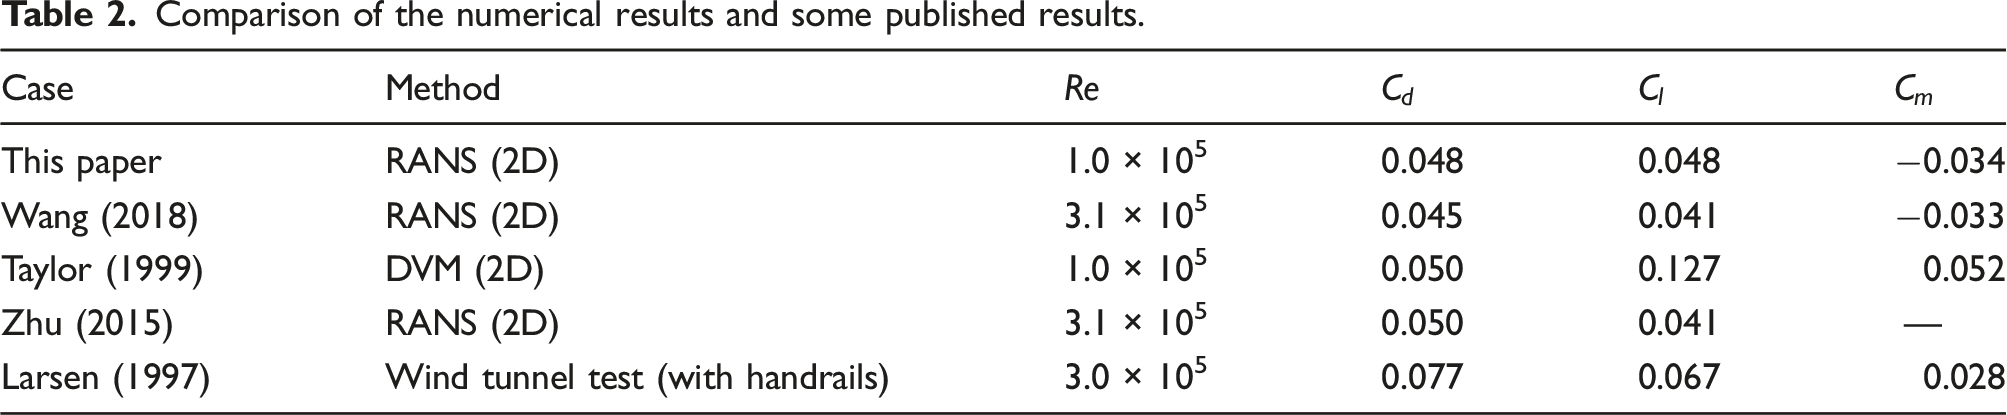
Comparison of the numerical results and some published results.
For the dynamic case, the validation was carried out in two steps. First, the Scanlan flutter derivatives were directly compared to wind tunnel test results. However, as most papers did not present the Scanlan flutter derivatives without handrails, this comparison was not sufficient. As shown in Figure 6, (a, b) Extracted Scanlan flutter derivatives compared to experimental values (with handrails).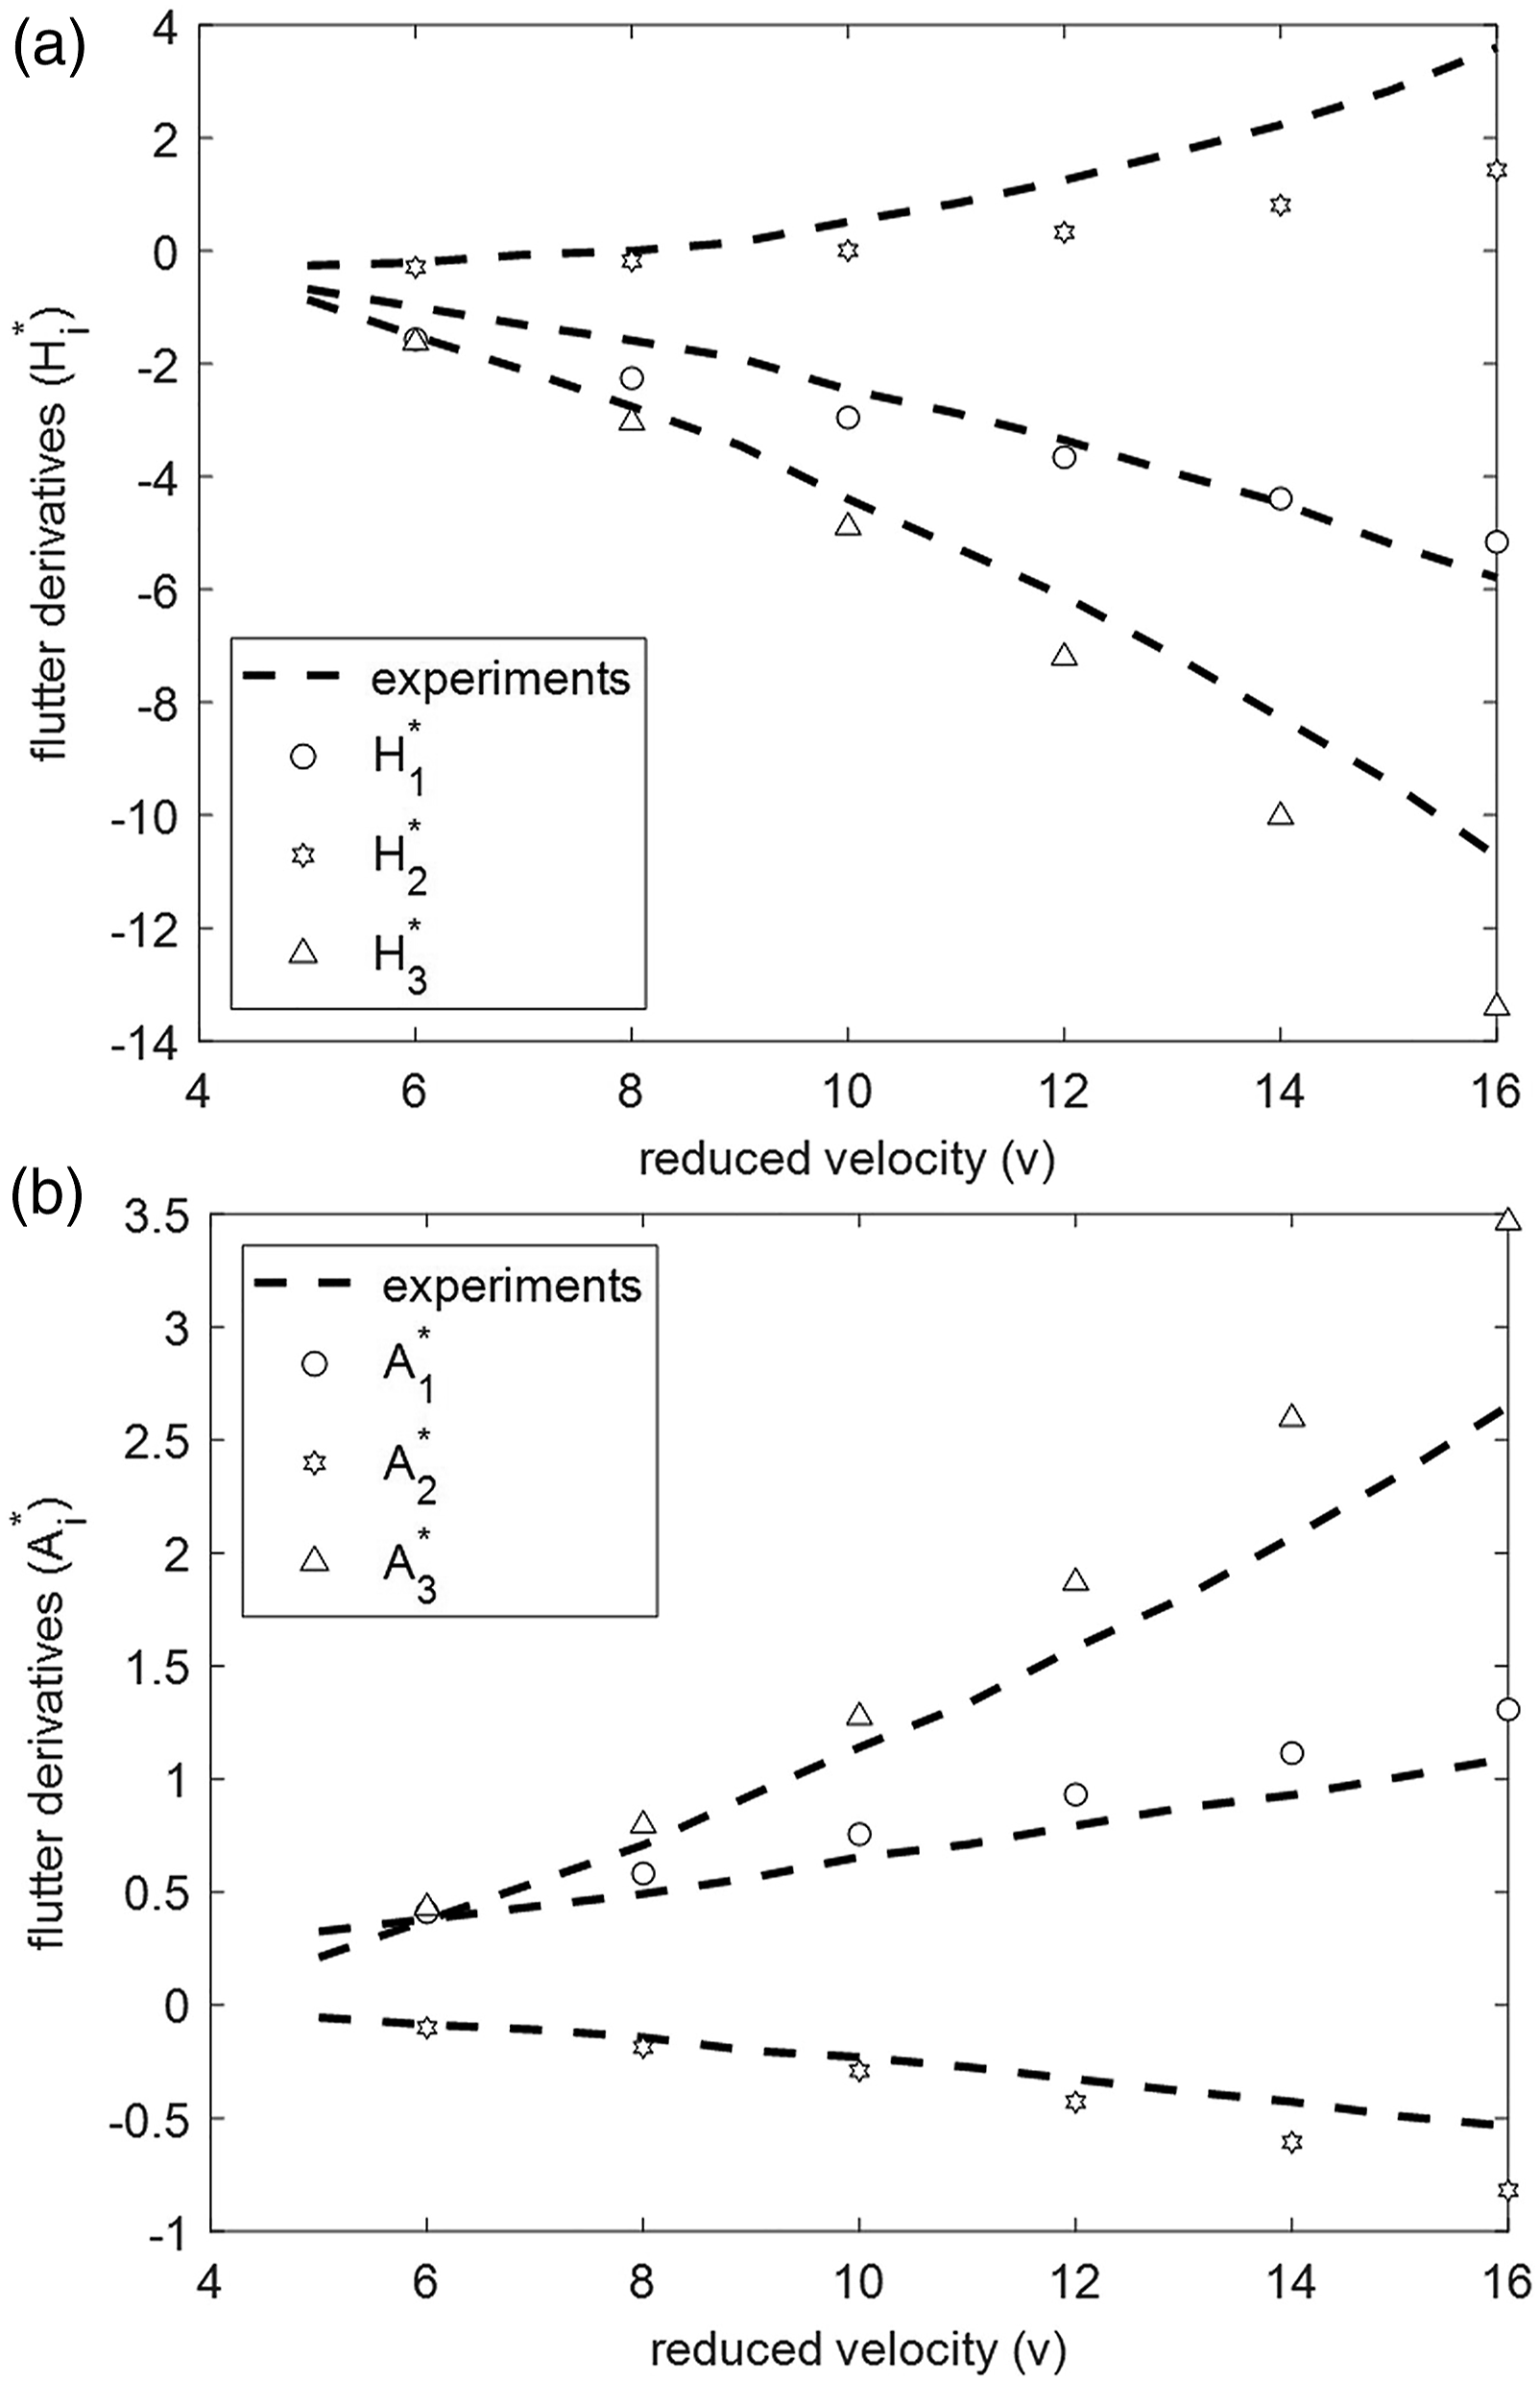
Dynamic characteristics of the Great Belt East Bridge (GBEB).
5. Distribution of pressure flutter derivatives
Case parameters of the forced vibrations.
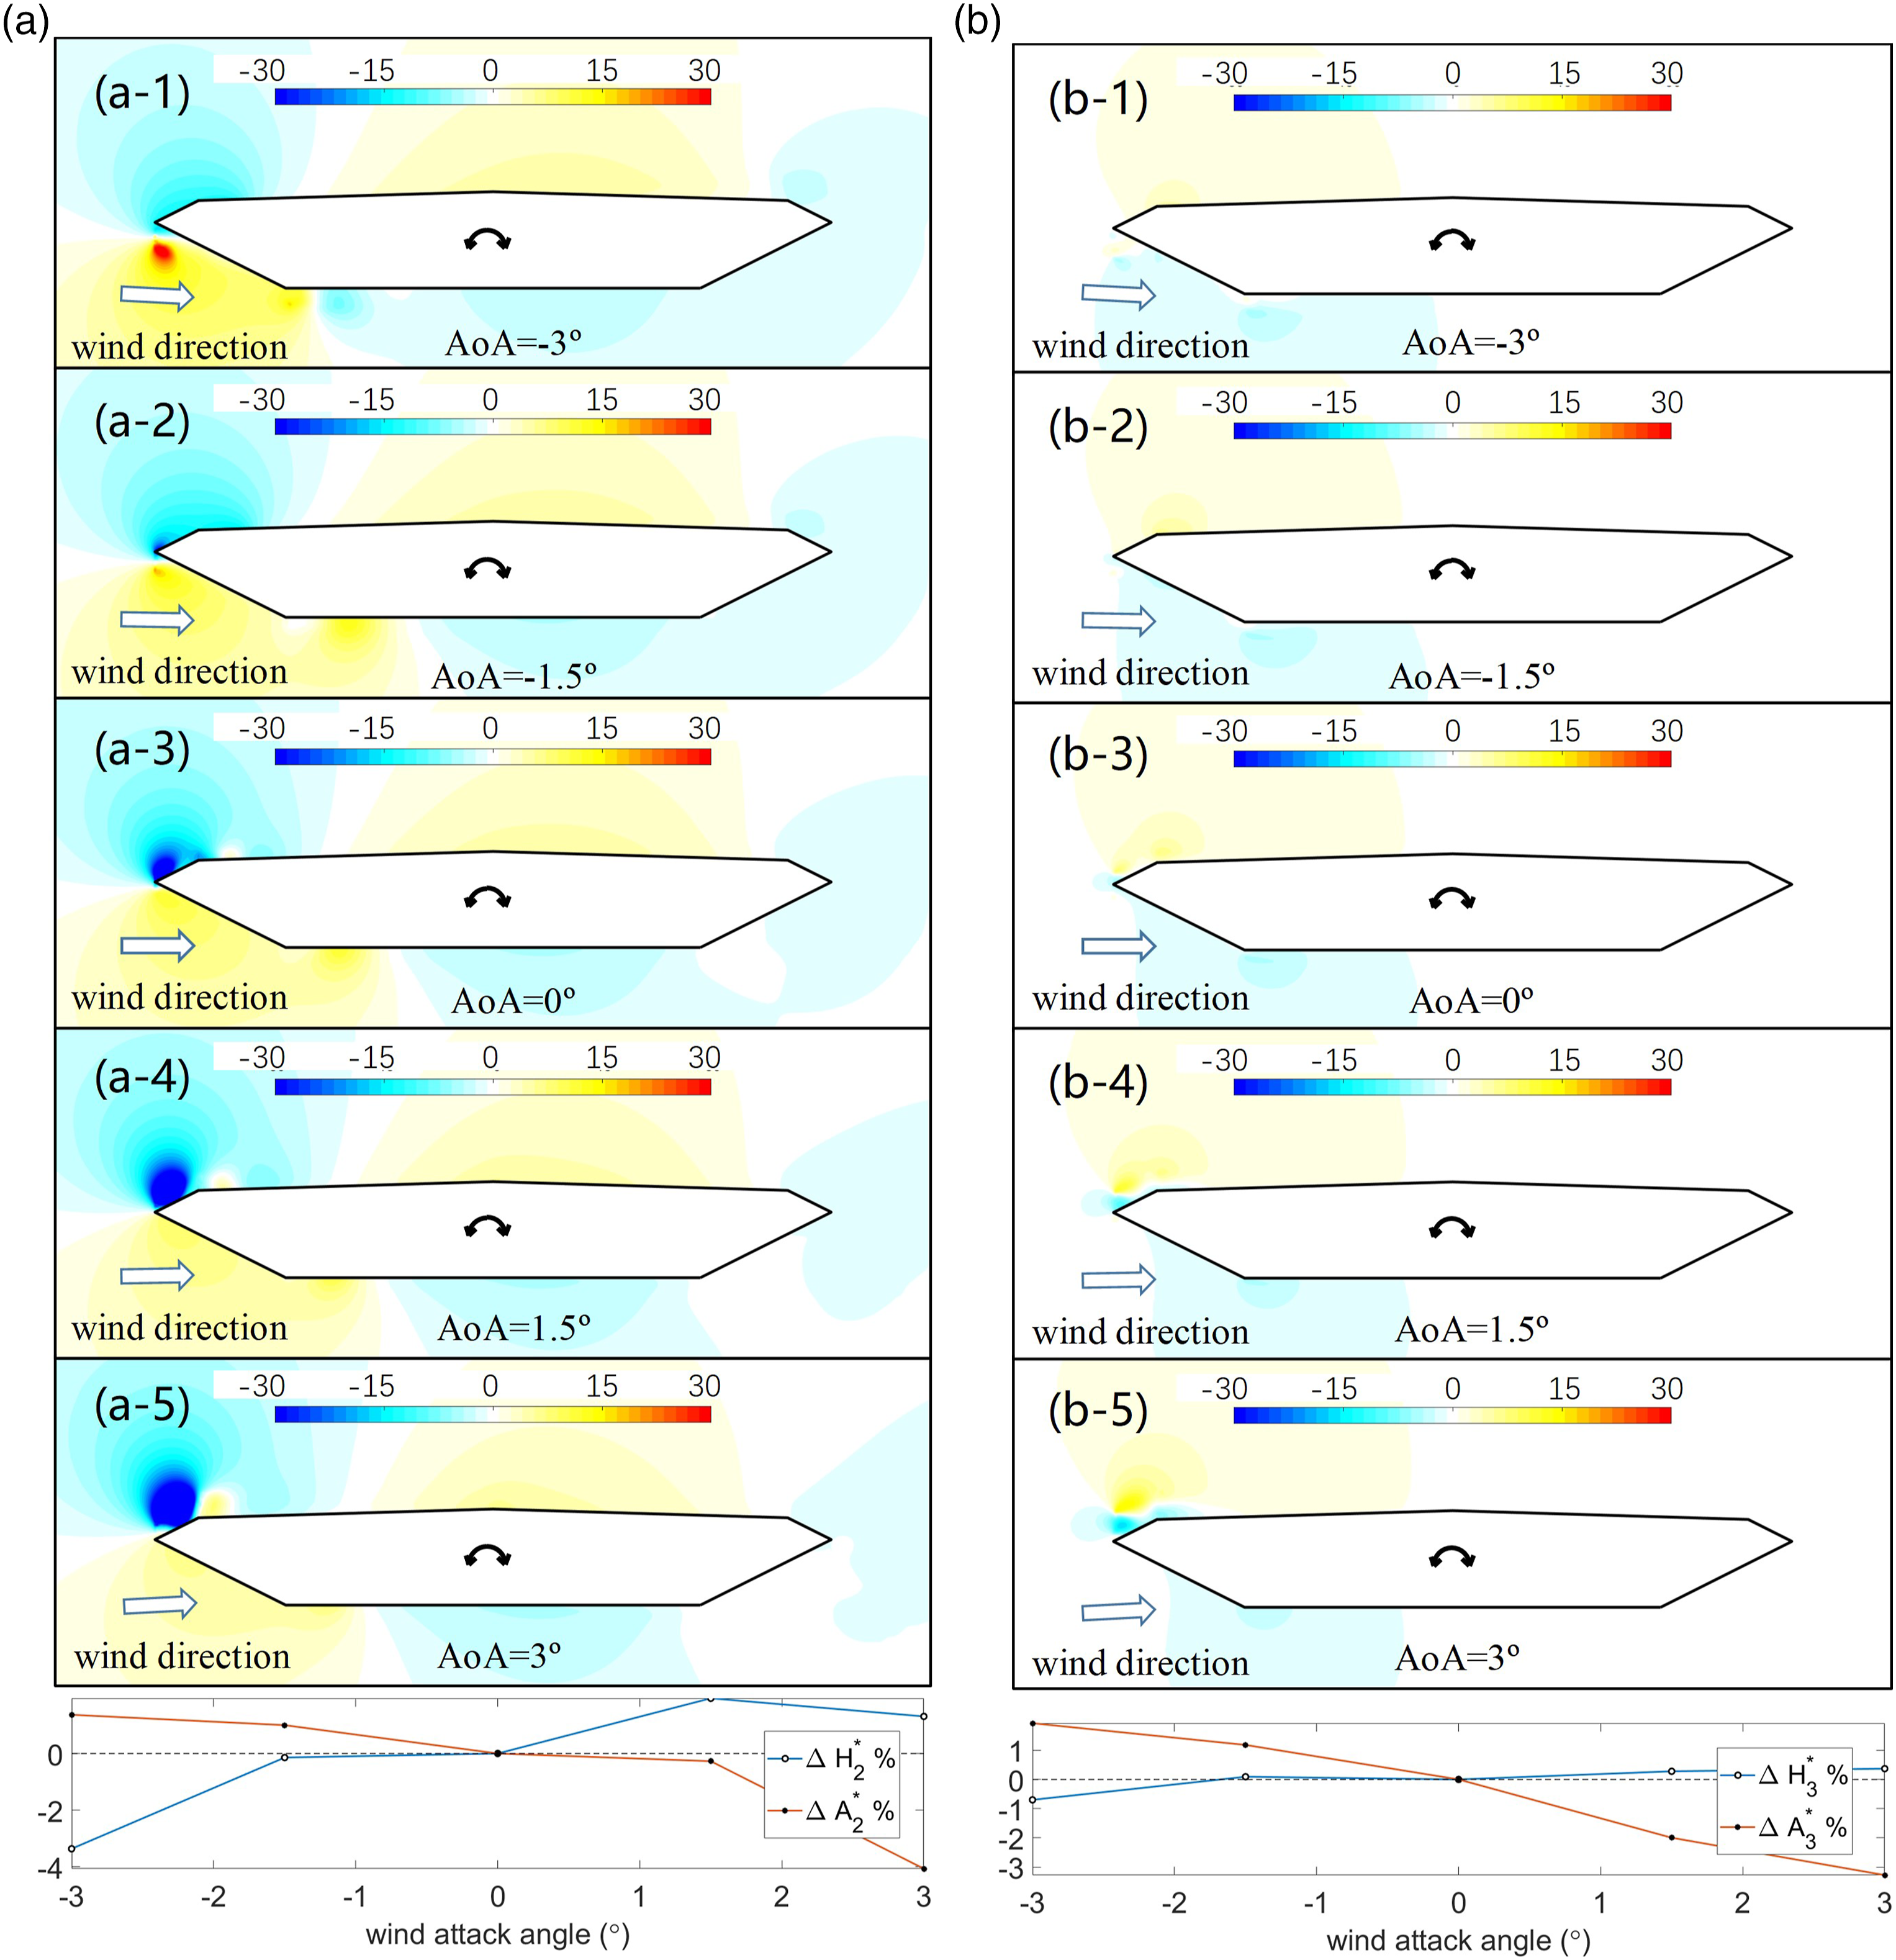
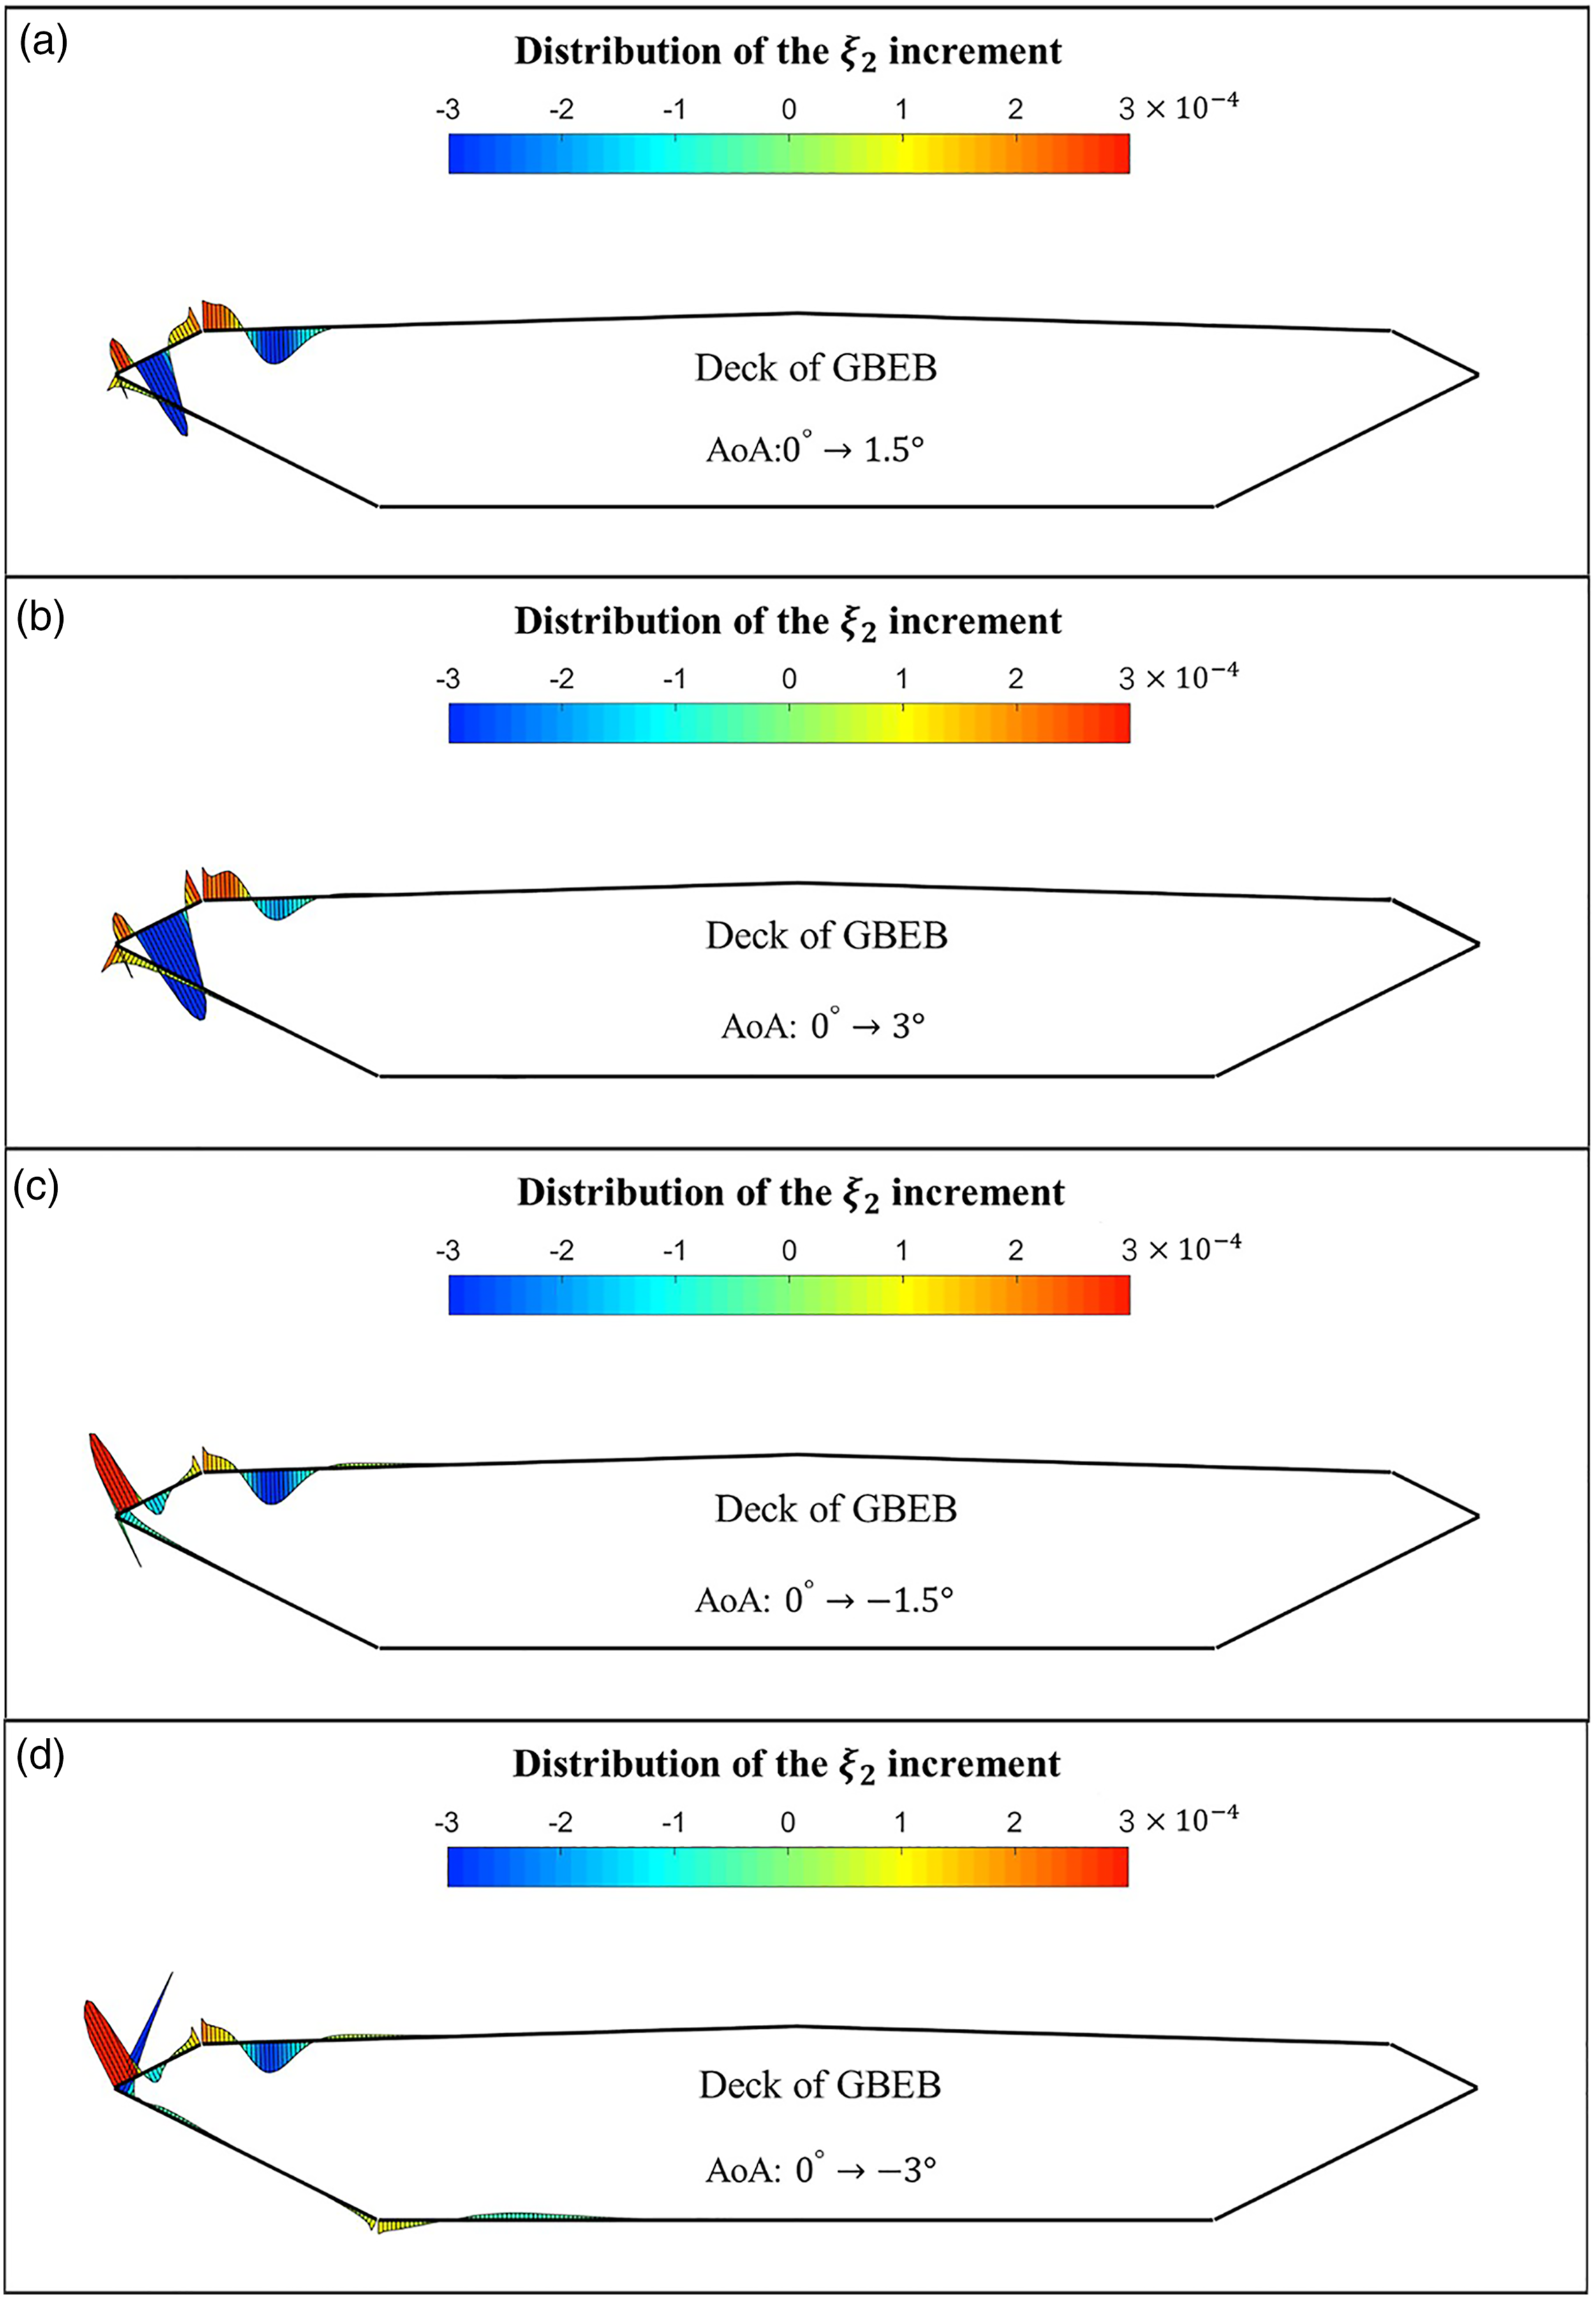
The pressure flutter derivatives (equation (1)) were introduced not only as an intermediate process to calculate the distributed aerodynamic performance but also to highlight the key fluctuations of the pressure field. The distribution of the pressure flutter derivatives depicts the relationship between the pressure field fluctuations and the vibrating deck for the vertical and torsional DoFs. Based on this critical state, Figures 7 and 8 show the corresponding pressure flutter derivatives. As shown by equation (1), Wind attack angles’ impact on the fluctuations related to the vertical DoF (a) Wind attack angles’ impact on the fluctuations related to the vertical DoF (a) 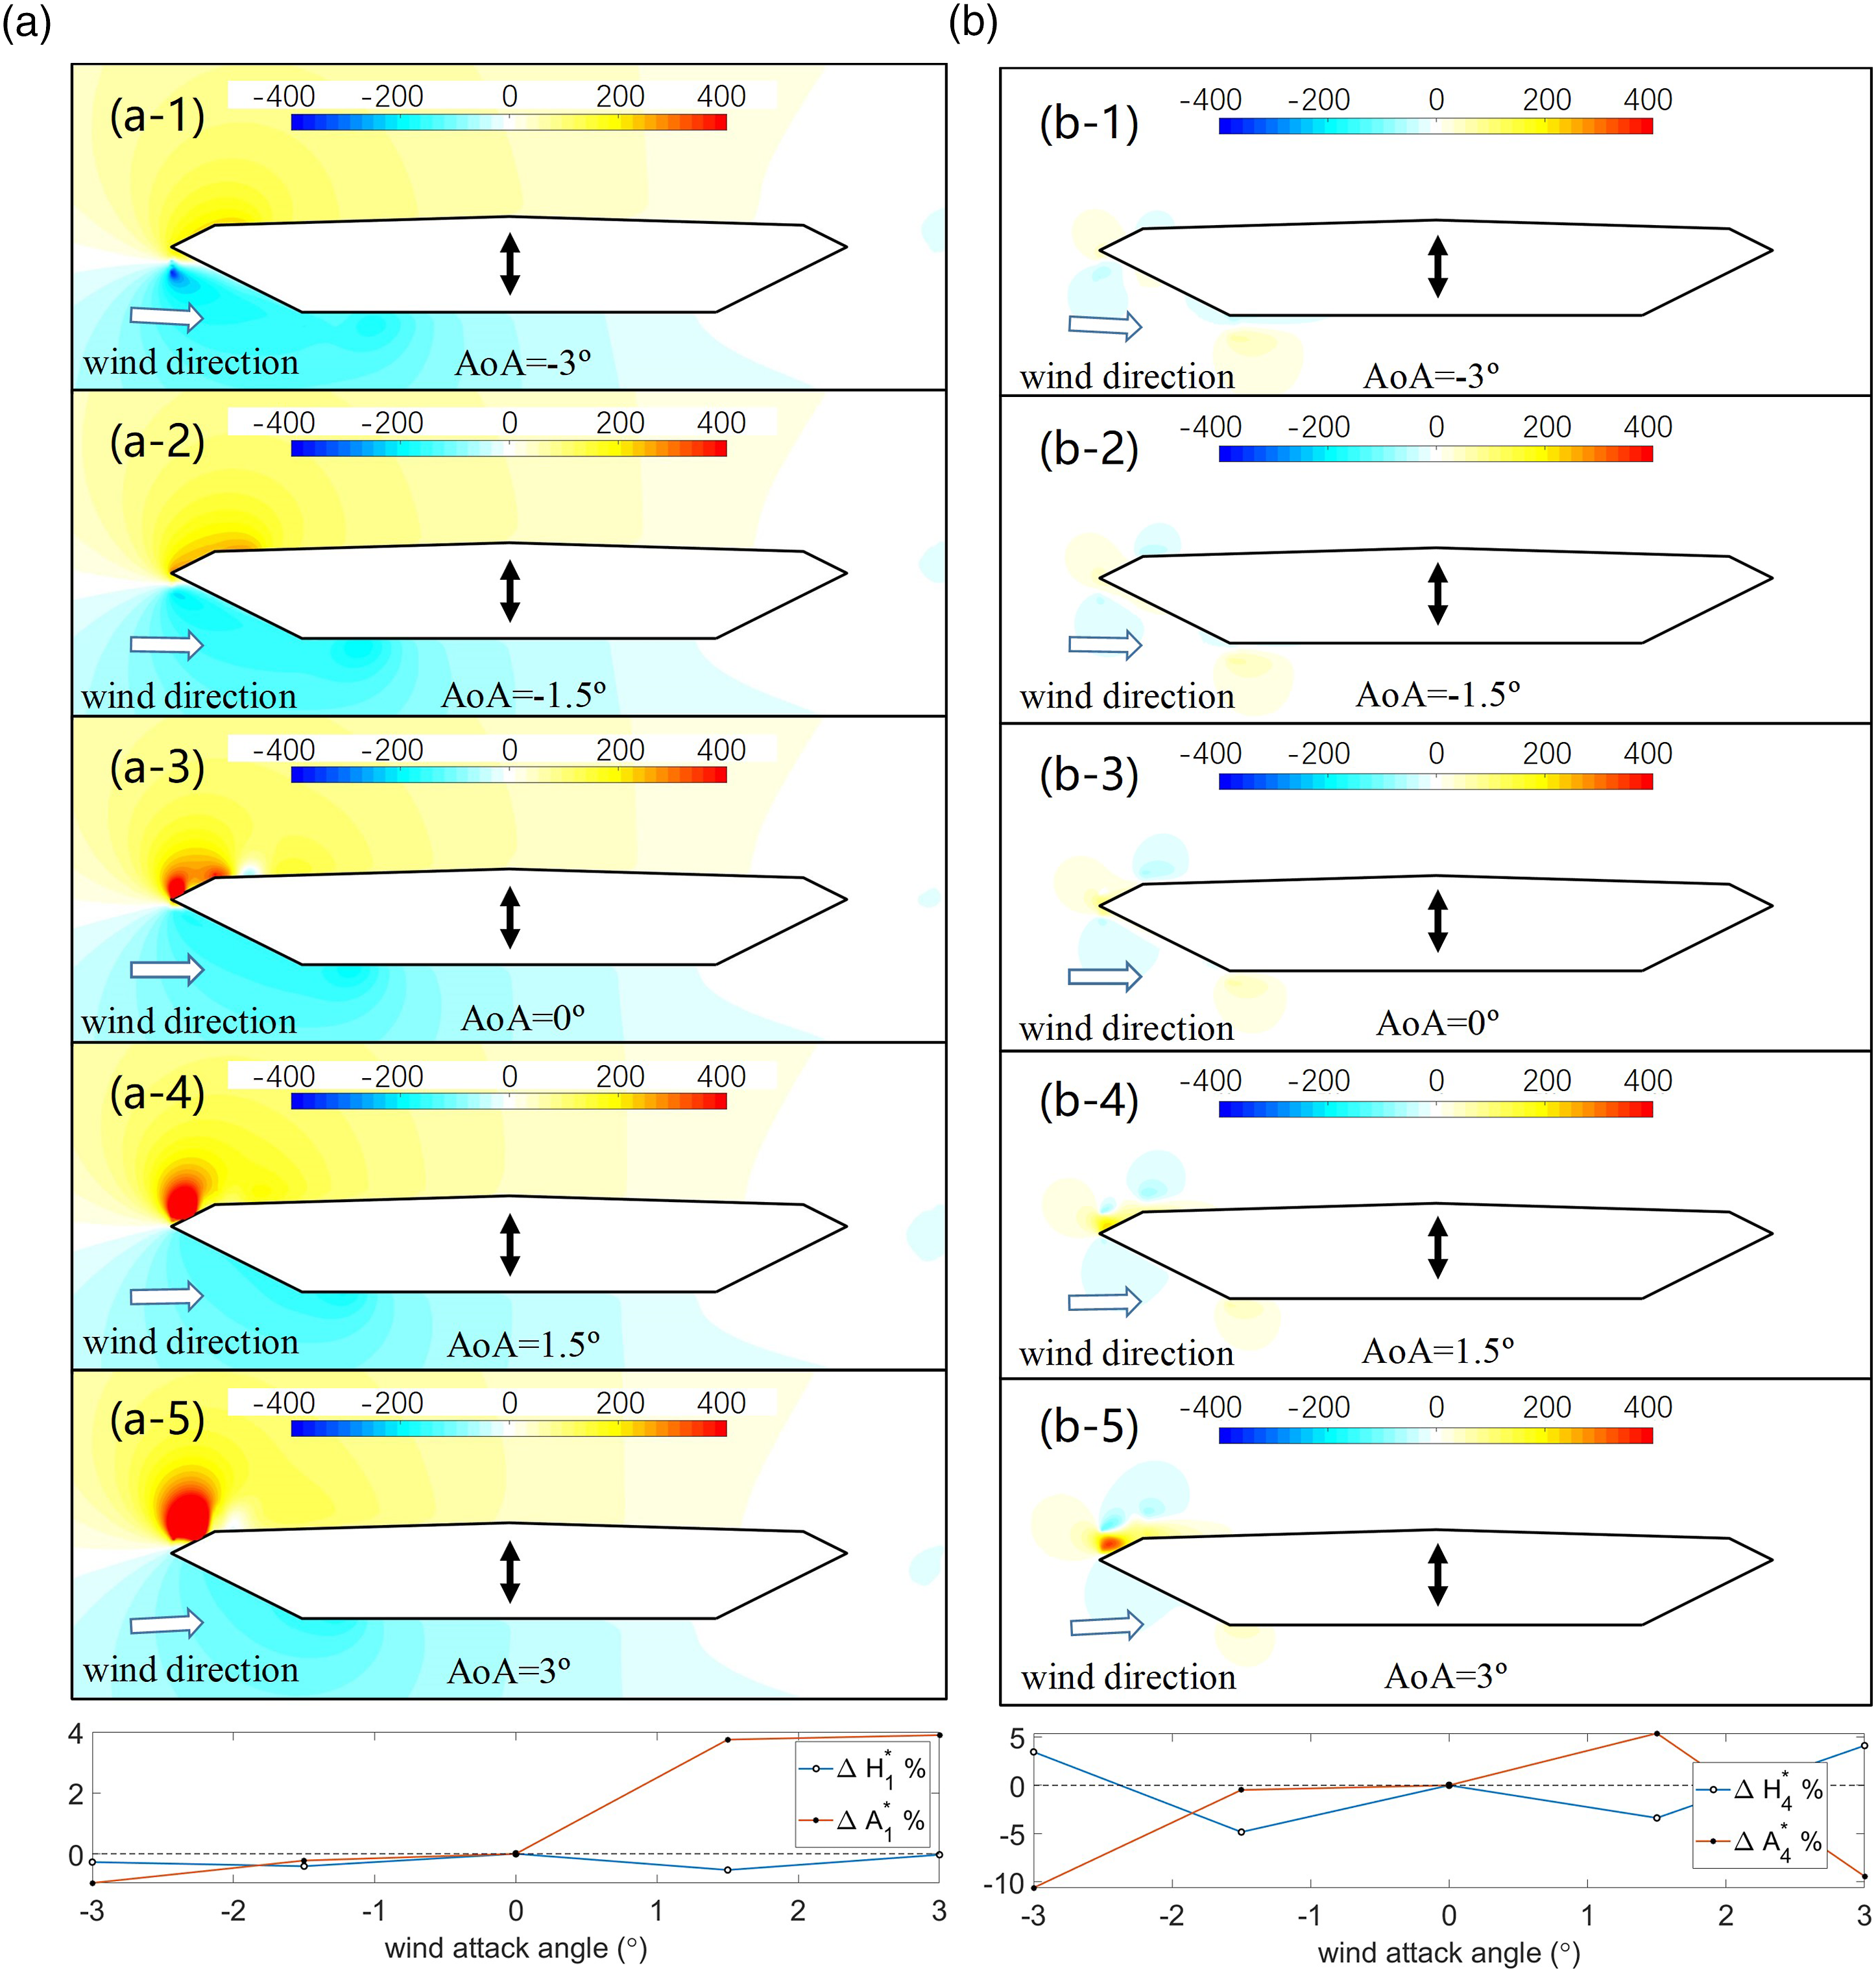
As shown in Figure 7, the values of
Unlike the contour maps shown in Figure 7, the values of
In summary, the pressure flutter derivatives represent the components of the pressure fluctuations, and the pressure fields are orthogonally decomposed into two components: one component’s phase identical to the deck’s displacement and the other component’s phase identical to the deck’s velocity, which constitute the motion of the deck. They can provide some insights to investigate the mechanism of the source of the traditional flutter derivatives and the reason for the change of the flutter characteristics. Although the analysis was conducted based on only one deck shape, similar routines can be used for other shapes, because the analysis method is universal.
6. Distribution of aerodynamic characteristics
To study the influence of the wind attack angle on the aerodynamic characteristics, five wind attack angles were studied, ranging from −3° to 3° with an interval of 1.5°. According to the structural dynamics characteristics listed in Table 4, the critical flutter speeds of the five cases were calculated based on traditional eigenvalue analyses, as shown in Figure 9. When the wind attack angle increased from Critical flutter speeds and pitching damping ratios at different wind attack angles.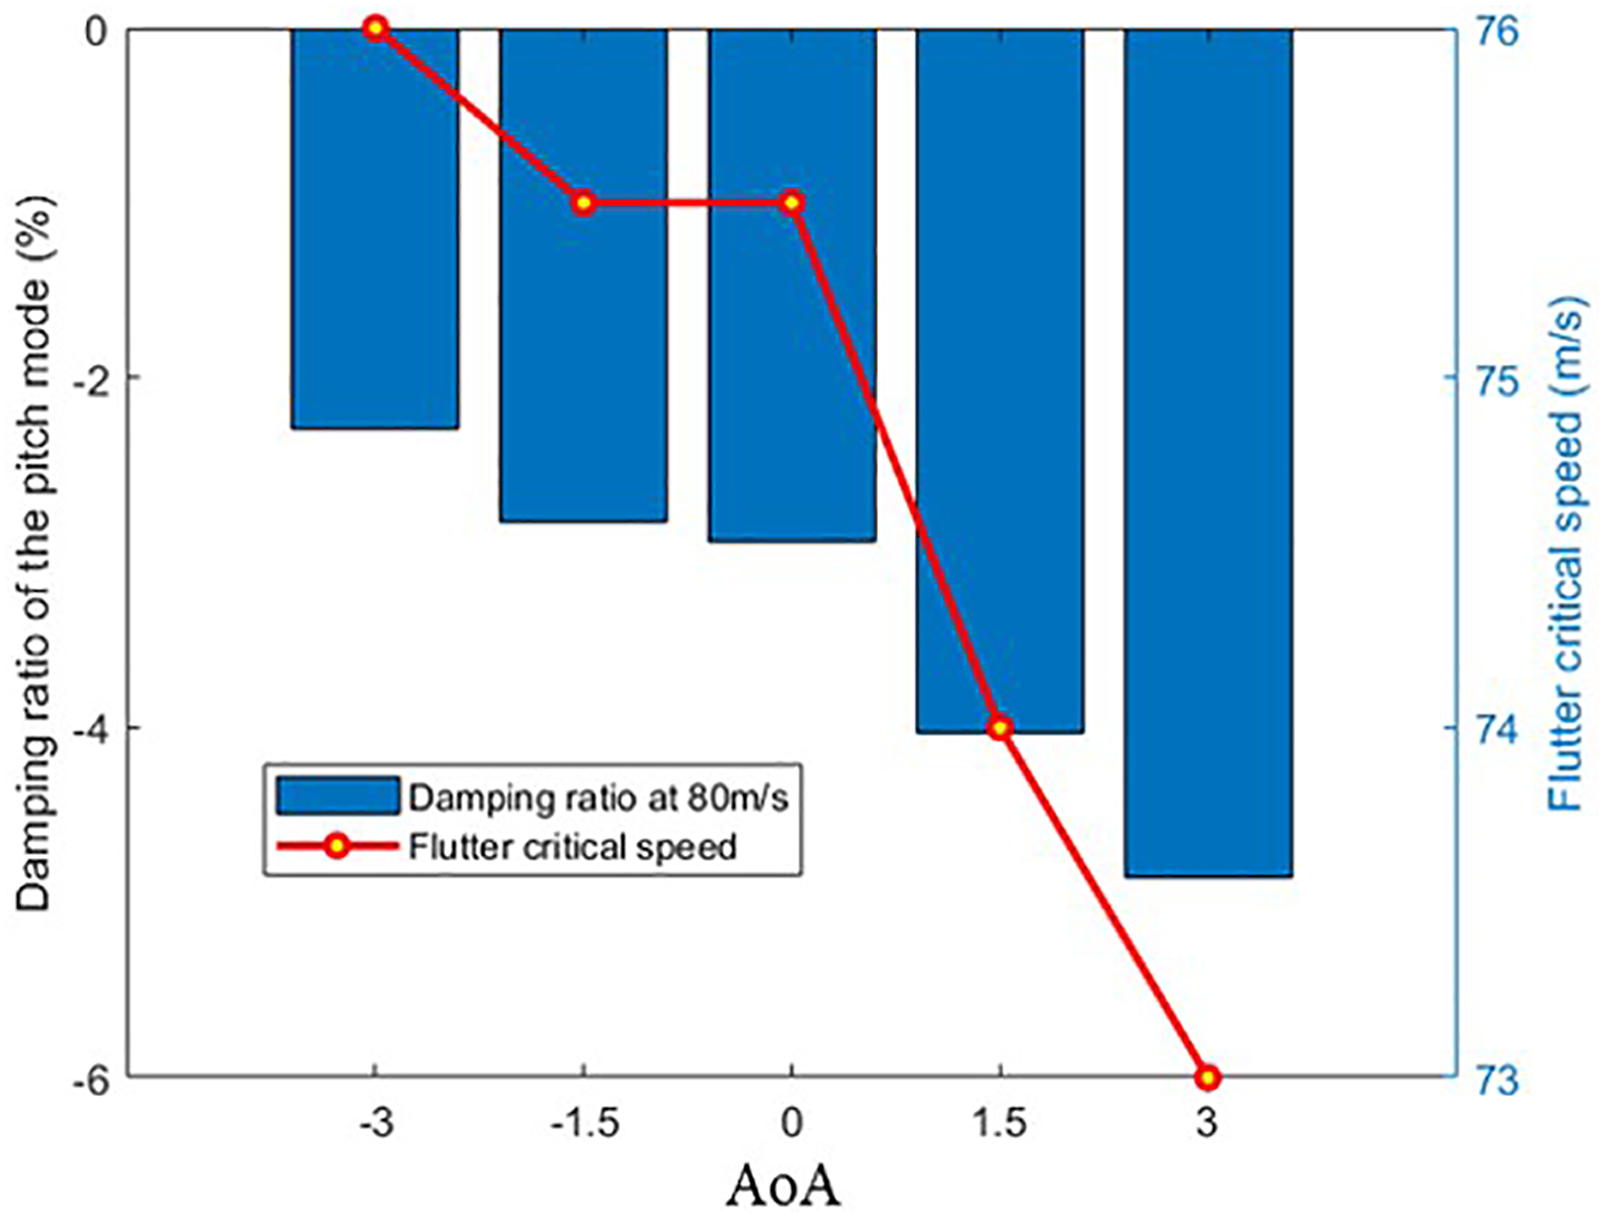
The damping ratios near the critical flutter speed coincided with the variation trend of the critical flutter speed. Without loss of generality, the following discussions are based on the data obtained at a wind speed 80 m/s. Before analyzing the influence of the wind attack angle, it is beneficial to observe the distribution of the aerodynamic stiffness and aerodynamic damping at the angle Dynamic characteristics at a wind speed of 80 m/s.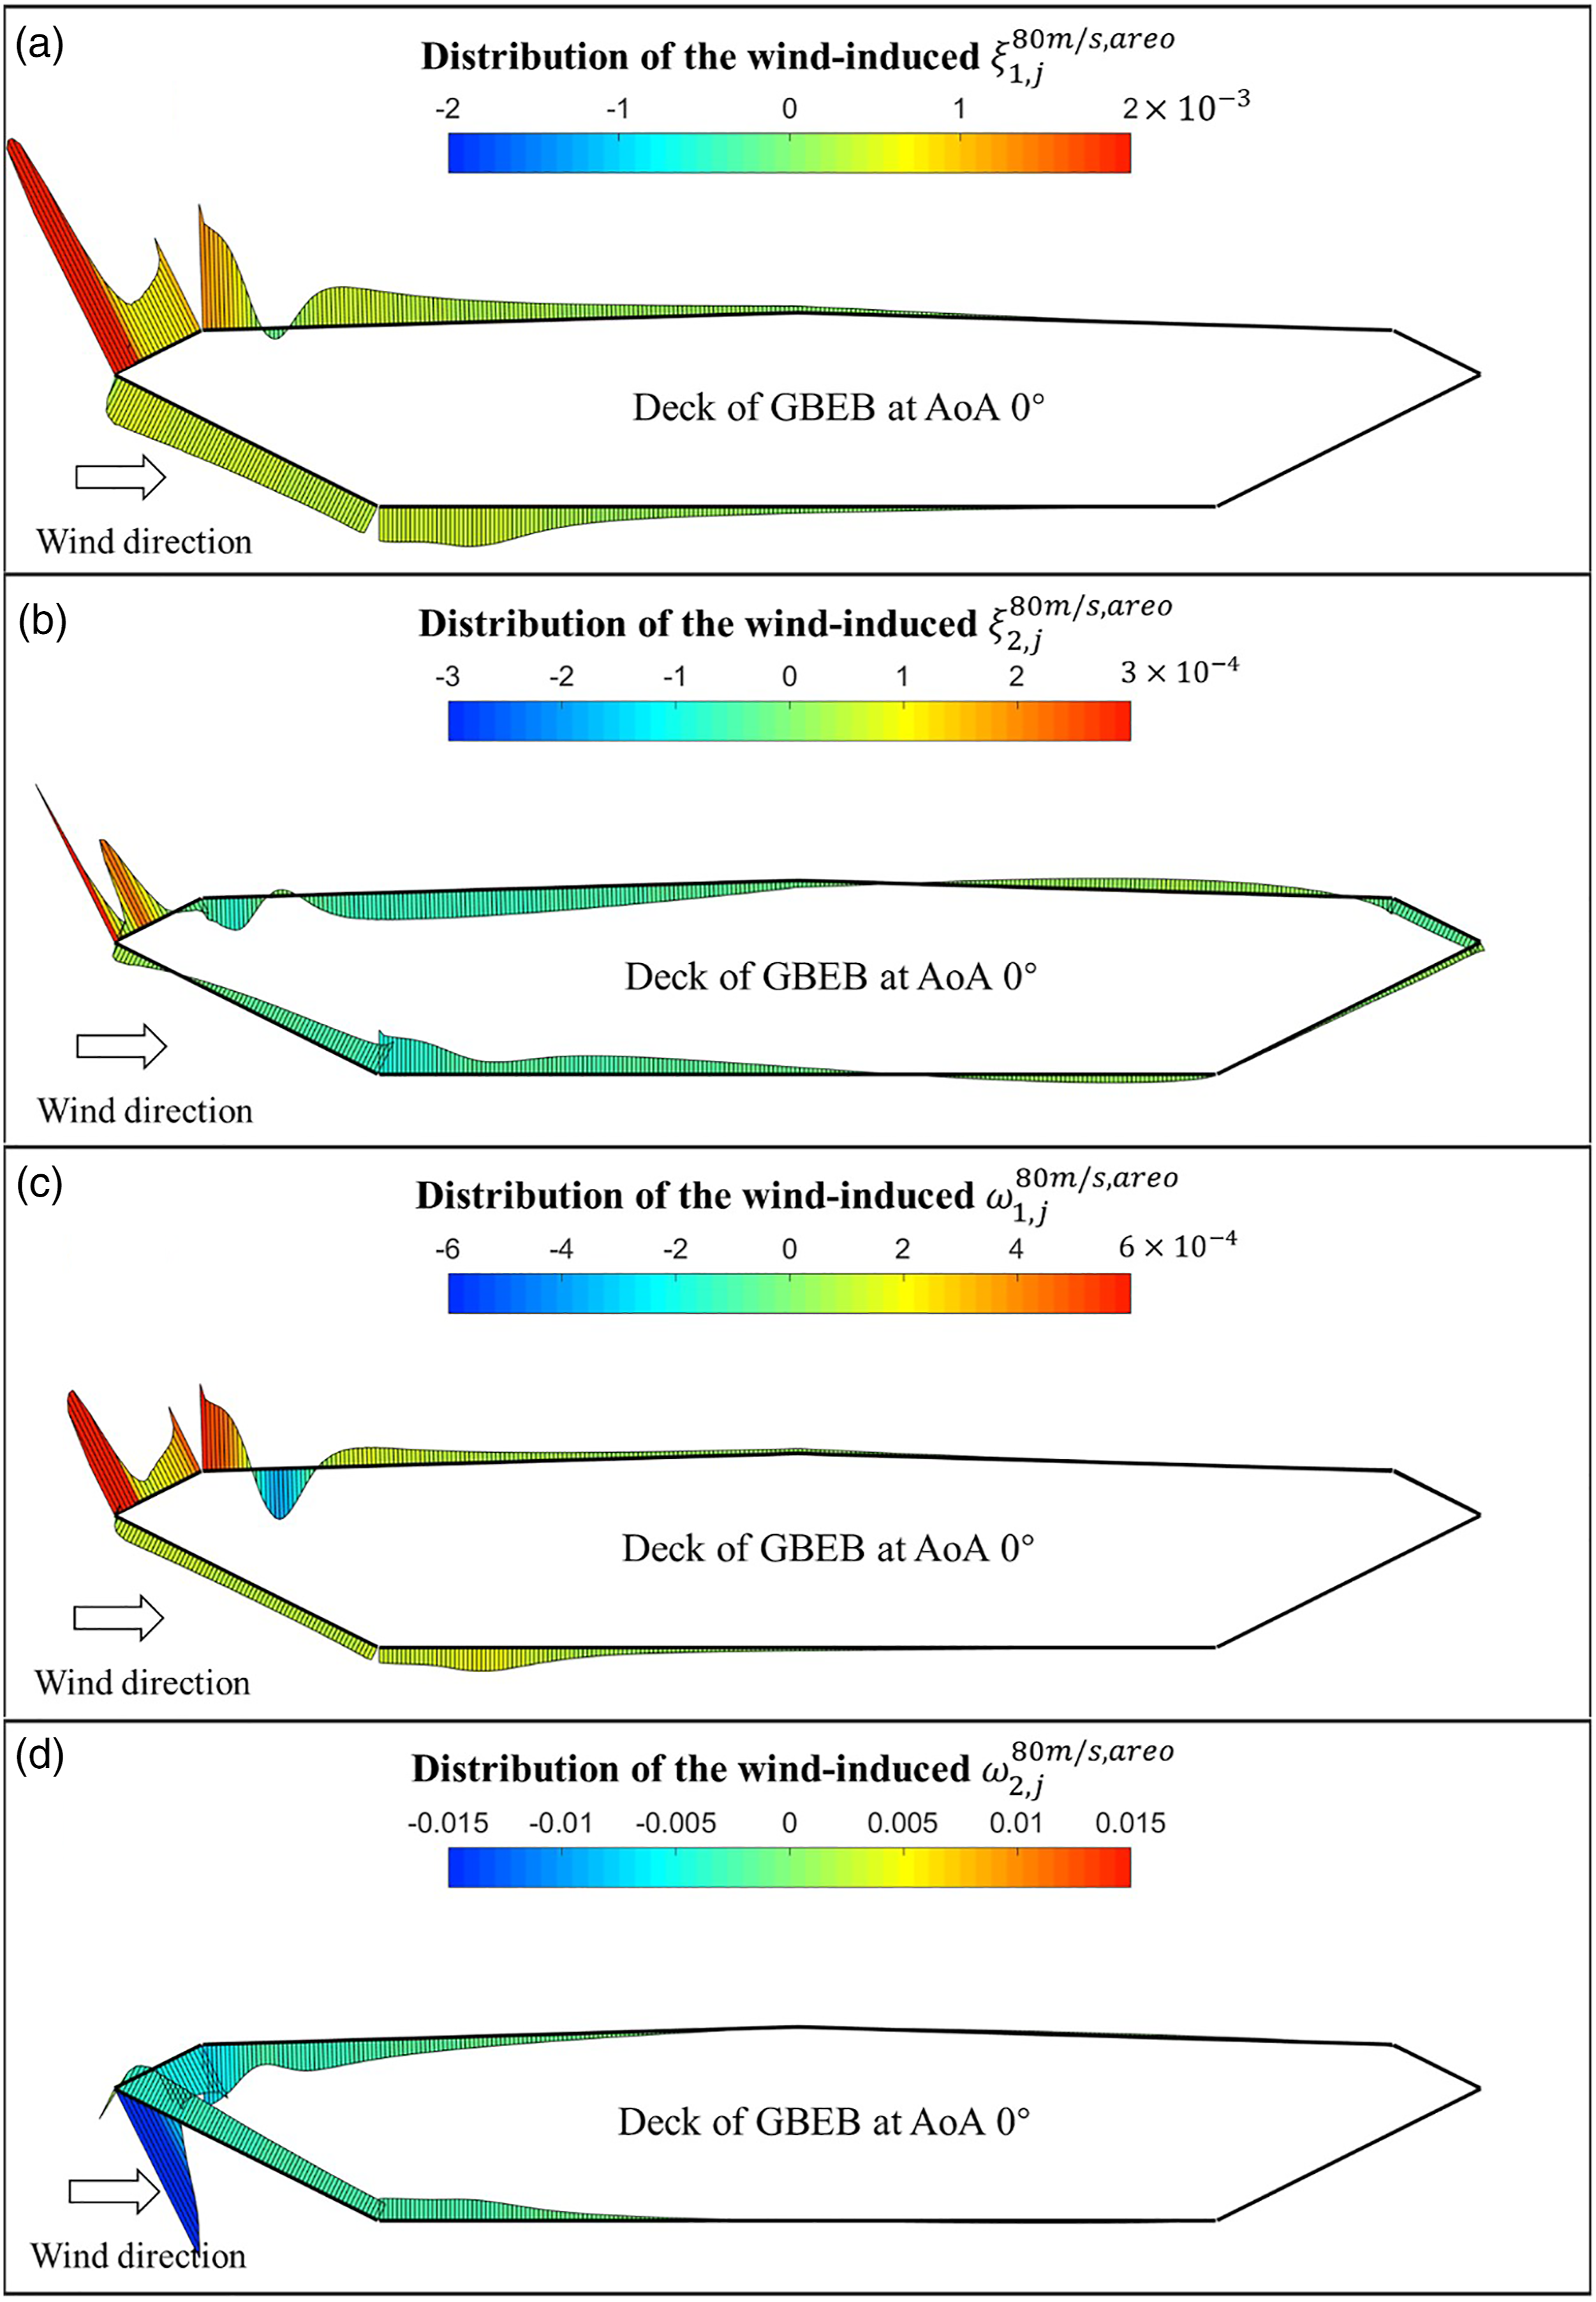
For the wind-induced effect on the modal characteristics, the proportions located at the windward zones always contributed the most, while the contributions from the leeward zones were basically negligible. Specifically, for the wind-induced effect on the frequency, the whole deck had either a negative contribution to the pitching frequency or a positive contribution to the heaving frequency, except for the flow-separation zones behind the windward upper corner. This means that the contributions from the aerodynamic shape to the modal frequencies were monotonic, namely, all the contributions either tended to raise the heaving frequency or reduce the pitching frequency. As for the fluctuating pressure’s influence on the damping ratios, different patterns were evident. For the wind-induced effect on the heaving damp ratio, similar to the heaving frequency, the whole deck had a positive contribution to the heaving damping ratio. For the pitching damping ratio, the sum of the positive contributions and the negative contributions was almost zero, resulting in a slightly negative total damping ratio when the wind speed just crossed the critical value.
Since the flutter instability was dominated by the pitching mode, the changes of the torsional frequency and torsional damping ratio at different wind attack angles are given below. Making Figure 10 as the baseline, Figures 11 and 12 show the changes of the pitching aerodynamic characteristics obtained at a wind speed of 80 m/s. Effect of wind attack angle on the distribution of the pitching frequency (80 m/s). Effect of wind attack angle on the distribution of the pitching damping ratio (80 m/s).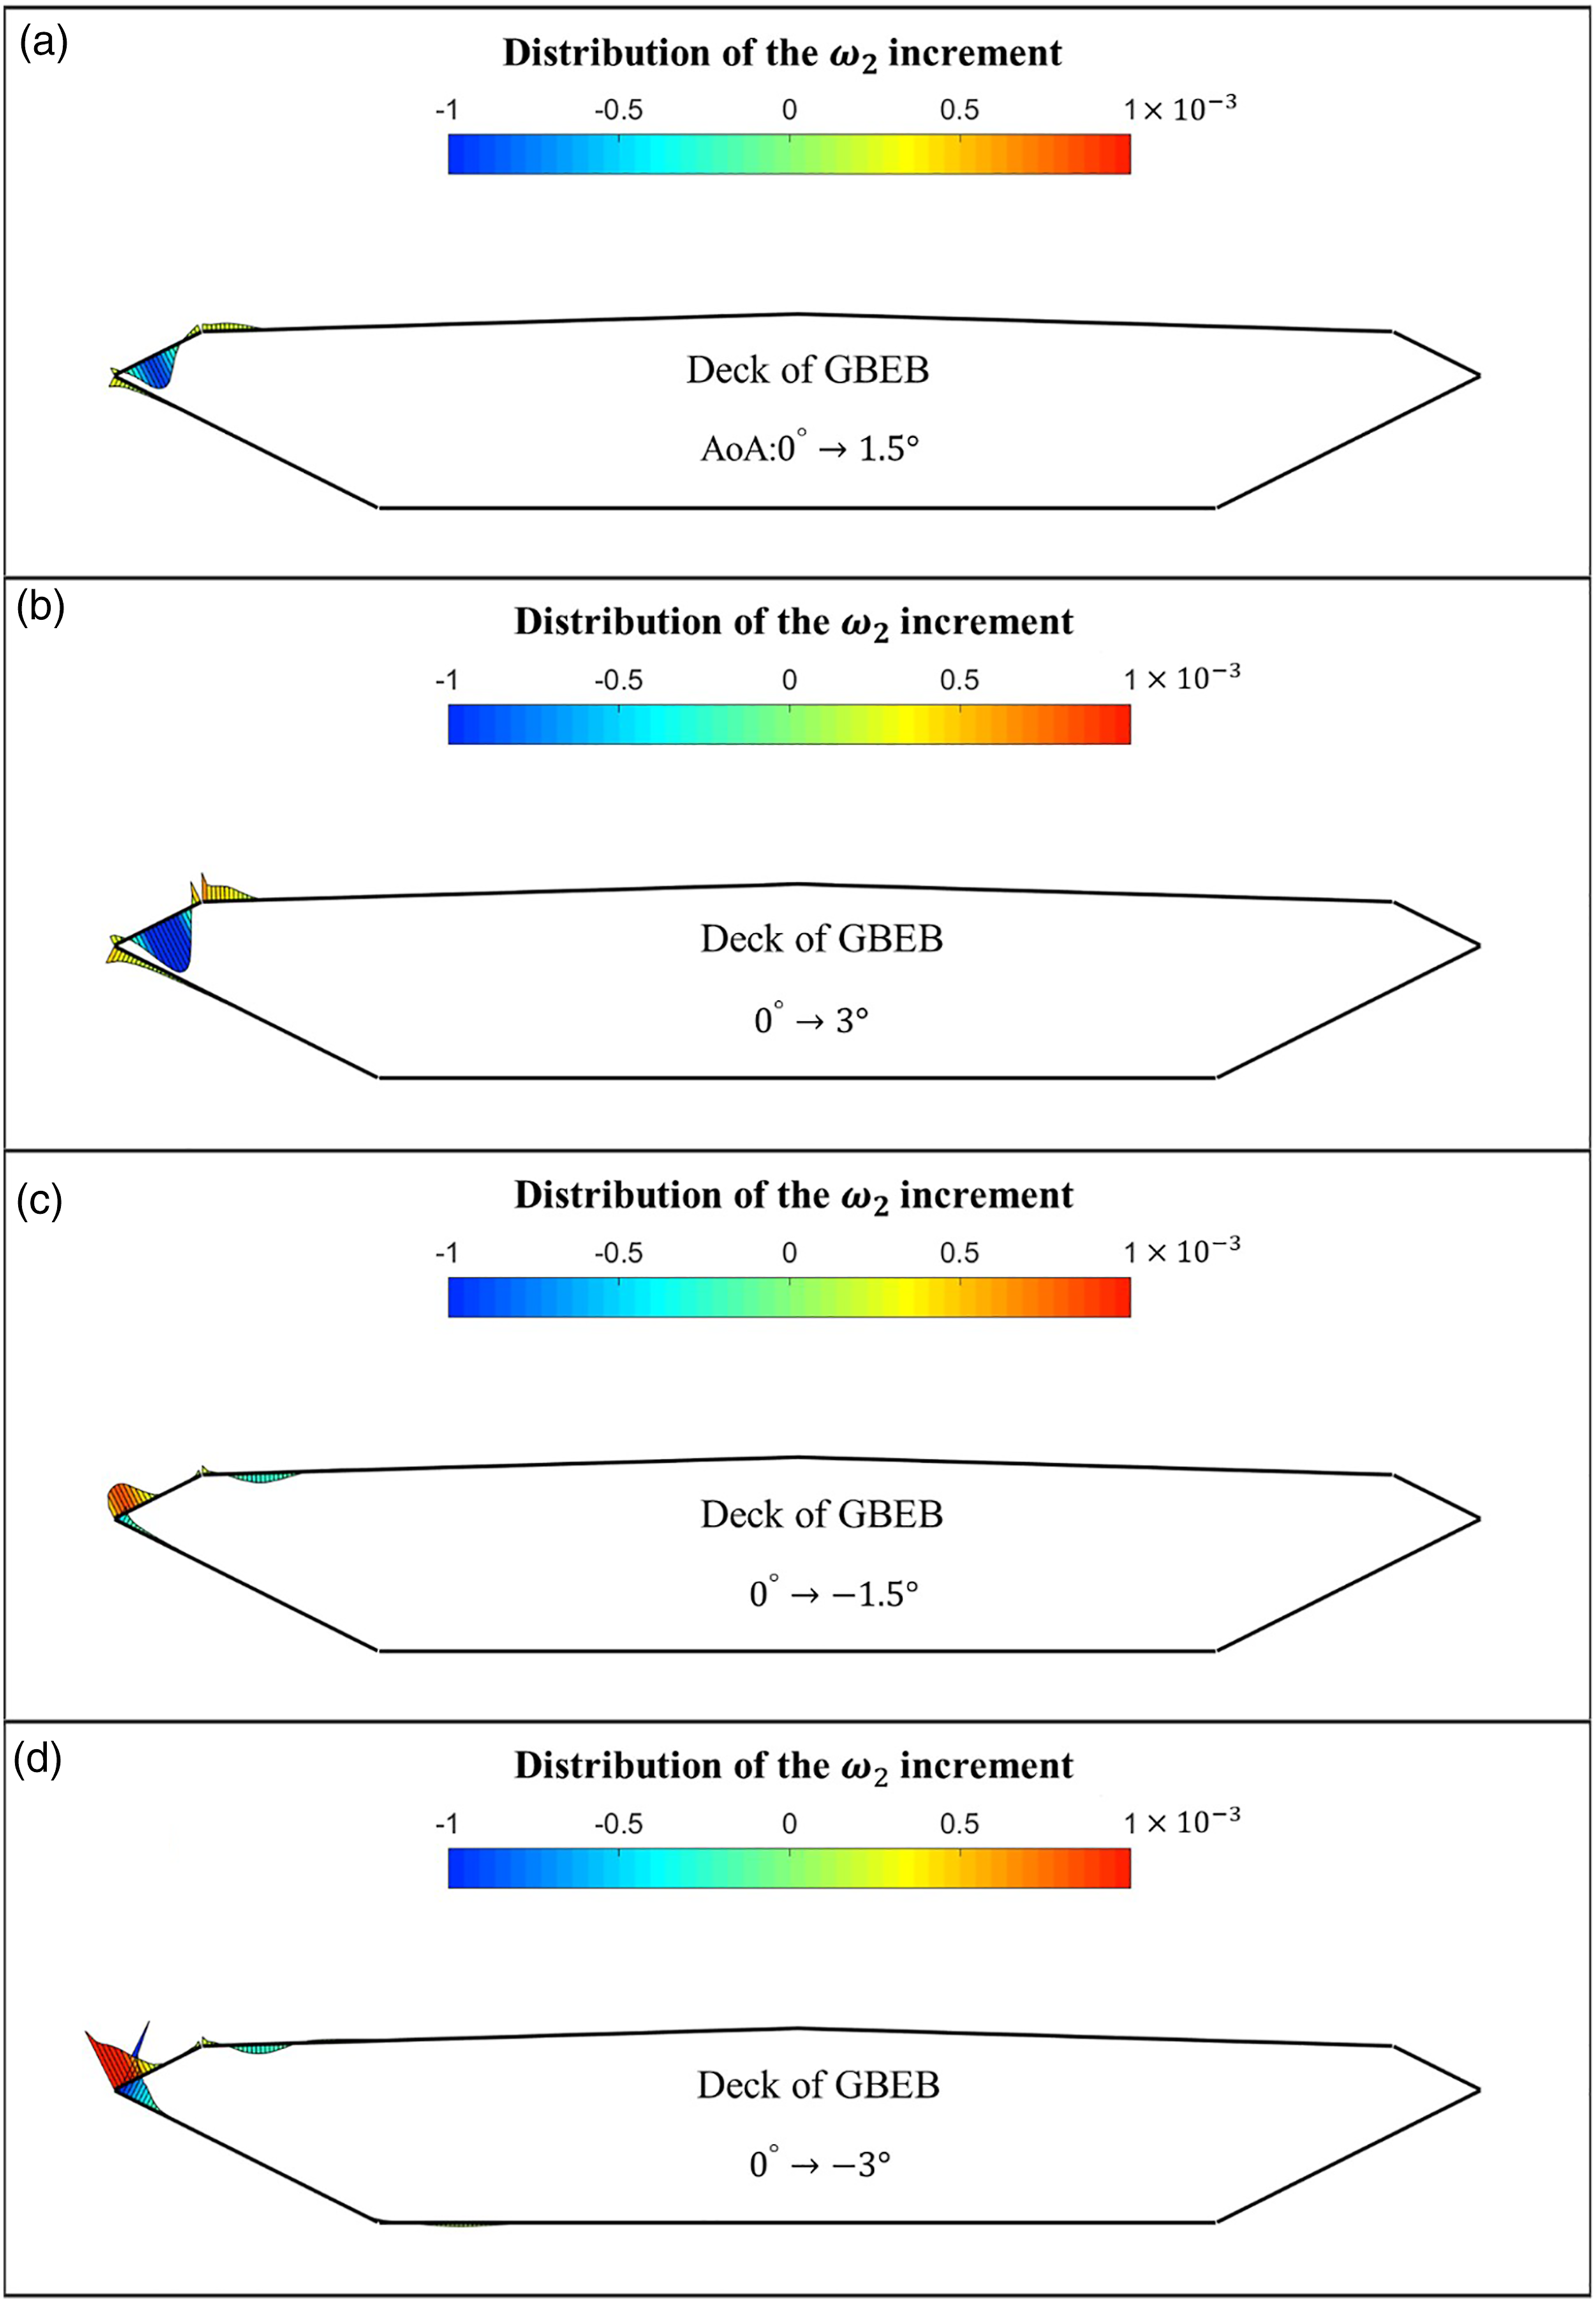
As demonstrated in Figure 11, the wind attack angles’ influence was concentrated at the windward surfaces. When the wind attack angle changed from
Similar to the wind attack angles’ influence on the aerodynamic stiffness, the sensitive zone was the windward side. When the wind attack angles were positive, two negative contribution zones were evident, one located behind the windward faring vertex and the other located behind the first vertex of the upper slab. When the wind attack angle changed from
The figures discussed above showed that the wind attack angles’ impact on the flutter aerodynamic behavior was mostly concentrated on the zones behind the windward deck vertices. Furthermore, this phenomenon was suspected to be related to the phenomenon of flow separation and reattachment, not only because their locations were identical but also because an additional dominant zone appeared at the wind attack angle of
7. Conclusion
A novel concept of “pressure flutter derivatives” was proposed as an auxiliary method to provide an intuitive description for the generation of the traditional flutter derivatives. This concept can be used to understand the phase and amplitude of the flutter-related fluctuations of the pressure field. Furthermore, its relationship to the previously established “surface flutter derivatives” was proposed. A complete analysis routine was established to perform forced vibration tests to collect data, to calculate the pressure flutter derivatives to analyze the aerodynamic force source, and to calculate the surface flutter derivatives to obtain the distribution of the aerodynamic characteristics. For the problem of the wind attack angle’s impact on bridge’s flutter stability, it was found that the windward side of the deck was decisive for the flutter stability: as the wind attack angle increased, the overall damping ratio decreased mainly due to the negative contribution of the upper surface of the windward fairing. This application showed that this routine can handle not only shape changing problems (e.g., installing additional aerodynamic appendages) but also wind environment problems.
Footnotes
Acknowledgements
Declaration of conflicting interests
The author(s) declared no potential conflicts of interest with respect to the research, authorship, and/or publication of this article.
Funding
The author(s) disclosed receipt of the following financial support for the research, authorship, and/or publication of this article: This work was supported by the National Science Foundation for Young Scientists of China (51808075), the Natural Science Foundation of Chongqing, China (cstc2020jcyj-msxmX0773, cstc2020jcyj-msxmX0937), the 111 Project (B18062), the National Natural Science Foundation of China (51978108), and the Fundamental Research Funds for the Central Universities (2020CDJ-LHZZ-018, 2020CDJ-LHZZ-016).