
Abstract
Early monitoring of the drone’s critical components, such as the motor, propeller, and electronic speed controller (ESC), can prevent unwanted accidents from happening to the drone. A failure of one of the drone’s components may lead the drone to crash. The fault detection approach can be made by analyzing certain parameters such as vibration, acoustic, current, and speed. In this paper, a comparative analysis between data-driven and visual-based approaches in detecting an imbalanced propeller in the drone is presented. The analysis will focus on vibration and acoustic parameters, with the use of CZN-15 and ADXL335 MEMS sensors to capture vibration and acoustic data, respectively. The Silky EvCam vibration camera will be used for the visual-based approach. Experimental results demonstrated that both data-driven and visual-based approaches could detect the imbalanced UAV propeller. There is a shift of vibration frequency when imbalances occur in the UAV propeller. However, in the ground and thrust modes, the acoustic-based method has an accuracy of 54% and 93%, respectively, which is lower compared to the vibration-based (100% accuracy in both modes) and visual-based techniques.
1. Introduction
Drones, also known as unmanned aerial vehicles (UAVs), have revolutionized the way we interact with the world. These versatile flying machines have gained significant popularity in recent years. Equipped with cameras, sensors, and advanced technologies such as GPS and artificial intelligence, drones have been utilized in fields such as aerial photography Siean et al. (2021), mapping Gupta and Shukla (2018), search and rescue operations Martinez-Alpiste et al. (2021), precision agriculture Ghazali et al. (2022), and package delivery Kellermann et al. (2020).
While drones, particularly multirotors, offer exciting opportunities, it is crucial to address the safety issue surrounding their operation. Crashes and collisions commonly occur when operating a drone due to various reasons such as pilot error, environmental factors, collisions with animals, and failure of its components Balestrieri et al. (2021). Among these factors, the failure of drone components can be prevented early. It is essential to monitor critical components like the motor and propeller of a drone before initiating a flight. This preflight maintenance or checking procedure can effectively mitigate the risk of drone crashes.
In this paper, a fault detection approach in drones, focusing on the propeller imbalance case is proposed. Two different MEMS sensors will be utilized to capture the vibration and acoustic data. The main contribution of this paper is the comparative analysis between vibration (data-driven and visual-based) and acoustic parameters in detecting an imbalanced propeller before flying the drone. The aim is to identify the advantages and limitations of each approach and determine the best one to be applied. The rest of the paper is organized as follows. Section 2 discusses the literature review related to fault detection techniques in drones, and Section 3 presents the methodology for this study. Sections 4 and 5 explain the data-driven and visual-based propeller imbalanced detection, respectively, including the experimental results. The comparison between each approach is discussed in Section 6, and the study is concluded in Section 7.
2. Literature review
Reported studies related to fault detection and diagnosis of drone components.
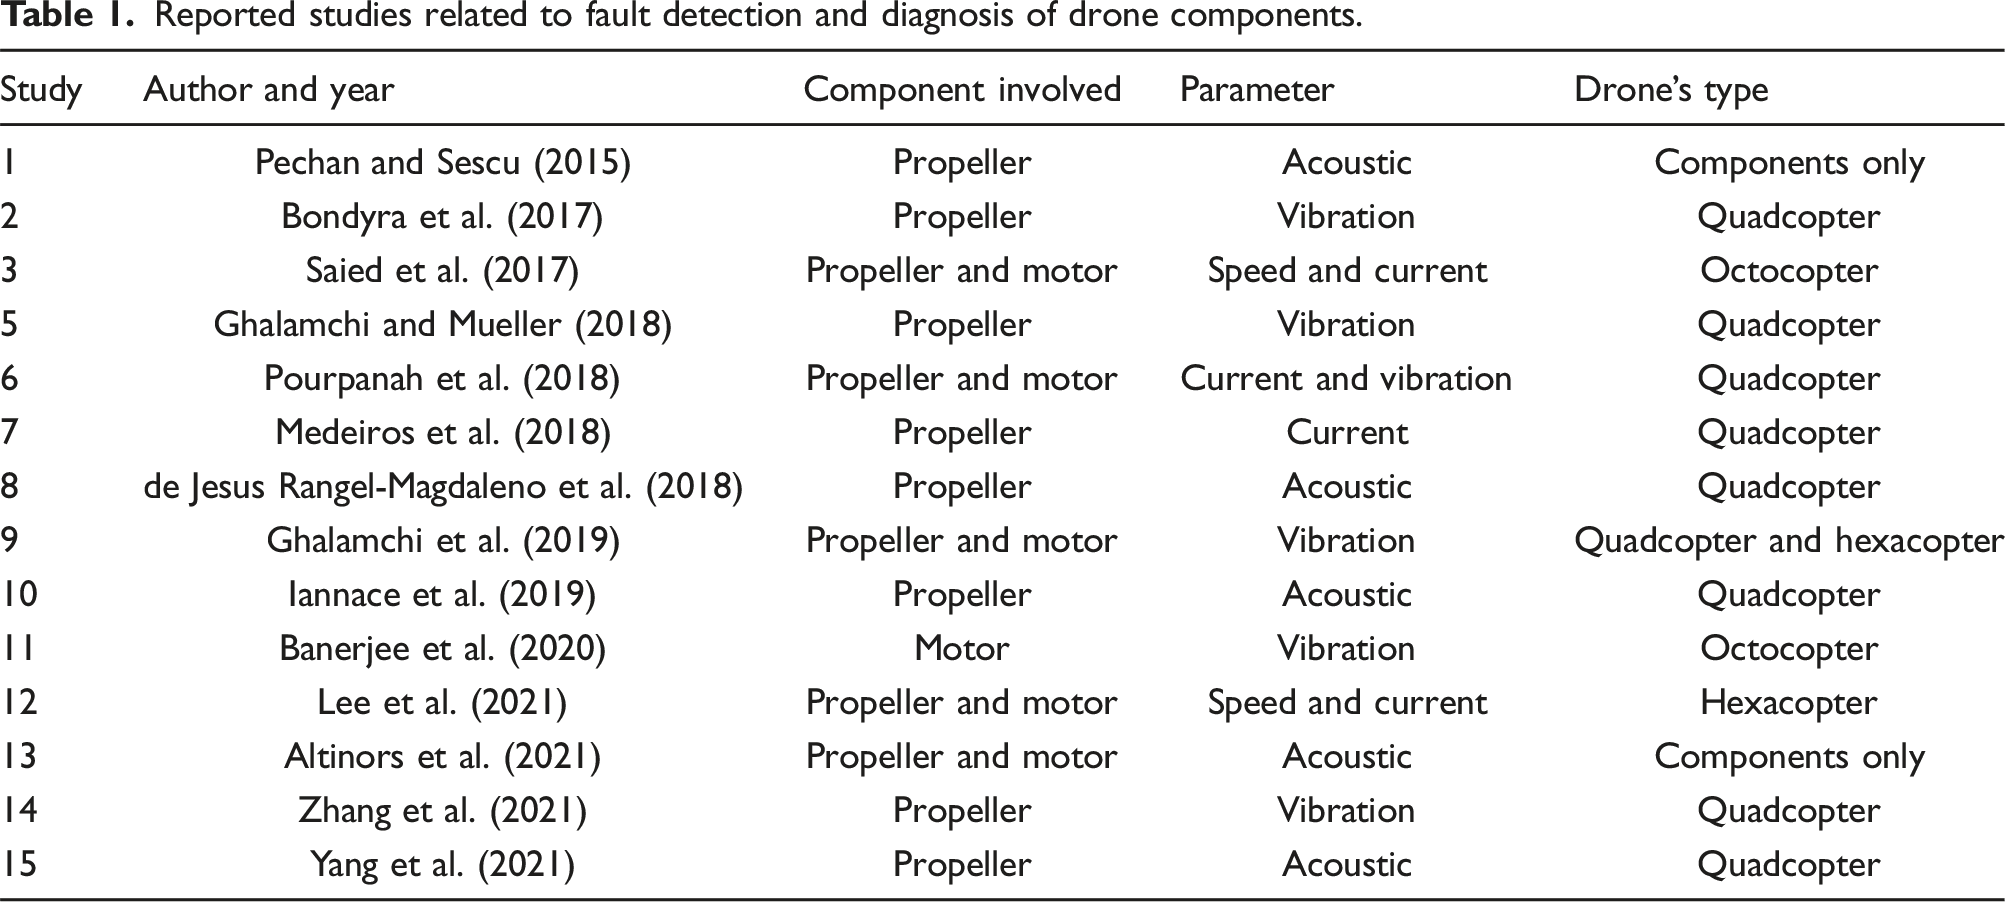
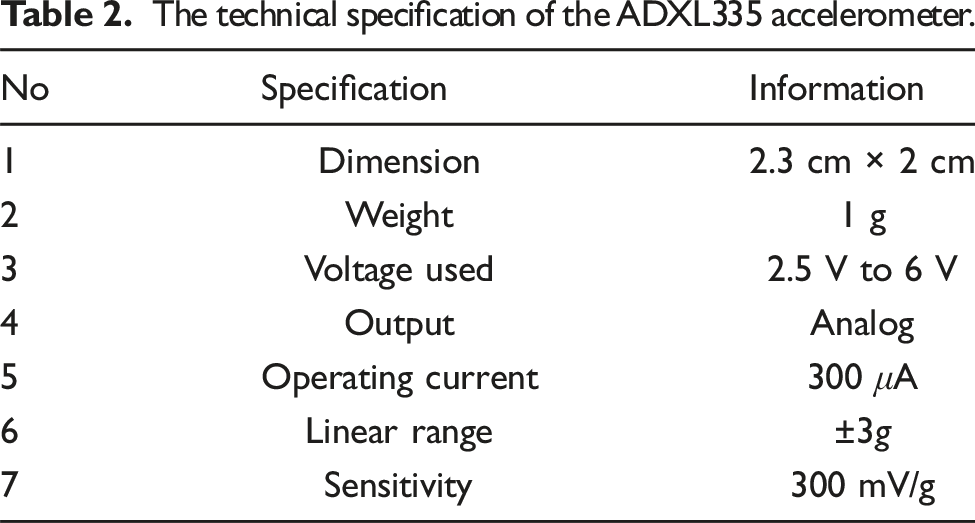
Pourpanah et al. (2018) examined the vibration characteristics of quadcopter propellers to distinguish between those in good condition and those with various degrees of damage (normal, 5%, 10%, or 15%). Based on the vibration data acquired from four accelerometers installed, the results revealed that the vibration signal generated by a healthy propeller exhibited a smoother pattern compared to that of a faulty propeller. Banerjee et al. (2020) presented a method for classifying unbalanced faults in UAVs by analyzing frequency-domain vibration signals. They utilized an ADXL335 accelerometer to capture vibration data from a quadcopter in a controlled indoor laboratory setting. The results demonstrated a maximum frequency shifting percentage of 4.2% when transitioning from a healthy state.
Iannace et al. (2019) utilized the noise generated by the drone to develop a classification model based on neural networks (NN) in order to identify broken propeller blades. The model they proposed demonstrated a 97% accuracy in detecting faulty propeller blades on drones. In the study conducted by Altinors et al. (2021), they proposed a method for detecting faults in drone motors using acoustic data. They employed machine learning techniques and achieved an accuracy of over 99% in detecting motor failures. Pechan and Sescu (2015) conducted experiments to investigate the noise generated by multiple propellers with various surface defects. The results revealed that certain surface flaws led to a slight increase in total noise at low rotational speeds. However, at higher speeds, there was a slight decrease in the overall noise level.
The detection and diagnosis of faults in drones primarily involve the analysis of parameters such as vibration, acoustic, and current. Previous studies have shown that vibration and acoustic data are commonly used to identify mechanical faults, such as broken and unbalanced propellers. On the other hand, current signals are better suited for detecting electrical faults, such as motor and ESC failures. Existing literature does not include any comparative analysis between different parameters for detecting similar fault cases. Furthermore, previous research has not addressed visual-based fault detection in drones, focusing solely on data-driven approaches. Choosing the appropriate method is crucial to ensure that the fault detection process achieves consistent success across various fault scenarios and operating conditions. Therefore, it is imperative to conduct further investigations into this matter.
3. Methodology
Figure 1 shows the flowchart of the proposed data-driven and visual-based propeller imbalanced detection approaches. Both approaches start with determining the fault detection mode, which can be divided into ground and thrust modes. For the data-driven method, the vibration (time-domain) and acoustic data for the healthy and imbalanced propeller are acquired using sensors. The time-domain vibration data are further analyzed in terms of maximum amplitude and root mean square (RMS). The vibration data are also converted to frequency-domain vibration data using the Fourier transform technique. The acoustic data are analyzed in terms of maximum and average amplitude. For the visual-based method, the vibration data of healthy and imbalanced propellers are analyzed in terms of frequency, which is directly obtained from the vibration camera. The flowcharts of the data-driven and visual-based approaches.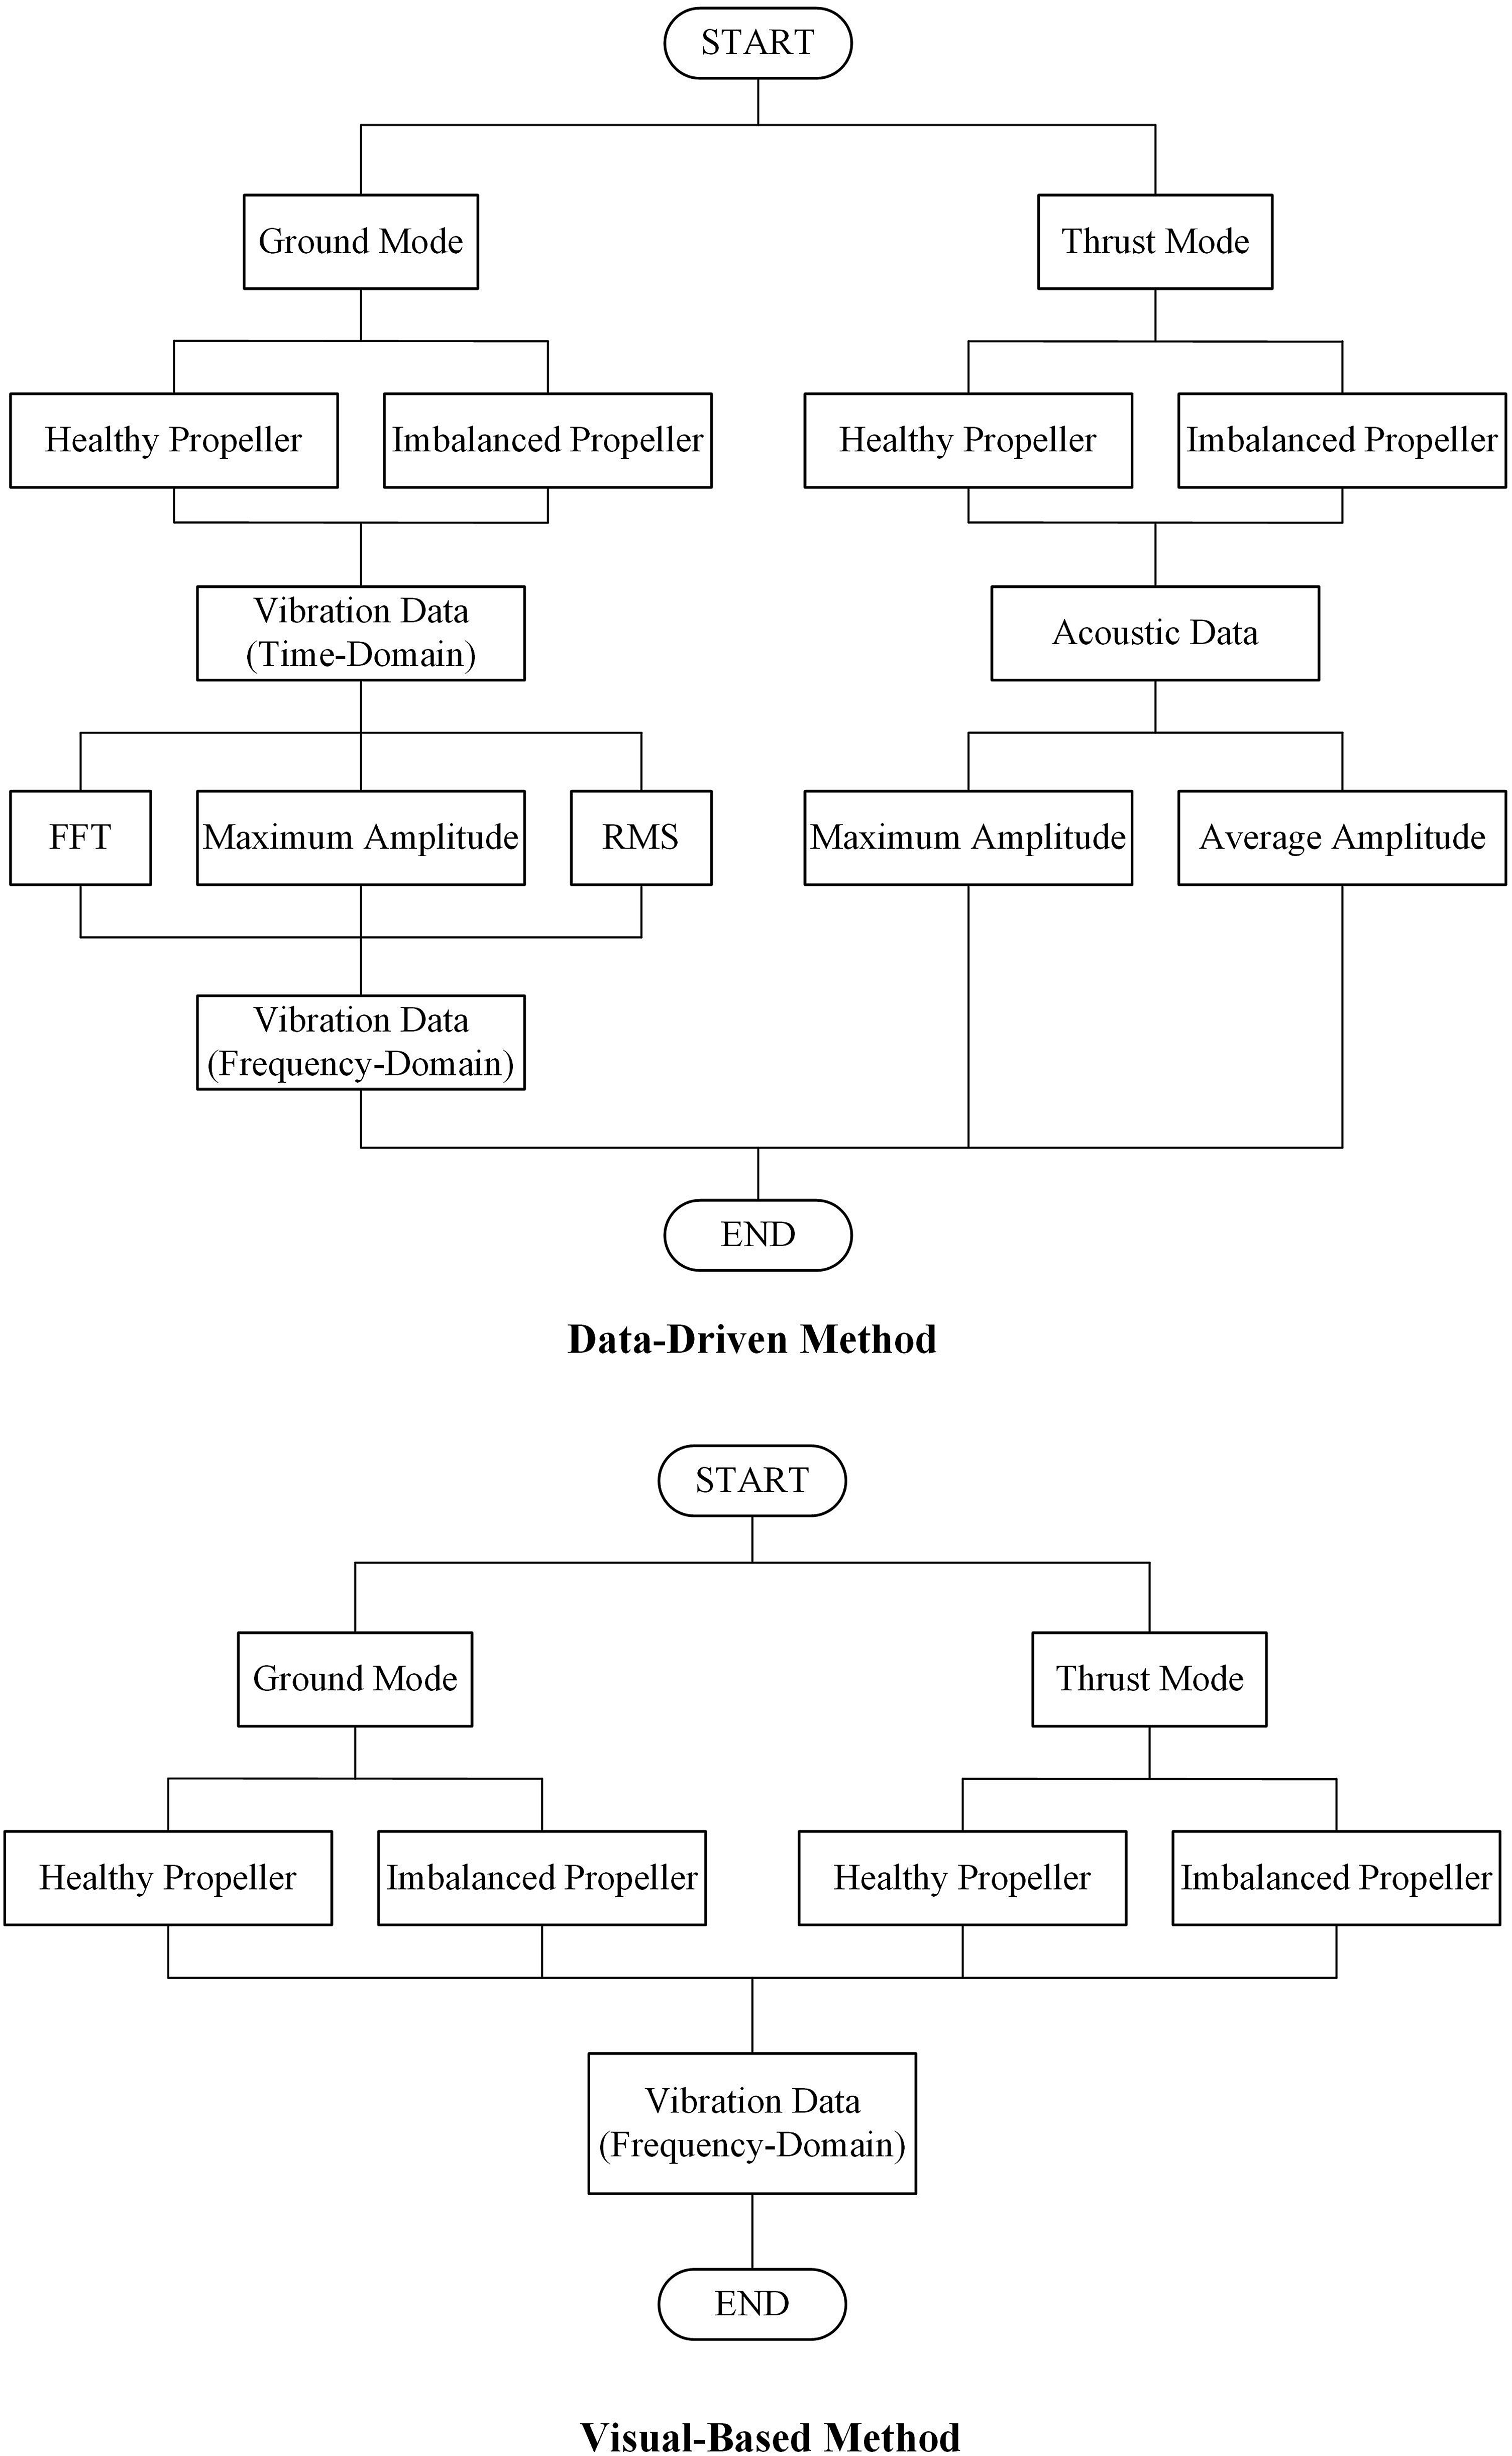
This research aims to compare data-driven techniques with the visual-based method for detecting imbalances in UAV propellers. This process is similar to airline pilots’ preflight checklist before takeoff, which serves as a preliminary step before deploying the UAV for a flight. The procedure involves conducting tests in indoor environments where the vibration and noise generated by the UAV are measured. Analyzing these measurements makes it possible to identify an imbalance in the propeller. To achieve this, vibration and acoustic data, as well as visual images, are collected from the UAV under four different operating conditions: a healthy propeller in ground mode, a healthy propeller in thrust mode, an unbalanced propeller in ground mode, and an unbalanced propeller in thrust mode.
The experimental setups for the data-driven and visual-based approaches are depicted in Figure 2. Based on Figure 2, an ADXL335 accelerometer was installed close to the vibration source (motor) to capture the vibration data. A CZN-15 sound sensor is installed in a way that the microphone faces the sound source (motor), as shown in Figure 2. The Silky EvCam camera from CenturyArks Co., Ltd is adopted for the visual-based approach. The camera incorporates event-based vision technology, an imaging approach that records scene changes instead of capturing individual image frames. Figure 2 shows how the camera is set to determine the vibration characteristic. The experimental setups for the data-driven and visual-based approaches.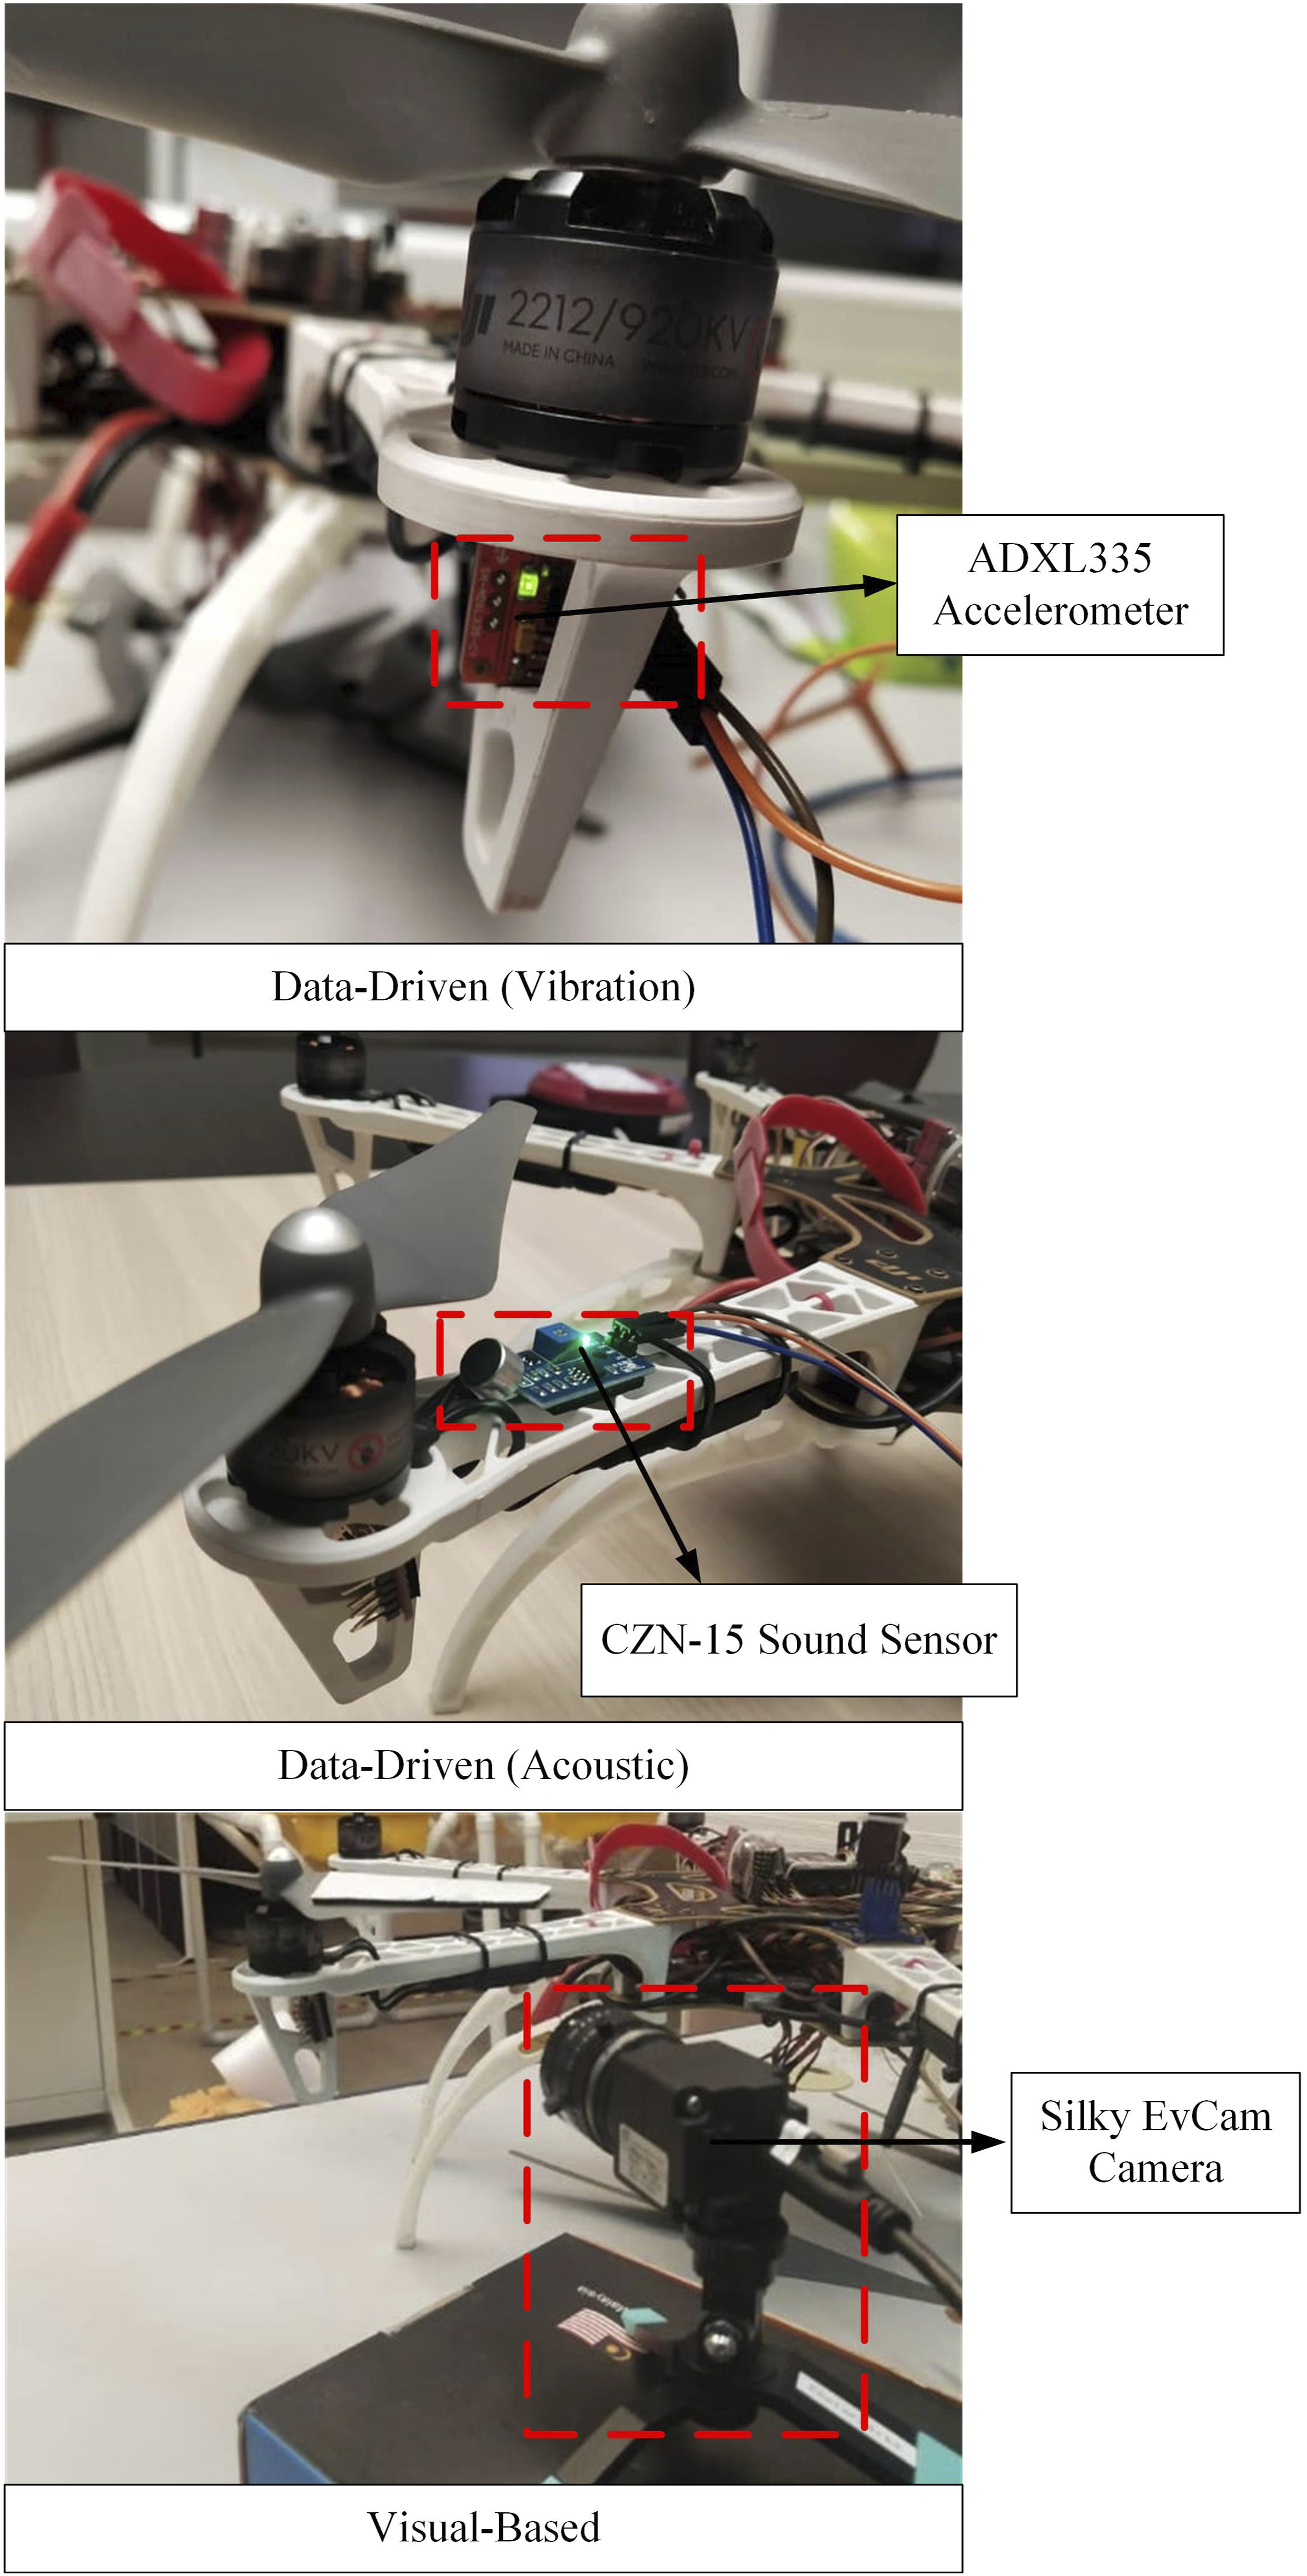
The technical specification of the ADXL335 accelerometer.
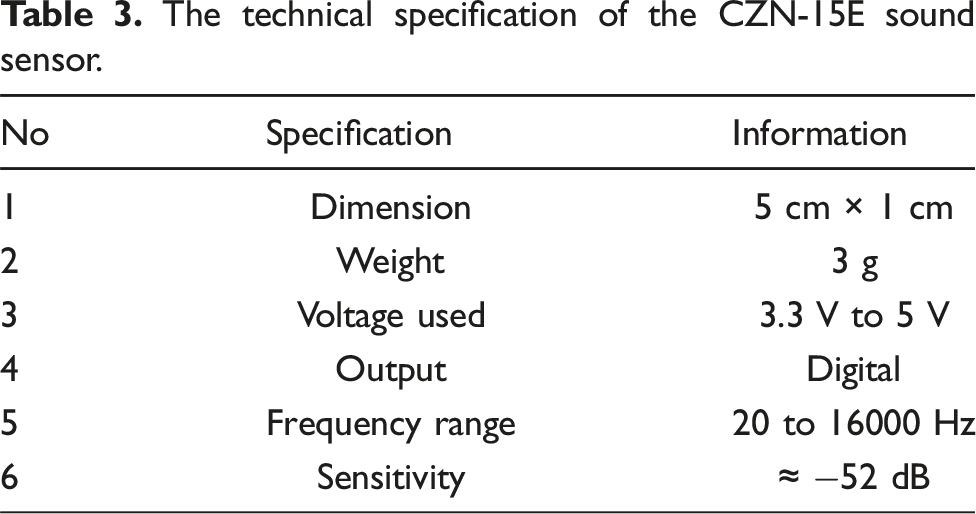
The technical specification of the CZN-15E sound sensor.
A strip of paper tape was applied to the upper surface of the propeller to simulate the unbalanced condition, as depicted in Figure 3. The application of paper tape significantly alters the aerodynamics of the blade, thus characterizing the vibration and noise generated by the rotating blade Iannace et al. (2019). The ground mode in this study refers to the state where the UAV is on the ground with motors spinning at low speed, typically between 1200 and 1500 rpm. The UAV can also be viewed as “warming up” at this stage. The thrust mode is when the UAV’s motors are spinning at a faster rate than in the ground mode while still on the ground, but the generated propeller force is still insufficient to lift the UAV. The typical rotational speeds of the motor in this state are approximately 3000 to 4500 rpm. The unbalanced propeller configuration used in the experiment.
The experimental works are also conducted in varying environments to determine the performance of the data-driven and visual-based methods under disturbances. The propeller imbalanced detection process is carried out in the presence of wind (3.3 m/s wind speed measured using a digital anemometer) and outdoor environment. The wind is simulated by a standing fan positioned 20 cm from the sound sensor, whereas the outdoor temperature is approximately 33°C.
4. Data-driven propeller imbalanced detection
The data-driven propeller imbalanced detection can be divided into vibration and acoustic-based methods.
4.1. Vibration-based propeller imbalanced detection
The vibration results acquired from the ADXL335 accelerometer are divided into ground and thrust modes. The measurements from the ADXL335 accelerometer were first analyzed with MATLAB by transforming the time-domain data into frequency-domain data via the Fourier transform technique. The experiments are repeated five times at each mode to obtain more reliable data and results. The datasets are named Dataset 1, 2, 3, 4, and 5, representing the vibration data collected at experimental trials 1, 2, 3, 4, and 5, respectively.
4.1.1. Ground mode
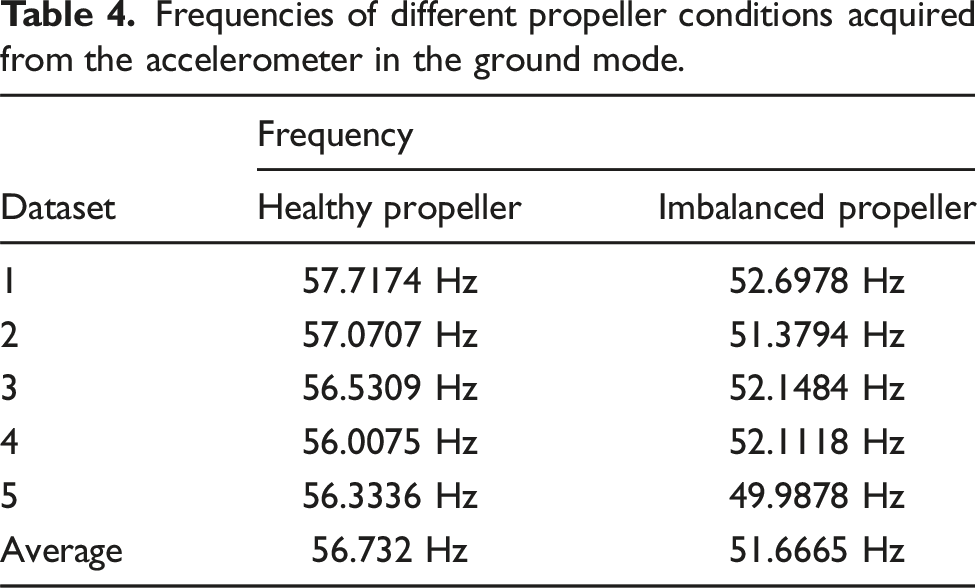
Figure 4 shows the vibration frequencies obtained from the ADXL335 accelerometer for the healthy and imbalanced propeller conditions. As listed in Table 4, the frequencies obtained through the Fourier transform have an average of 56.732 Hz and 51.6665 Hz over five datasets for the healthy and imbalance propeller conditions, respectively. There are shifts of frequencies to the left for all datasets when imbalances occur in the UAV propeller with an average difference of 8.93%. The shifts in the vibration frequencies are an uneven distribution of mass or aerodynamic forces on the propeller blades. As the propeller rotates, it creates an uneven distribution of centrifugal force, resulting in different vibration characteristics. Frequency values obtained from the ADXL335 accelerometer in the ground mode. Frequencies of different propeller conditions acquired from the accelerometer in the ground mode.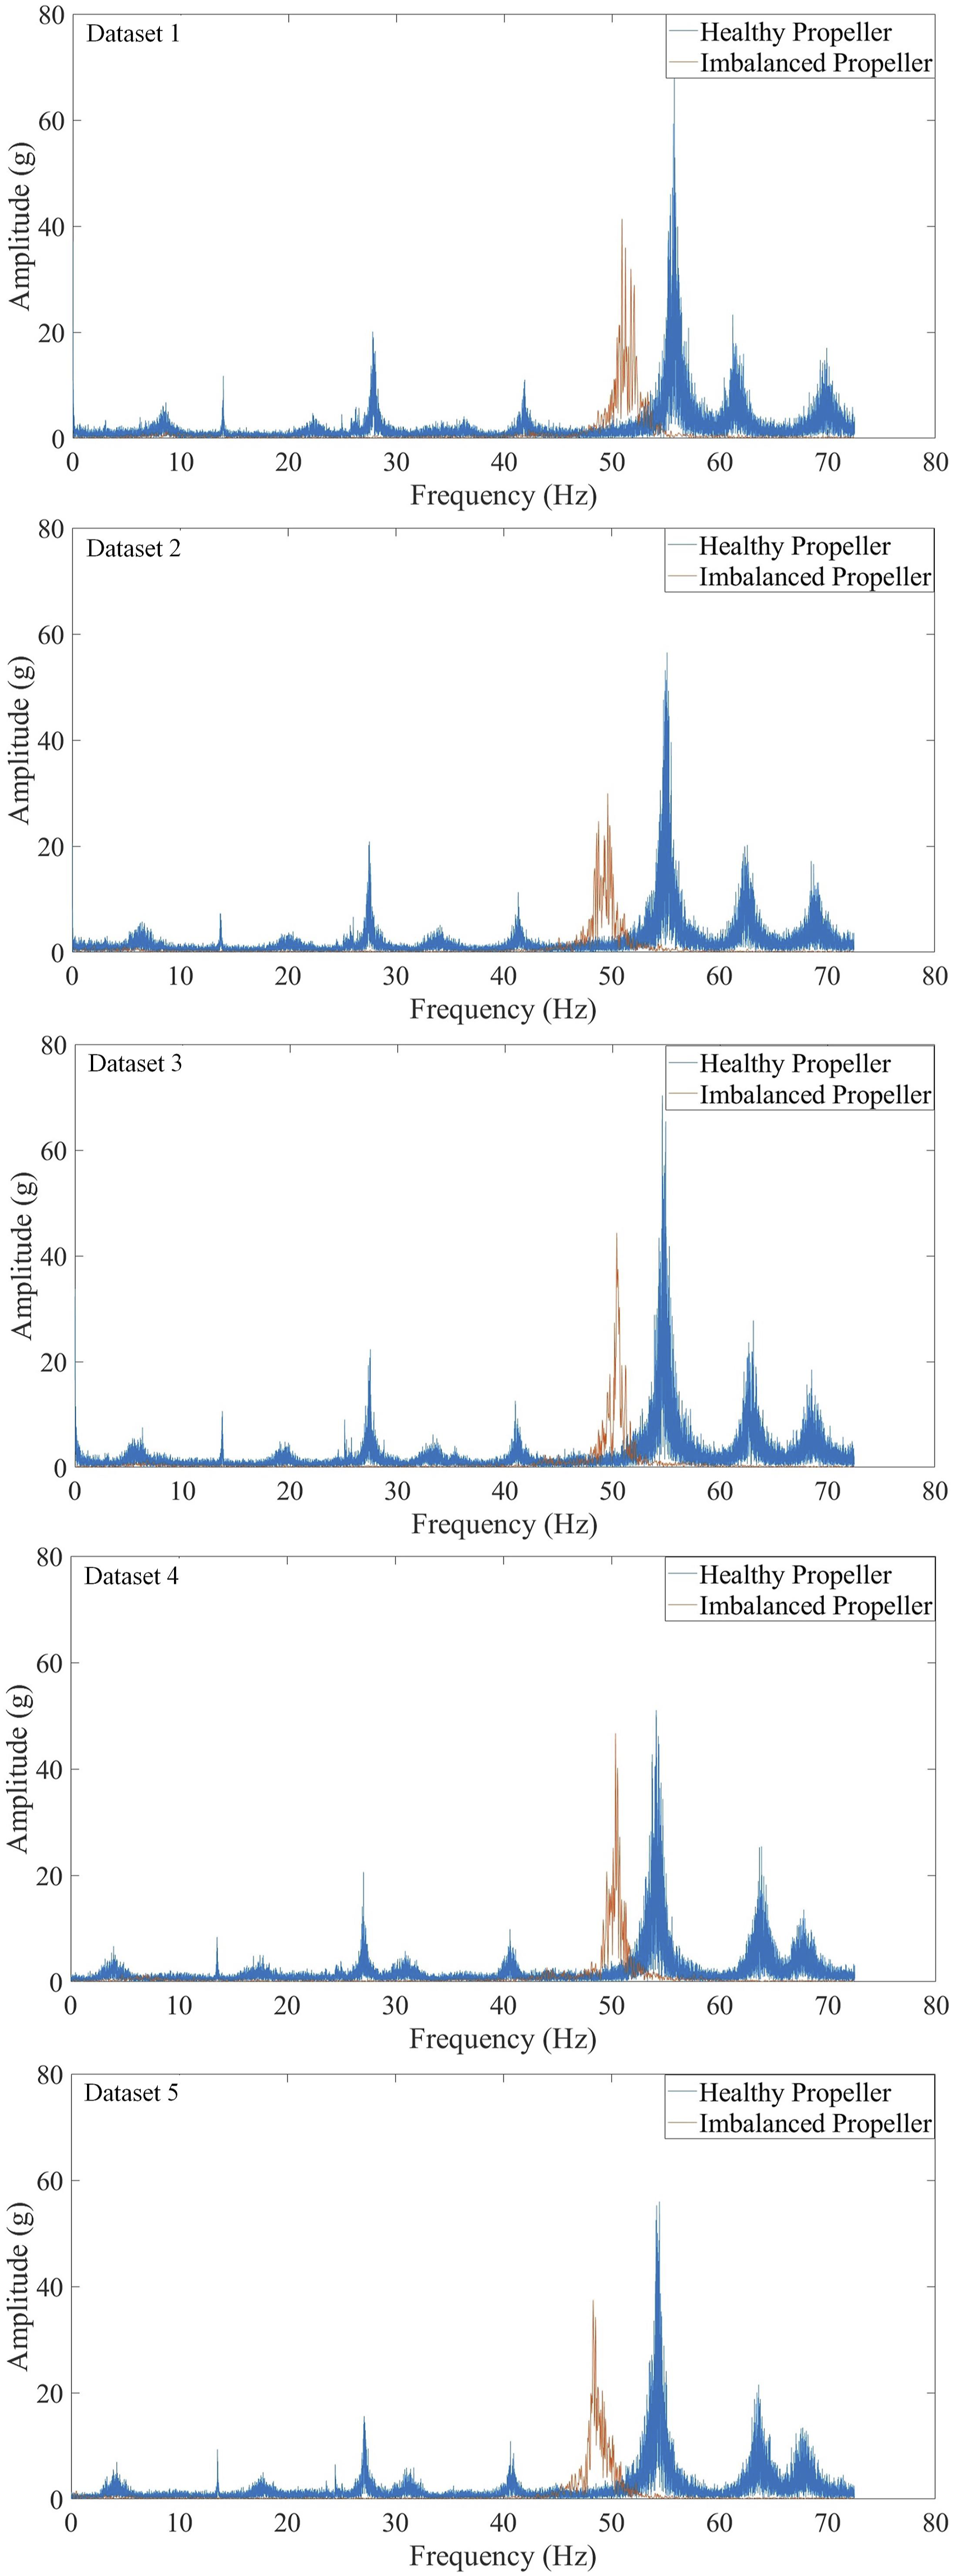
Time-domain vibration data in the ground mode.

As mentioned before, the vibration-based propeller imbalanced detection under different environments is also conducted, and the findings can be observed in Figure 5. The imbalanced propeller can still be detected when the detection process is conducted outdoors or in the presence of wind with a speed of 3.3 m/s. There are shifts of frequencies to the left when imbalances occur in the UAV propeller, with a difference of 12.4% (windy environment) and 6.7% (outdoor environment). Frequency values obtained under different environments during the ground mode.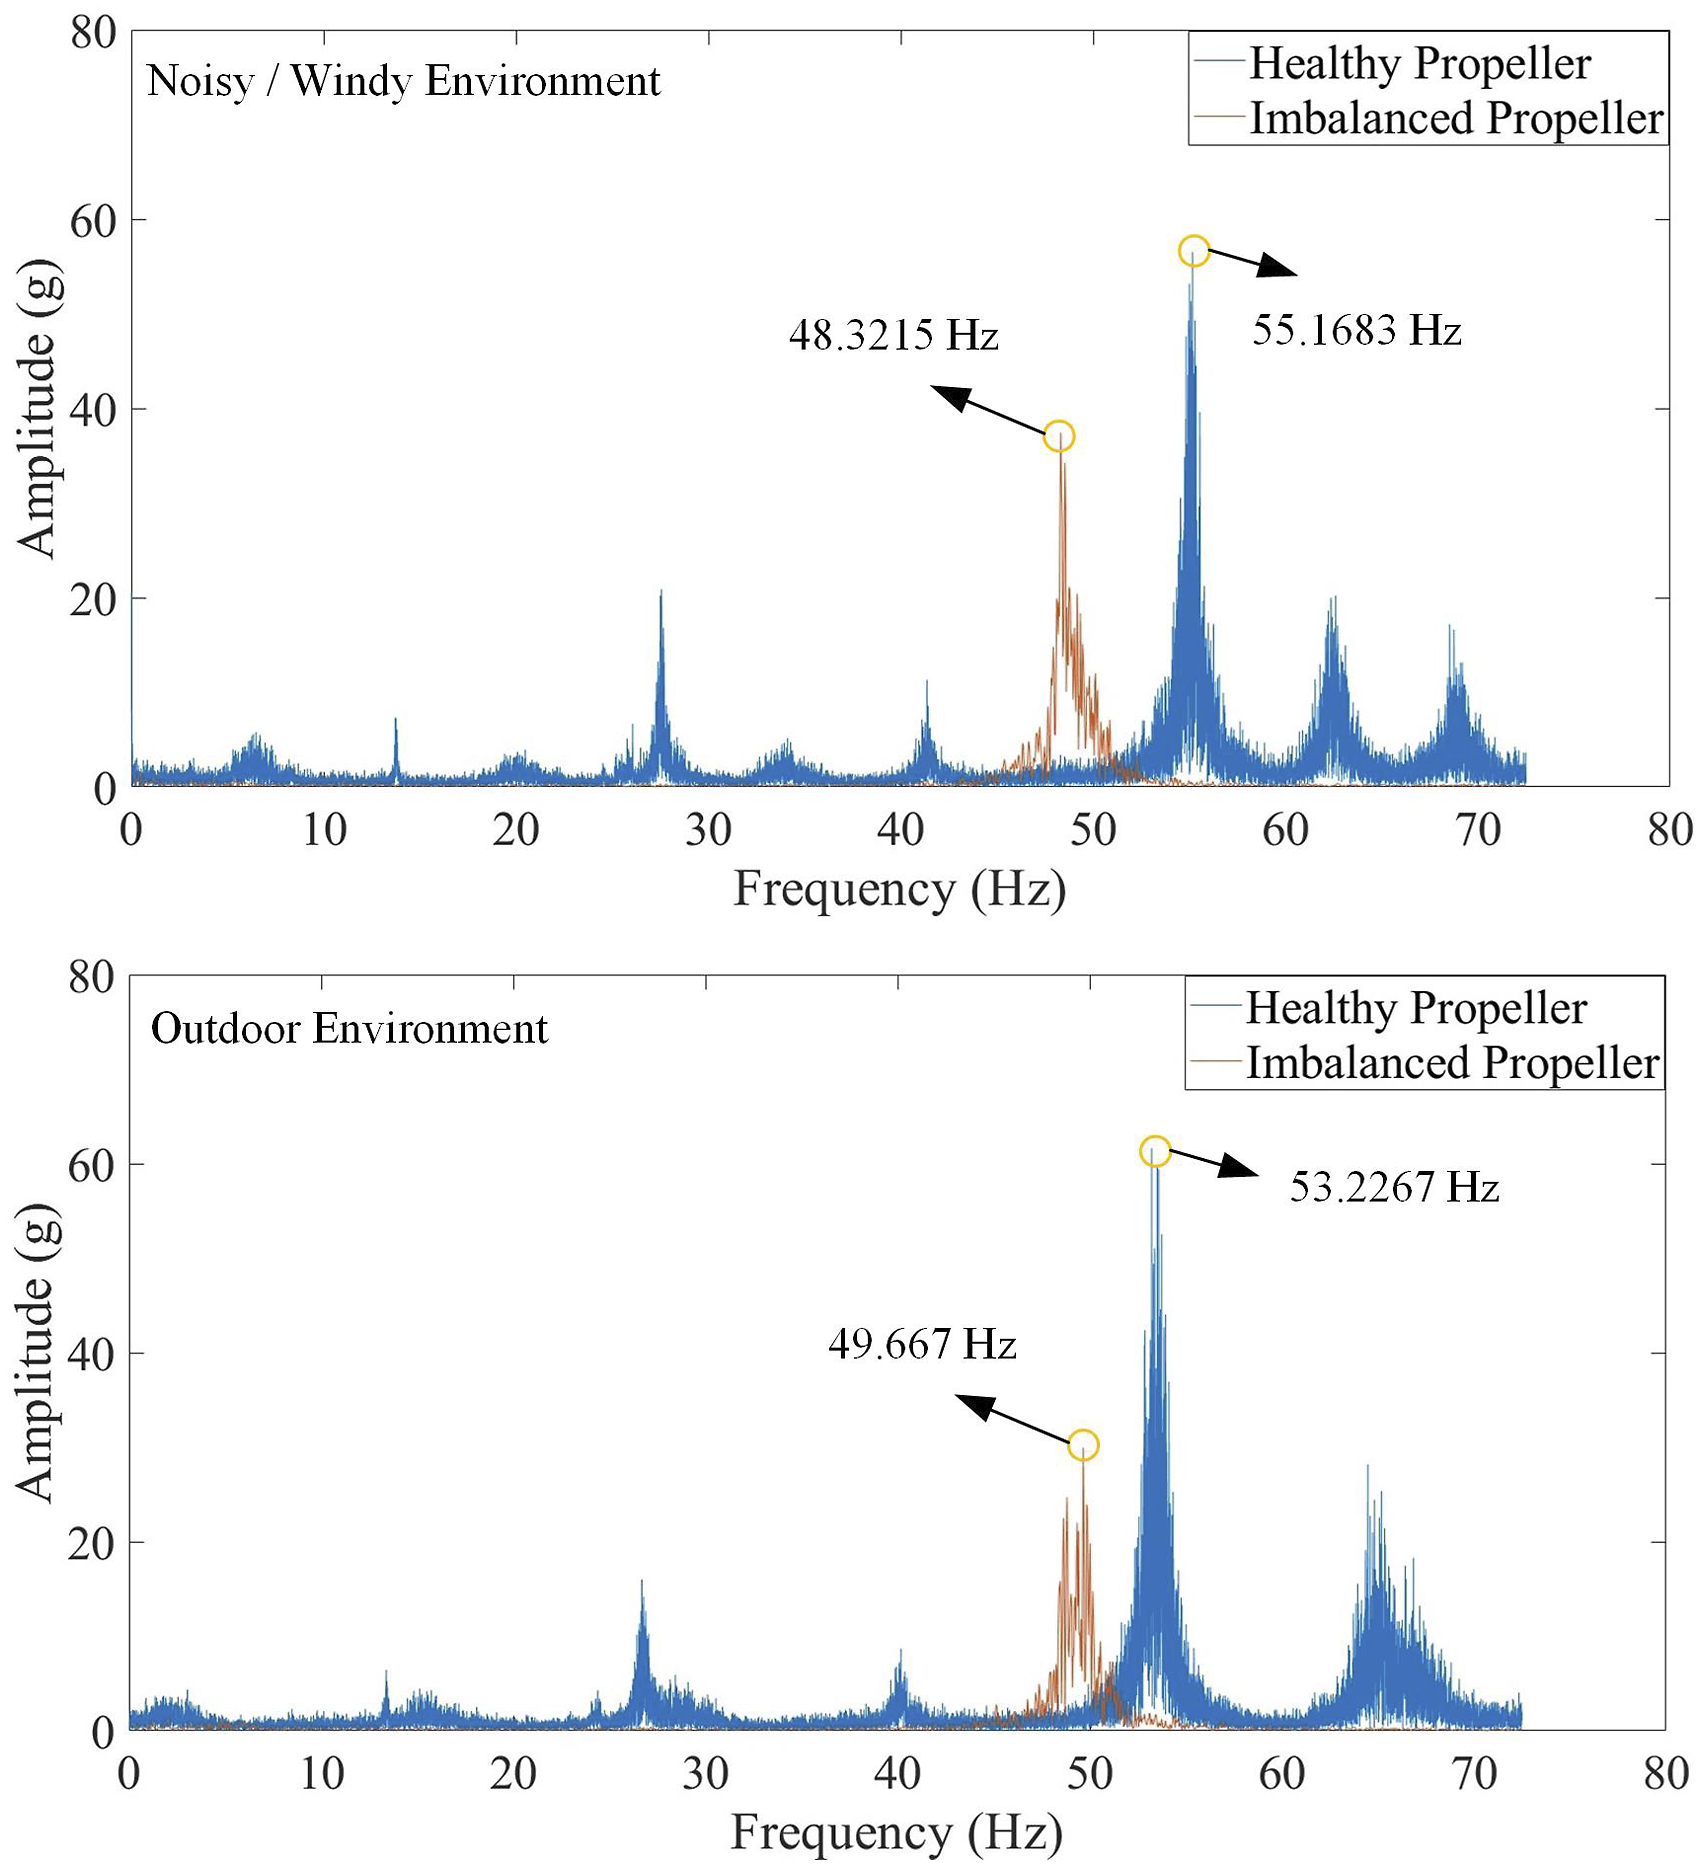
4.1.2. Thrust mode
Frequencies of different propeller conditions acquired from the accelerometer in the thrust mode.
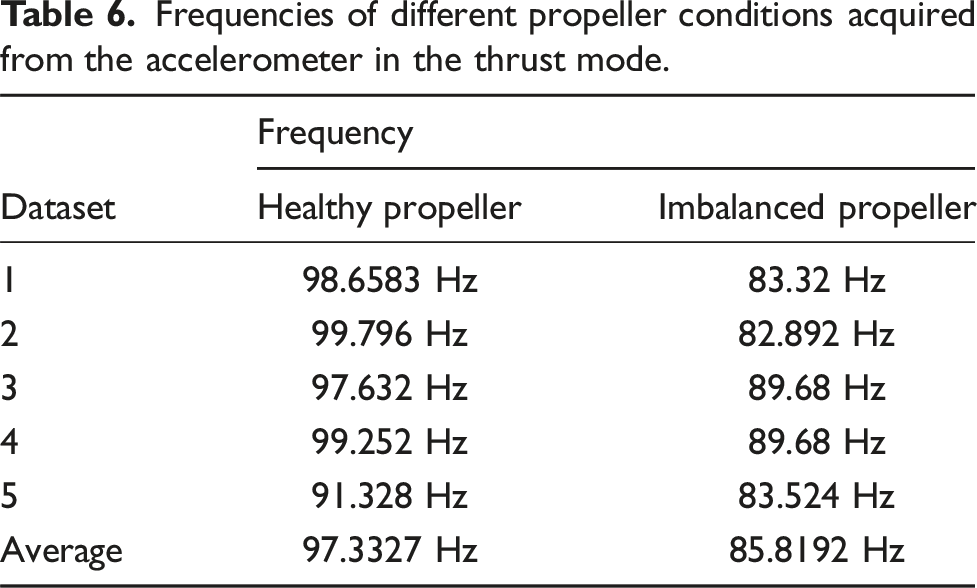
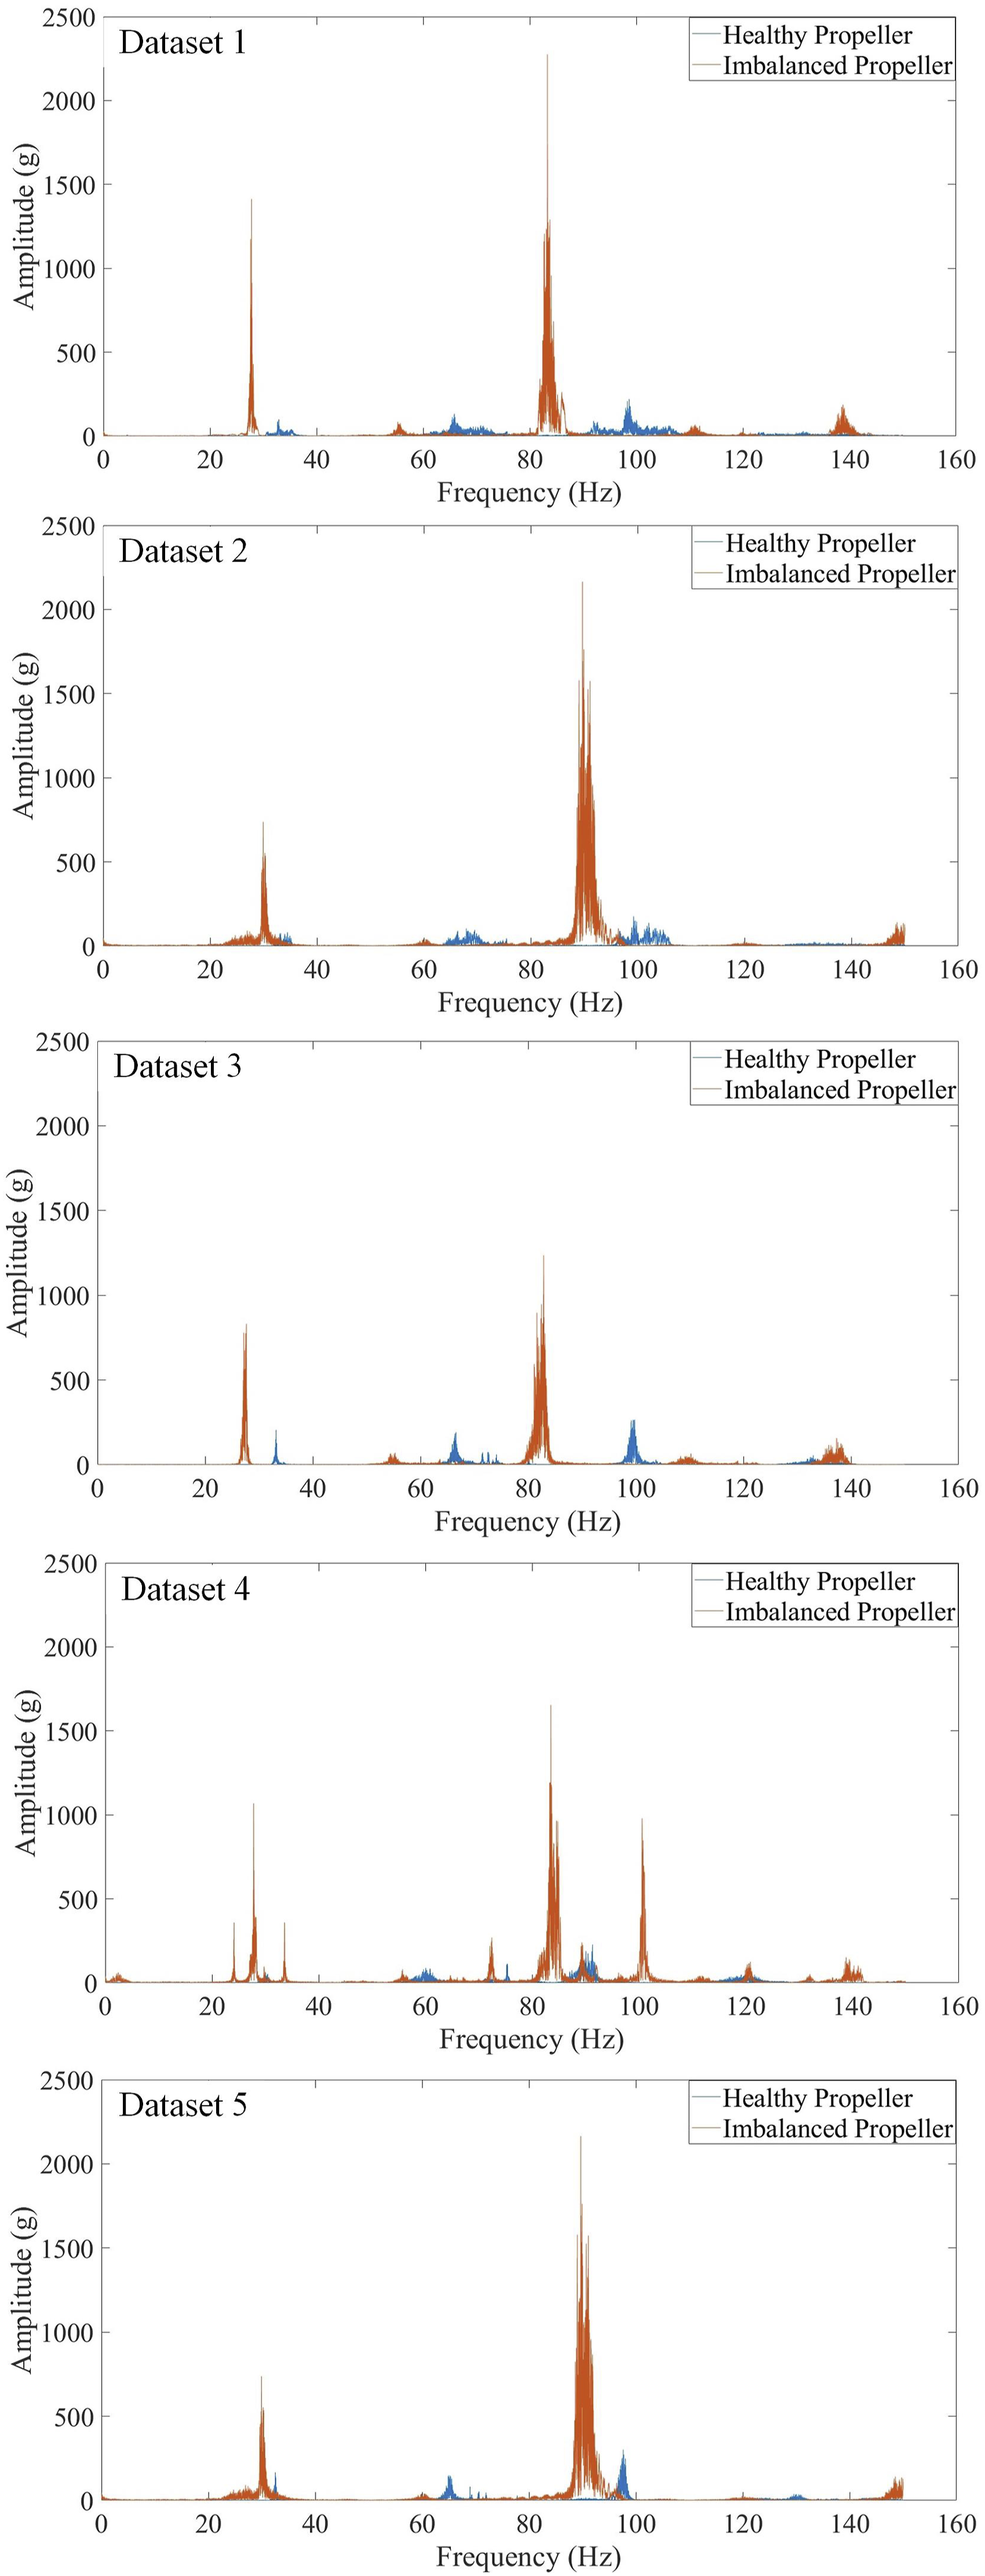
Frequency values obtained from the ADXL335 accelerometer in the thrust mode.
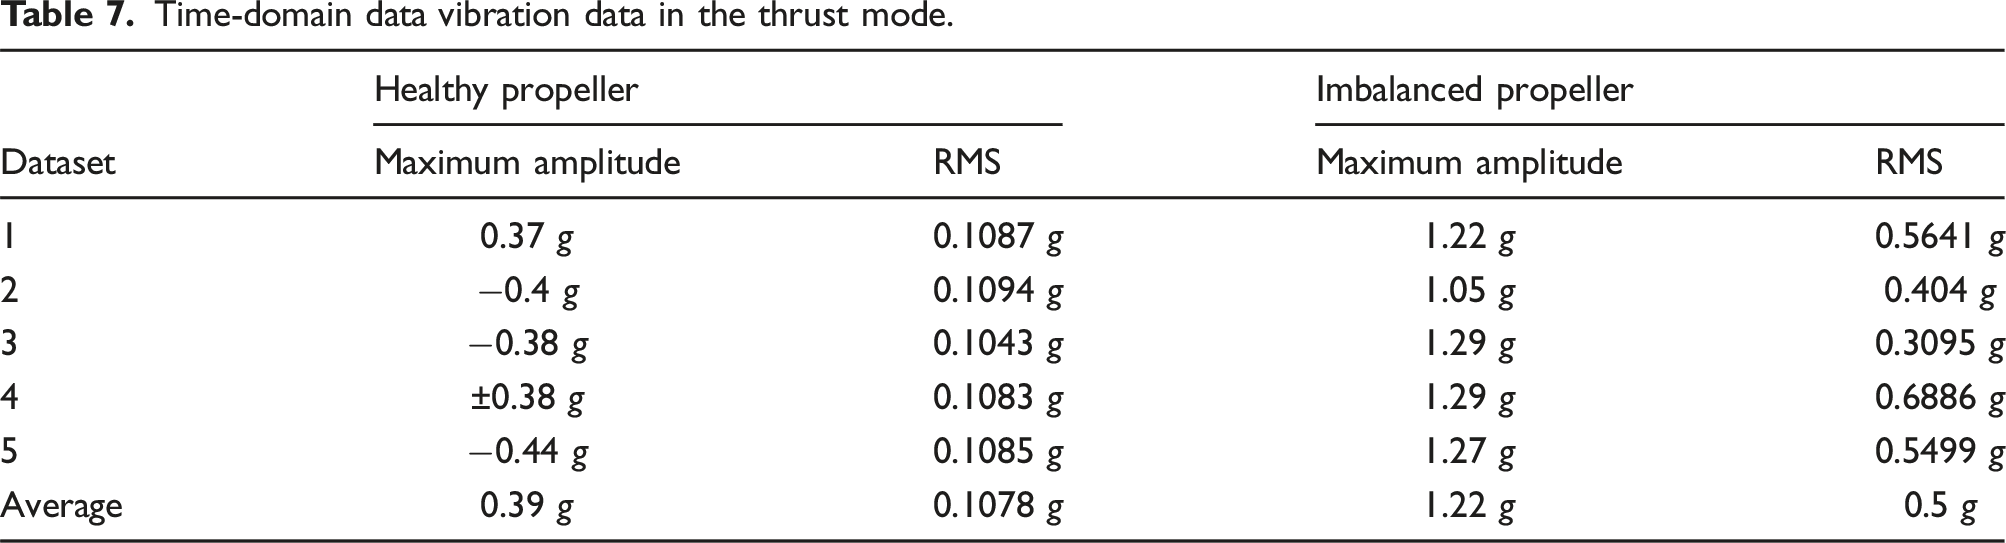
Time-domain data vibration data in the thrust mode.
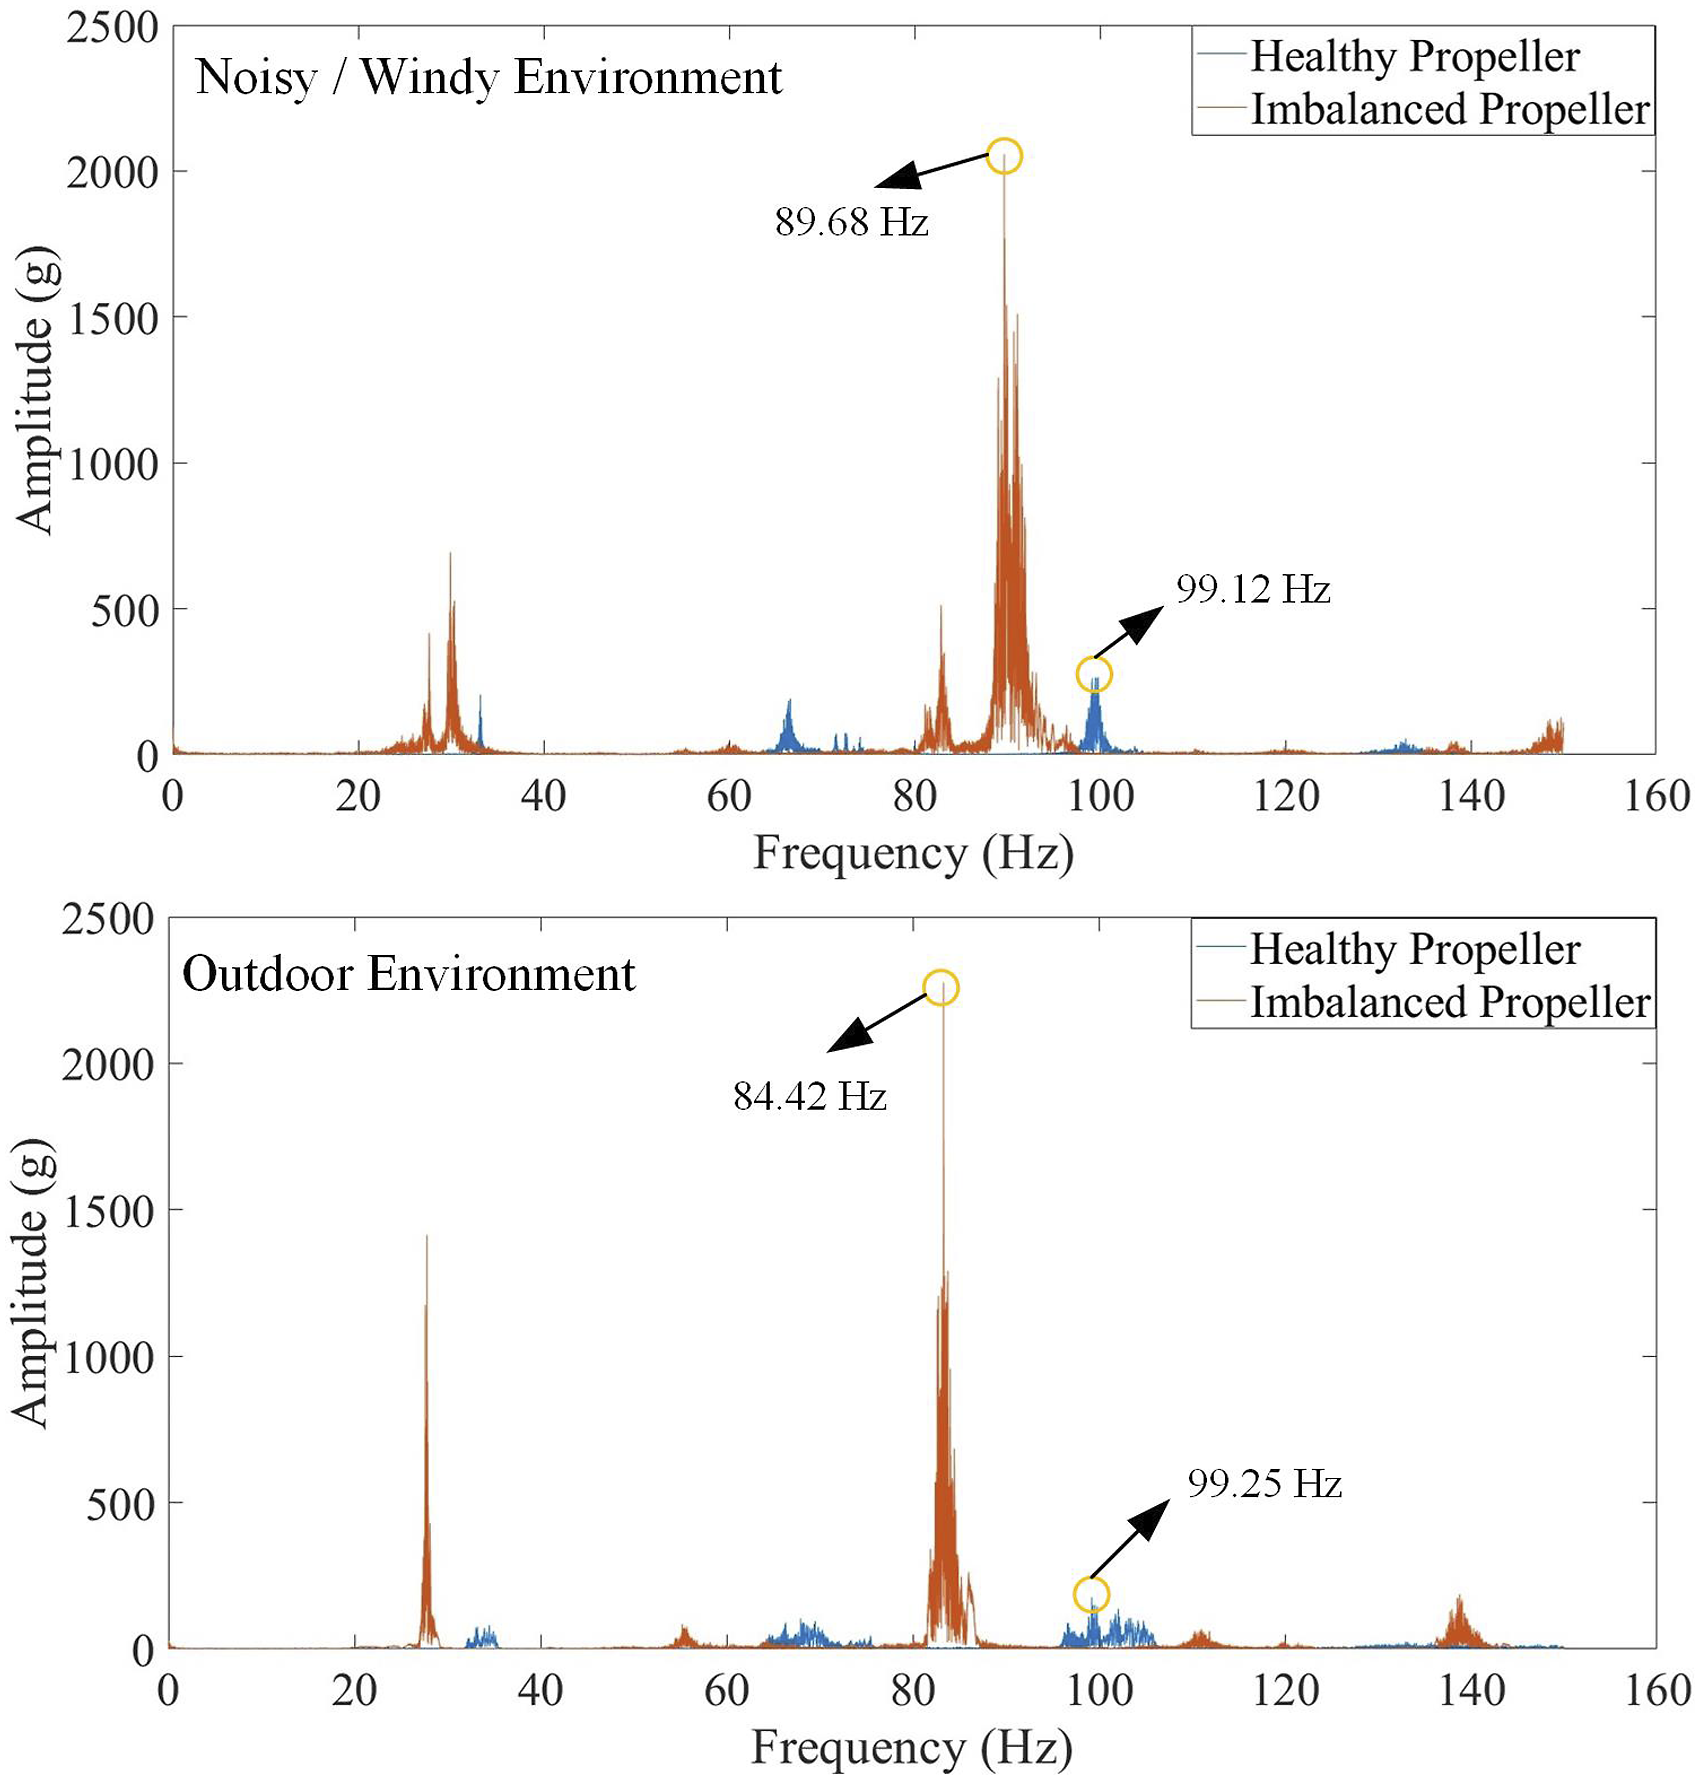
Frequency values obtained under different environments during the thrust mode.
4.4. Acoustic-based propeller imbalanced detection
Similar to the vibration-based results, the acoustic results are divided into ground and thrust modes. The experiments are also repeated five times, and the data are labeled Datasets 1, 2, 3, 4, and 5. However, the obtained data consists of analog voltage readings ranging from 0 to 1023, rather than frequency data.
4.2.1. Ground mode
Figure 8 shows the time-domain representation of acoustic data for healthy and imbalanced propellers in the ground mode. The maximum amplitudes for all five datasets are in the range of 600 to 900, with an average amplitude value of 84.25. For the imbalanced propeller condition, the maximum amplitudes surpass 900, while the average amplitude value drops to 78.46. Based on the results, as shown in Figure 8, both maximum amplitude and average amplitude values can be utilized to detect the imbalanced UAV propeller. Acoustic data obtained in the ground mode.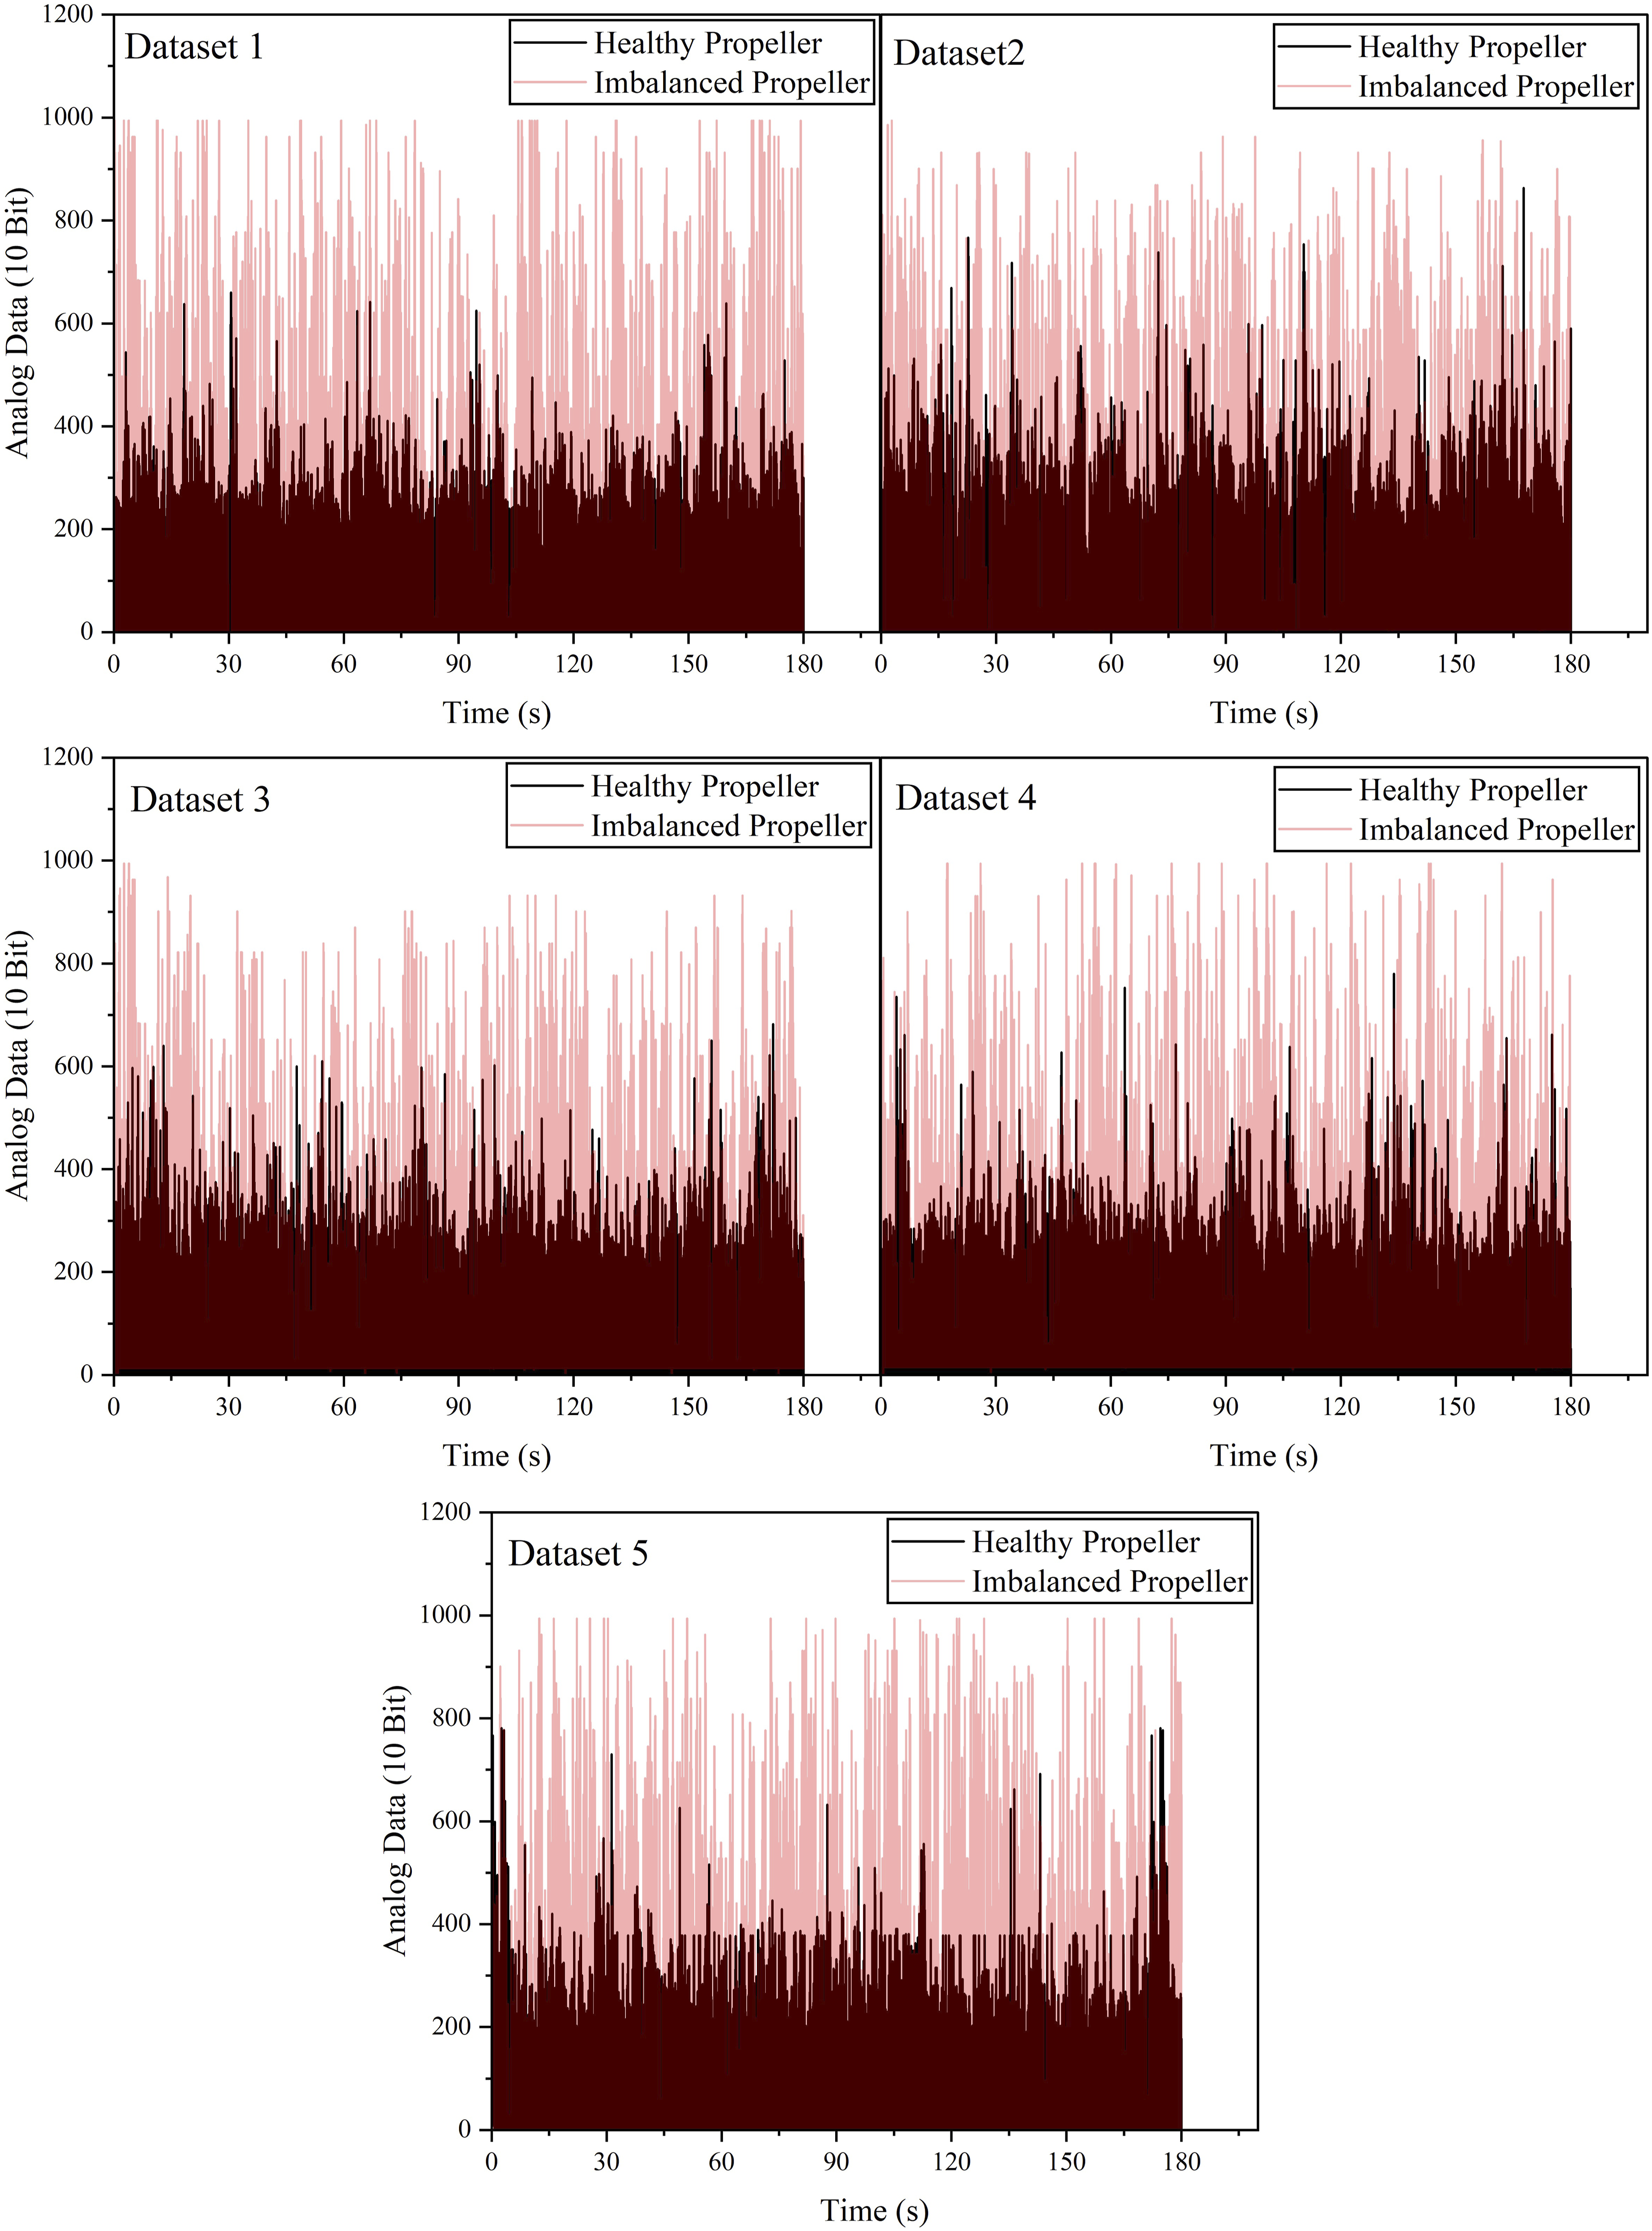
The maximum amplitudes of acoustic data for a healthy propeller surpass 900 under a windy or noisy environment, as depicted in Figure 9. The average amplitudes for the healthy and faulty propellers increase to 115.6 and 90.5, respectively. Compared to the normal environment (absent of wind), maximum amplitude values cannot be utilized to detect the imbalanced propeller. Acoustic data obtained under different environments (ground mode).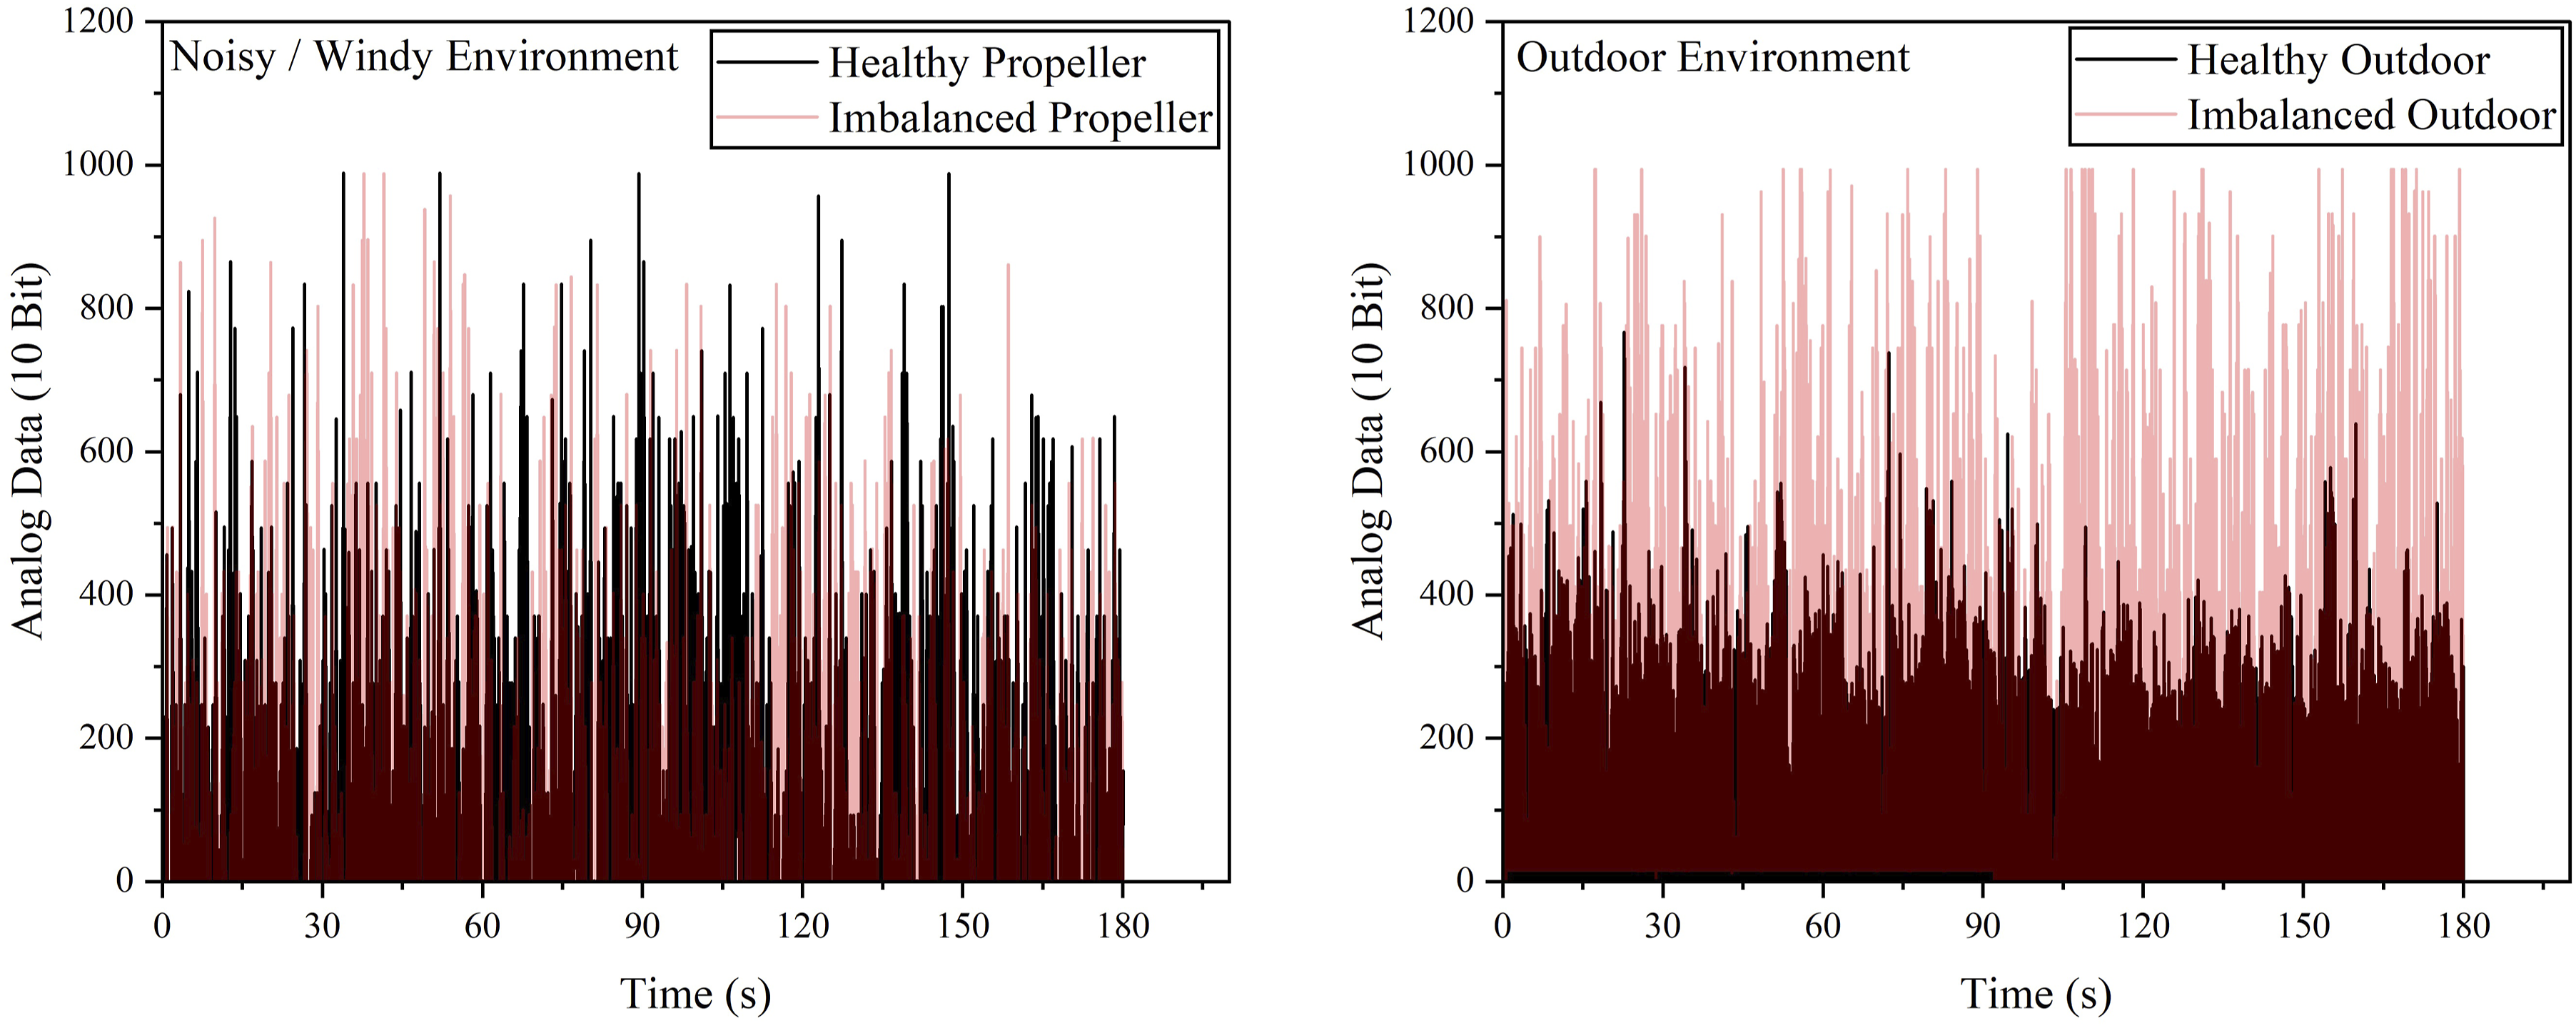
4.2.2. Thrust mode
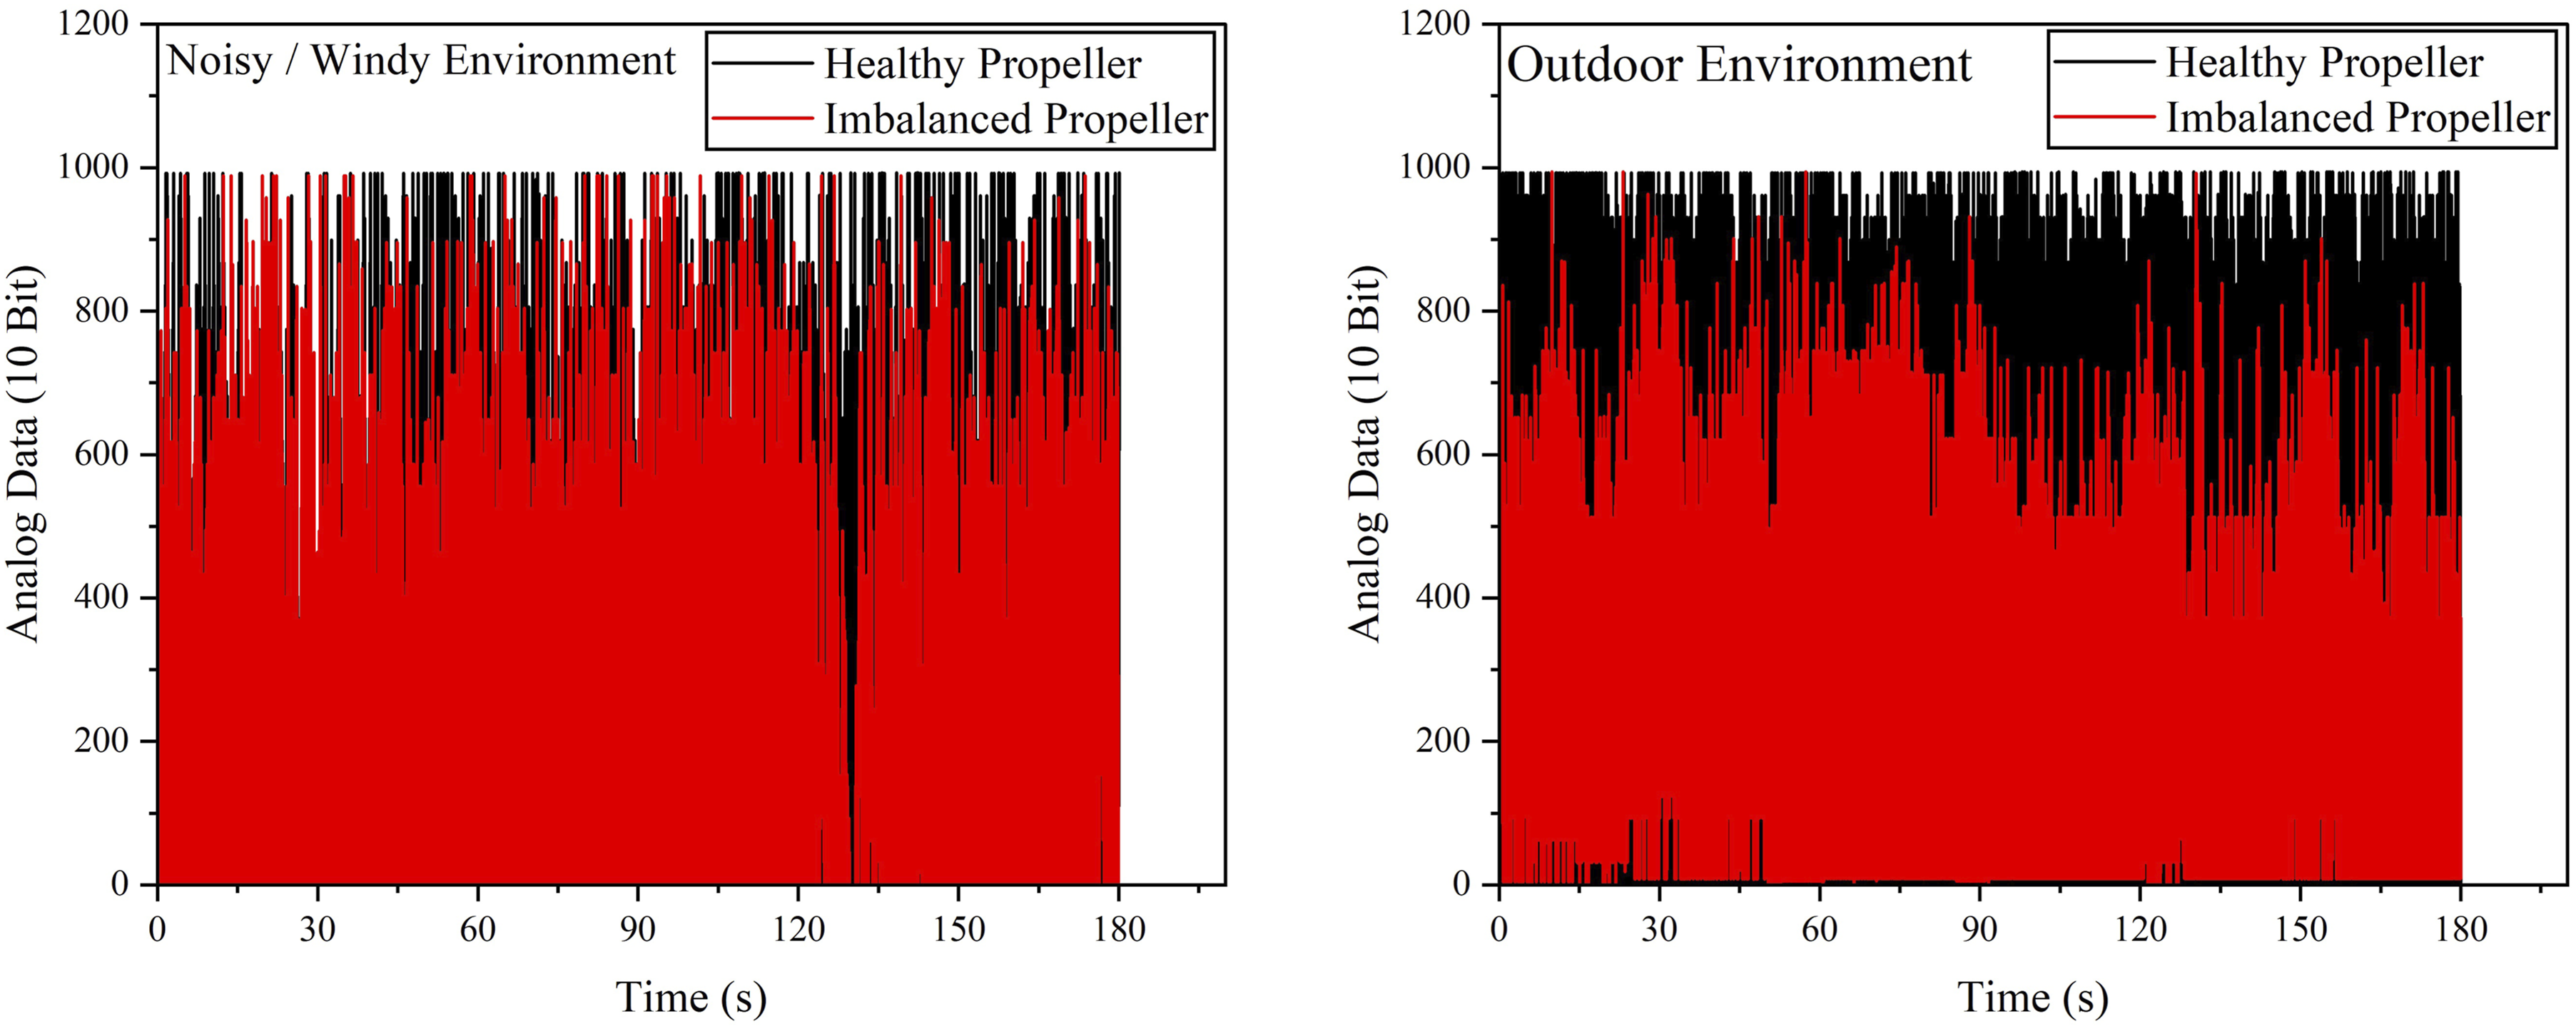
Figure 10 shows the time-domain representation of acoustic data for a healthy propeller in the thrust mode. The maximum amplitudes for all five datasets surpass 900, with an average amplitude value of 354.96. For the imbalanced propeller condition, the maximum amplitudes surpass 900, while the average amplitude value drops to 276.07, as depicted in Figure 10. The increase in the amplitude values is due to the higher noise produced during the thrust mode compared to the ground mode. It is recommended to only use the average amplitude value for the fault detection process since occasionally healthy propellers can display maximum amplitude beyond 900, which can also be identified as an imbalanced propeller. Under different environments, the acoustic data can be observed in Figure 11. Acoustic data obtained in the thrust mode. Acoustic data obtained under different environments (thrust mode).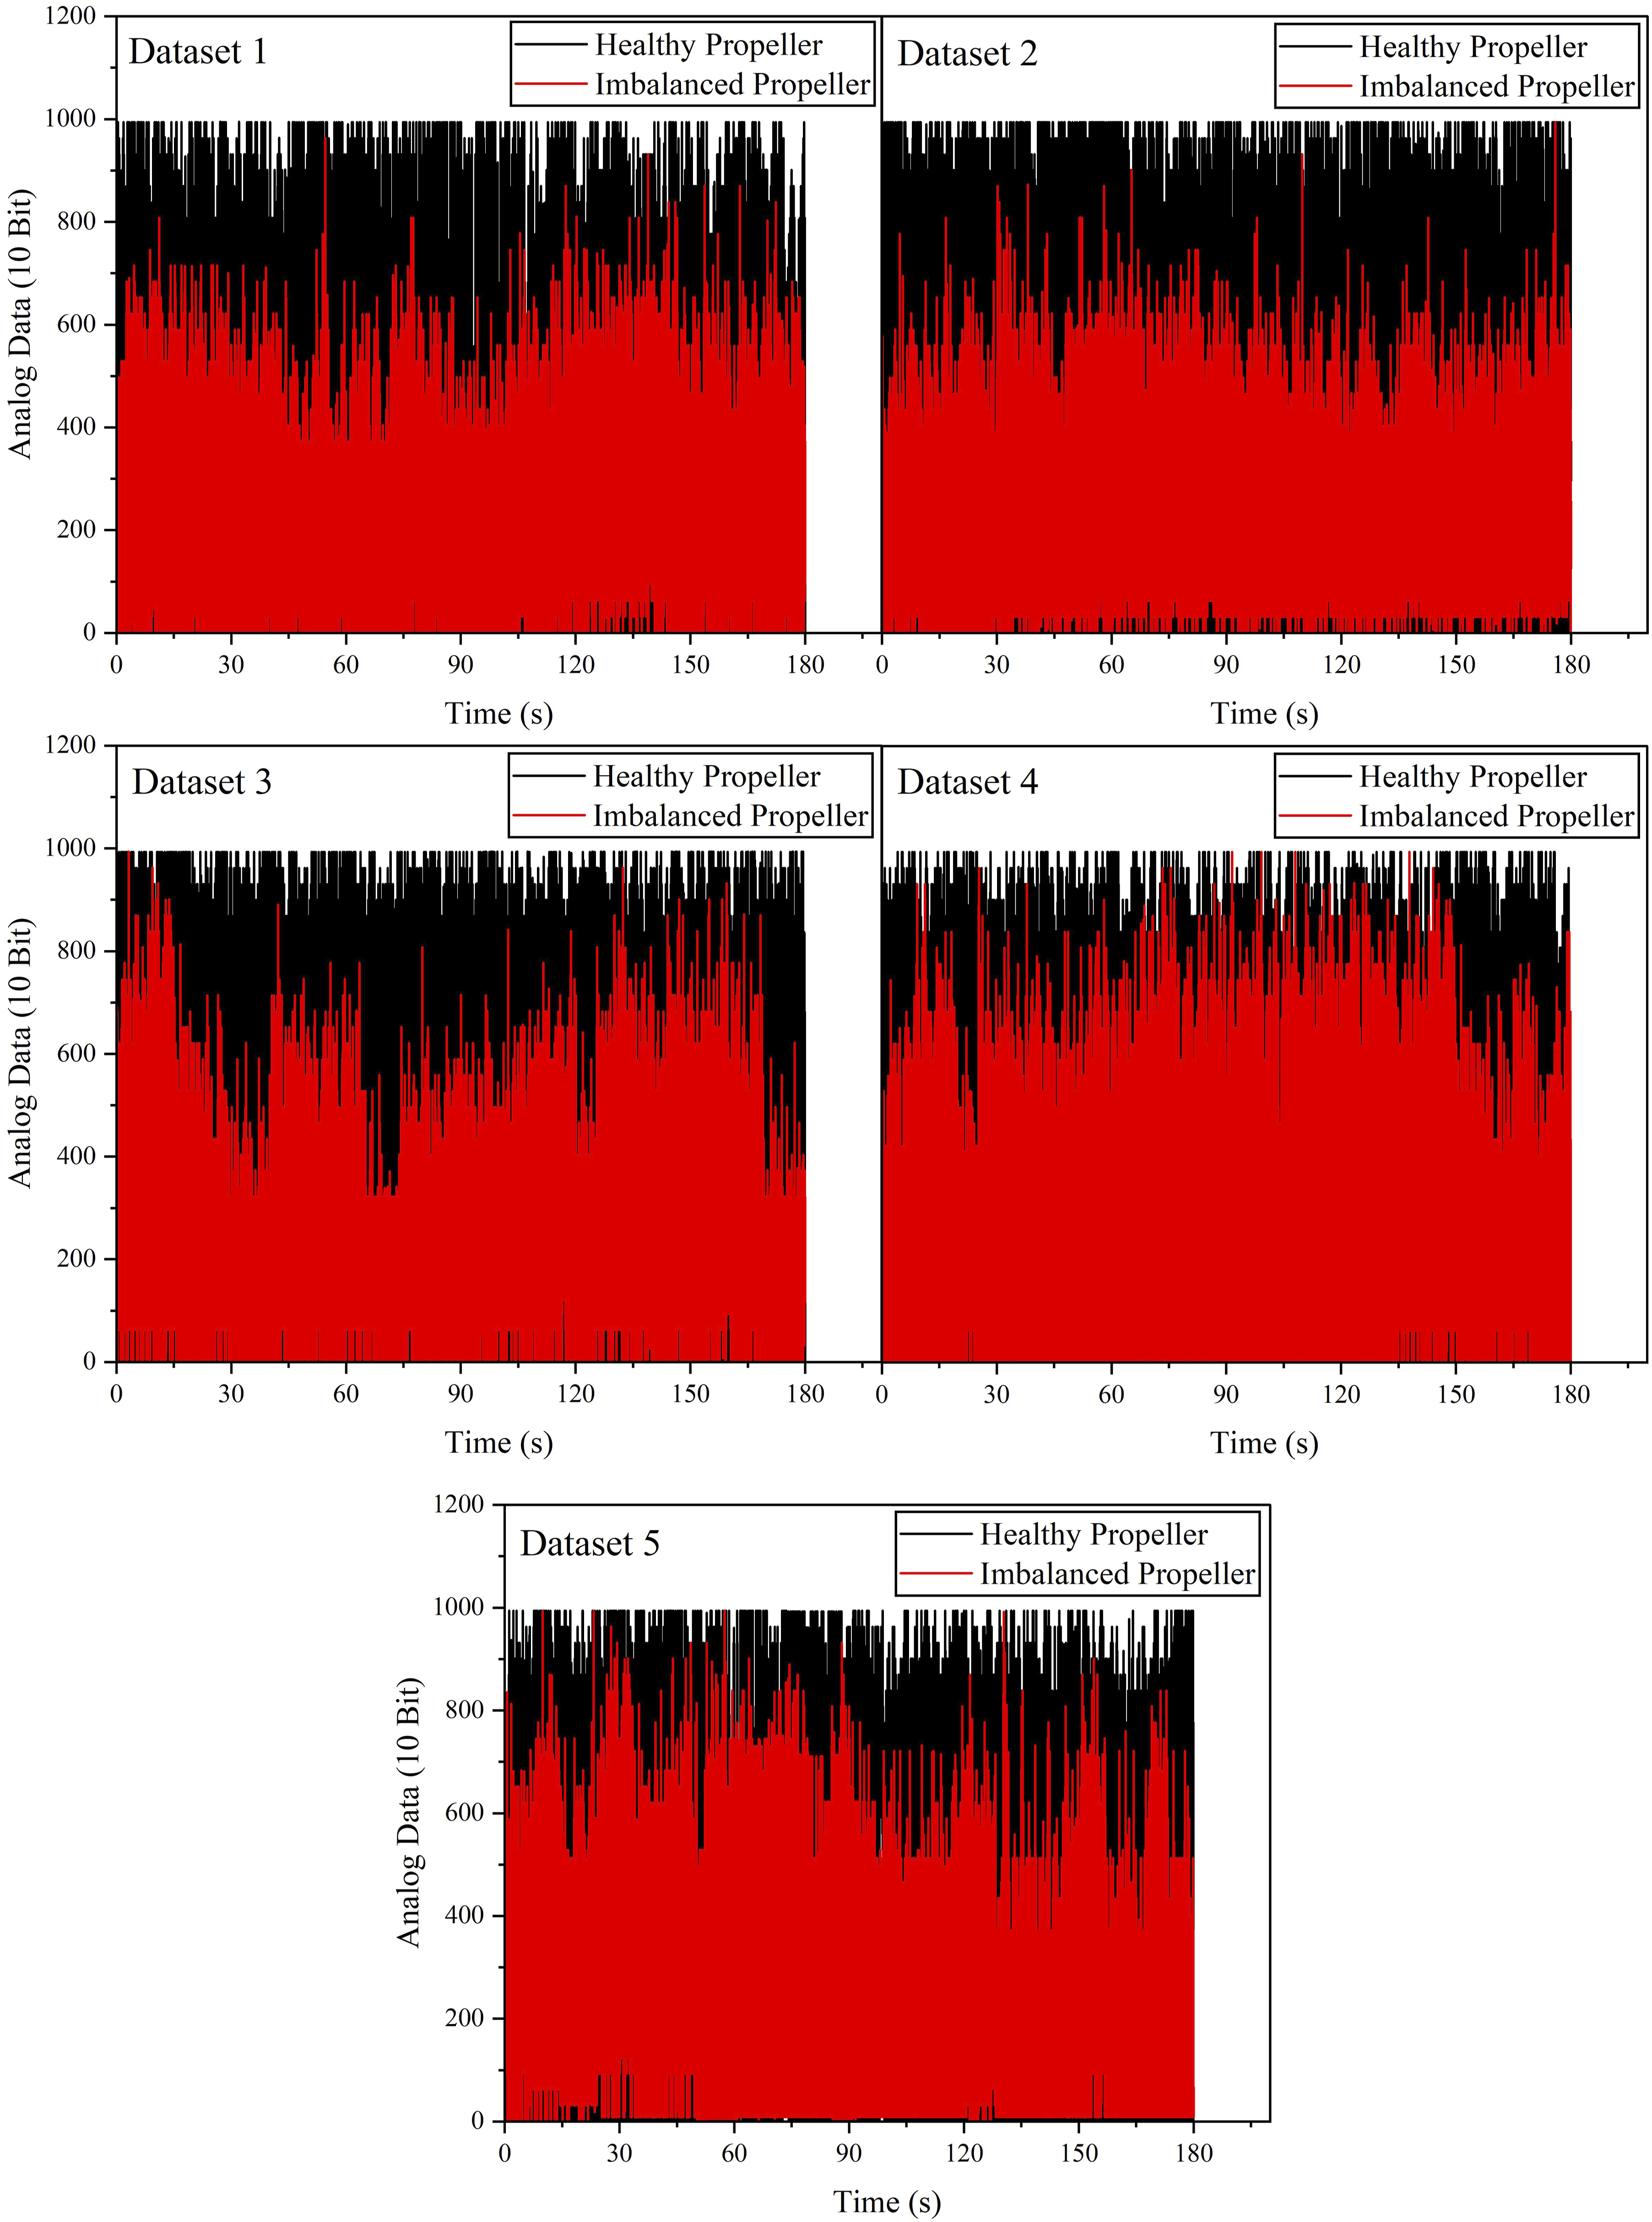
5. Visual-based propeller imbalanced detection
5.1. Ground mode
Figure 12 shows the vibration frequencies obtained from the Silky EvCam camera for different propeller conditions in the ground mode. For a healthy propeller, the camera detected a frequency of 58 Hz, where there is a small average percentage difference of 2.19% between the measurements obtained from the camera and accelerometer in terms of frequency. For an imbalanced propeller, the camera records a vibration frequency of 47 Hz, specifically at the motor arm and the motor. Referring to Table 4, the average percentage difference between the frequencies obtained from the camera and accelerometer is 9.93%. Frequency values obtained from vibration camera (ground mode).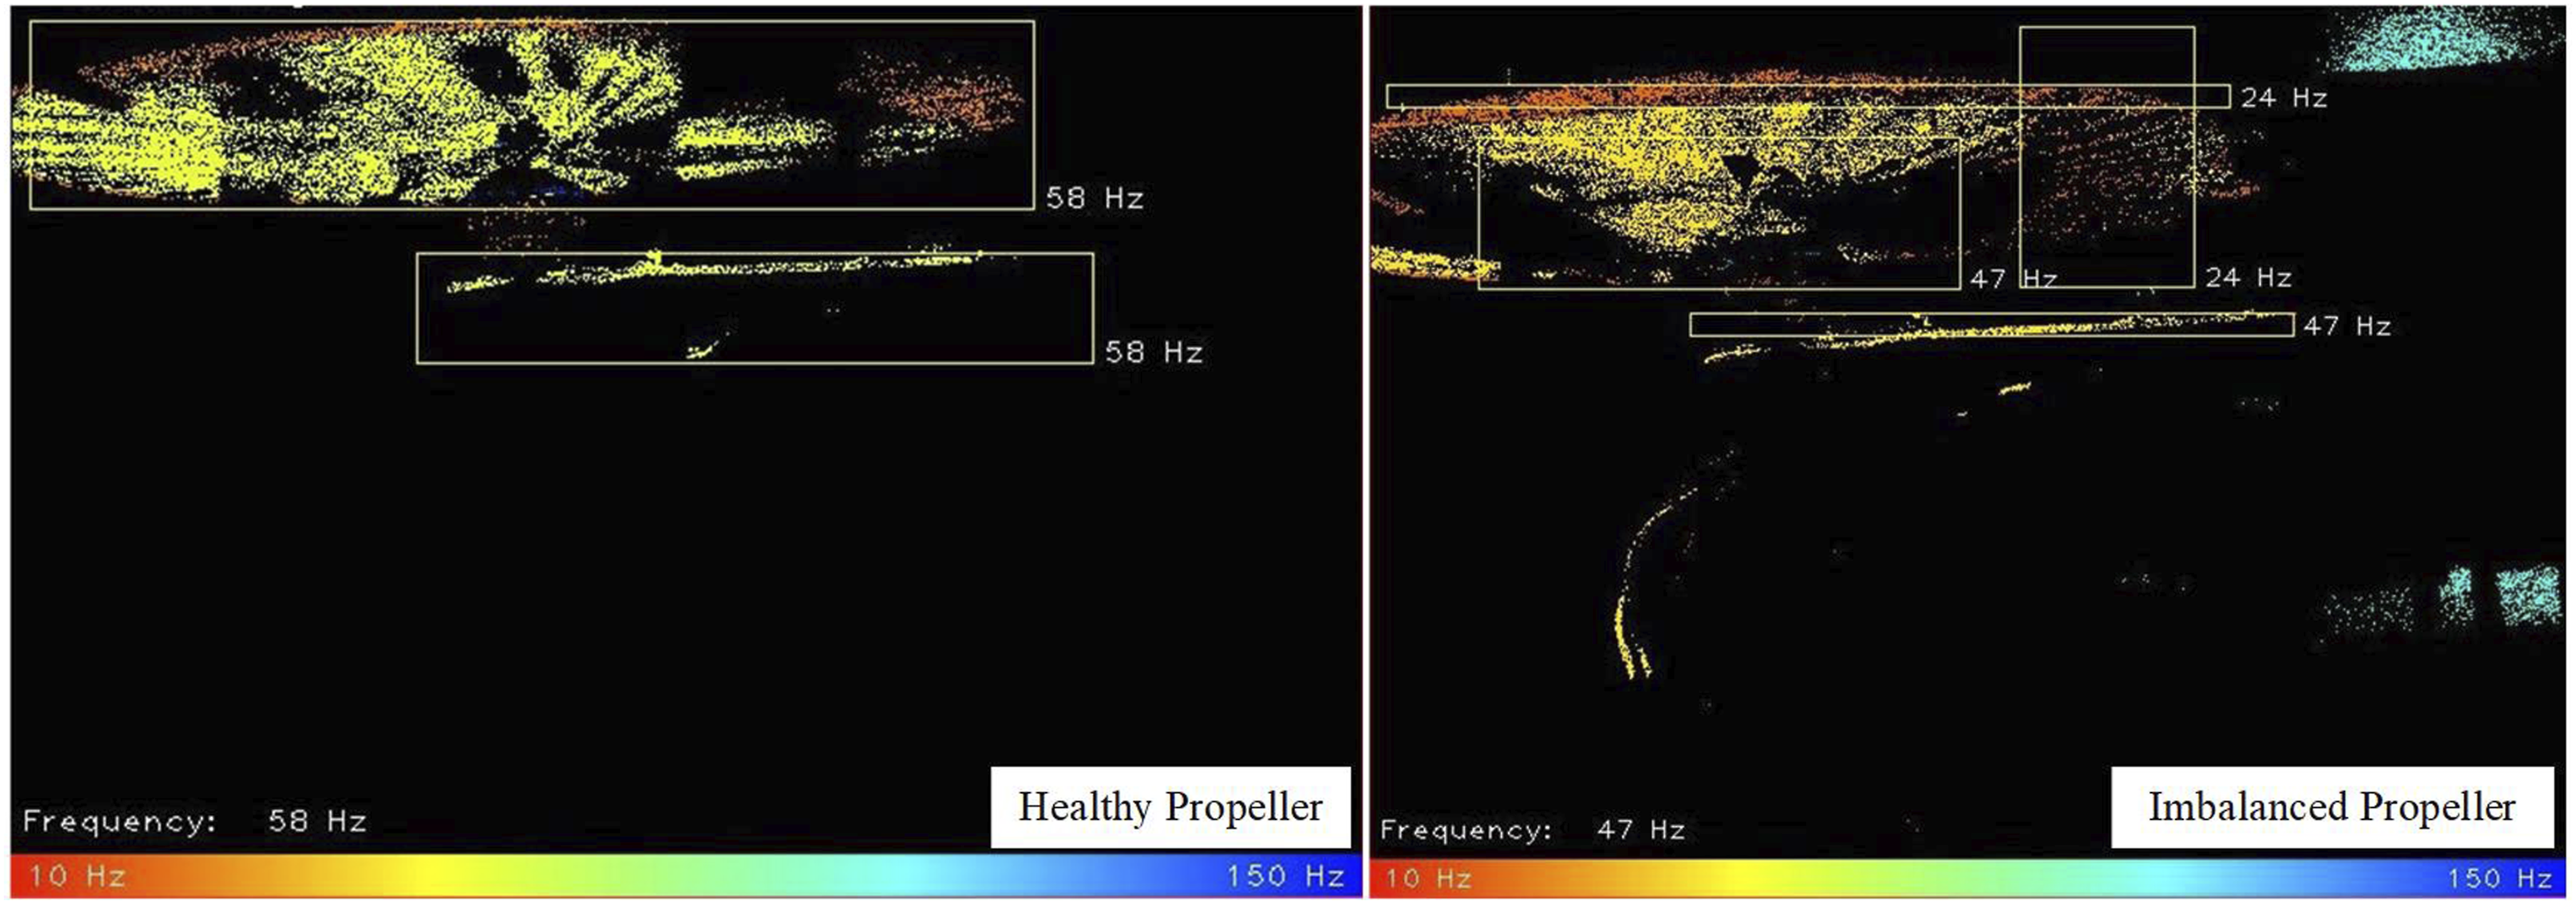
There is a 19% discrepancy between frequency values obtained from the Silky EvCam camera between healthy and imbalanced propellers. The discrepancy is slightly reduced to 5.56% when the detection process is conducted outdoors. As shown in Figure 13, the frequencies obtained for the healthy and imbalanced propeller cases are 54 H and 51 Hz, respectively. However, the frequencies remain the same in a noisy environment, which is similar to Figure 12. Frequency values obtained from vibration camera in outdoor environment (ground mode).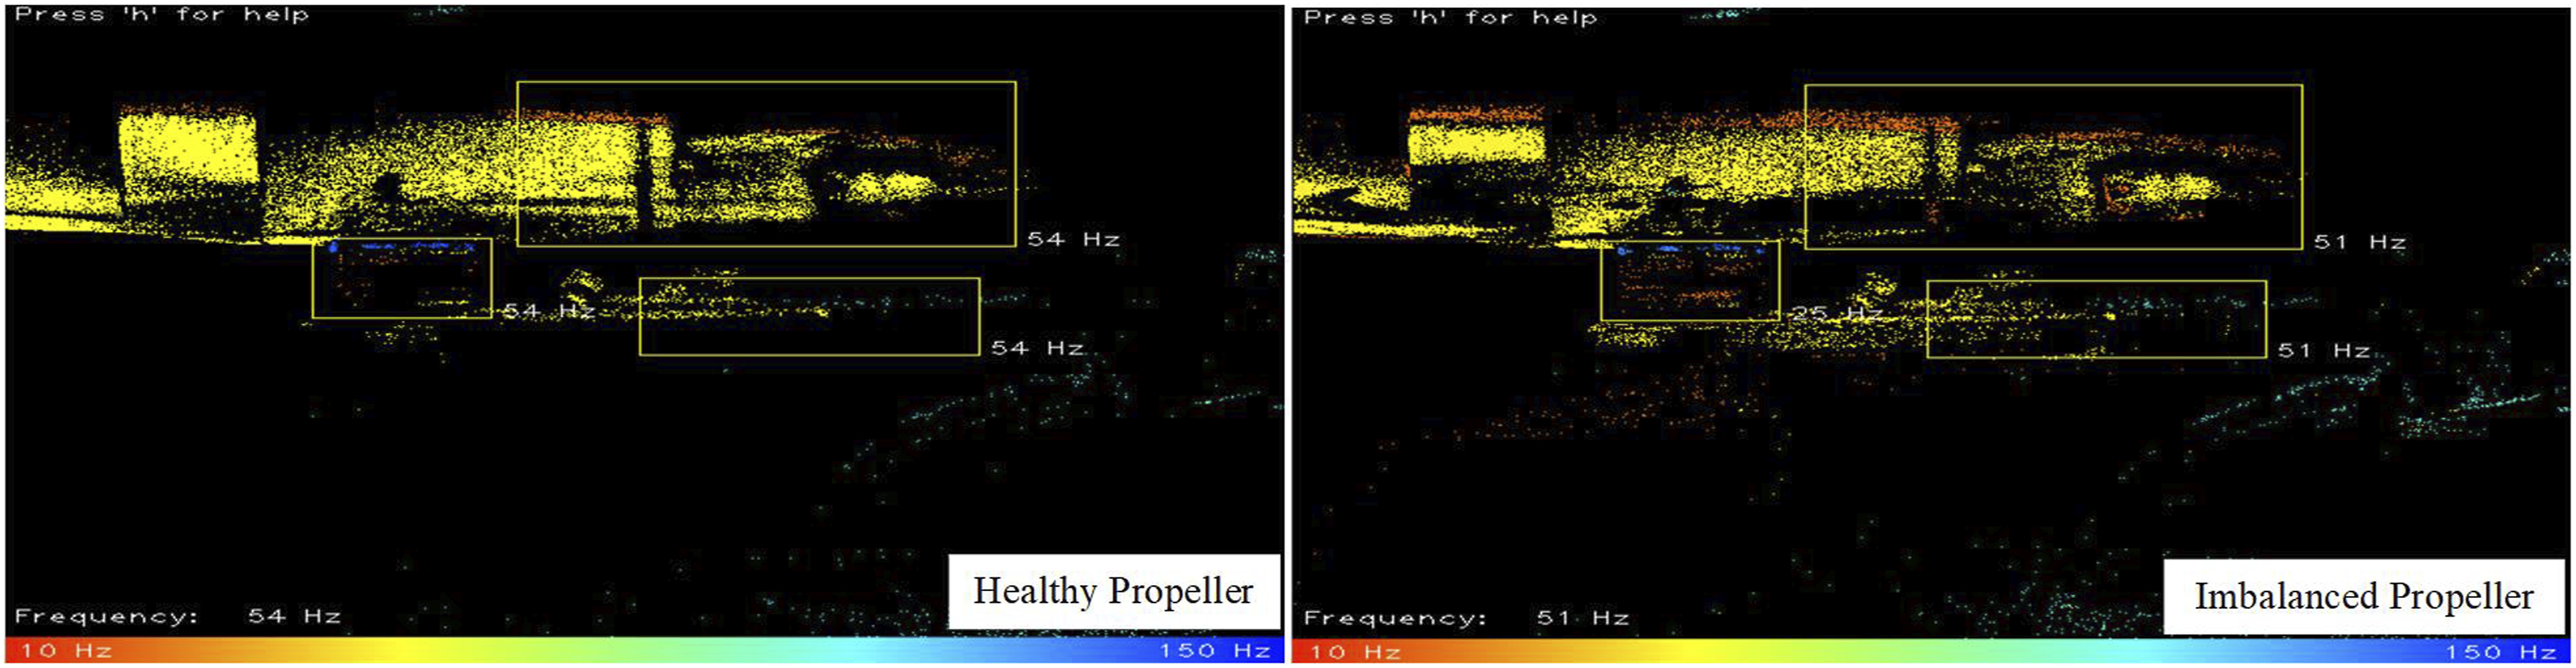
5.2. Thrust mode
Referring to Figure 14, for a healthy propeller condition, the vibration frequency estimated by the Silky EvCam camera is 85 Hz, a 46.55% increase compared to the frequency obtained in the ground mode. Based on Table 6, the average percentage difference between the frequencies obtained from the camera and accelerometer is 14.51%. For the imbalanced propeller, Figure 14 shows a 9.41% decrease in the frequency value compared to the healthy propeller condition. The vibration frequency estimated by the camera is 77 Hz, a slight decrease (10.28%) compared to the average frequency obtained from accelerometer data. Similar to the ground mode, it can be observed that the visual-based approach utilizing the Silky EvCam camera can detect imbalances in the UAV propeller during the thrust mode. Frequency values obtained from vibration camera (thrust mode).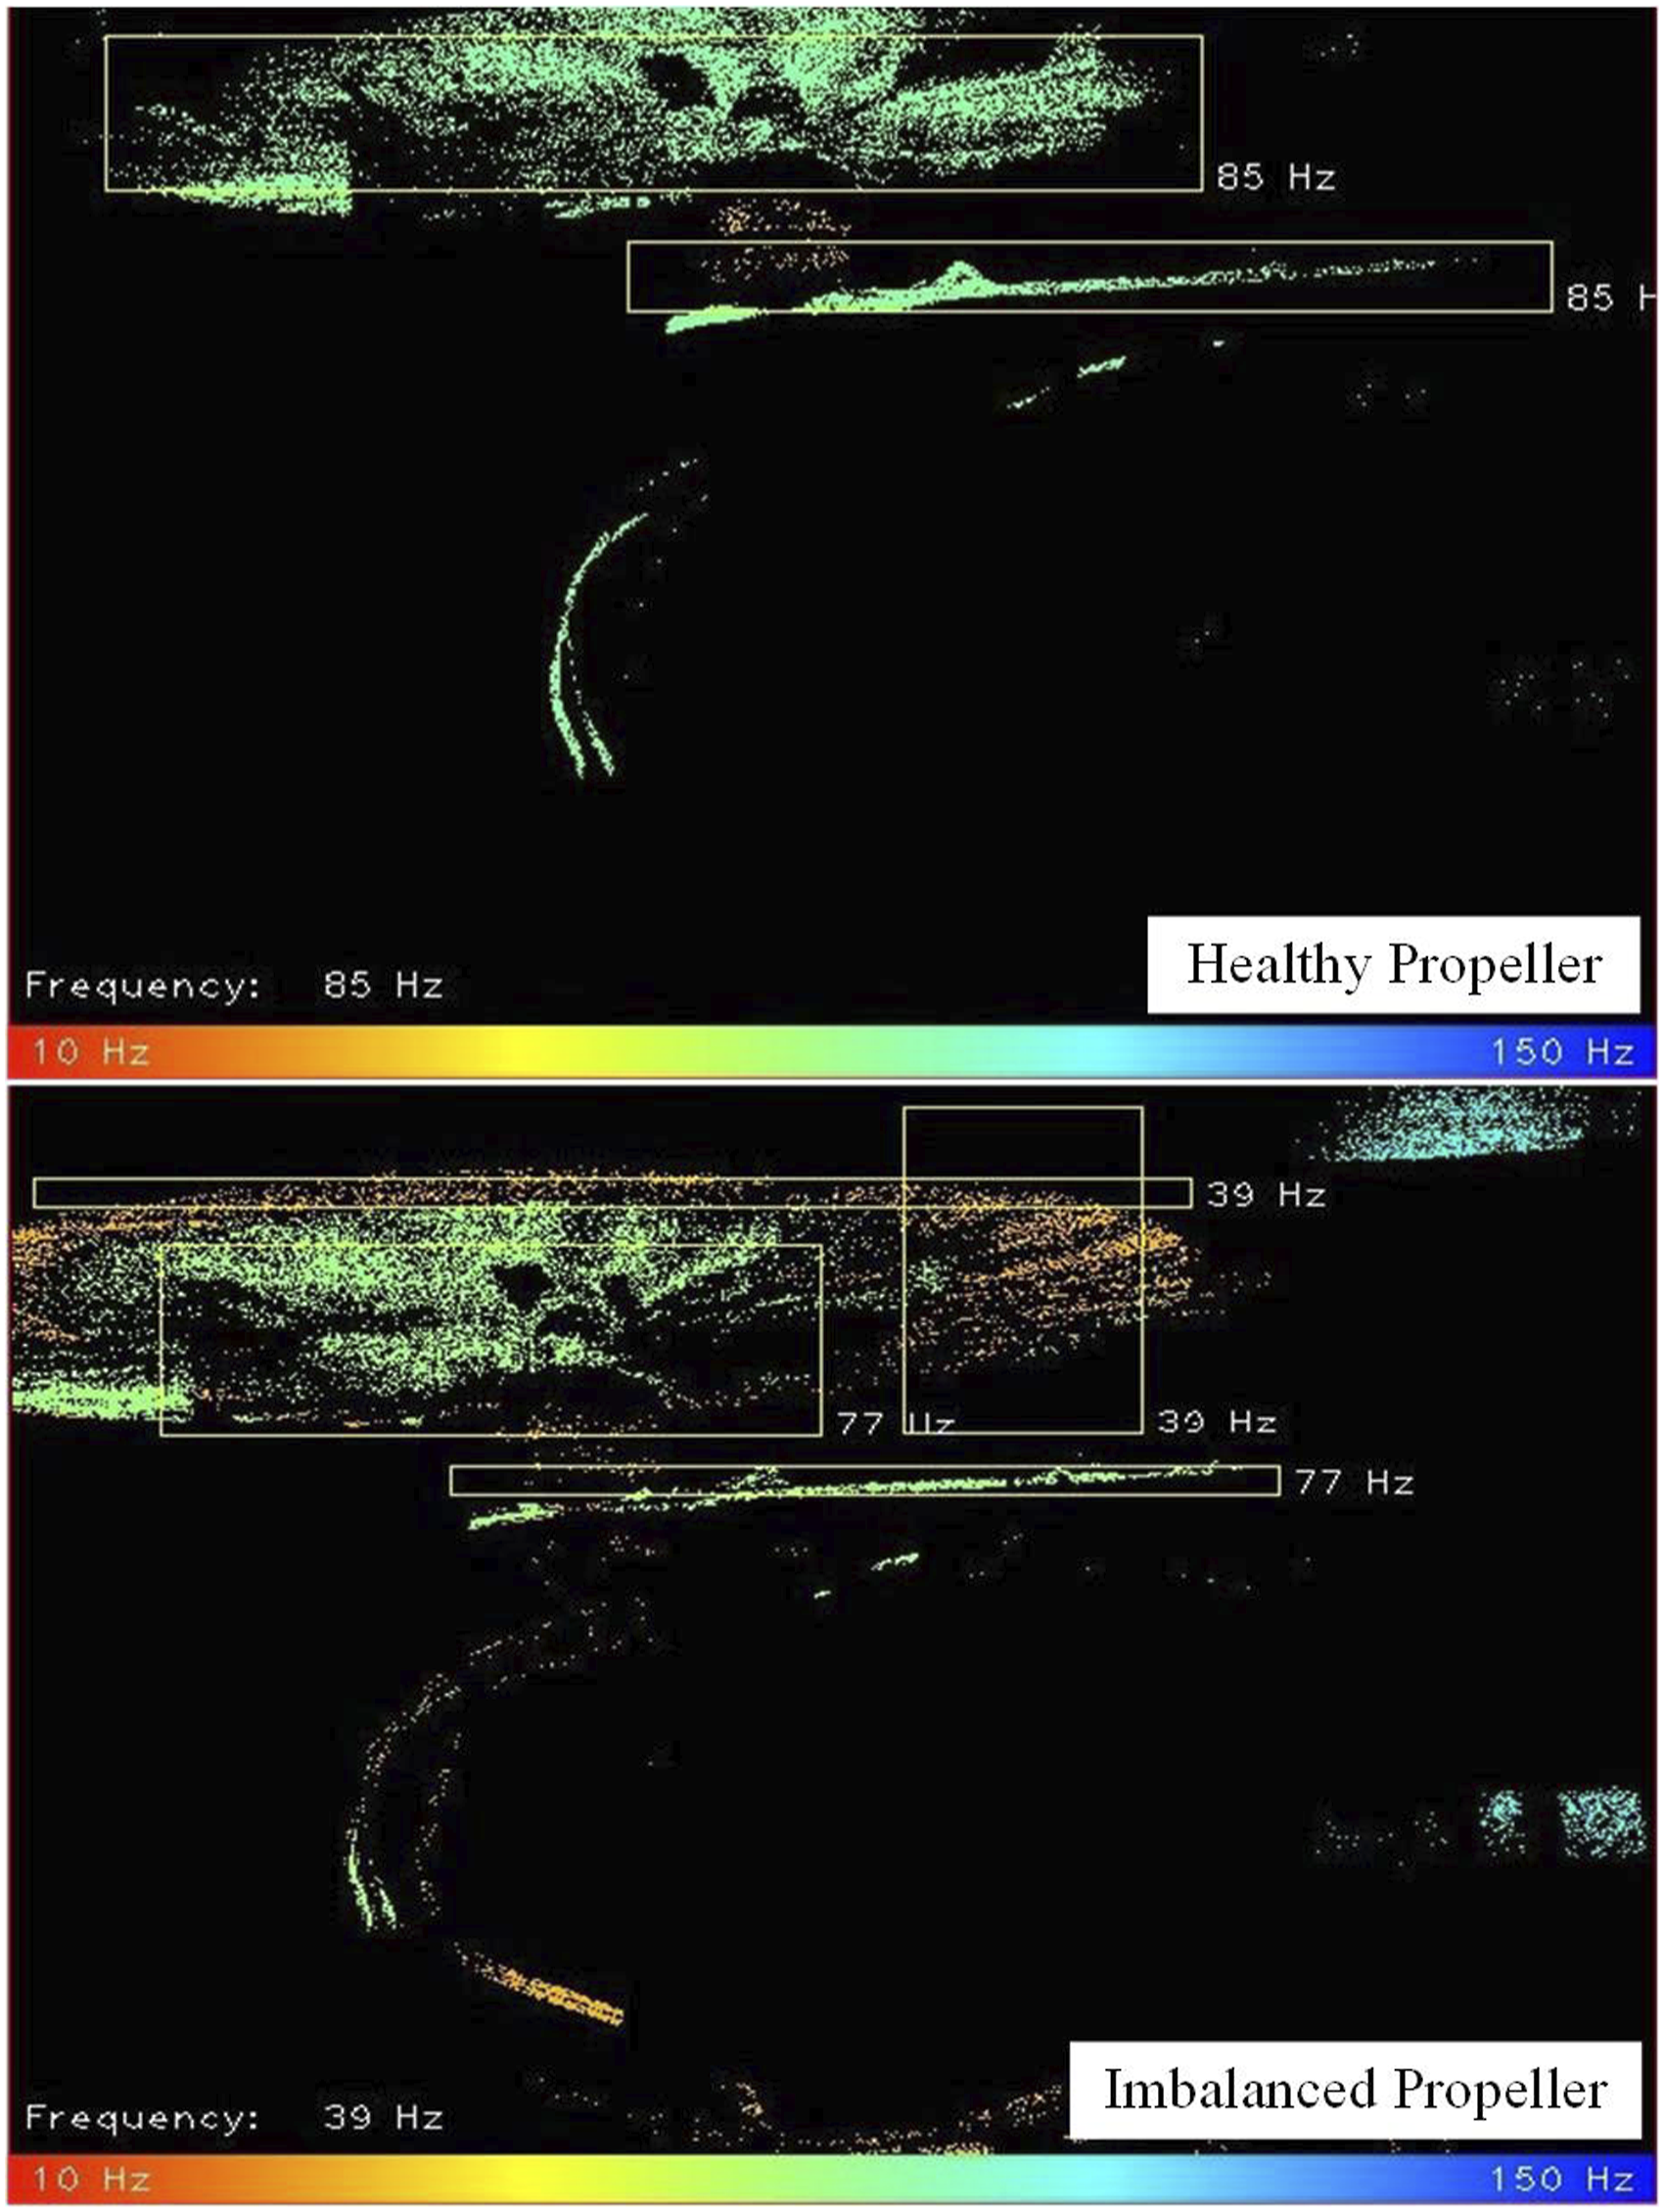
Additionally, the imbalanced propeller can also be detected by the proposed visual-based approach in windy and outdoor environments. In the windy environment (indoors), the healthy and imbalanced propeller frequencies are similar to those of Figure 14. However, the frequencies drop by 2 Hz when the detection process is conducted outdoors, as depicted in Figure 15. Frequency values obtained from vibration camera in outdoor environment (thrust mode).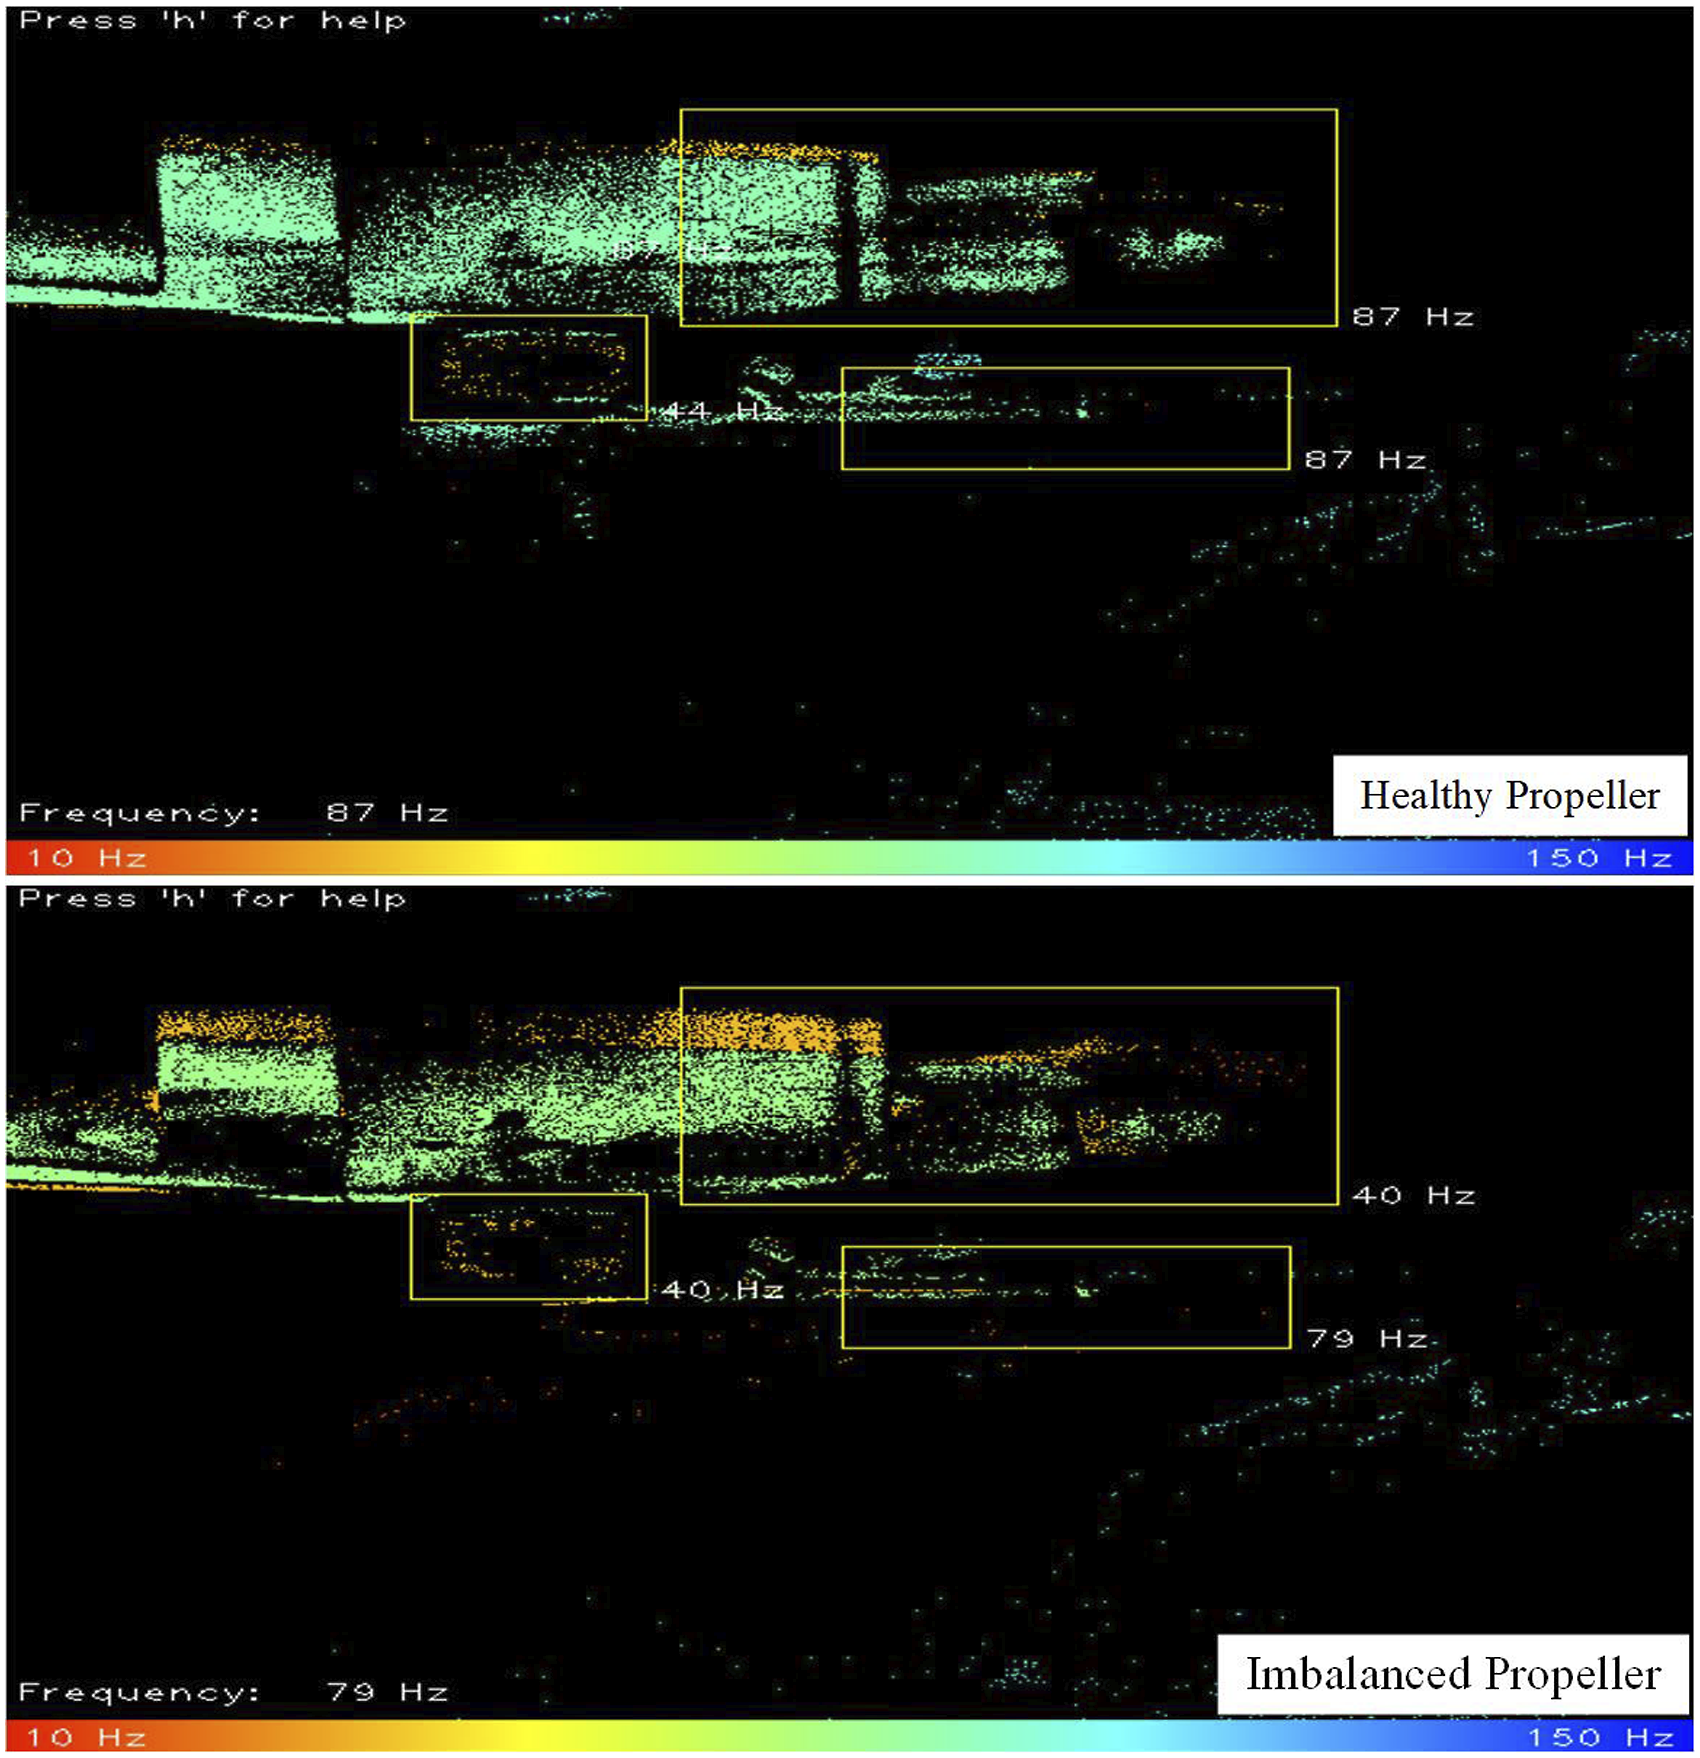
6. Discussion
Vibration and acoustic are some of the parameters that can be utilized to detect faults in a UAV. Based on the results presented in the previous sections, analyzing the vibration data measured from the ADXL335 accelerometer can detect an imbalance in the UAV propeller in different environments during the ground and thrust modes. The visual-based approach using the Silky EvCam camera can also detect an imbalanced propeller during both modes, as there is a shift of vibration frequency when imbalances are detected. The imbalance propeller can also be detected using the acoustic-based data-driven approach. However, based on Figure 10, the imbalanced propeller cannot be detected during the thrust mode because the maximum amplitudes between the healthy and imbalanced propellers are not reliable enough to distinguish between the two conditions. Nevertheless, the imbalanced propeller can still be identified during the thrust mode by utilizing average amplitude values instead of relying solely on maximum amplitudes.
Although the data-driven and visual-based approaches can be used to detect the imbalanced propeller, there are some advantages and limitations possessed by each technique. The detection process performed via the acoustic-based approach needs to be performed in environments with low noise. This is essential to prevent disruptions caused by the environment, as the noise can interfere with the accuracy of the results. Referring to Figures 9 and 11, additional disturbances in the form of noise produced by the wind will disrupt the acoustic data, whereas the vibration data are unaffected. Therefore, the maximum amplitude values cannot be utilized to detect the imbalanced propeller. Additionally, the proposed visual-based method is limited by the camera cable’s length, making it unsuitable to be implemented when the UAV is flying outdoors.
Based on 150 new samples of imbalanced propeller data (100 data per sample), the vibration-based method achieved 100% accuracy when the detection process was conducted in the ground modes without any disturbance. These accuracies are achieved by utilizing the RMS values of each sample. Similarly, the average amplitude values of 150 acoustic data samples are applied for the acoustic-based technique, and the accuracy acquired for the ground and thrust modes are 54% and 93%, respectively.
Regarding generalization capability, the proposed vibration-based data-driven and visual-based methods will not be affected by the wind conditions (up to 3.3 m/s wind speed). However, as mentioned before, a disturbance in the form of wind will reduce the performance of the acoustic-based technique, which can be seen in Figure 11. Furthermore, the proposed methods are only applicable to the current propeller dimension. Changing the propeller with propellers with different dimensions will affect the fault detection output.
7. Conclusion
The comparative analysis between data-driven and visual-based approaches in detecting the imbalanced UAV propeller has been presented in this study. Findings show that both approaches can detect the imbalanced UAV propeller in the ground and thrust modes. An imbalance in the UAV propeller will shift the vibration frequency to a lower value, as well as increase the maximum amplitude of the acoustic data. Nevertheless, in terms of accuracy, both the vibration-based and visual-based techniques outperform the acoustic-based approach. The latter exhibits an accuracy of only 54% in the ground mode and 93% in the thrust mode. In the future, the comparative analysis can be further implemented on other fault cases, such as motor failure, broken propeller, and cracks.
Footnotes
Declaration of conflicting interests
The author(s) declared no potential conflicts of interest with respect to the research, authorship, and/or publication of this article.
Funding
The author(s) disclosed receipt of the following financial support for the research, authorship, and/or publication of this article: This study is supported by CREST under Grant 304/PELECT/6050424/C121.