
Abstract
In railway turnouts, asymmetric switch rails with variable cross-sections are designed for wheel load transitions. However, the dynamic characteristics of these specially shaped switch rails are not yet fully understood. This paper investigates the vibration characteristics of switch rails through theoretical simulations, on-site admittance tests, and operational deflection shape (ODS) measurements. The study reveals that the modes of the switch rail involve multi-directional coupling vibrations, making the mode types indiscernible through direct observation. To address this, a modal separation method is proposed, based on the calculation of modal mass. The vertical vibration of the switch rail can be categorized into three types: torsional mode, vertical bending mode, and reverse torsion mode of the rail head and base above 600 Hz. As the position approaches the switch rail point, the degree of cross-sectional asymmetry increases, which consequently intensifies torsional vibration. Cross-sectional asymmetry is identified as the primary factor causing the coupling of bending-torsional vibrations, while variable cross-sections contribute to mode shape asymmetry and the gradual alteration of natural frequency along the rail.
1. Introduction
The turnout, a crucial railway infrastructure situated at the intersection of railway tracks, enables the directional control of trains onto the mainline or sidetrack by manipulating switch rails (Chen et al., 2021; Wang et al., 2024). The structure of the switch rail differs significantly from that of ordinary rails, featuring unique milling cross-sections (Gao et al., 2023) that result in gradual variations in rail profiles and asymmetric cross-sections. Due to inherent structural irregularities, the turnout area experiences heightened levels of wheel-rail excitations compared to plain track sections, leading to frequent engineering issues (Wang et al., 2020).
Railway engineering problems such as noise and corrugation are closely related to rail vibrations. For instance, rolling noise radiation is primarily influenced by vertical and lateral rail modes within the frequency range of 500 Hz to 1600 Hz (Thompson, 2013). Short-pitch corrugation has been linked to the “pinned–pinned” resonance at approximately 1 kHz, which corresponds to a rail vertical bending mode with a wavelength equal to two sleeper spacings (Ilias, 1999; Liu et al., 2015). Additionally, studies have focused on the degradation of rail pads, also based on rail vibration characteristics (Oregui et al., 2015; Shen et al., 2021).
A thorough understanding of railway track vibration characteristics is essential for accurately simulating vehicle-track coupling dynamics, vibration control (Liang et al., 2023), and monitoring rail pad degradation (Shen et al., 2023), among other issues. Chen et al. (2023) investigated the vibration modes of turnout rails and found a correlation between vehicle-turnout coupling dynamics calculations and turnout resonance modes. Sun et al. (2014) analyzed the impact of track flexibility on vehicle-track coupled dynamic responses and observed that neglecting track flexibility could overestimate wheel-rail contact forces and vehicle vibration responses. The pinned-pinned resonance of rails can induce rail corrugation (Grassie, 2009), primarily due to the discrete support of the rail. Rail pads are critical components in railway tracks, effectively attenuating track component vibrations to slow down track deterioration. Information about track vibrations can aid in inspecting worn rail pads or loose clamps (Oregui et al., 2015).
Research on the vibration characteristics of structures with variable cross-sections has traditionally focused on theoretical studies (Atmane et al., 2011; Cuma and Calim, 2021; Du et al., 2022; Wang et al., 2023). These studies typically involve establishing vibration equations for Euler–Bernoulli or Timoshenko beams and simplifying variable cross-section beams into multiple segments with uniform cross-sections for analysis. The accuracy of the results is then evaluated by comparing them with finite element (FE) analysis results (Cui et al., 2012). Due to changes in cross-sections, the natural frequency and vibration mode of the structure will vary (Ece et al., 2007). Li et al. (2021) attributed differences in vibration amplitudes at different points of variable cross-section structures to changes in the cross-sectional stiffness of the beam. Wang et al. (2021) found that when the centroid and center of the cross-section are separated, the structure undergoes coupled bending and torsional vibrations. Currently, there is a lack of research on structural vibration characteristics under variable cross-sections and asymmetric coupling factors.
The main types of experimental research on track modal characteristics include experimental modal analysis (EMA) (Montalban Domingo et al., 2014), operational modal analysis (OMA) (Hanson et al., 2007), and ODS (Richardson, 1997). While modal analysis typically applies to linear structures, ODS is also suitable for studying the actual operational deformations of nonlinear structures (Hanson et al., 2007). In cases where switch rails are directly placed on the slide plates, constituting a form of nonlinear constraint, ODS methods are more applicable. ODS has been applied to simple beam-plate structures within 1600 Hz (Khoo et al., 2014; Sampaio et al., 2016) and for identifying rail coupling mode waves within 5 kHz. Zhang et al. (2021a, 2021b) distinguished different wave modes and measured wave dispersion characteristics for UIC 54E1 rails using ODS measurement. This paper aims to utilize the ODS method to identify various vibration modes in switch rails.
Previous studies on the vibration characteristics of rails have primarily focused on ordinary symmetrical rails with uniform cross-sections. There are limited studies on the vibration characteristics of asymmetrical switch rails with variable cross-sections, leaving our understanding of their vibration characteristics unclear. This paper combines experiments and simulations to study the coupling vibration characteristics of switch rails. The main contents are as follows: Section 2 introduces the structural characteristics of switch rails and presents an evaluation index for asymmetric cross-sections. Section 3 describes the FE model. Section 4 proposes a modal separation method for complex structures. Section 5 calculates the admittance and modal characteristics of the switch rail using numerical simulations and compares them with ordinary CN60 rail. Section 6 verifies the results of the numerical simulations through field experiments. The main conclusions are outlined in Section 7.
2. Asymmetric rail with variable cross-sections
This section introduces the structural characteristics of the switch rails. Figure 1 provides a schematic diagram of the switch panel, highlighting the crucial role of the switch rails in enabling train switching and cross-line operations. From the switch rail point onward, the cross-sections of the switch rail gradually change. The coordinate system direction is defined in the figure. Due to the milling of its railhead and rail base, the cross-sections of the switch rail, as shown in Figure 1, gradually change and become asymmetric. Rails in the switch panel.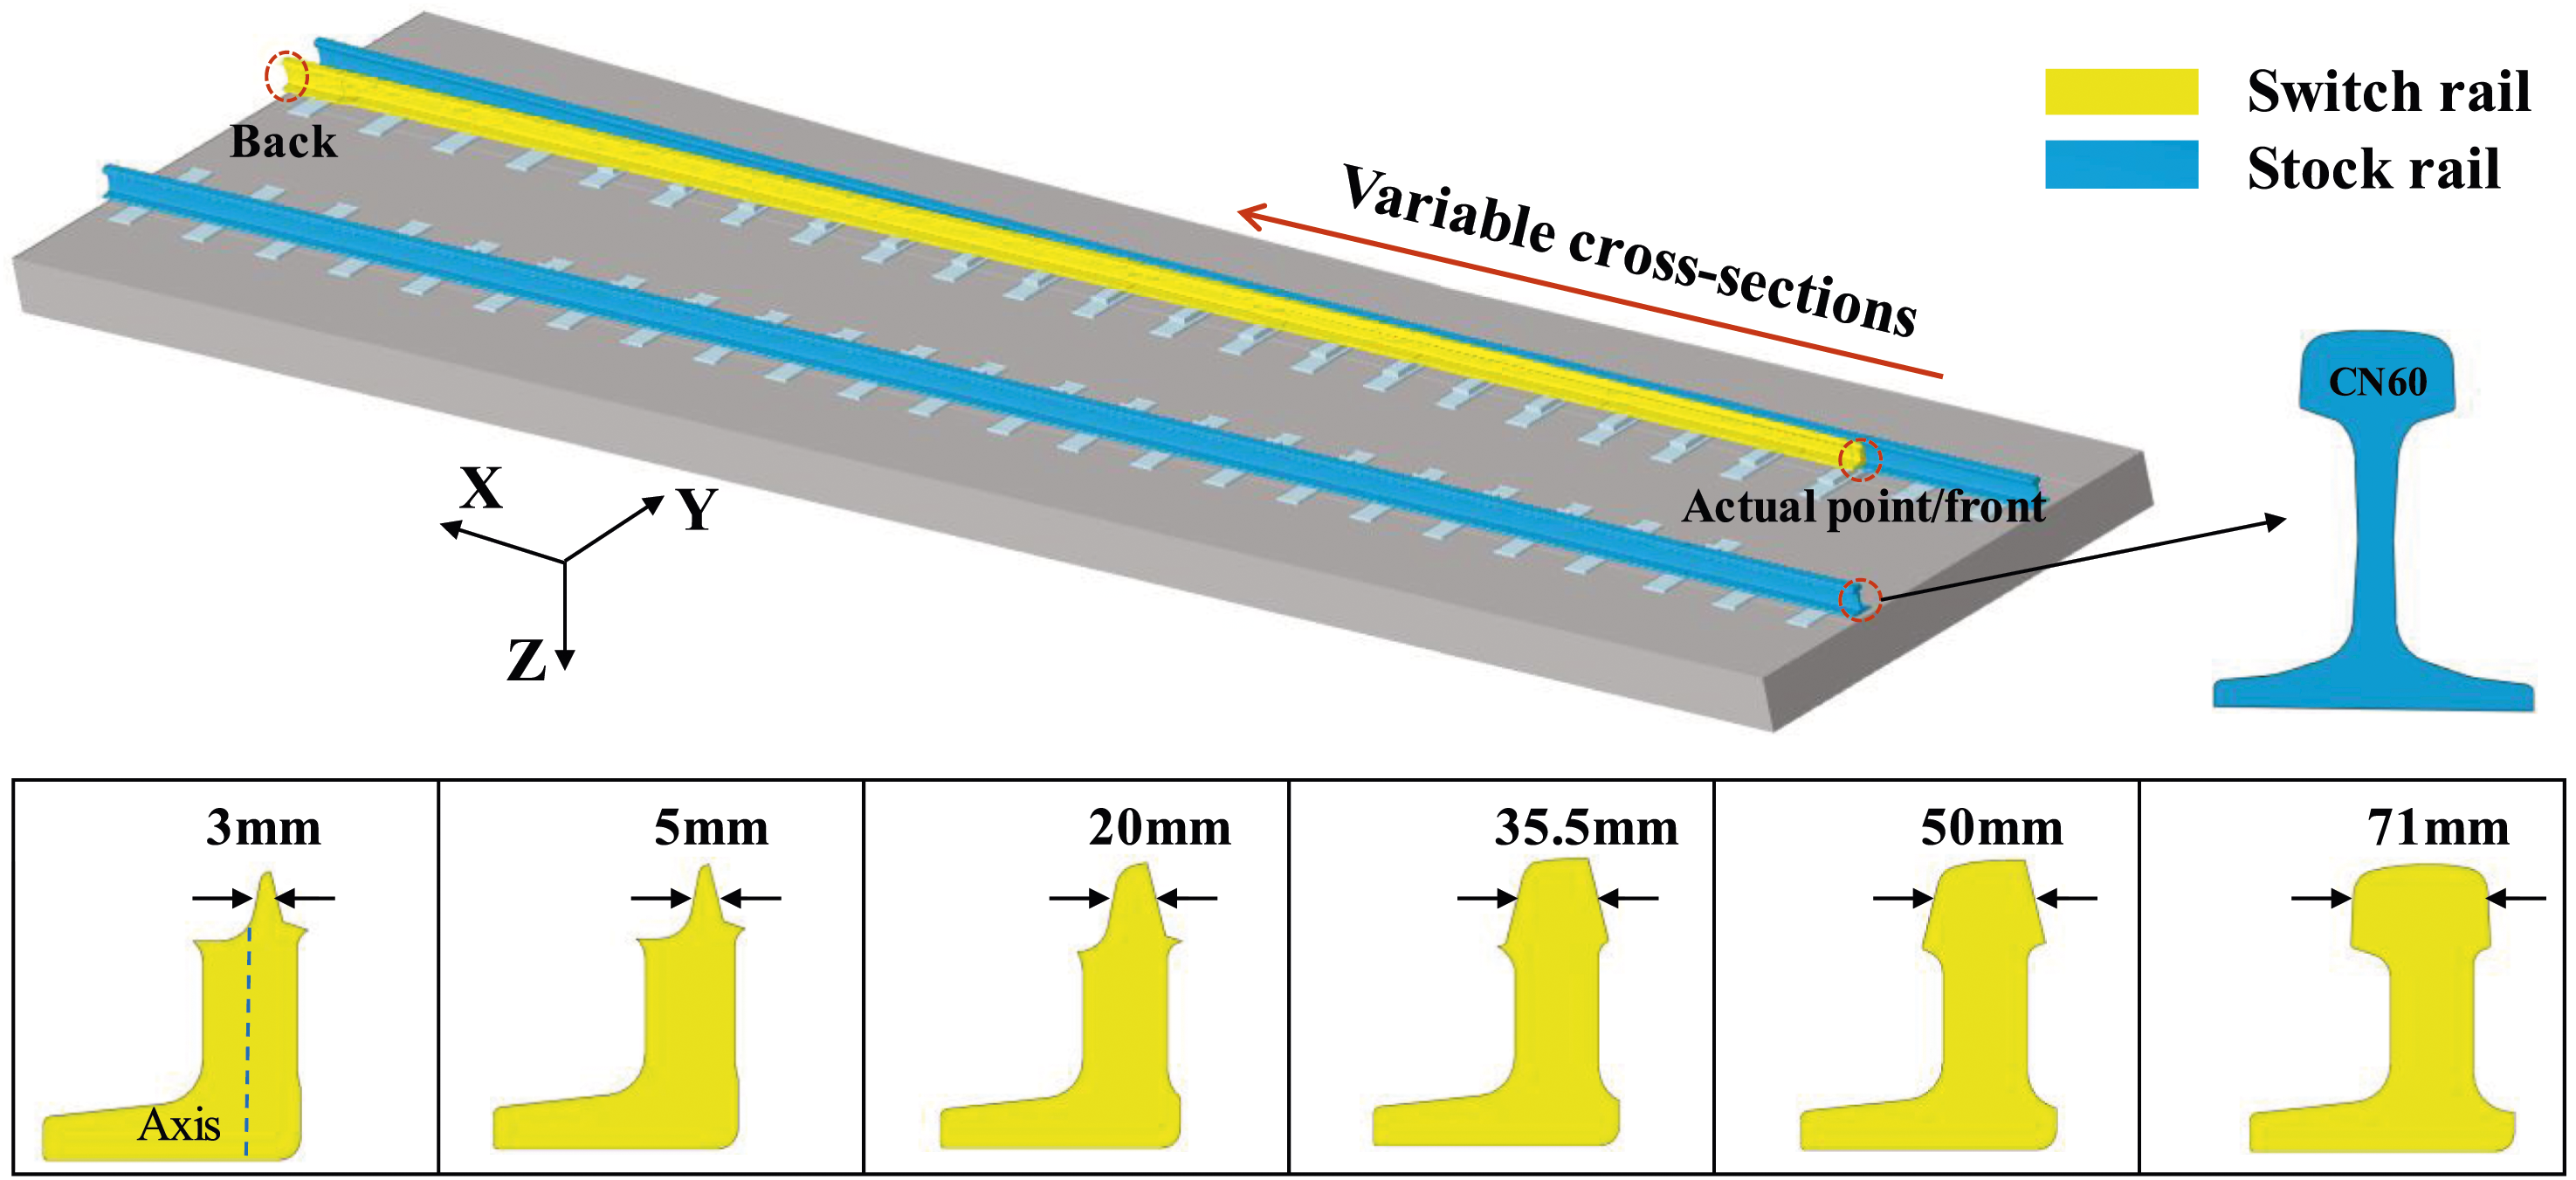
Using the switch rail point as the coordinate origin, the variation of the cross-sectional area of the switch rail along the X direction is plotted in Figure 2(a). From the figure, it is evident that the cross-sectional area of the switch rail gradually increases, reaching its maximum value of 102.15 cm2 at 4.531 m. As the cross-sections of the switch rail transition from AT rail to CN60 rail at 10.6 m, the area is reduced to 77.71 cm2. Cross-sections information of the switch rail.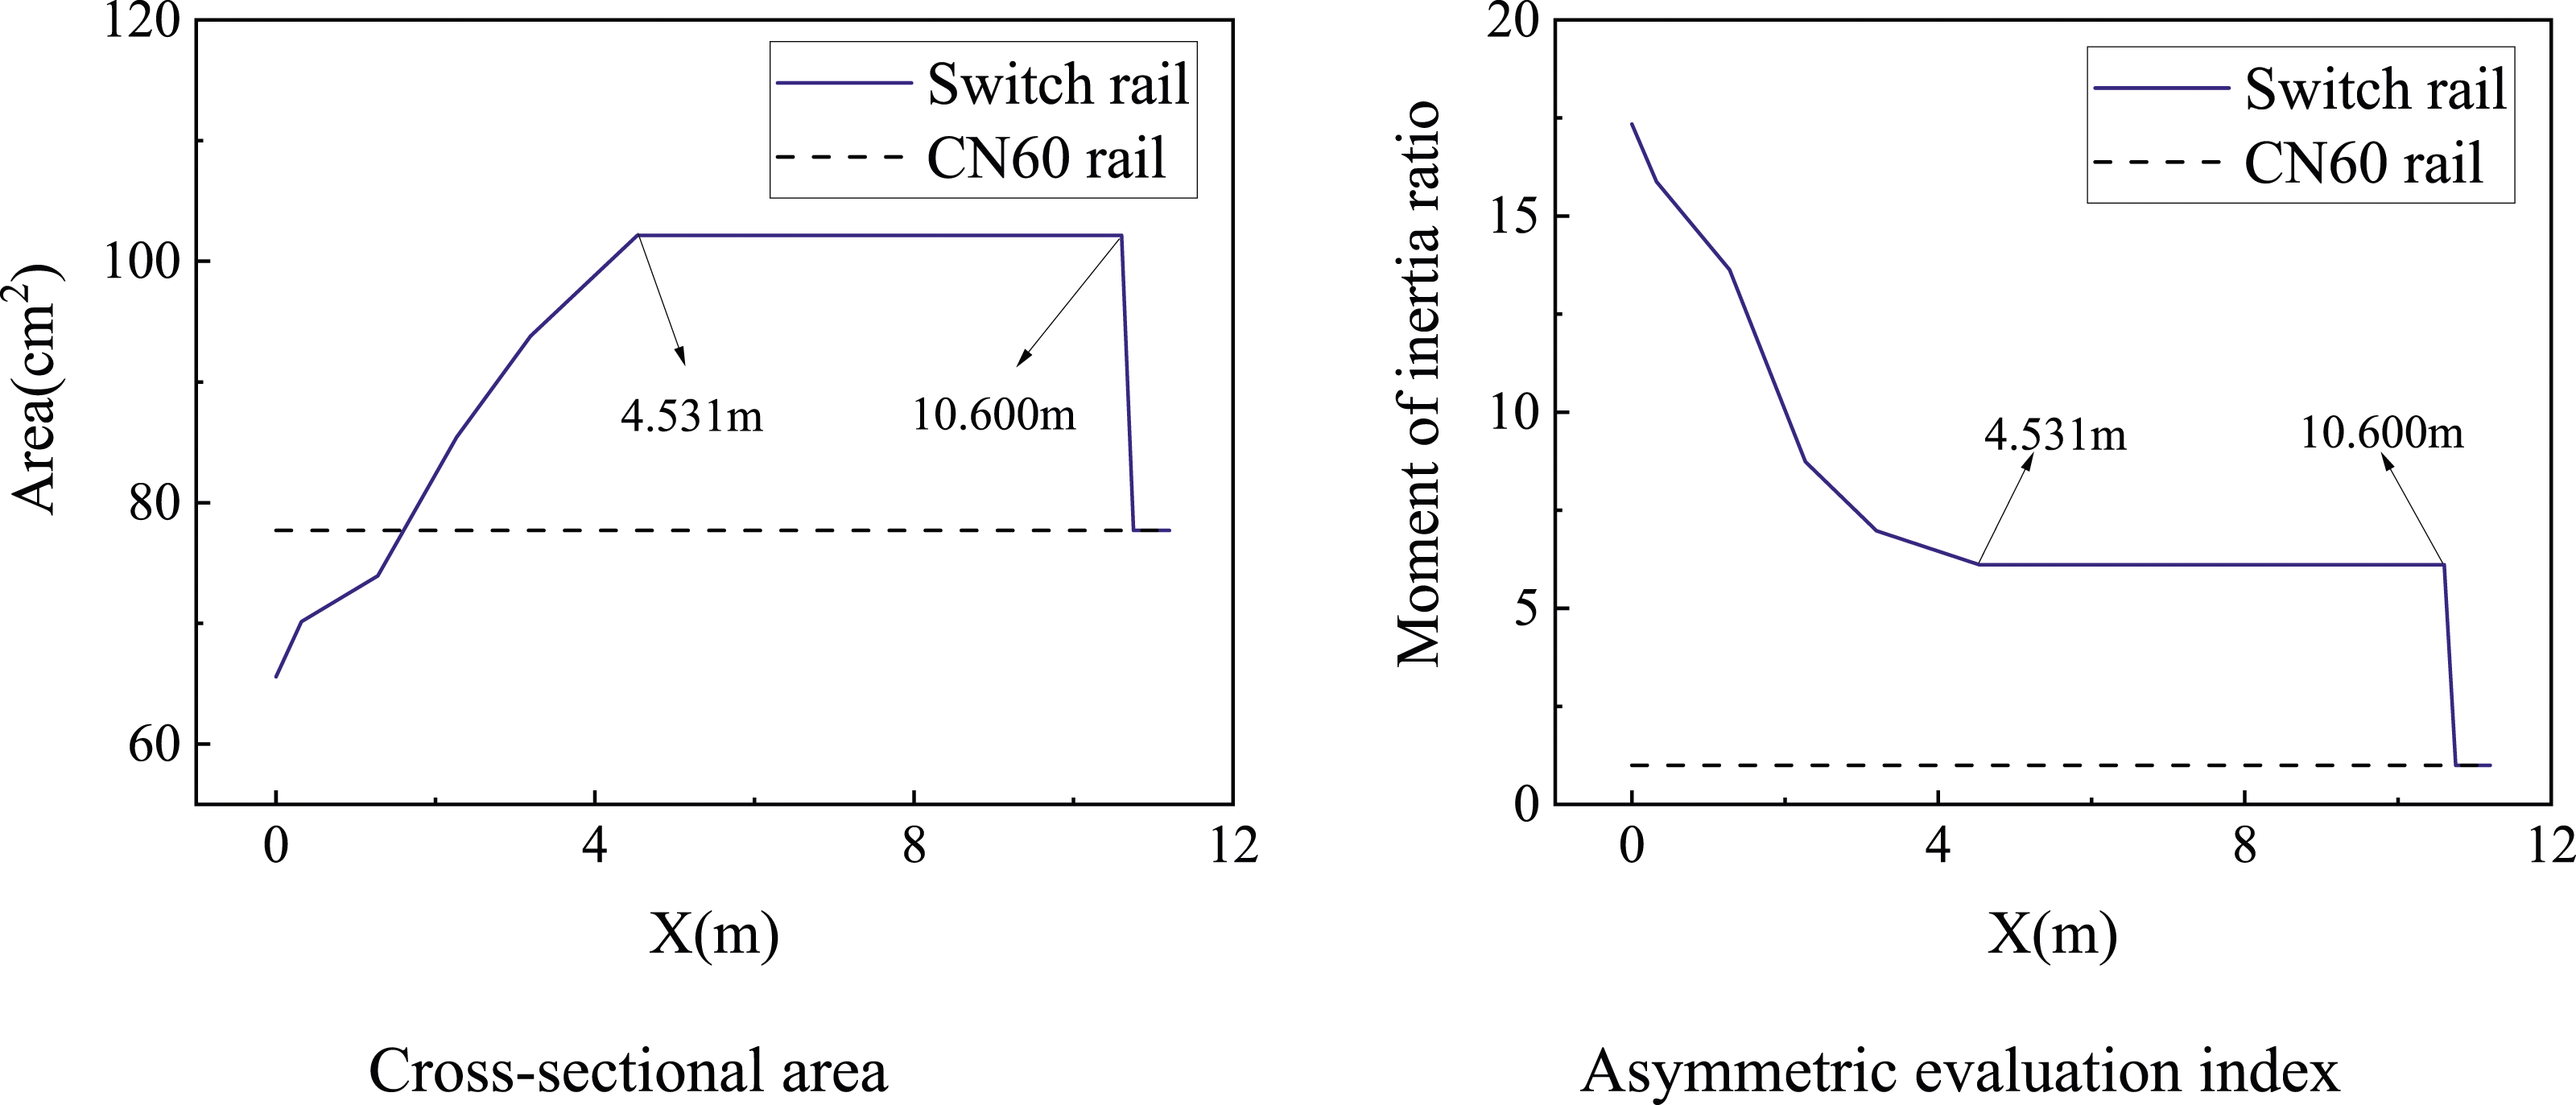
This paper uses the asymmetric index to estimate the degree of asymmetric of the cross-sections. As shown in Figure 1, using the centerline of the switch rail web as the axis, asymmetric evaluation index is defined as:

The variation in asymmetry of the switch rail cross-sections is depicted in Figure 2(b). It is evident that proximity to the switch rail point correlates with higher asymmetry evaluation index, indicating increased asymmetry. For instance, in the cross-section of the 60AT rail with a full top width, the asymmetric index reaches 6.1, highlighting significant asymmetry. Beyond a distance of 10.6 m, the cross-sections transition to CN60 rail, where the asymmetric index drops to 1, indicating complete symmetry in the CN60 rail cross-section.
3. Model description
The FE model of the switch rail is shown in Figure 3. The continuous variable cross-section switch rail is generated using scanning mixing method of Creo. The switch rail is subsequently meshed in Hypermesh and simulated with solid element. A gradient mesh is applied from the switch rail point to the end. The mesh features a minimum element size of 3 mm and a maximum element size of up to 30 mm on the cross-section. The element size along the X-direction is 30 mm. The chosen element size is suitable for calculations within the relatively low-frequency range of 0–2000 Hz (Chen et al., 2021). The final simulations are carried out using the commercial software Ansys. Schematic diagram of the switch rail model.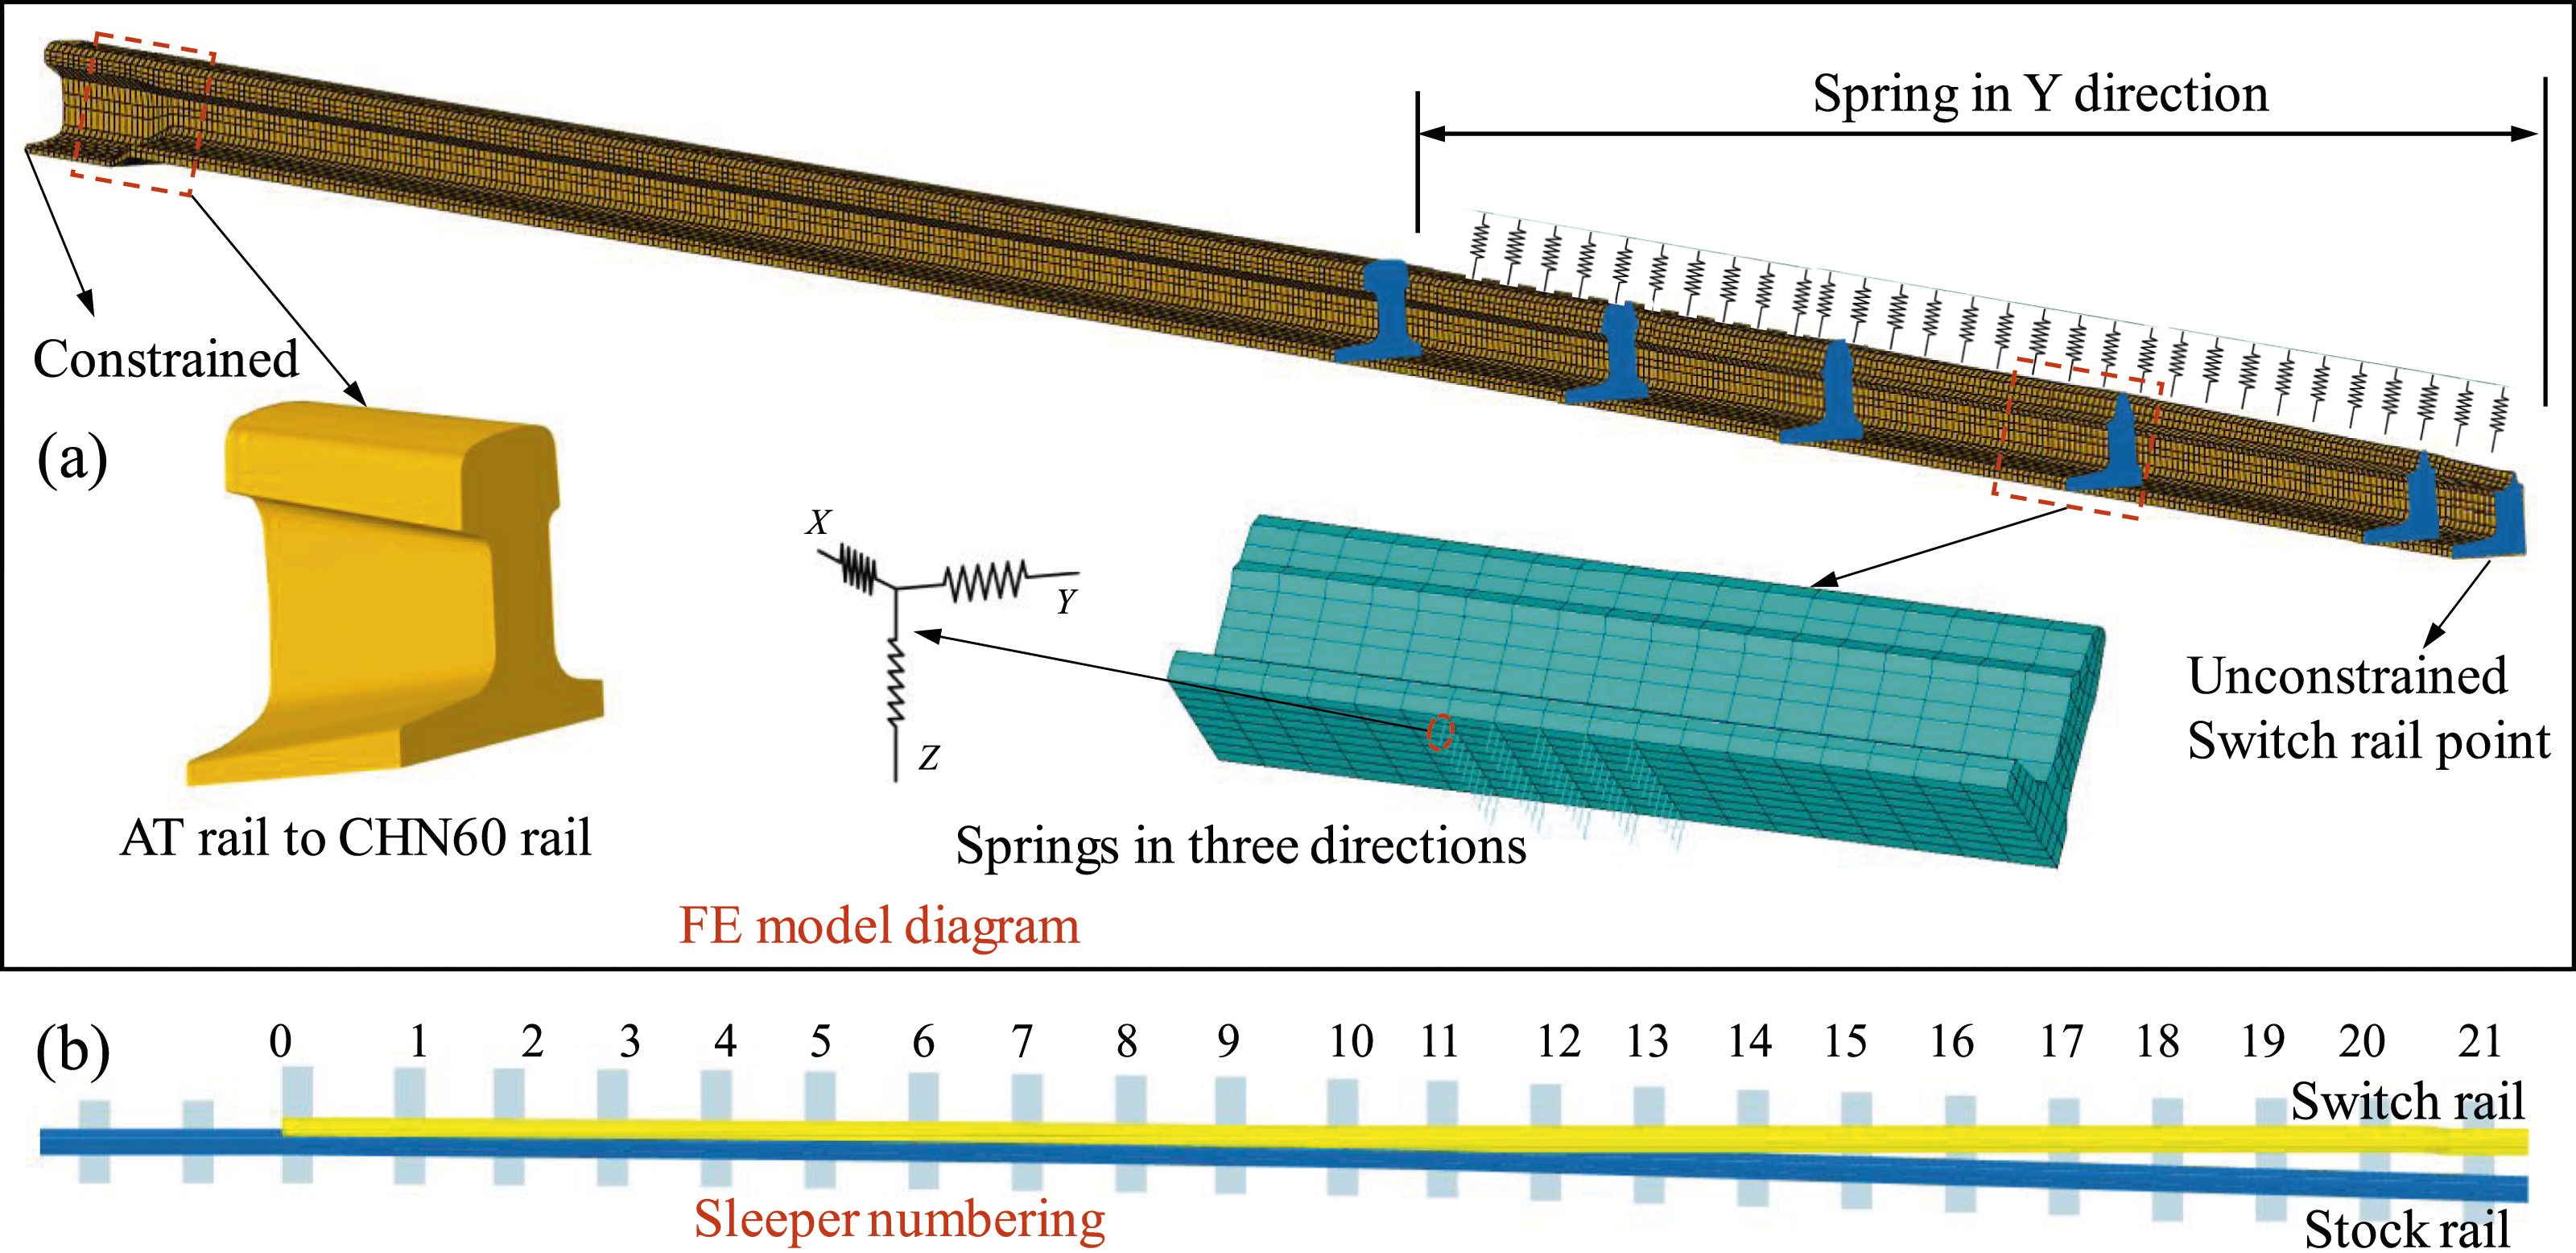
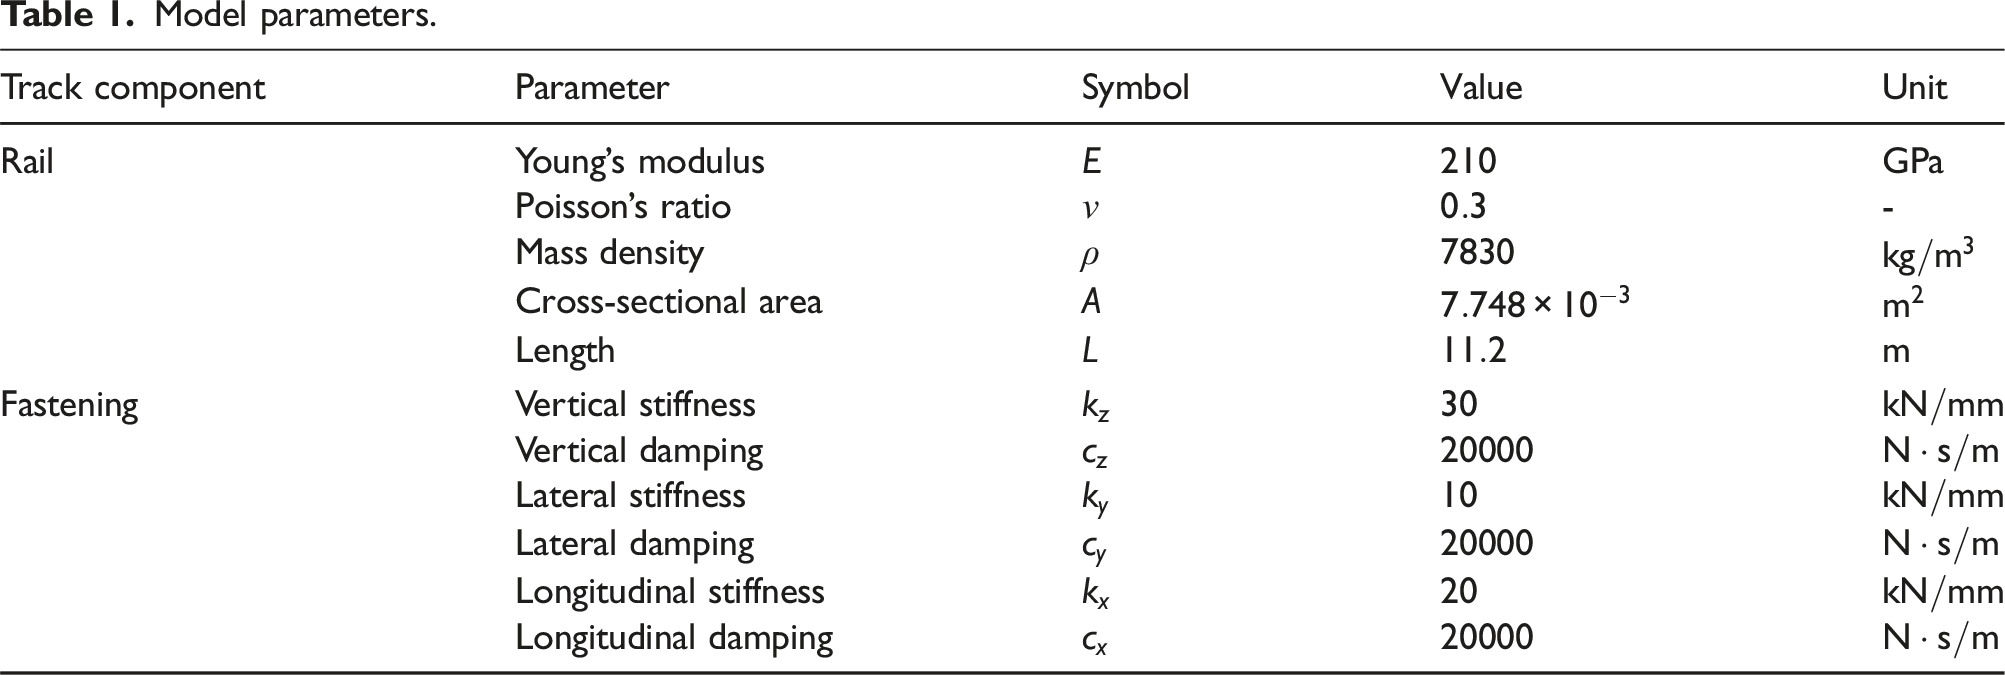
Model parameters.
Harmonic load sweep frequency analysis represents a classical frequency-domain technique utilized to determine the steady-state response of linear structures subjected to harmonic loads (Teng and Chang, 2007). This method computes the structure response at specific frequencies, generates the frequency response function (FRF) curve, identifies characteristic frequencies, and extracts the corresponding mode shapes. It specifically focuses on calculating the steady-state forced vibration of the structure, omitting consideration of non-steady-state vibrations occurring at the onset of excitation. Mode extraction employs the Block Lanczos method.
4. Modal separation method
The vibration modes of the switch rail have been computed, and the findings are presented in Figure 4. These modes exhibit complexity, with each mode representing a coupling of vibrations in multiple directions. As a result, determining the primary vibration direction of each mode through direct observation is challenging. Consequently, separating the modes of the switch rail poses a difficult problem for analysis and interpretation. Partial switch rail modes.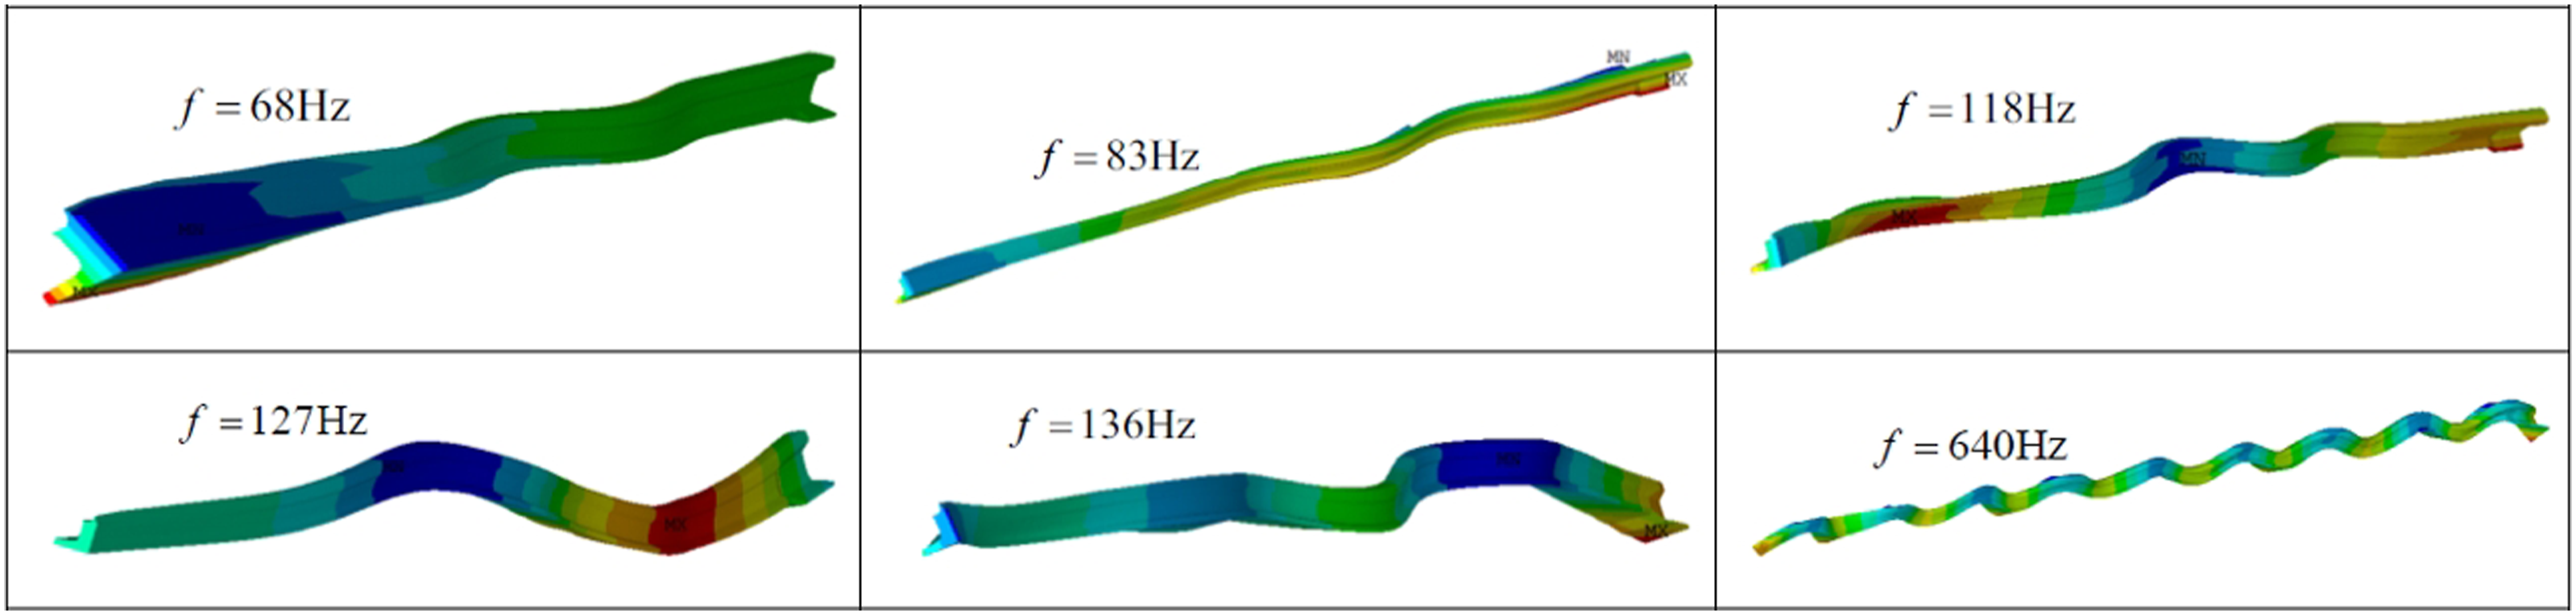
This paper utilizes the ratio of effective mode mass to total mass to evaluate the contribution of each modal order to vibrations in a specific direction.
Modal mass serves as a metric of mode importance, where larger values indicate higher susceptibility to external excitation, while smaller values denote lower susceptibility. The participation factors for the specified direction are defined as:
The effective mass for the p-th mode is: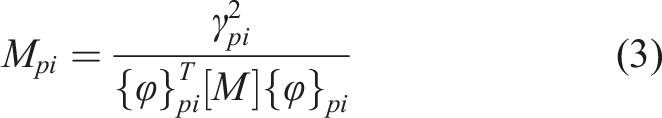

This paper assesses the contribution of a specific mode of the switch rail to vibrations in different directions using a parameter, defined as: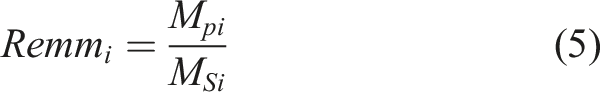

The direction of the maximum value is defined as the main vibration direction of the mode.
In this paper, the modal masses of the six directions of the switch rail are calculated. However, only three are dominant and independent: Y, Z, and Rx. The bending rotations Ry and Rz are not independent and depend on the bending modes in the Z and Y directions. Vibration in the X direction is not considered in this study.
Through the aforementioned process, the modes of complex structures are segregated into three directions. By identifying the primary vibration direction of each mode, targeted control of different frequencies can be achieved, facilitating frequency-domain vibration control of complex structures. Understanding the modal characteristics of the switch rail also aids in studying the deterioration of the turnout rubber pad.
5. Numerical simulation investigation
5.1. Vertical admittance
Rail admittance has a great influence on the dynamic results of the wheel-rail system. Literature [15] conducted an in-depth study on the admittance of the track system and found that wheel–rail dynamic interaction mainly depends on the admittance of the track from 70 Hz to 1000 Hz.
Figure 5 illustrates the vertical admittance of the switch rail at various positions. In Figure 5(a), the natural frequency of the switch rail is depicted within the 500 Hz range. It is evident that within the variable cross-section segment of the switch rail, there are two distinct peaks identified as M1 and M2 natural frequencies. As depicted in Figure 6(a), the influence of the M1 natural frequency becomes more pronounced closer to the switch rail point. Moreover, an increasing asymmetric index of the cross-sections intensifies the impact of M1 on vertical vibration. Meanwhile, when the cross-sectional area of the switch rail increases, the frequency of M2 decreases. This decrease is attributed to the heightened stiffness and mass of the cross-sections over a longitudinal unit length, underscoring the dominant role of cross-sectional mass at lower frequencies. Furthermore, Figure 6(b) shows that the admittance results of the switch rail exhibit a triangular distribution across spans 0–8, consistent with findings reported in the literature (Gao et al., 2023). Switch rail vertical admittance (a) 0–500 Hz and (b) 200Hz–2000 Hz. Displacement admittance of switch rail and CN60 rail.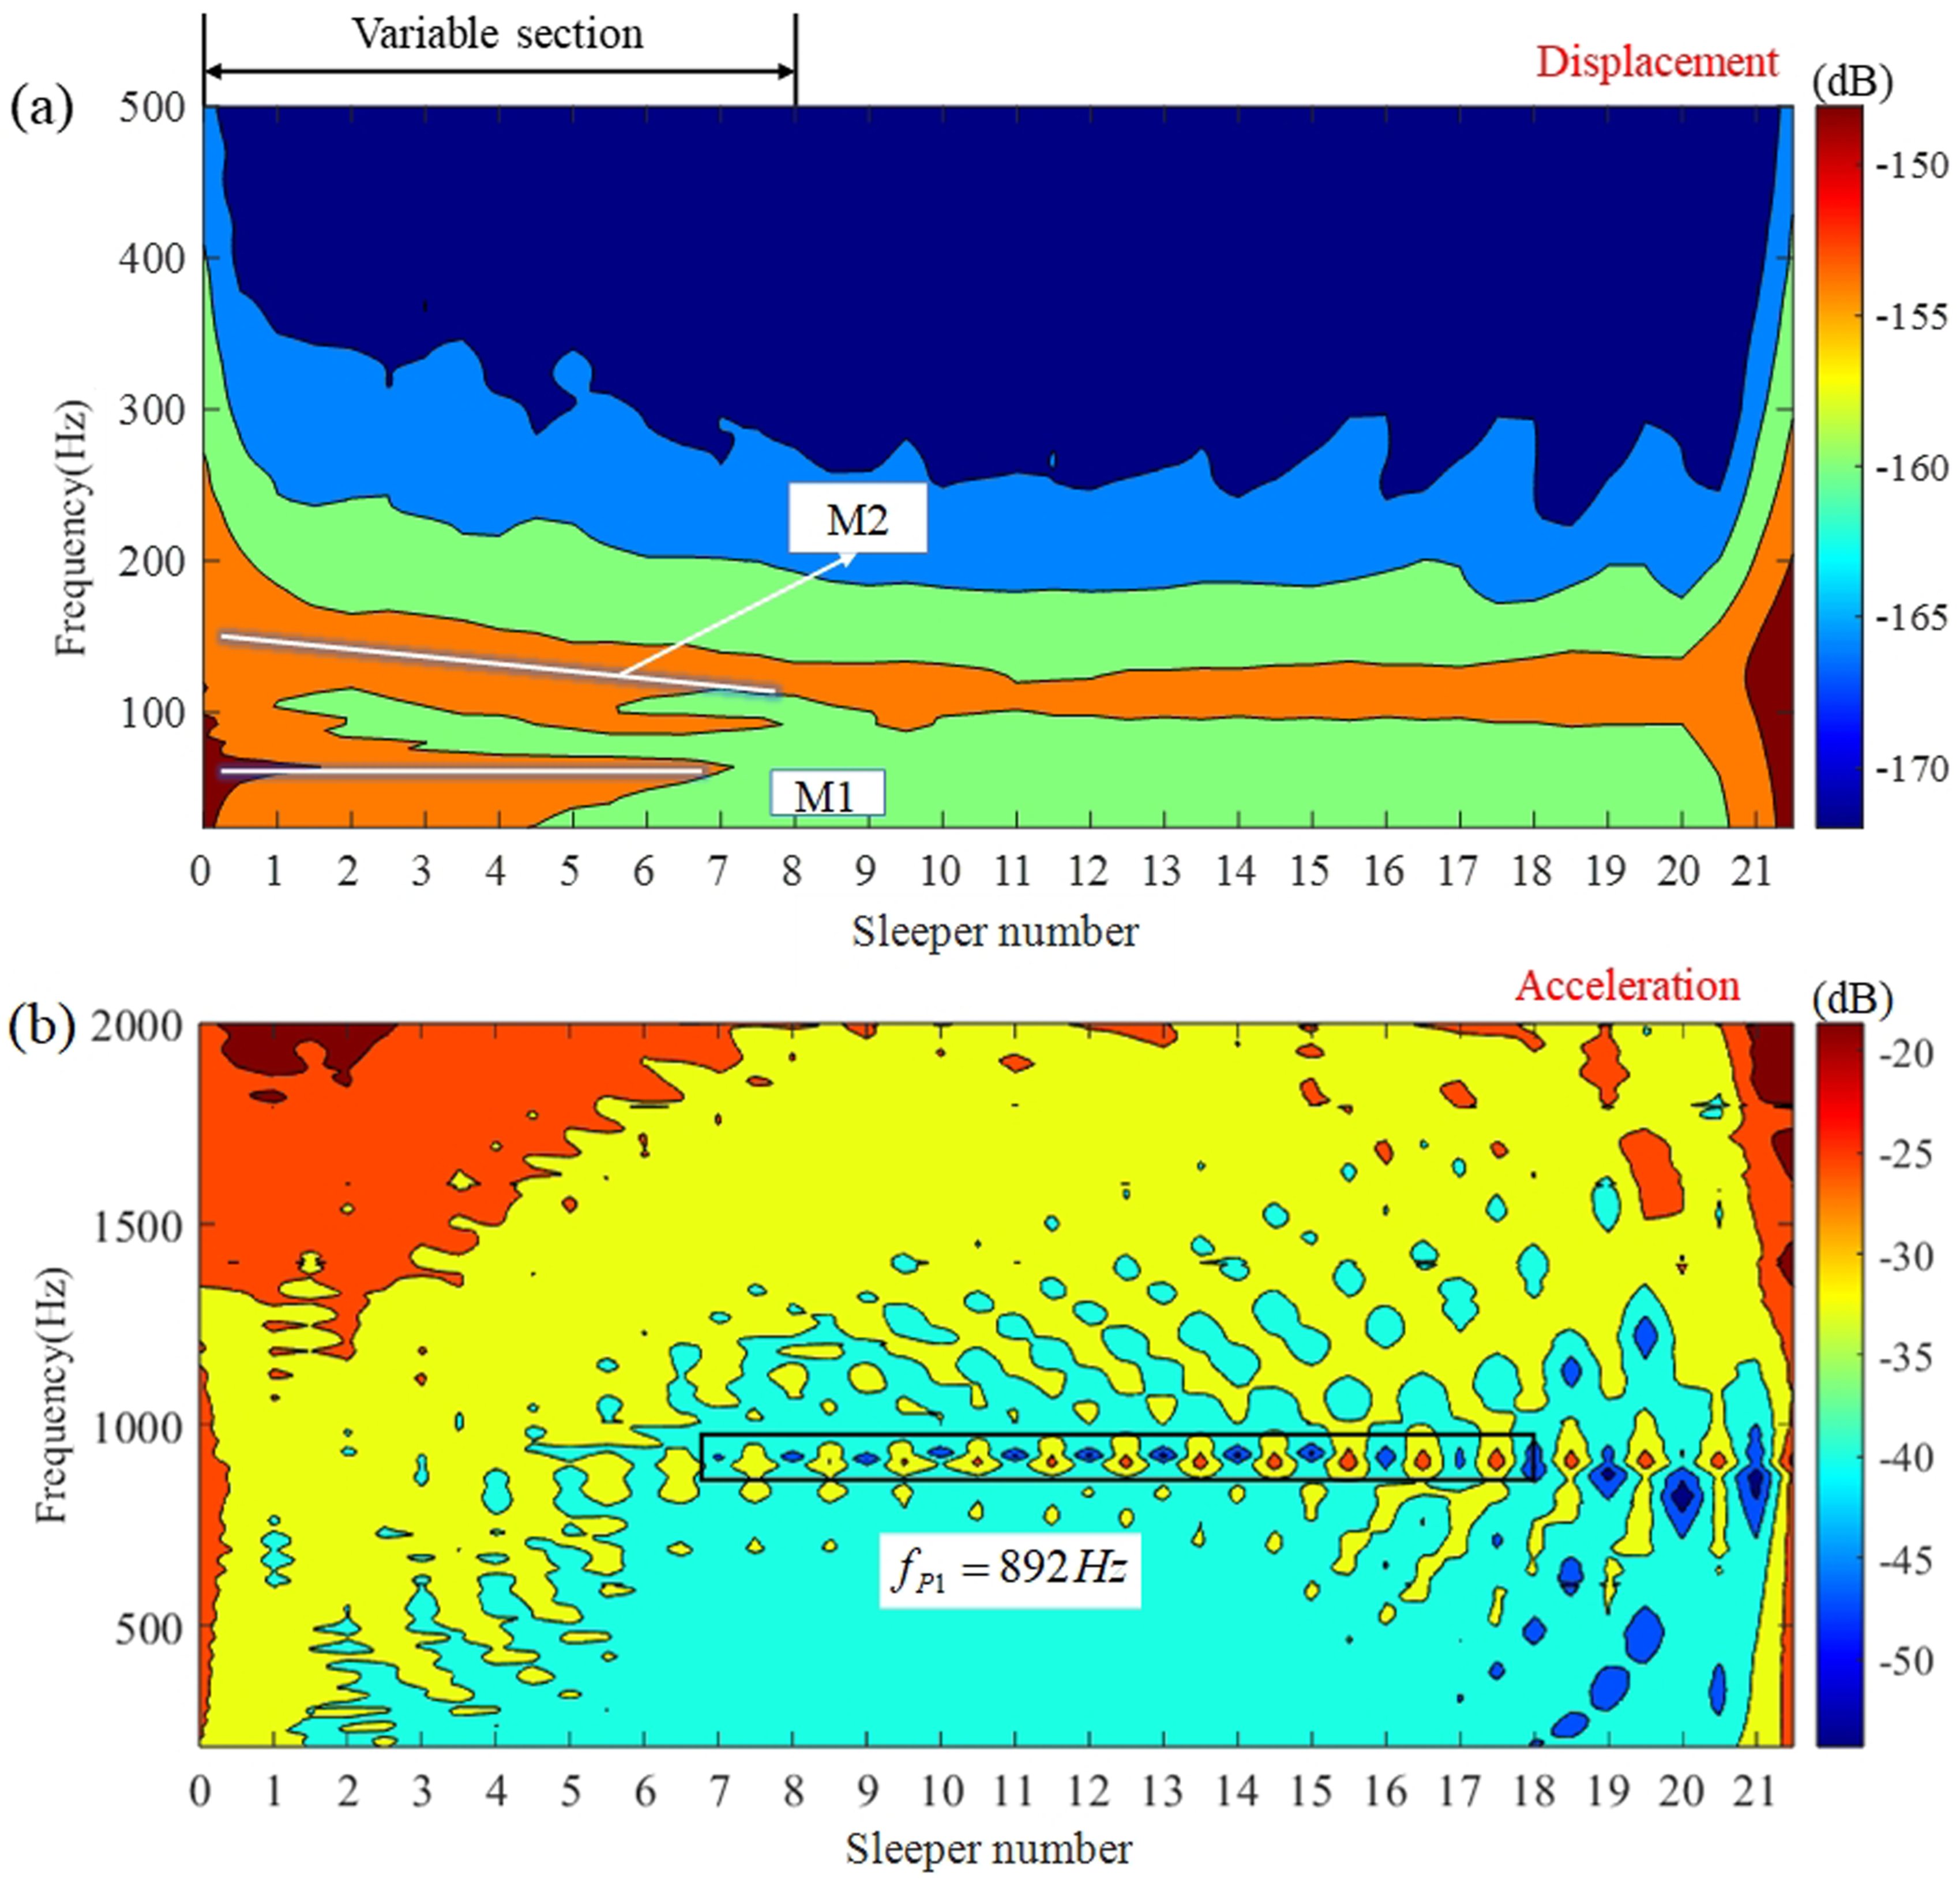
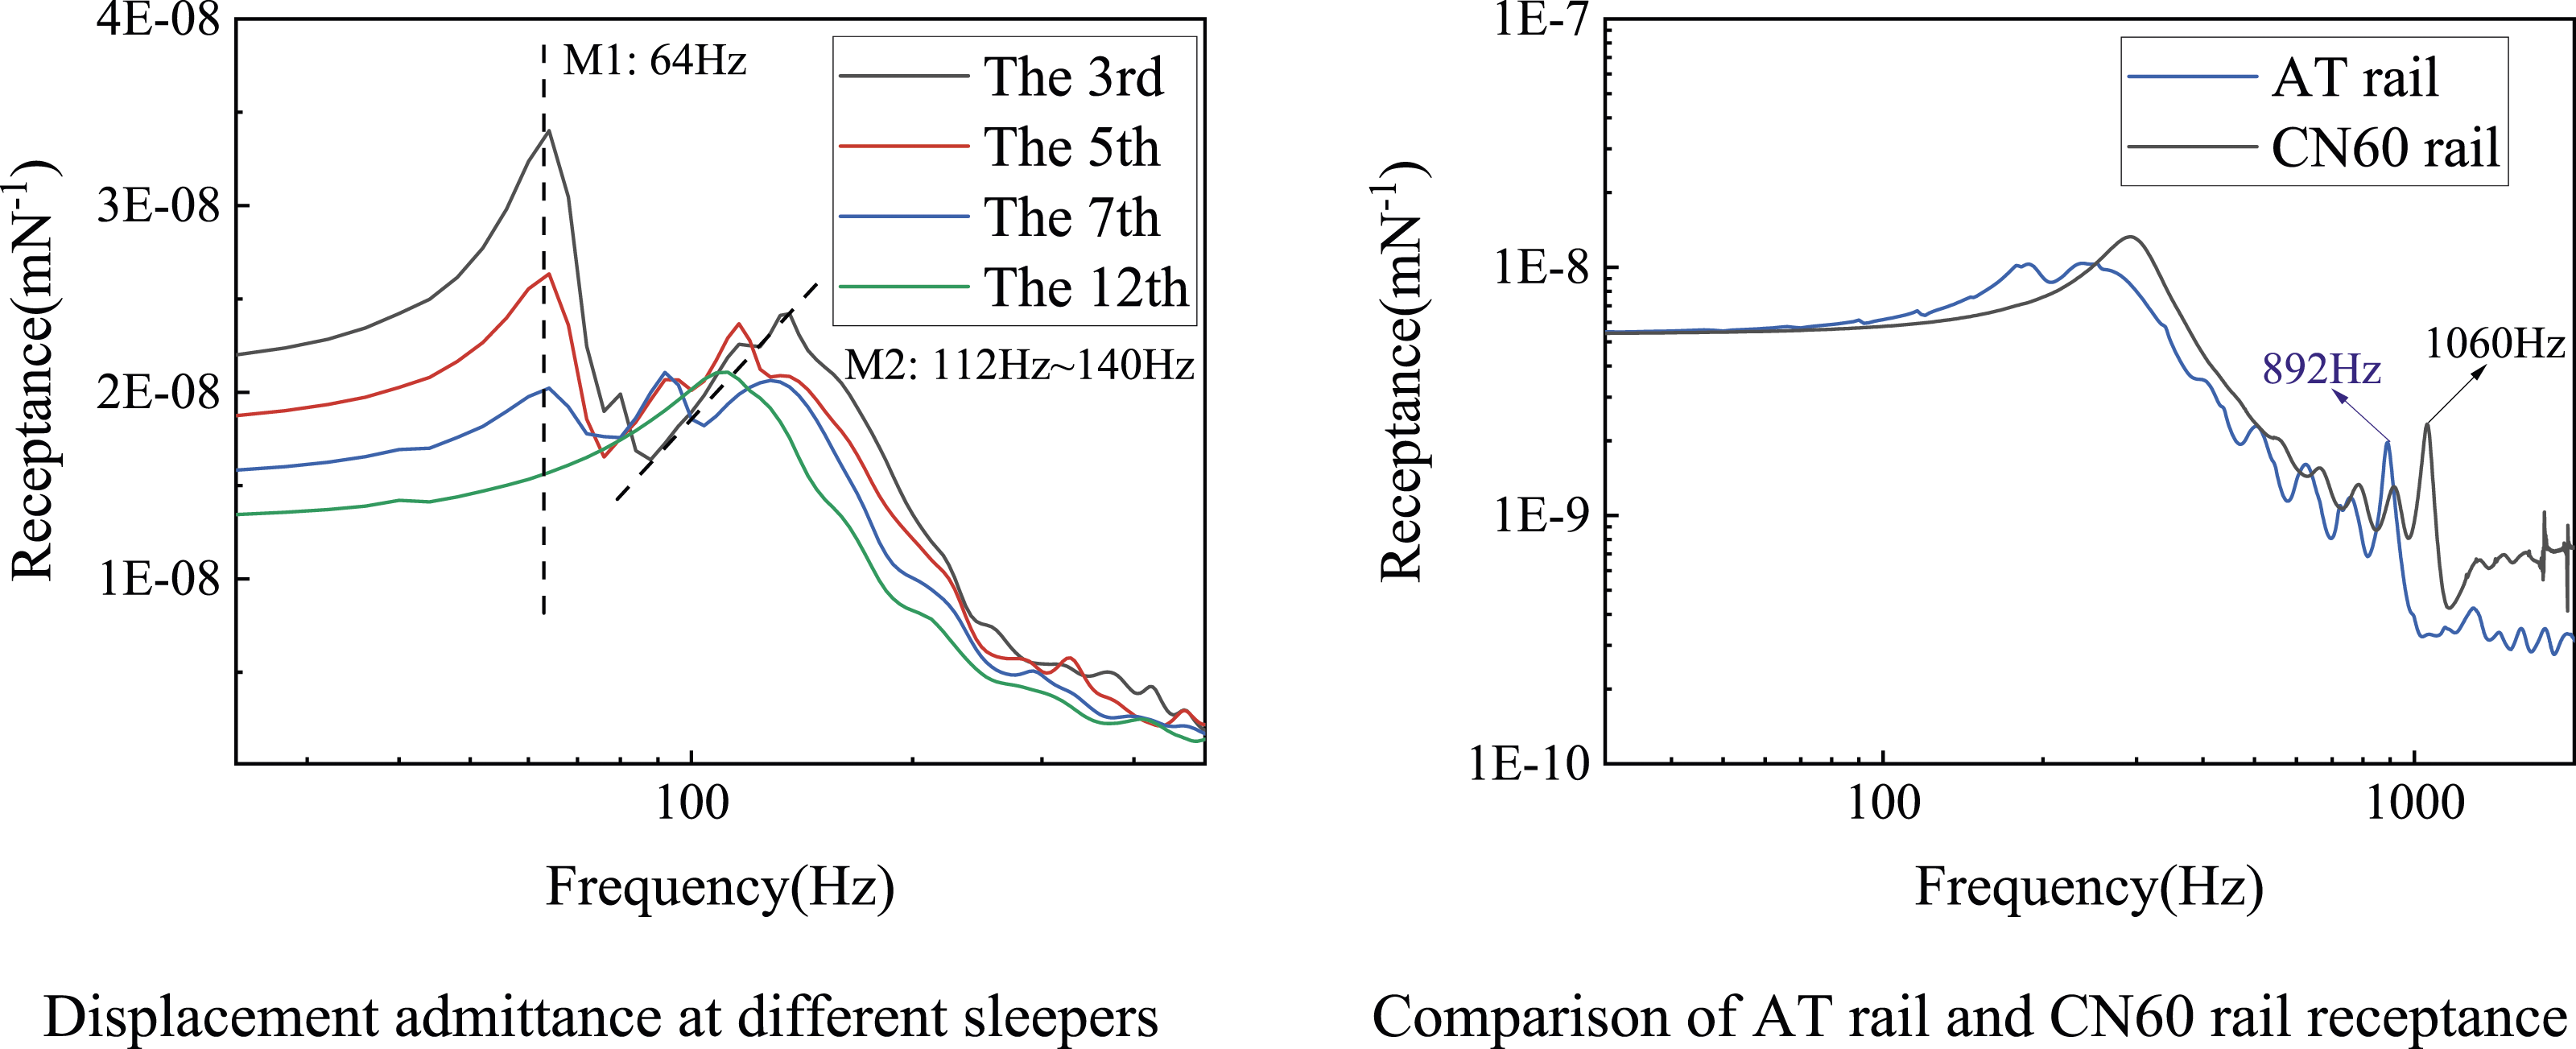
Figure 5(b) presents the variation in acceleration admittance of the switch rail across the frequency range of 200 Hz to 2000 Hz. It is evident that closer proximity to the switch rail point correlates with higher acceleration admittance values. The increase in admittance from sleepers 0 to 8 is primarily attributed to the reduced cross-sectional area of the switch rail. In this segment, spanning sleeper numbers 0 to 8, the switch rail exhibits a variable cross-section without pinned–pinned resonance. However, from sleeper numbers 8 to 18, the switch rail consists of an AT rail with a uniform cross-section. Here, the peak value of the first-order pinned–pinned resonance for the switch rail reaches 892 Hz.
As depicted in Figure 6(b), the first-order pinned–pinned resonance peak value of the AT rail is lower compared to that of the CN60 rail, and its admittance amplitude generally remains smaller than that of the CN60 rail. This disparity arises from the lower vertical bending stiffness of the AT rail relative to the CN60 rail. Bending stiffness, defined as the product of the elastic modulus and the moment of inertia, indicates that the bending stiffness of the AT rail is only 79.2% of that of the CN60 rail.
To comprehensively analyze the influence of changes in cross-sectional changes on modal characteristics, three models of switch rails with varying top widths were established using the methodology outlined in Section 3, with the models constrained by spring face array elements. The modal results are presented in Figure 7. Due to the asymmetric nature of the cross-sections, there is a coupling between vertical bending and torsional vibrations in the switch rail. The M1 mode predominantly exhibits torsional vibration, while the M2 mode primarily involves vertical bending, both contributing to the overall vertical vibration of the switch rail. M1 M2 and 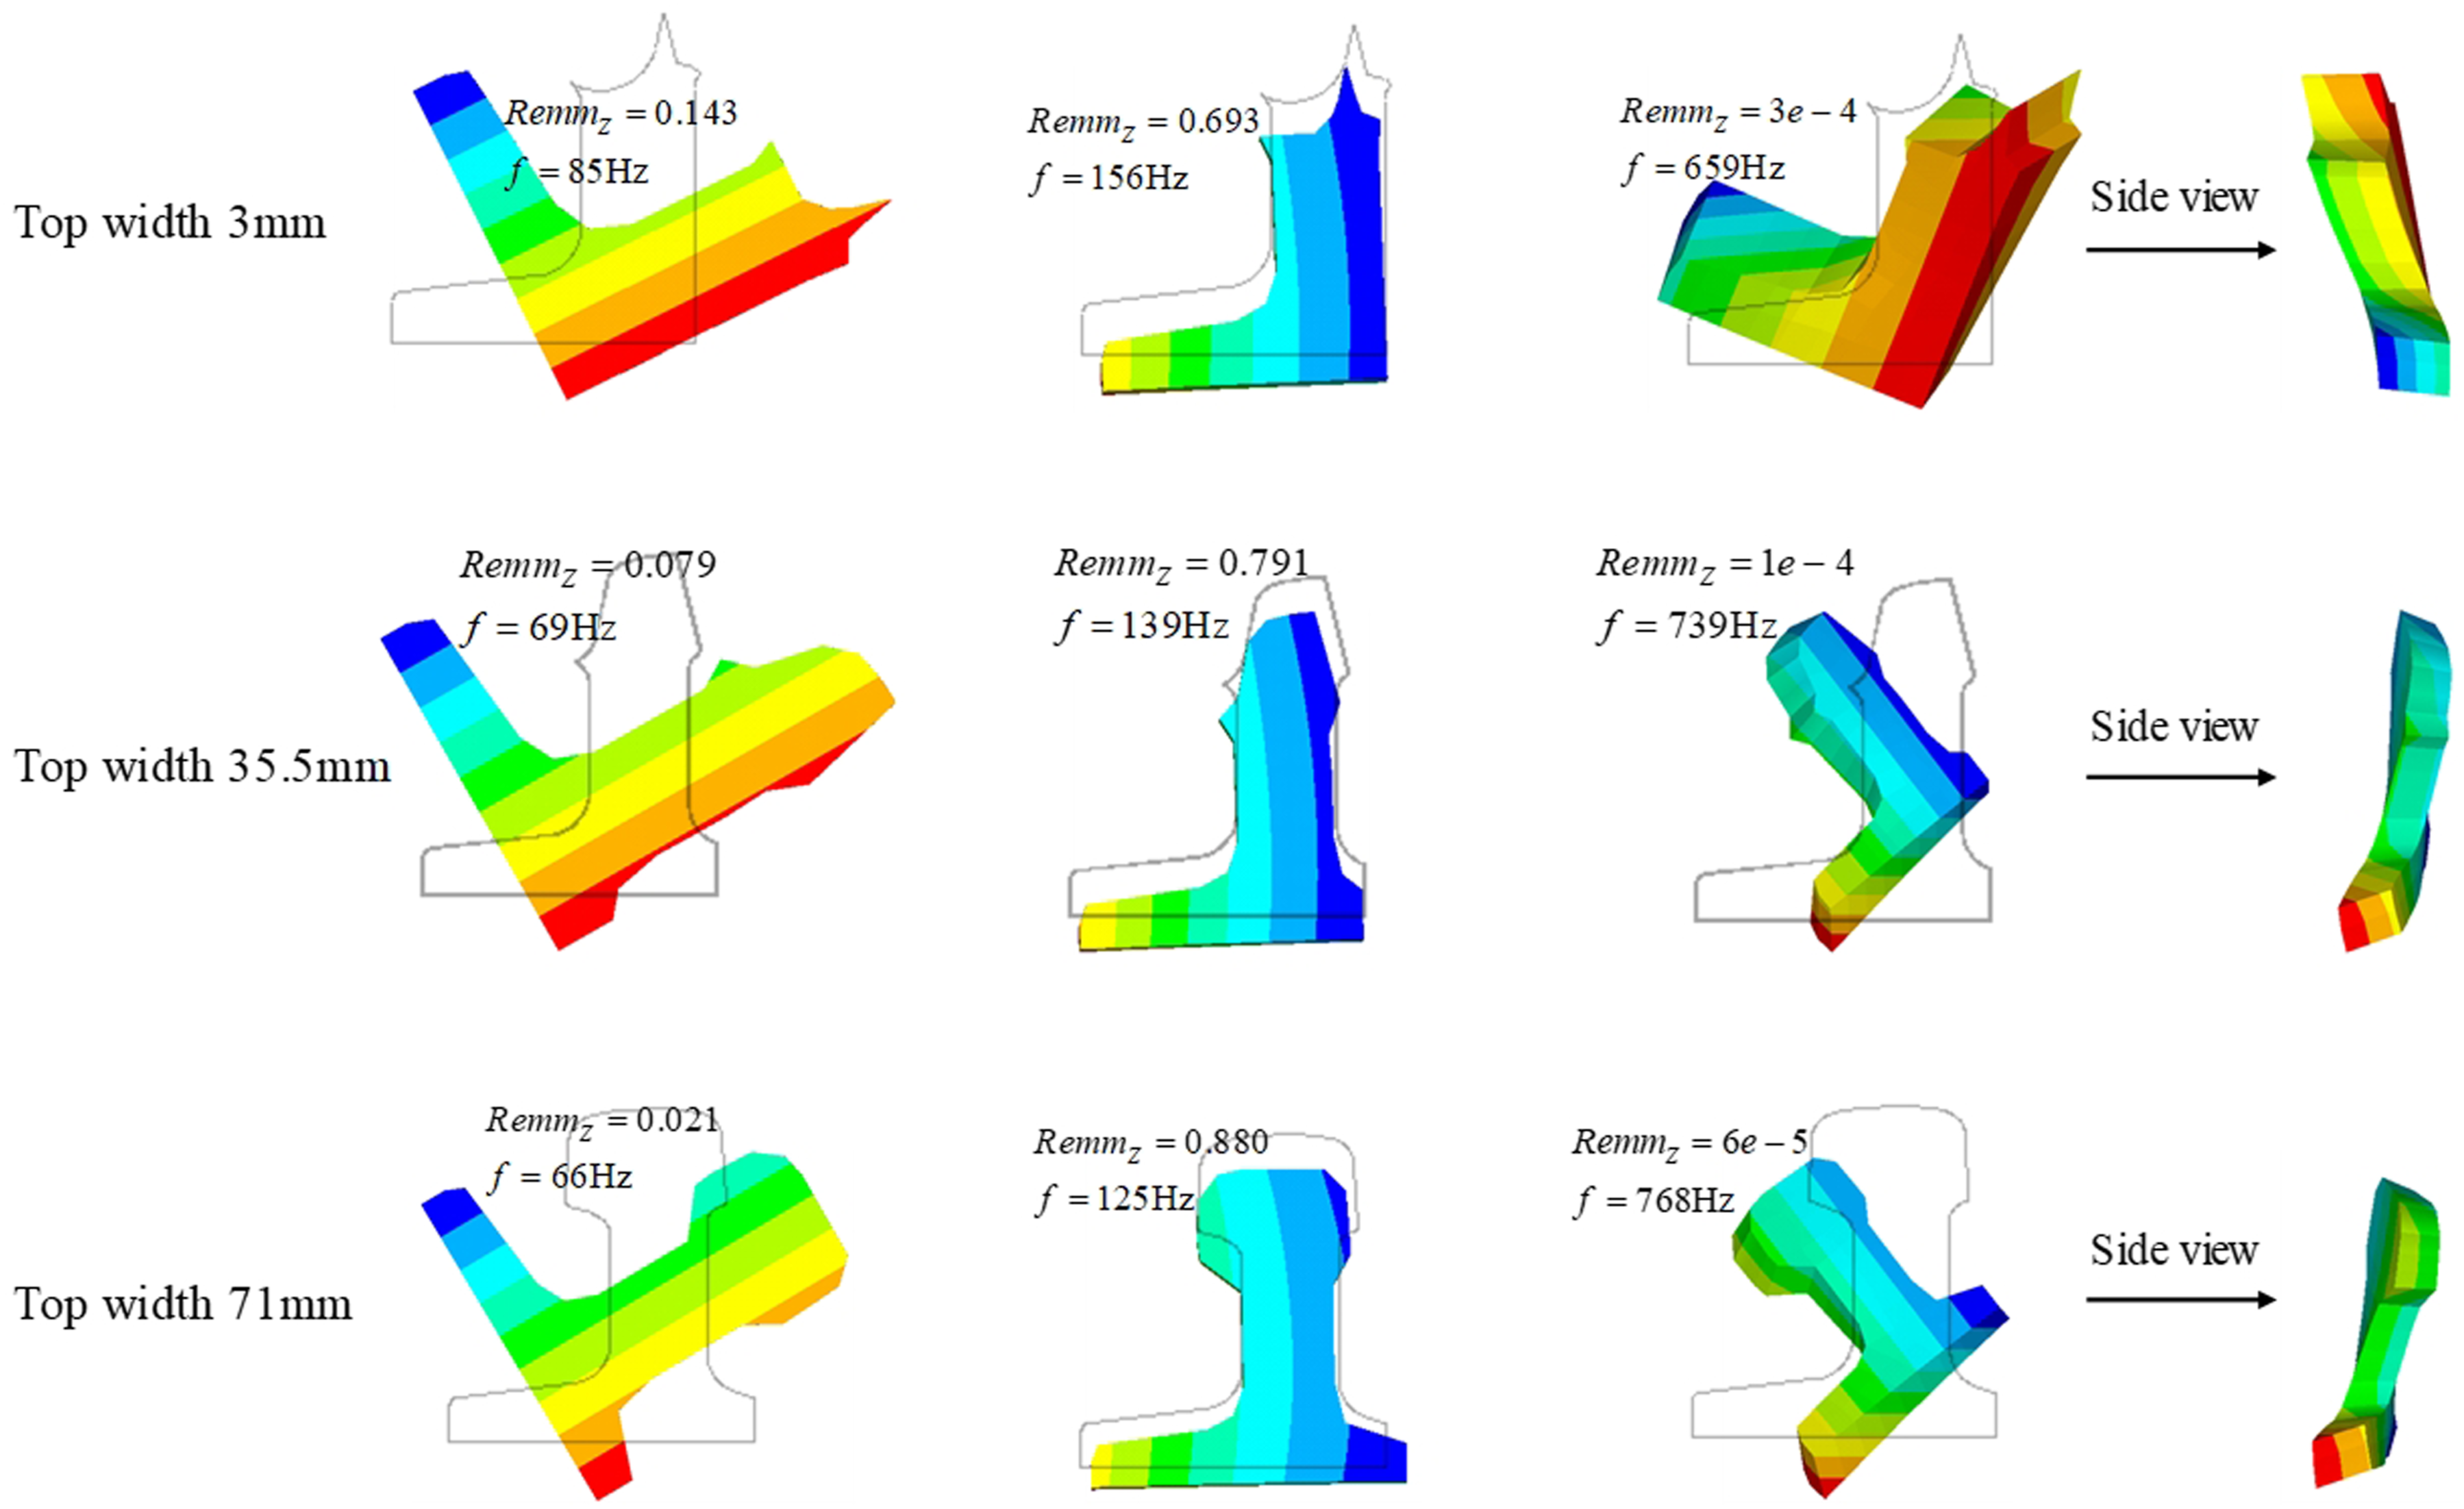
Observing Figure 7, it is apparent that as the top width of the switch rail decreases, the natural frequencies (M1 and M2) increase. This suggests that the natural frequency of the switch rail is primarily influenced by its mass at lower frequencies.
In summary, the modal characteristics of the switch rail are significantly influenced by its cross-sectional properties. Cross-sectional quality predominantly affects behavior at lower frequencies, whereas cross-sectional stiffness becomes more influential at higher frequencies. The asymmetry in the cross-sections results in multi-directional coupling resonance of the modes, primarily characterized by bending and torsional resonances.
5.2. Modal analysis
Based on the mode separation method mentioned in Section 4 and the observation of the switch rail mode shapes, the modes that play a major role in the vertical vibration of the switch rail are classified into three categories: the first type is the vertical bending mode mainly caused by Z direction vibration, the second type is the torsional mode mainly caused by torsion around the X axis, and the third type is the reverse phase torsional mode of the rail head and base appearing at high frequency, showing obvious deformation of the mode cross-sections. This study focuses on the vertical vibration of the switch rail, without considering the lateral vibration, that is, vibration in the Y direction. See Figure 8 for the process. Three main modes that contribute to vertical vibration.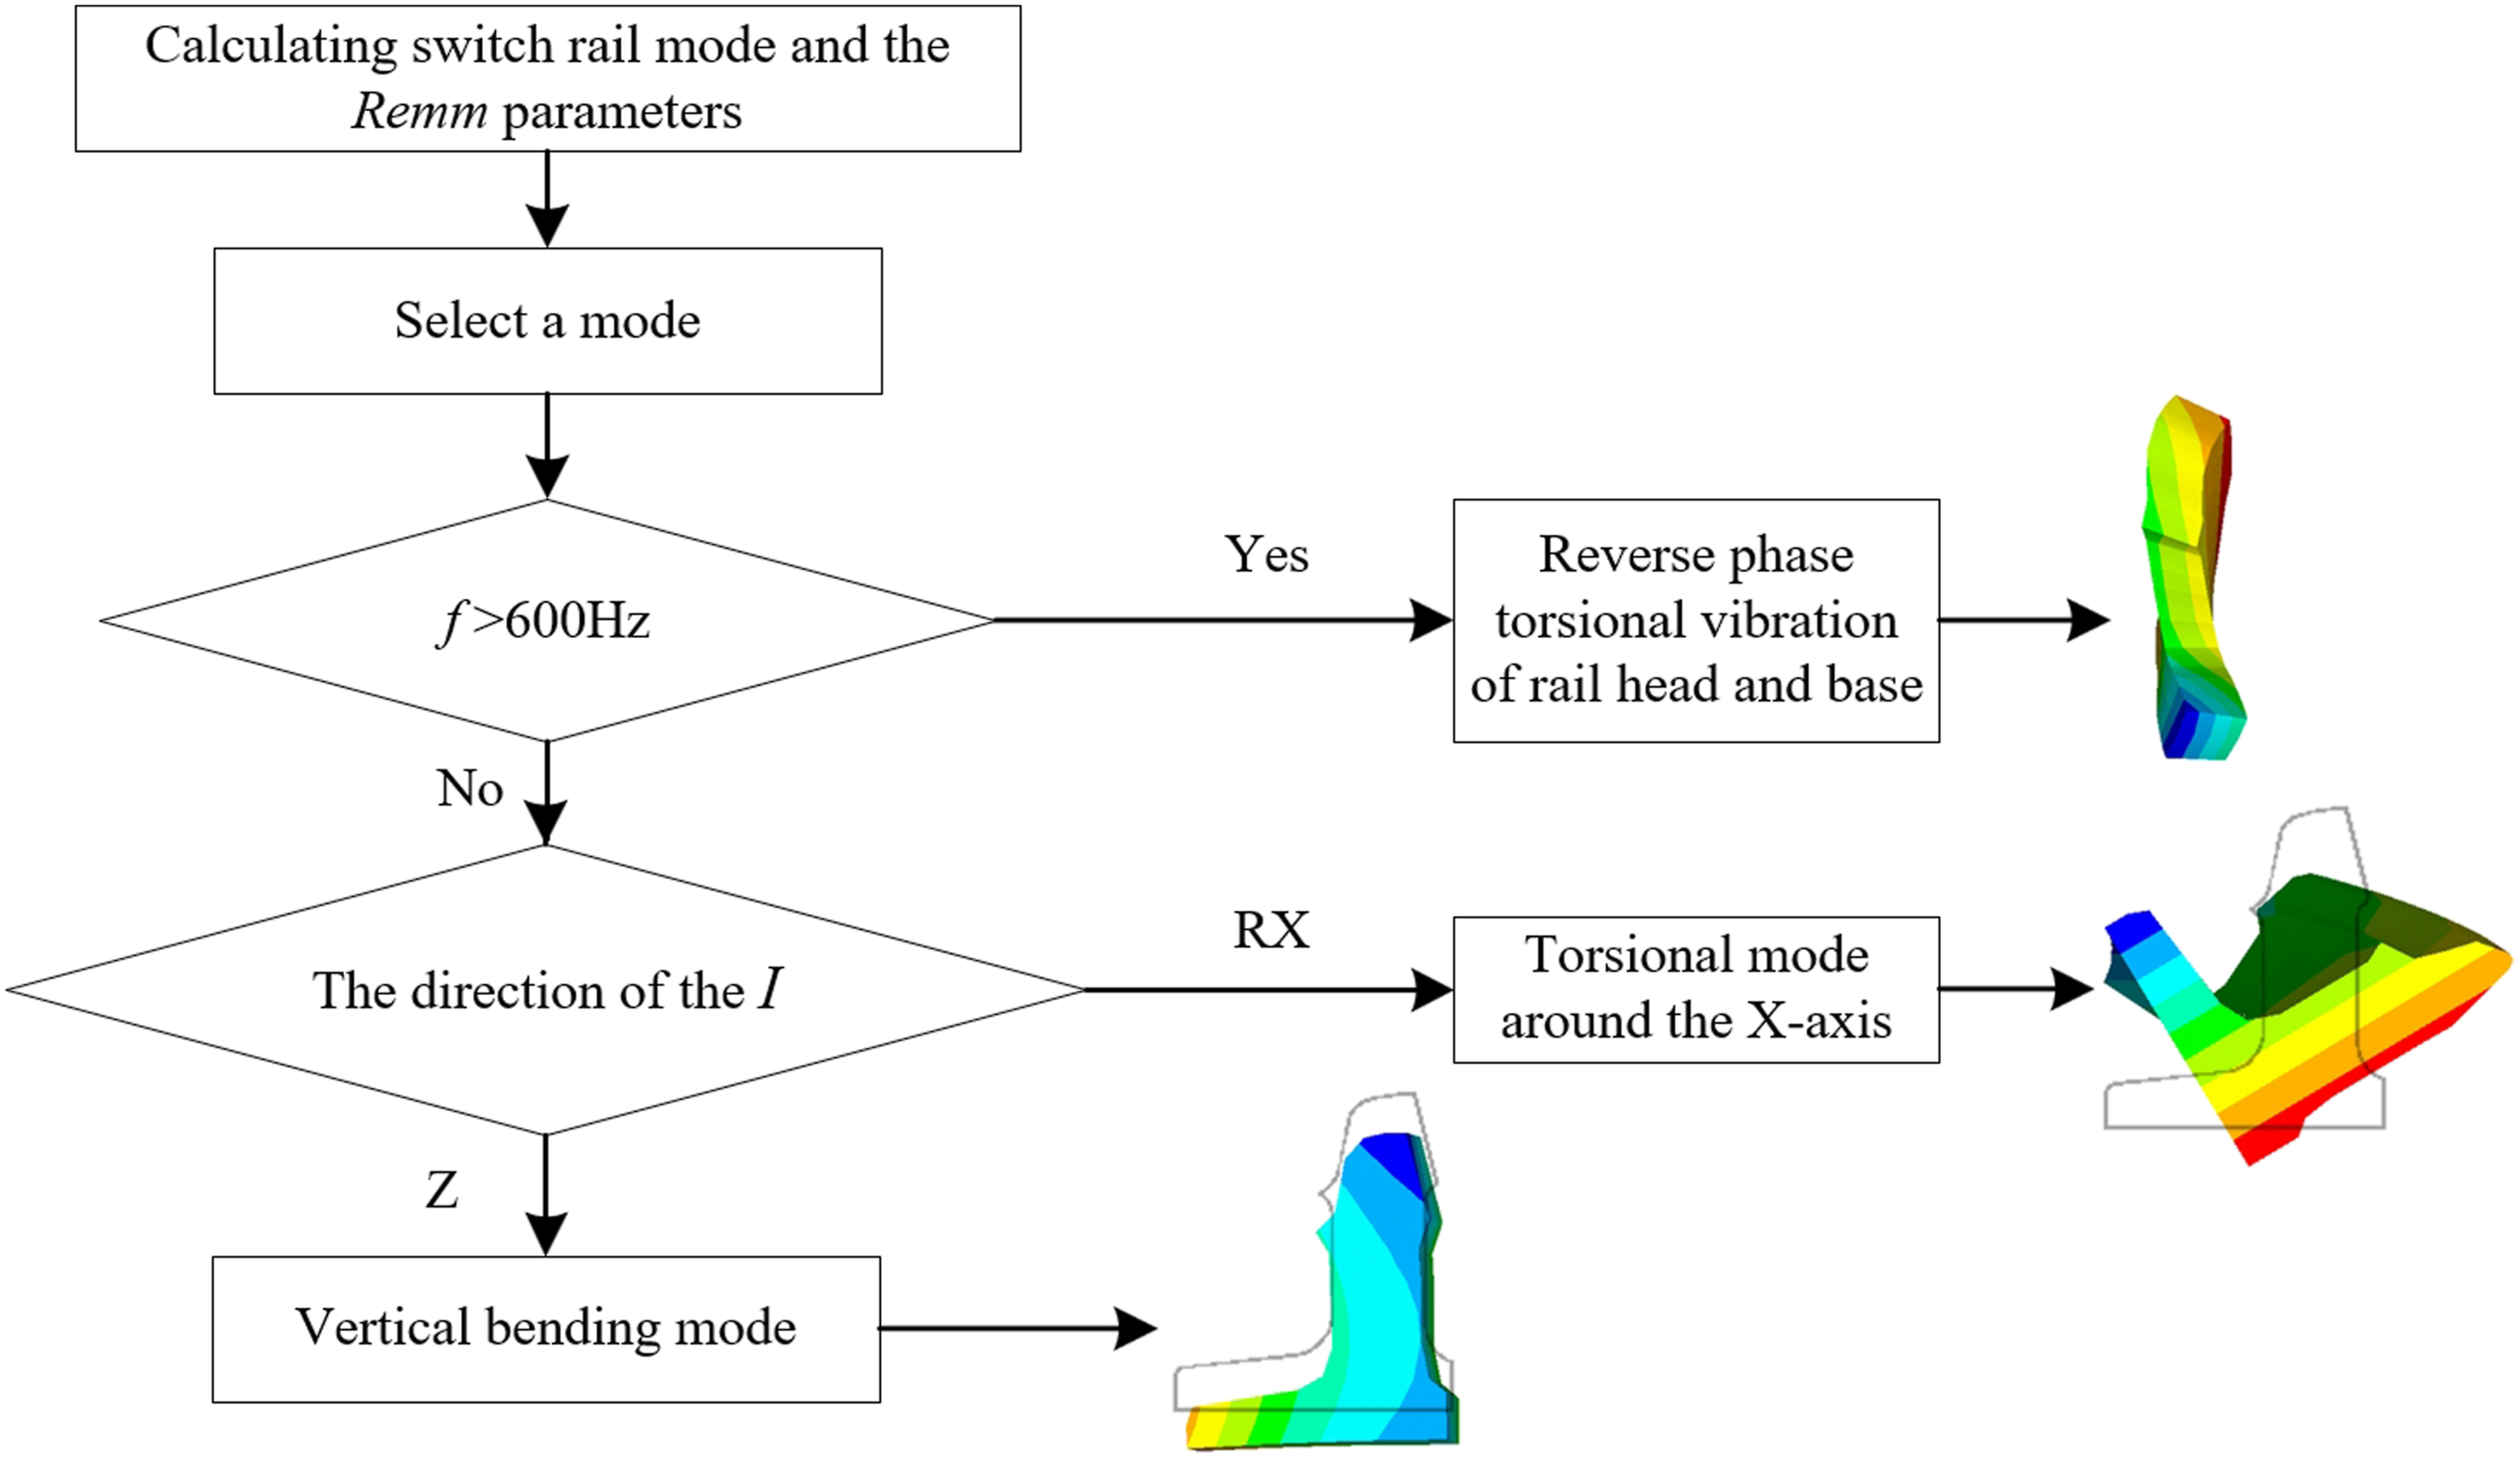
Taking the cross-section with a top width of 40 mm as an example, the modal cross-sections of three modes are extracted, and the results are shown in Figure 9. As seen in the first-order rotational mode in Figure 9, the closer to the switch rail point, the more obvious the rotation effect of the section. The switch rail does not show single-direction vibration modes; instead, all its modal orders are coupled vibrational modes in various directions. The reverse torsion mode between the rail head and rail base appears above 600 Hz, and the higher the natural frequency, the more obvious the deformation of the mode section. Switch rail modes: Ⅰ torsional modes around the X-axis at 82 Hz, 134 Hz, 274 Hz, and 421 Hz; Ⅱ vertical bending modes at 140 Hz, 167 Hz, 228 Hz, and 449 Hz; Ⅲ the reverse phase torsion mode between the rail head and base at 594 Hz, 930 Hz, 2072 Hz, and 3361 Hz.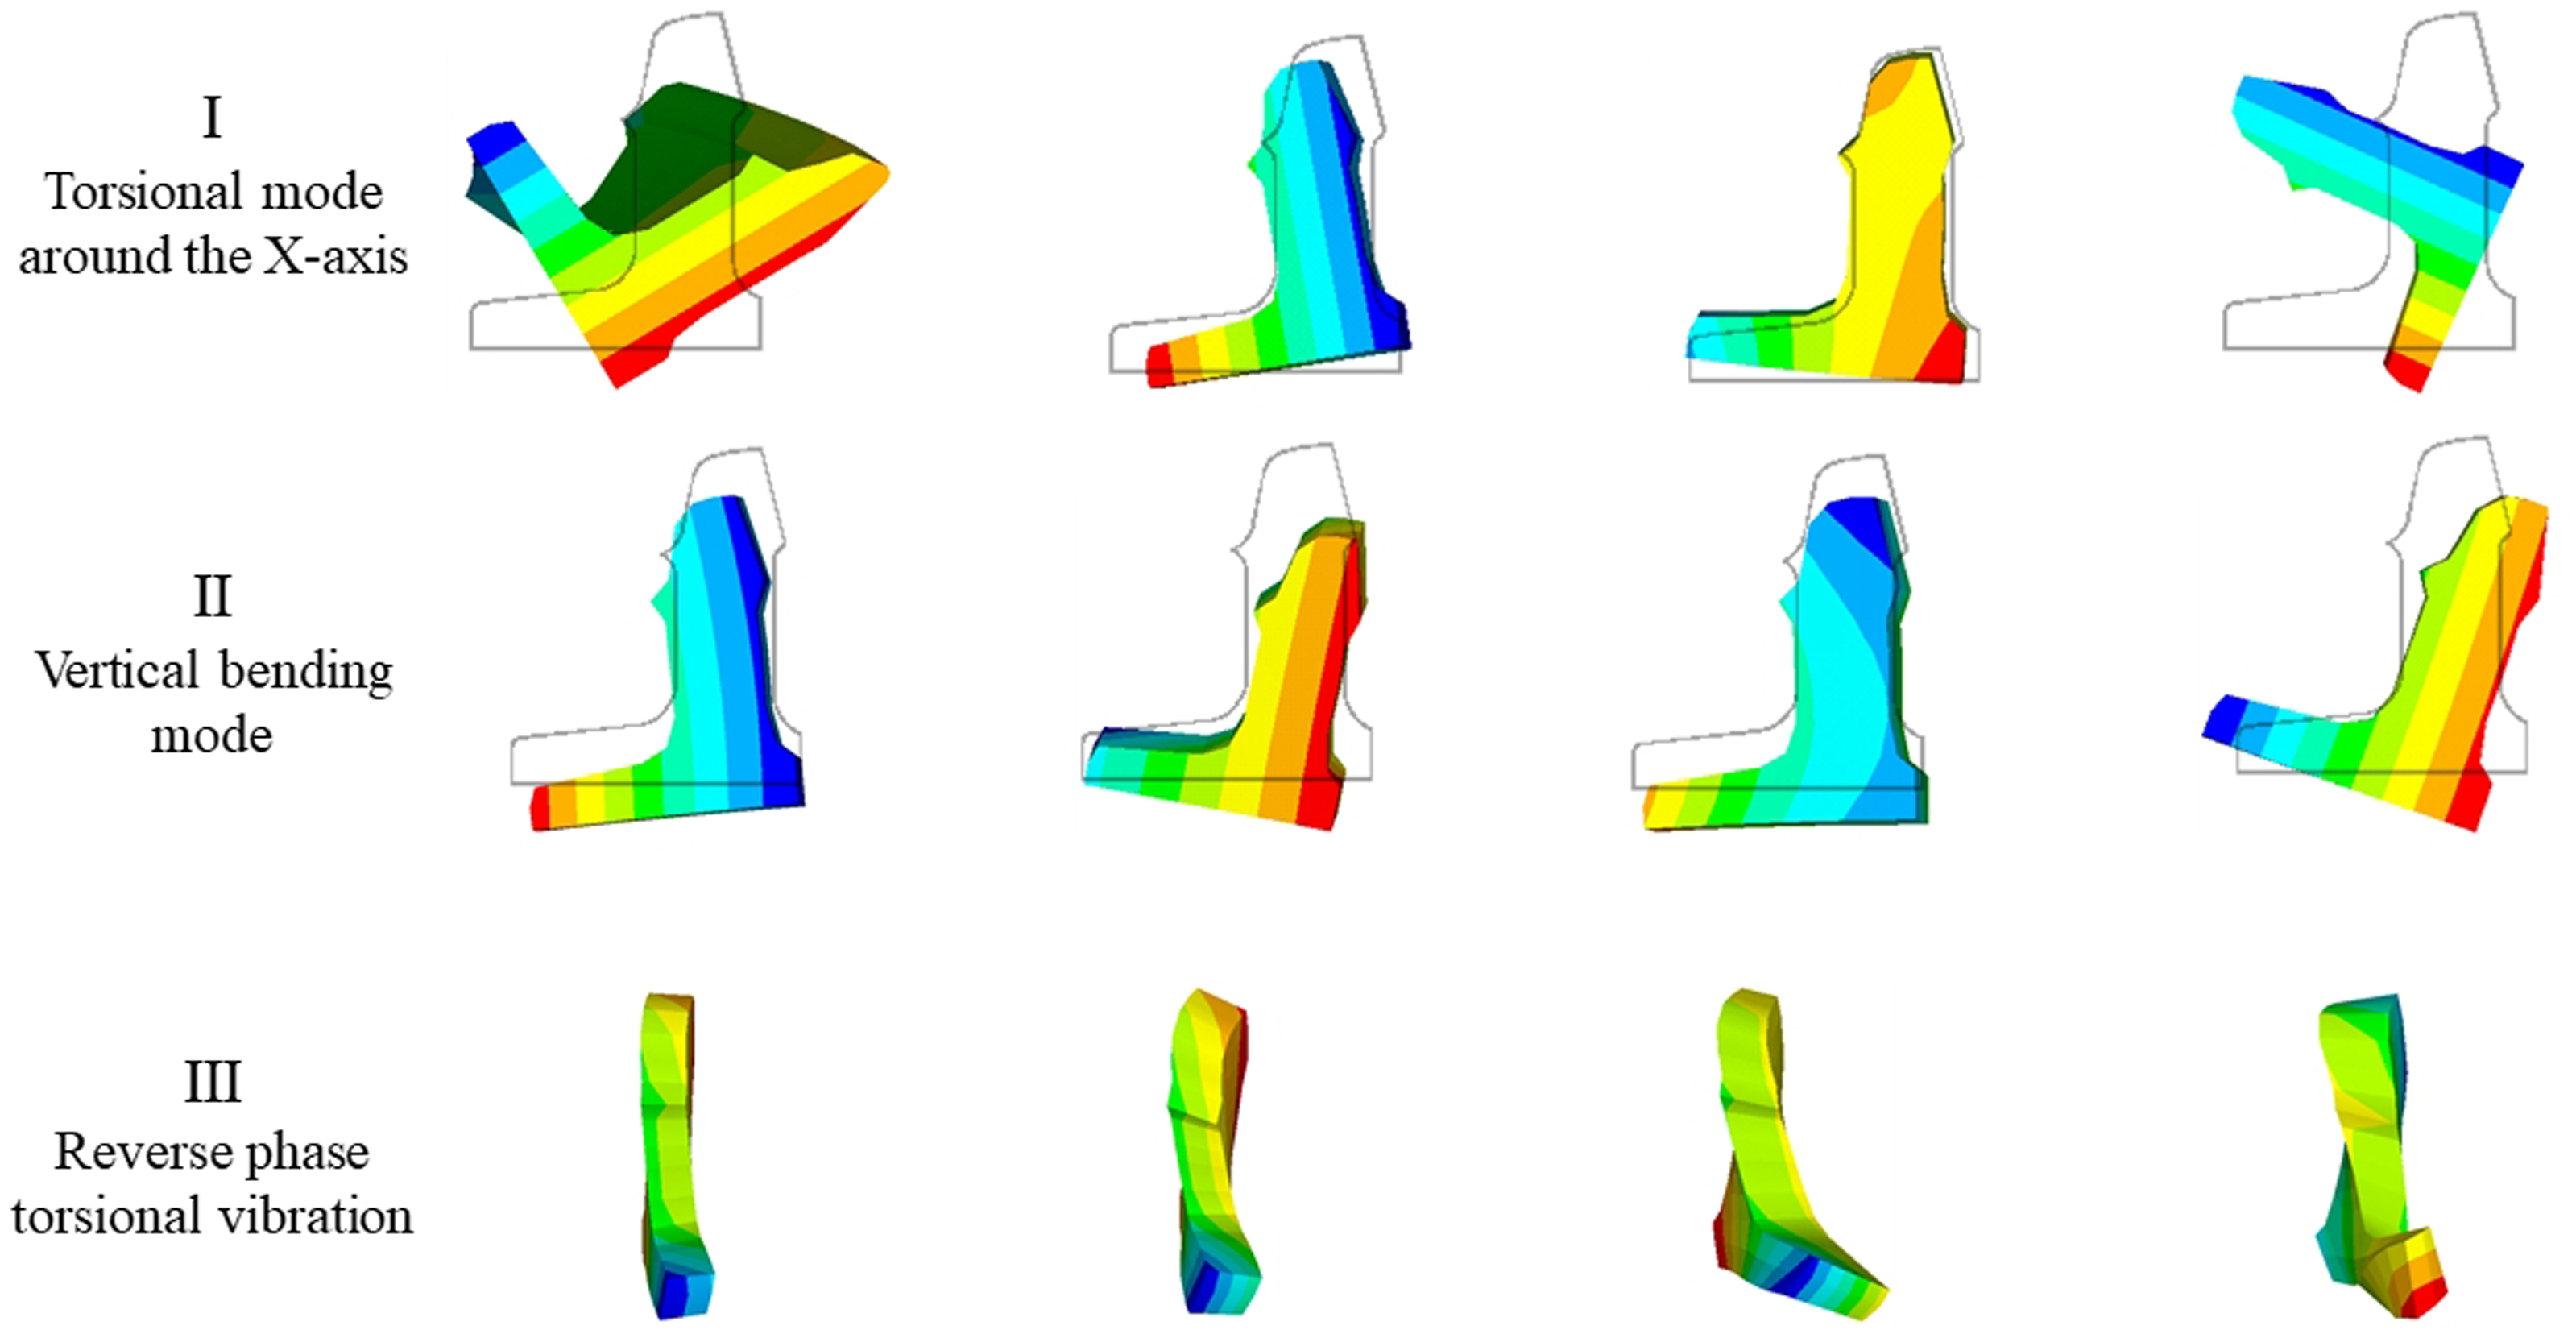
A CN60 rail model of equal length is established using the parameters outlined in Table 1 to compare the vertical modes of ordinary rail and switch rail. The vertical vibration modes of ordinary rail are classified as vertical bending modes (Zhang et al., 2021a), as depicted in Figure 10. It can be observed that beyond 1500 Hz, the rail cross-section exhibits more pronounced deformation, consistent with findings in the literature (Thompson, 2013), thereby validating the accuracy of our computational results. In contrast to the ordinary rail, where modal cross-sections deform within a plane, the switch rail modal cross-sections deform in space, extending beyond a plane and occurring at lower frequencies as well. CN60 rail vertical bending modes: 147 Hz, 936 Hz, 2070 Hz, and 3710 Hz.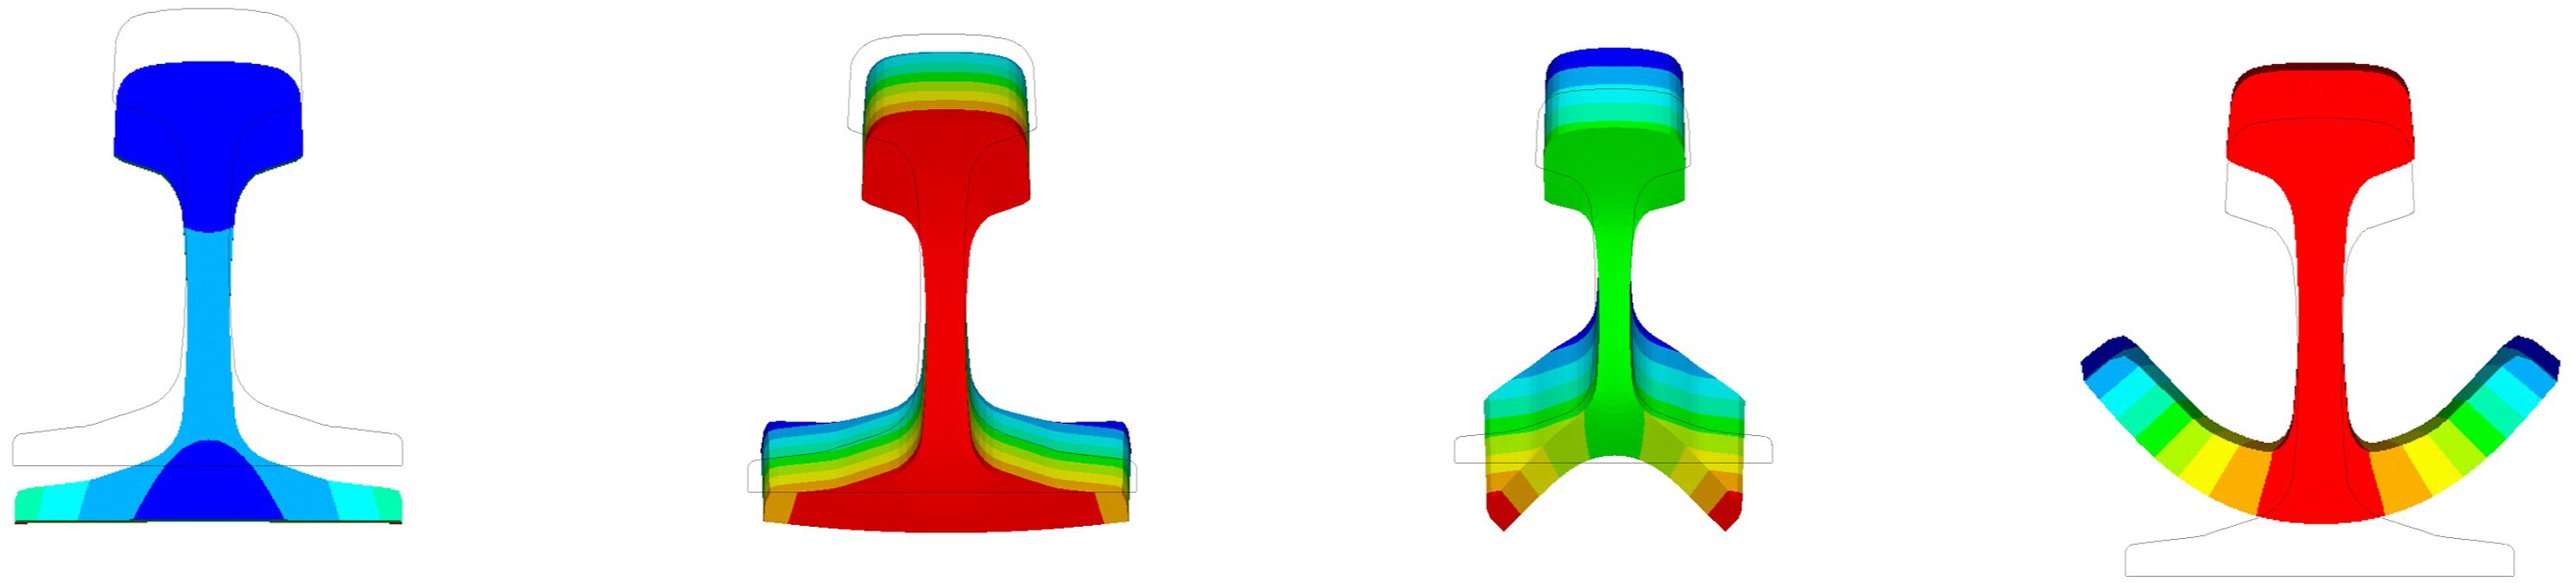
6. Experimental investigation and comparison
In this section, the vibration characteristics of the switch rail are investigated through force hammer testing, and the results are validated against numerical model calculations.
6.1. Experimental method
Figure 11 provides a field test diagram. The admittance and ODSs of the switch rail are measured by experiments. The experiment employed the INV3068T, a high-precision parallel-conversion data acquisition system. The sampling frequency was set to 12.8 kHz. The excitation was performed using the INV9314 force hammer with a force range of 0 to 100 kN, using an aluminum head. The impact point was positioned as close as possible to the accelerometer. The accelerometers used in the experiment were INV9824 ICP accelerometers, with an acceleration range of 1000g. The ODS measuring section of the rail was sleeper numbers between 3 and 8, with a top width varying from 26 mm to 54.5 mm. This section is the primary wheel-load transition area (Hao et al., 2023). The rail segment under test had a length of 2.4 m, with nine accelerometers evenly distributed on it. Field experiment.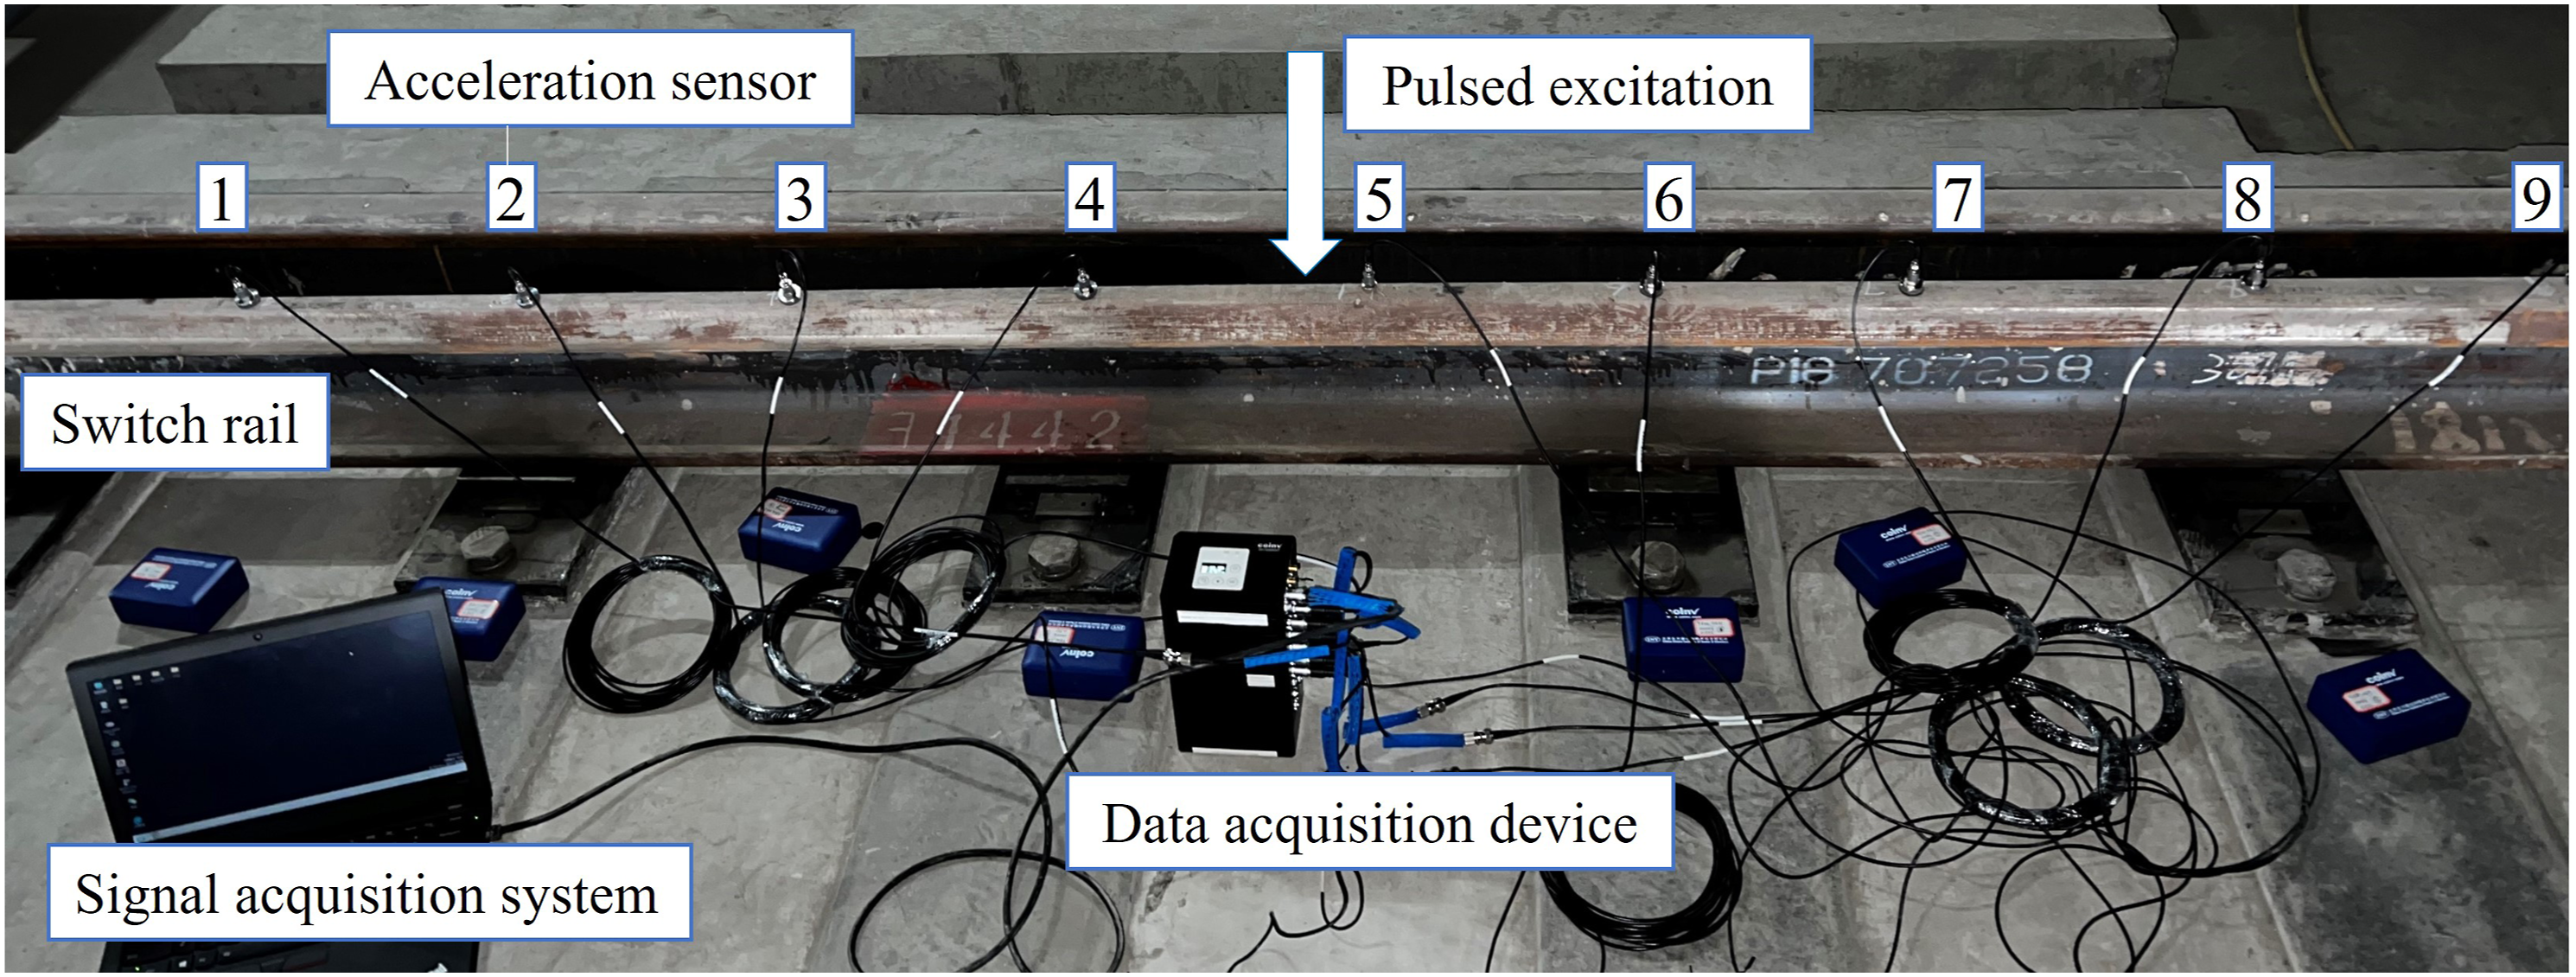
In the experiment, each measurement point was struck three times, and the coherence function value was calculated to ensure the coherence between the excitation signal and the measured signal (Sun et al., 2023). The signals obtained from the nine accelerometer sensors were:
Traditional modal testing is limited to linear and stationary structures, while ODS testing can analyze the mode shapes of nonlinear and time-varying motion, making it more versatile in its applications (Richardson, 1997). When solving for the frequency domain ODS of the track, the first step is to obtain the track FRF matrix. The calculation of the FRF is as follows: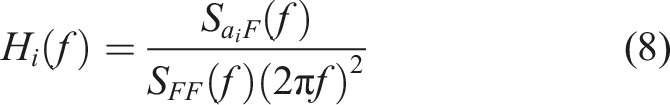

6.2. Results and comparison
The admittance of the switch rail was measured and depicted in Figure 12. In the variable section of the switch rail, the vertical admittance magnitude is notably larger. This can be attributed to the milling of the switch rail cross-sections, which reduces bending stiffness. The first-order vertical bending natural frequency (M2) exhibits a complex variation trend influenced by the presence of the switch machine and rail milling. Specifically, at sleeper positions 9 to 10, the natural frequency decreases to 82 Hz due to the switch machine, accompanied by a decrease in admittance magnitude. The presence of diverse boundary conditions results in a less pronounced pinned–pinned resonance of the switch rail. Within the variable cross-sections of the switch rail, two distinct natural frequencies are observed within the 200 Hz range, namely, M1 and M2, consistent with numerical simulation results. Measured vertical admittance.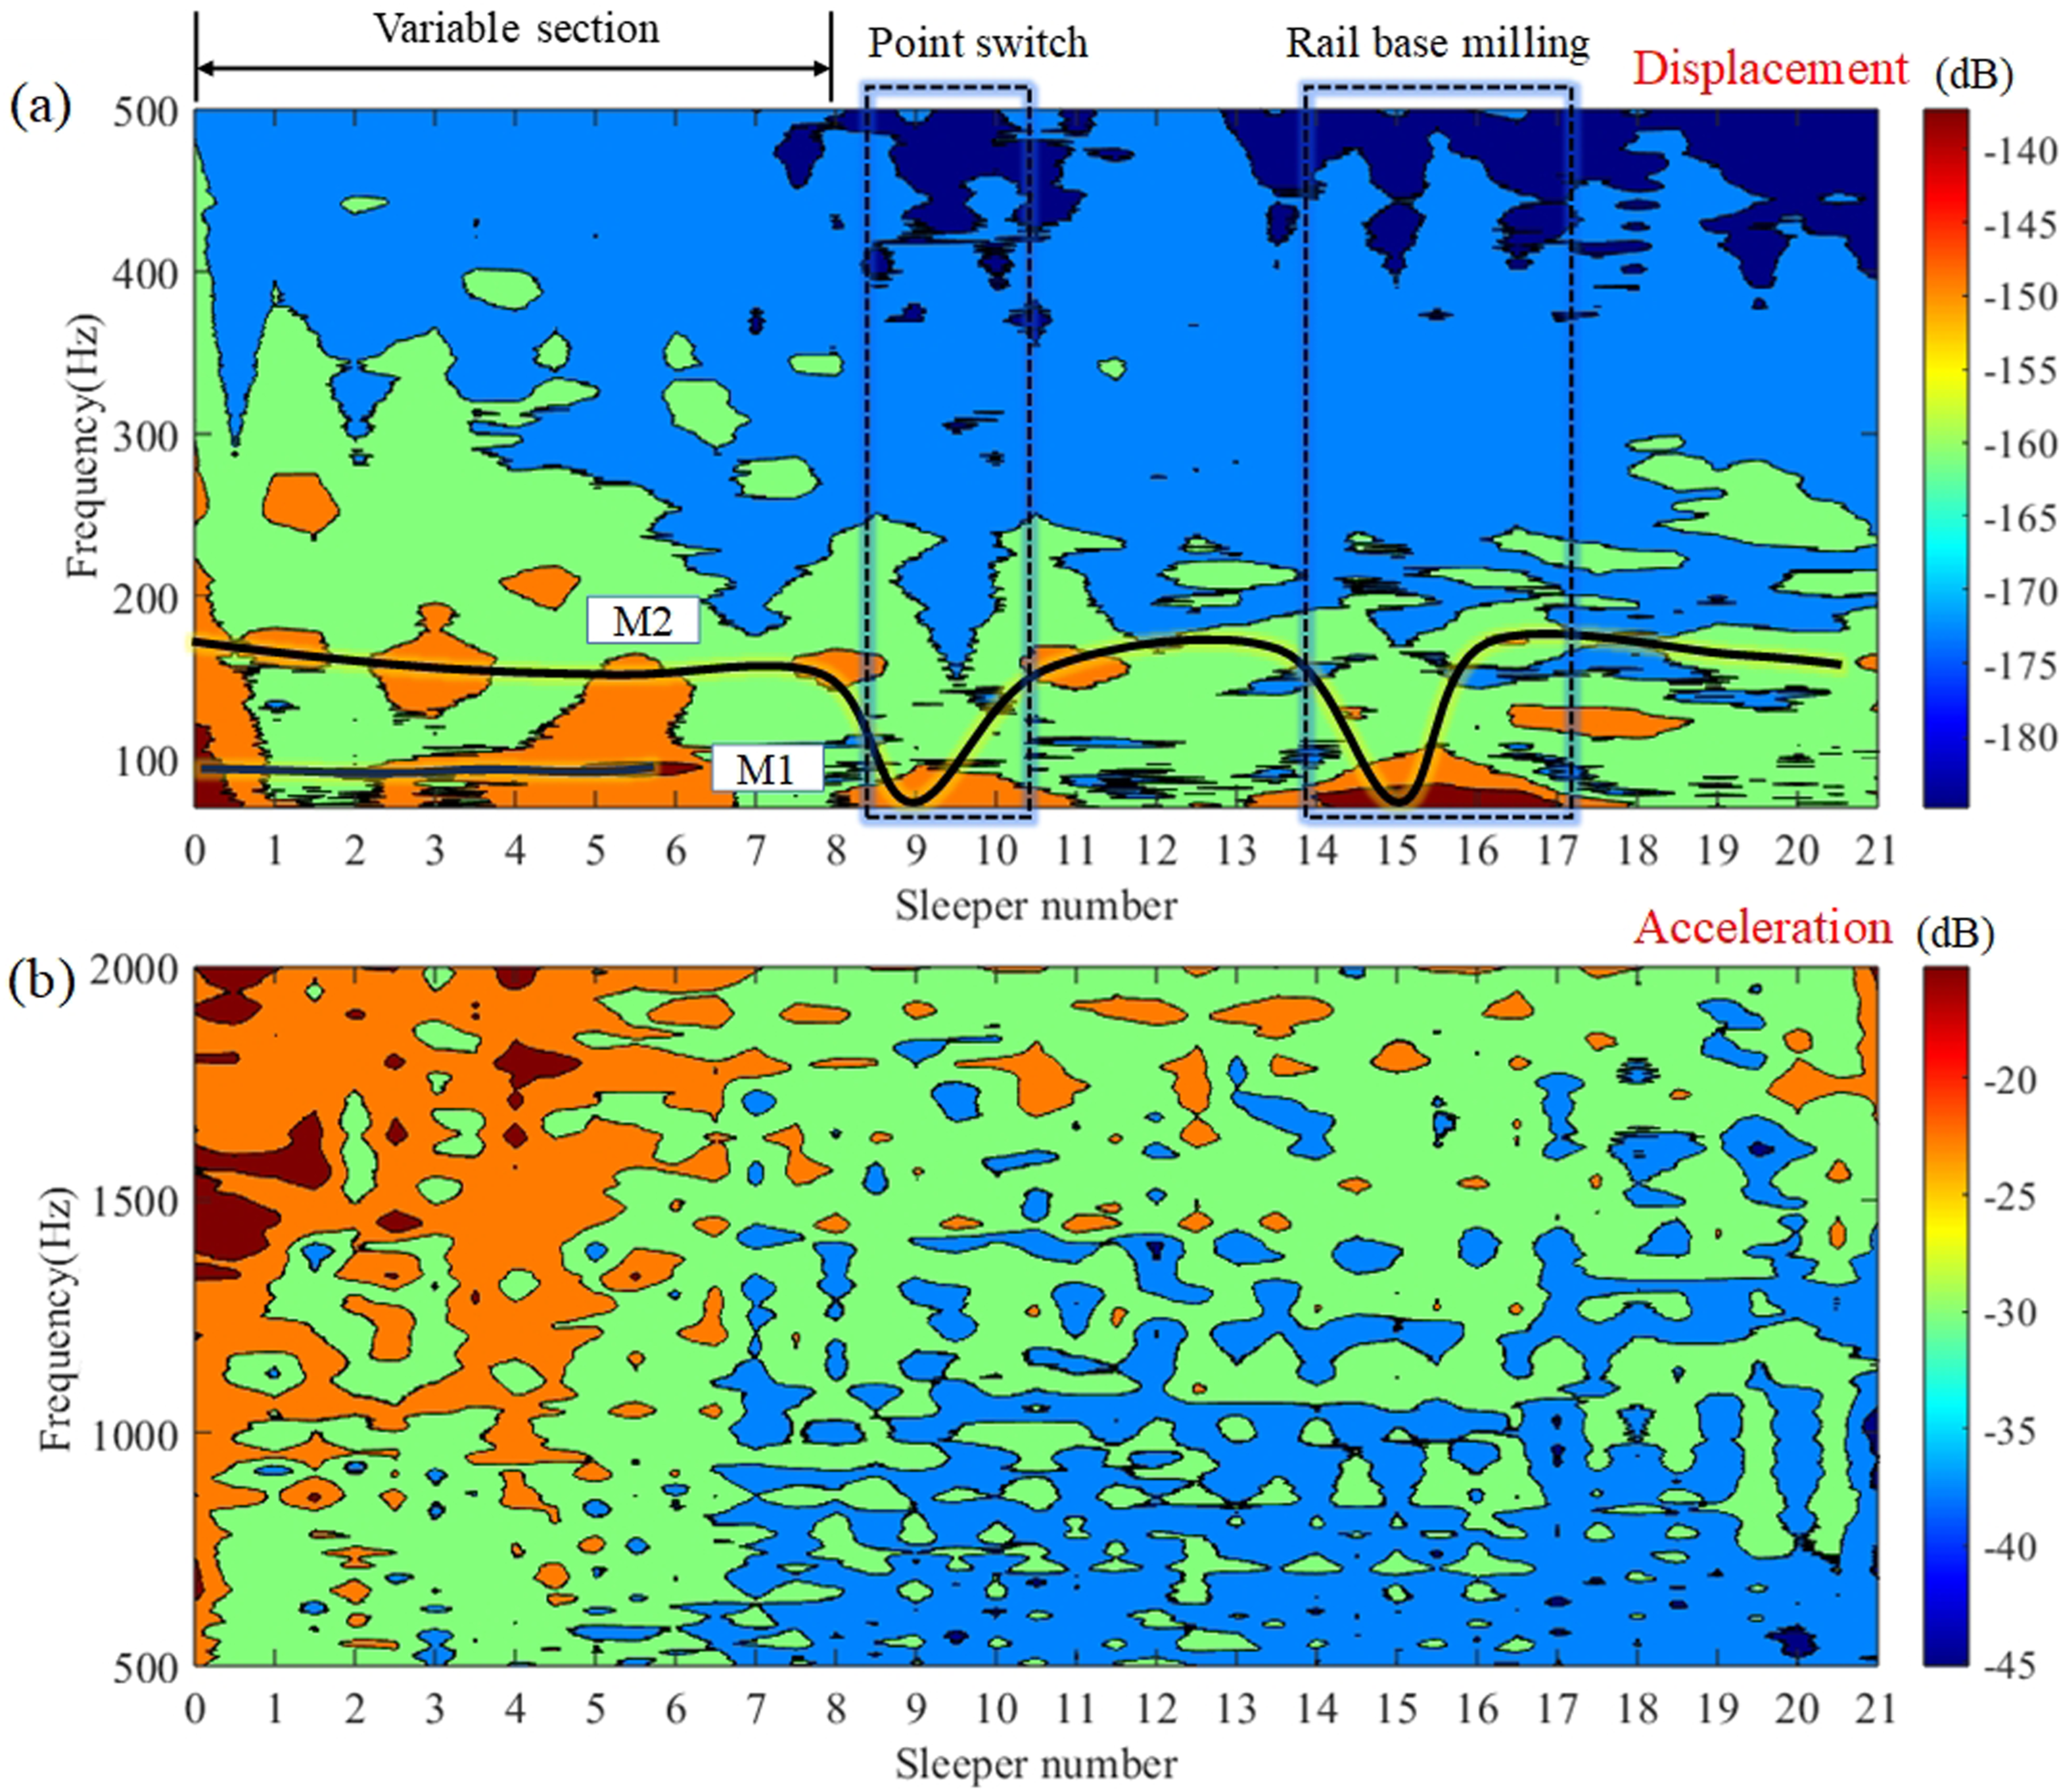
Based on the ODS measurement method, the ODS of the switch rail at various frequencies was plotted, as depicted in Figure 13. From the results shown in the figure, it is evident that as the frequency increases, the wavelength of the ODS progressively shortens. Notably, two natural frequencies are observed within the 200 Hz range for the switch rail, specifically at 64 Hz and 156 Hz. Switch rail ODSs.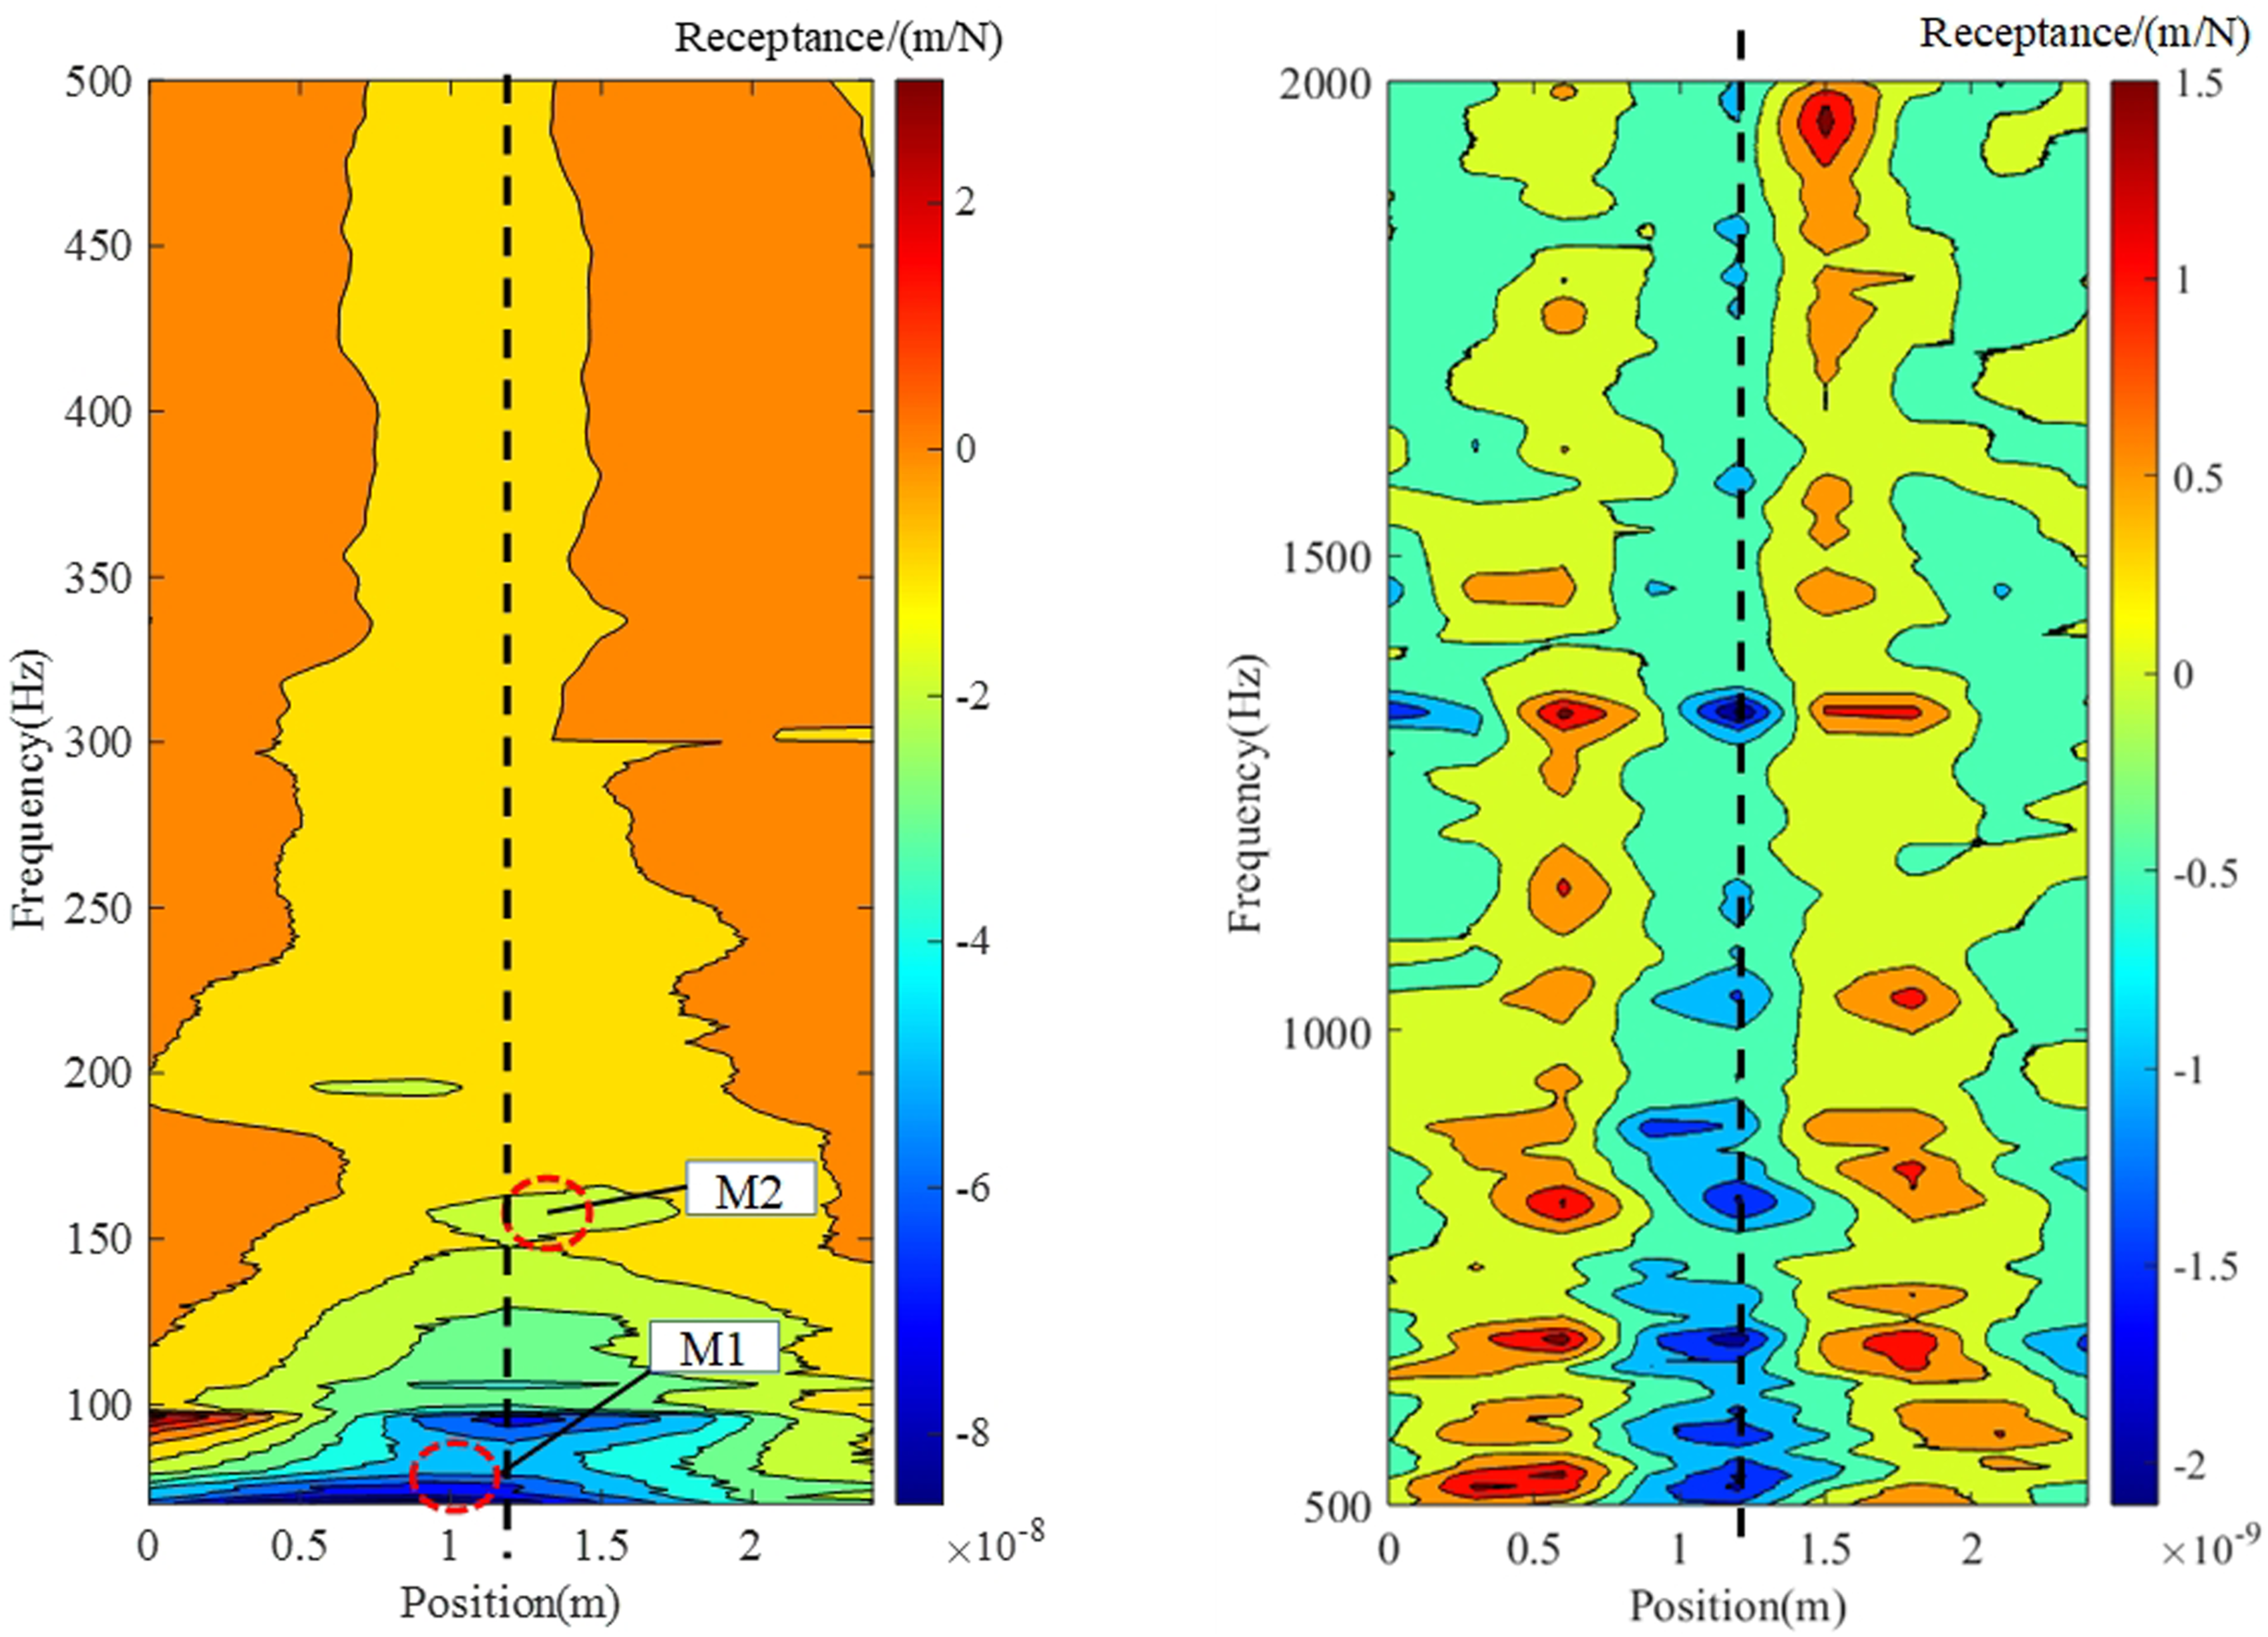
Figure 14 illustrates the comparison between the measured ODSs and the mode shapes of the switch rail. Integrating this with the information from Figure 9, it is clear that the mode shape observed at 60 Hz is attributed to the rotational effect caused by the asymmetric cross-sections of the rail. Additionally, the amplitude of this mode shape increases as the measurement point approaches the switch rail point, correlating with the degree of asymmetry in the cross-sections. Comparison between the mode shapes from FE simulation and ODSs from measurement: Ⅰ: 82/60 (simulation/measurement), 274/275, 421/422; Ⅱ: 140/156, 228/240, 449/456; Ⅲ: 594/600, 930/931, 1457/1462.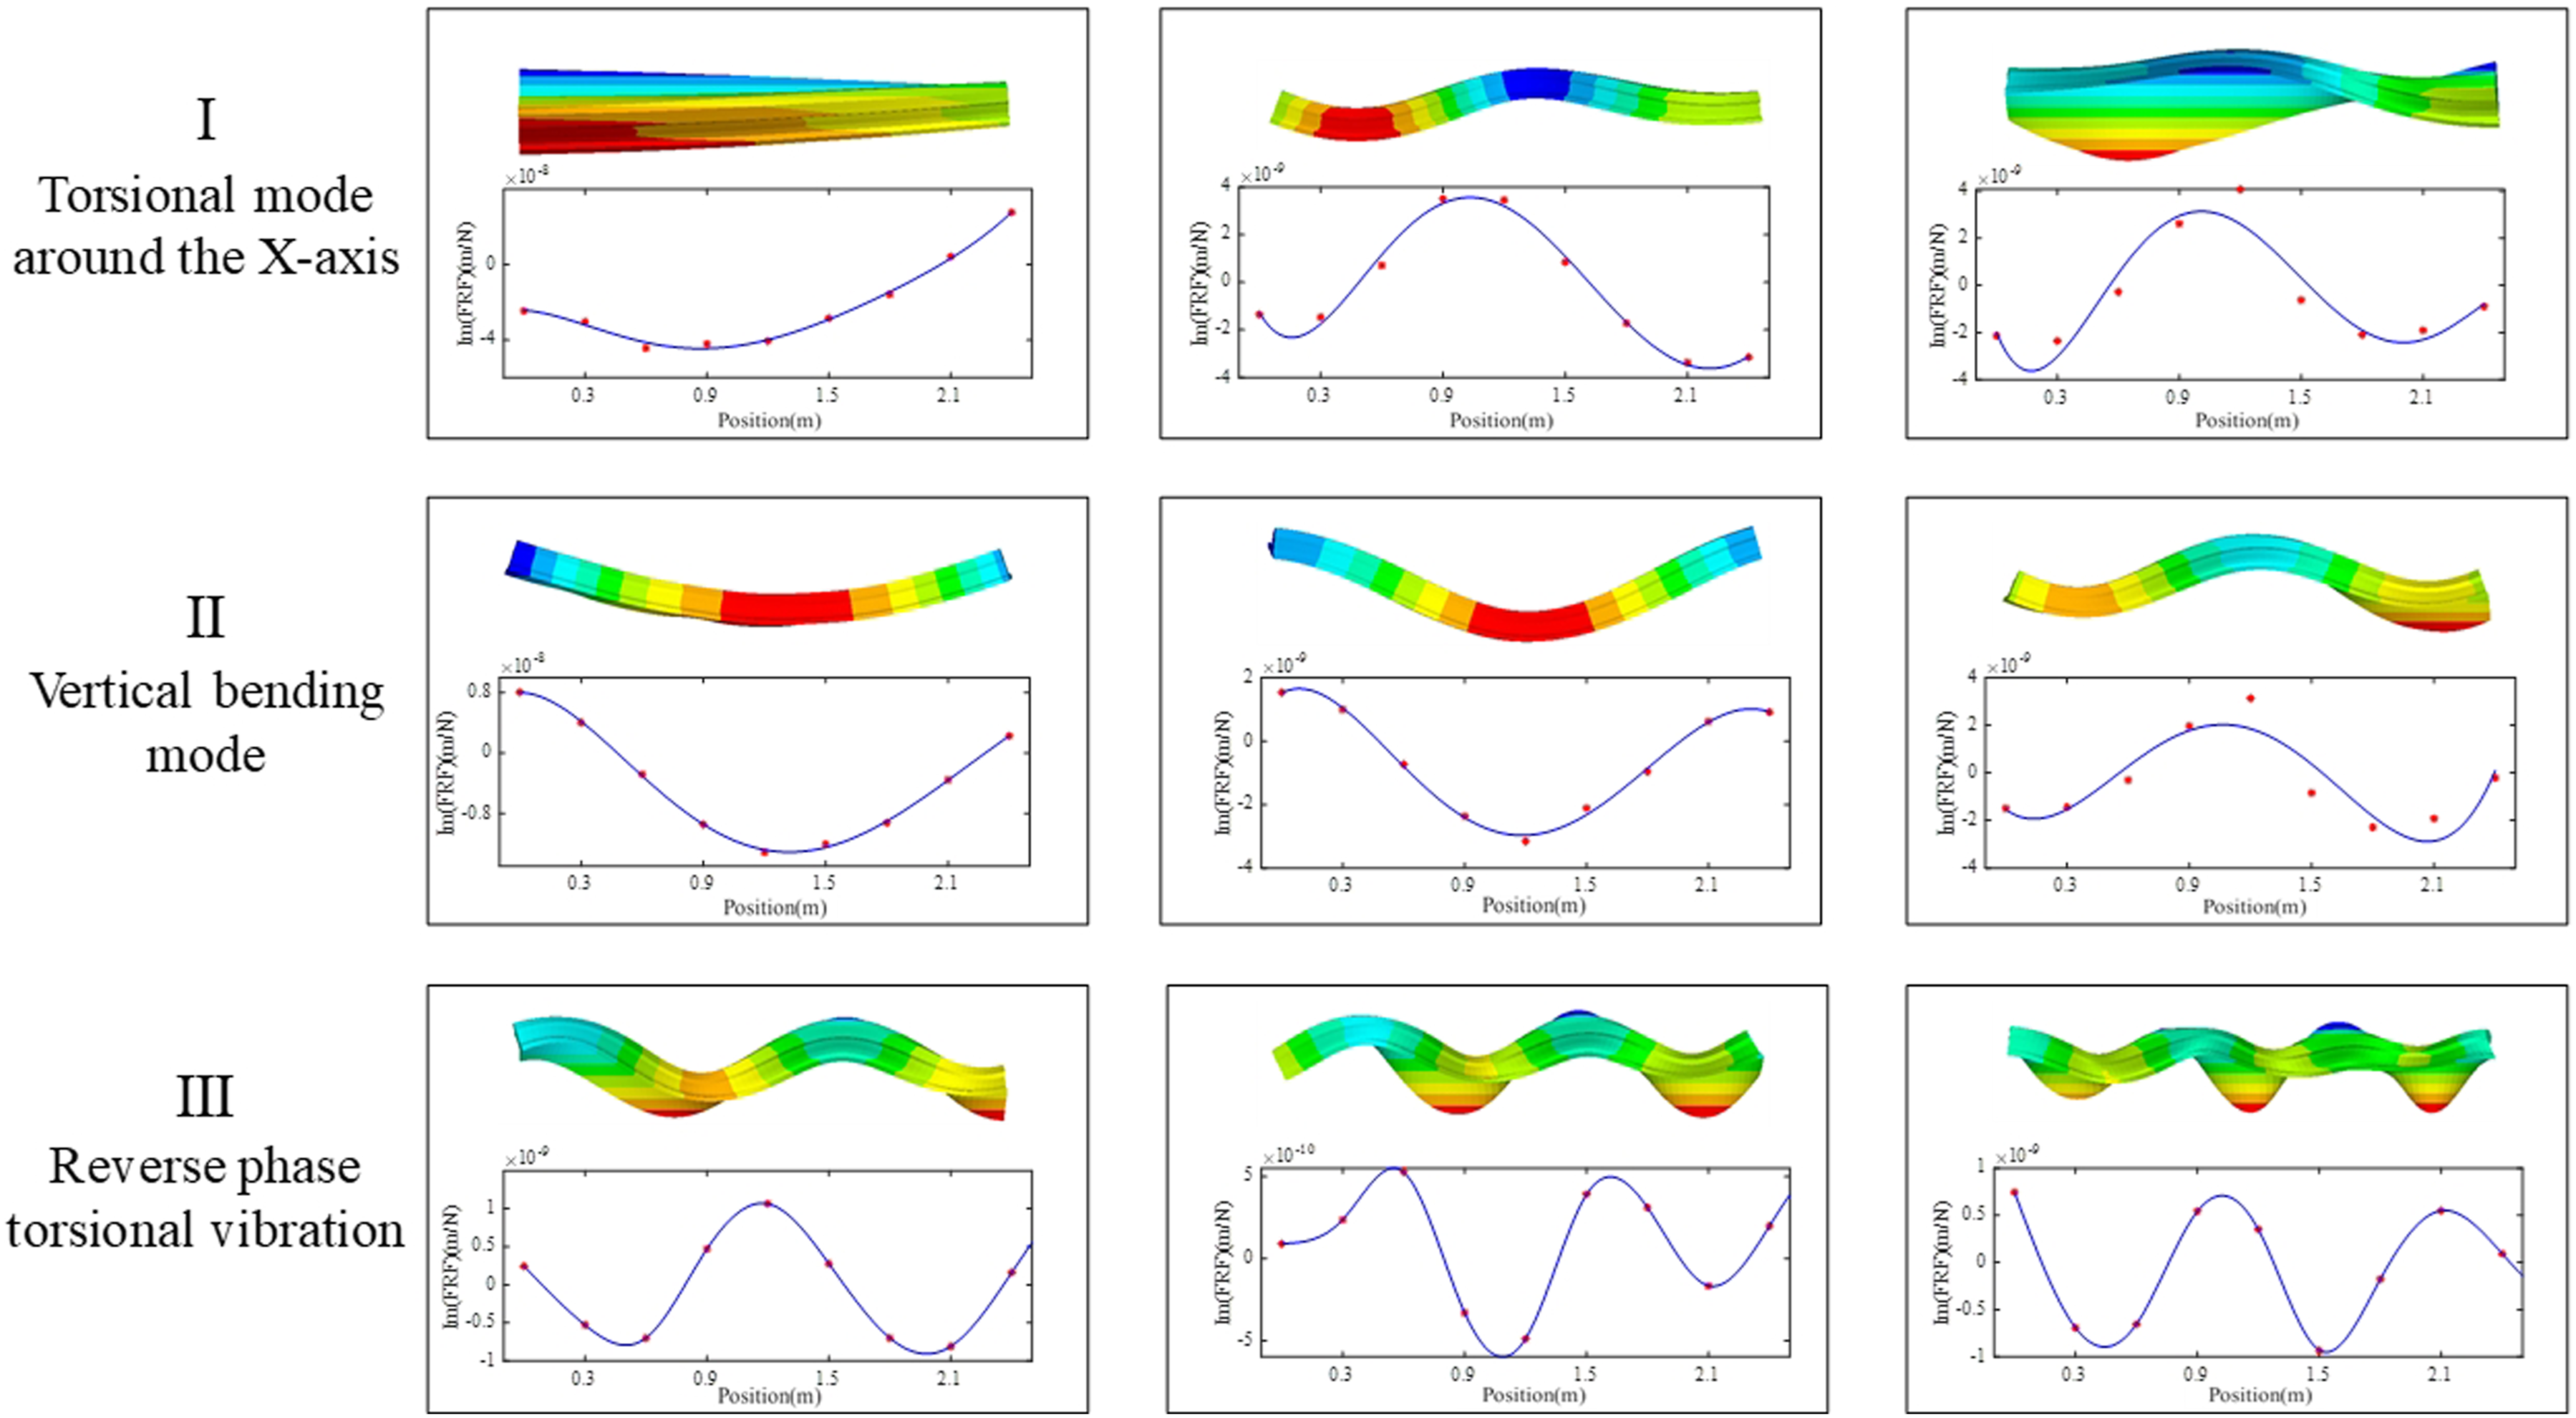
On the other hand, the mode shape at 156 Hz primarily corresponds to the first-order vertical bending deformation of the switch rail. The numerical simulation results align well with the experimental findings, confirming their agreement.
The asymmetry in the mode shapes of the switch rail is mainly attributed to the variable cross-sections of the switch rail along the longitudinal direction. This asymmetric mode shape is widely present in the test frequency range of 70 Hz ∼ 2000 Hz. The asymmetry in the switch rail mode shapes can be attributed to two main factors. First, at non-resonant frequencies, closer to the switch rail point, the cross-sectional bending stiffness is smaller. As a result, the mode shape has a larger amplitude near the switch rail point. Second, at resonant frequencies, the mode shapes of the rail are mainly influenced by the local cross-sections of the rail. When the cross-sectional area is larger and reaches the resonant frequency, positions with smaller cross-sectional areas may not have reached resonance at the same frequency. This results in higher vibration amplitudes near the end of the switch rail for the same frequency.
7. Conclusion
This paper investigates the multi-directional coupling vibration characteristics of switch rails through theoretical simulation, on-site admittance testing, and ODS measurements. The study also examines the influence of asymmetry and variable cross-sections on the vibration behavior of switch rails.
Unlike ordinary rails, switch rails exhibit multi-directional coupling vibrations, rendering their mode types indiscernible through direct observation. By employing modal mass calculation, we propose a method for modal separation in complex structures. Our analysis identifies three main modes influencing the vertical vibration of switch rails: vertical bending mode, torsional mode around the X-axis, and reverse-phase torsional vibration of the rail head and base. The latter induces significant cross-section deformation in switch rails above 600 Hz.
This paper introduces an evaluation index to quantify the asymmetry of cross-sections. We observe that as the position approaches the switch rail point, the degree of asymmetry increases, leading to heightened torsional vibration and increased susceptibility to cross-section deformation. Cross-sectional asymmetry is identified as the primary factor causing the coupling of bending and torsional vibrations in switch rails.
The variable cross-sections of the switch rail lead to asymmetric modal shapes and a gradual change in natural frequencies along its length. Moving from the switch rail point toward its end, the lower-order natural frequencies decrease, while the higher-order natural frequencies increase. This is because, at low frequencies, the mass of the cross-section is dominant, whereas at high frequencies, the stiffness of the cross-section becomes more influential. The relative amplitudes of the modal shapes vary between the front and ends of the switch rail. Additionally, due to the variable cross-sections, the switch rail does not exhibit “pinned–pinned” resonance.
Footnotes
Declaration of conflicting interests
The author(s) declared no potential conflicts of interest with respect to the research, authorship, and/or publication of this article.
Funding
The author(s) disclosed receipt of the following financial support for the research, authorship, and/or publication of this article: The National Key R&D Program of China (2023YFB2604302); The National Natural Science Foundation of China (52122810; 52472458); Technology Research and Development Program of China National Railway Group Co. Ltd. (K2022G034); Sichuan Science and Technology Program (24ZNSFSC0044).