
Abstract
In this paper, a Multi-Channel (MC) Filtered-x Normalized Least Mean Square (FxNLMS) Active Noise Cancellation (ANC) system is developed and applied to the problem of open car windows. The aim is to investigate the ability of the system to reduce airborne noise radiation inside the passenger compartment, while ensuring good ventilation and perfect visibility for car users. The system under investigation consists of two reference microphones placed on the upper edge of the driver’s window, the speakers of the vehicle’s audio system serving as secondary sources and two error microphones placed on the driver’s headrest. A noise source is placed outside the car. Two different versions of the FxNLMS are implemented and compared, namely time domain and frequency domain versions. Simulation results show that satisfactory noise reduction is achieved when a stationary single harmonic signal is considered as the disturbance. The time domain version of the control algorithm is found to be preferable when the car window is open or partially open.
Keywords
Highlights
• A Multi-Channel Active Noise Cancellation system is applied to the problem of open car windows. • A Filtered-x Normalized LMS algorithm is developed in both time domain and frequency domain. • Simulations show that local reduction of stationary noise is achieved.
1. Introduction
In recent decades, environmental noise pollution has gained increasing attention, as it has been shown to have negative effects on the psychological, mental and physical well-being of individuals (World Health Organization General Office for Europe, 2019). Among the sources of environmental noise, traffic is the most critical, both in urban and non-urban areas (European Environment Agency, 2020). This makes the passenger compartment one of the noisiest environments and the automotive industry is showing a growing interest in new strategies to reduce noise.
Passive solutions are suitable for reducing noise at high frequencies, but are less effective at lower frequencies, where they need to be very bulky and invasive to ensure significant performance. This is a relevant problem in automotive applications because a significant contribution to car noise is in the lower frequencies, and because occupied volume, weight, visibility, and ventilation are important issues in this context (Samarasinghe et al., 2016). Active solutions, on the other hand, perform well in the lower frequency range and are far less invasive than passive strategies. For this reason, they are being extensively researched and applied for noise reduction in the passenger compartment environment (Elliott, 2010).
Among the active noise reduction strategies, Active Noise Cancellation (ANC) has proven to be a valid solution for managing different types of noise, such as engine noise (Ferrari et al., 2023; Lee et al., 2018) which can be classified as a tonal disturbance, or tire noise (Cheer and Elliot, 2015; Kim et al., 2023), which is instead a broadband noise. Although applications of global control systems have already been studied (Wang et al., 2023), the most common approach to interior noise reduction in cars is to apply local control. This is because the cancellation is intended to take place at the passengers’ heads, which are supposed to be relatively still. Error microphones are usually placed on the headrests (Elliott, 2010; Ferrari et al., 2023; Jiang et al., 2021; Kim et al., 2023) or on the car ceiling (Lee et al., 2018). In addition, virtual sensing algorithms can be implemented to perform noise minimization at the passengers’ ears (Zhang et al., 2021) and head tracking can be used to improve robustness to head movements (Elliot et al., 2018).
Previous studies on ANC systems in cars have usually assumed the windows to be closed. This configuration results in the disturbance transmission being governed by structure-borne phenomena. However, with the window open, it is reasonable to assume that airborne transmission will have a predominant impact on the overall noise inside the passenger compartment. In order to effectively reduce this type of noise, it might be useful to develop a different ANC system that focuses on this transmission path. At high speed, air vortices and turbulence are the main contributors to noise, which are mainly classified as non-stationary disturbances. However, these phenomena have also been shown to generate some periodic or even tonal noise (Hoarau et al., 2008). Moreover, at low speed, other stationary disturbances come to the fore, such as engine and tire noise. This work focuses on the reduction of these periodic and stationary disturbances.
In the context of active cancellation of noise transmitted through cavities, windows and apertures in general, evidence shows that significant noise reduction is achievable. A distributed configuration of reference microphones and secondary sources over the entire aperture has been shown to be the best option in terms of noise cancellation (Lam et al., 2018b; Murao et al., 2017). However, this configuration has a significant impact on visibility, which is an essential feature for car windows. Other work has shown that control systems using reference microphones and secondary sources placed at the edge of the aperture can achieve significant noise reduction (Kwon and Park, 2013; Lam et al., 2018a, 2018b; Wang et al., 2017).
Feedforward ANC systems are usually preferable to feedback systems when a reference signal coherent with the noise source can be detected (Cheer and Elliot, 2015). The most common control algorithm in ANC is based on the Least Mean Squares (LMS) method (Lu et al., 2021). These algorithms are relatively easy to implement and give good performance in a wide range of situations. In this article, the Filtered-x Normalized Least Mean Squares (FxNLMS) variant is chosen. The filtering process of the reference signals with the secondary paths is added to the LMS implementation to cope with the time delay between error and reference signals (Kuo and Morgan, 1999). Moreover, the convergence coefficient is normalized with the energy of the error signals, ensuring robustness to a wider range of disturbance dynamics (Shi et al., 2016). In addition to the usual implementation of FxNLMS, where signals are processed by the controller in the time domain, Elliot (2001) proposed a different version of the algorithm where the signals are processed in the frequency domain, saving computational resources.
In this context, the aim of the present work is to simulate and assess the performance of an ANC system local noise reduction at the driver’s head position that controls the disturbance entering the passenger compartment through the driver’s open window. This paper serves as the first step in the development of an ANC system, where the selected control algorithm is validated for the target application through numerical simulations. The control system consists of the loudspeakers of the car audio system as secondary sources, a pair of reference microphones placed on the upper edge of the driver’s window and two error microphones placed on the driver’s headrest. These elements form a multi-channel (MC) control system in which the FxNLMS control logic is applied. Both time and frequency domain versions of the algorithm are implemented and their performance is compared. This paper investigates the potential of a control system that, for the first time, exploits the concepts of the aforementioned works on ANC applied to windows for reducing airborne noise transmission through car windows, leading to a new solution that meets the requirements of the automotive industry in terms of noise comfort and ventilation.
Section 2 of the manuscript describes the methods adopted and is divided into four parts. First, the chosen control algorithm is presented in its two versions. Then, the developed numerical model and the experimental measurements on a real car for tuning the model parameters are presented. Furthermore, the architecture of the control system is presented and finally, the identification process of the system plants and the implementation of the control logic on the identified numerical model are shown. In Section 3, the simulation campaign is described and the performances of the two versions of the control algorithm are evaluated, discussed and compared. Finally, conclusions are drawn.
2. Materials, models, and methods
2.1. The control algorithm
Multi-channel (MC) systems are widely used in ANC applications where multiple sensors and actuators are employed. There are several versions of the MC control logic, which differ in the way the control signals are processed to produce the output of the secondary sources (Murao et al., 2017). The choice of the most suitable one is mainly determined by the system layout. In cases where there is a strong spatial correlation between the reference microphones and the secondary sources, a decentralized MC logic is usually preferable. In this particular version, each secondary signal is evaluated only by means of the corresponding reference signal (Shi et al., 2016). Otherwise, if many error signals are present, it may be useful to use an algorithm that reduces their number in the control block, such as the mixed-error MC (Murao et al., 2017) and the minimax MC (Shi and Kajikawa, 2018). The three control logic versions mentioned above are useful to reduce the computational complexity of the control algorithm, but they may downgrade the control performance. The ANC system architecture of this work does not meet the aforementioned characteristics, and therefore a complete MC is proposed, which is computationally more complex but also more robust to different system layouts (Ferrer et al., 2023).
The update rule for a generic complete MC FxNLMS is obtained in both its time and frequency domain versions. Consider a generic system consisting of I reference microphones, J secondary sources and K error microphones. This is represented in the block diagram of Figure 1, where for each red box the number of signals passing from the corresponding point of the diagram is given as a function of I, J, and K. The signal at the k-th error microphone location is expressed by: Block diagram of a generic complete MC system.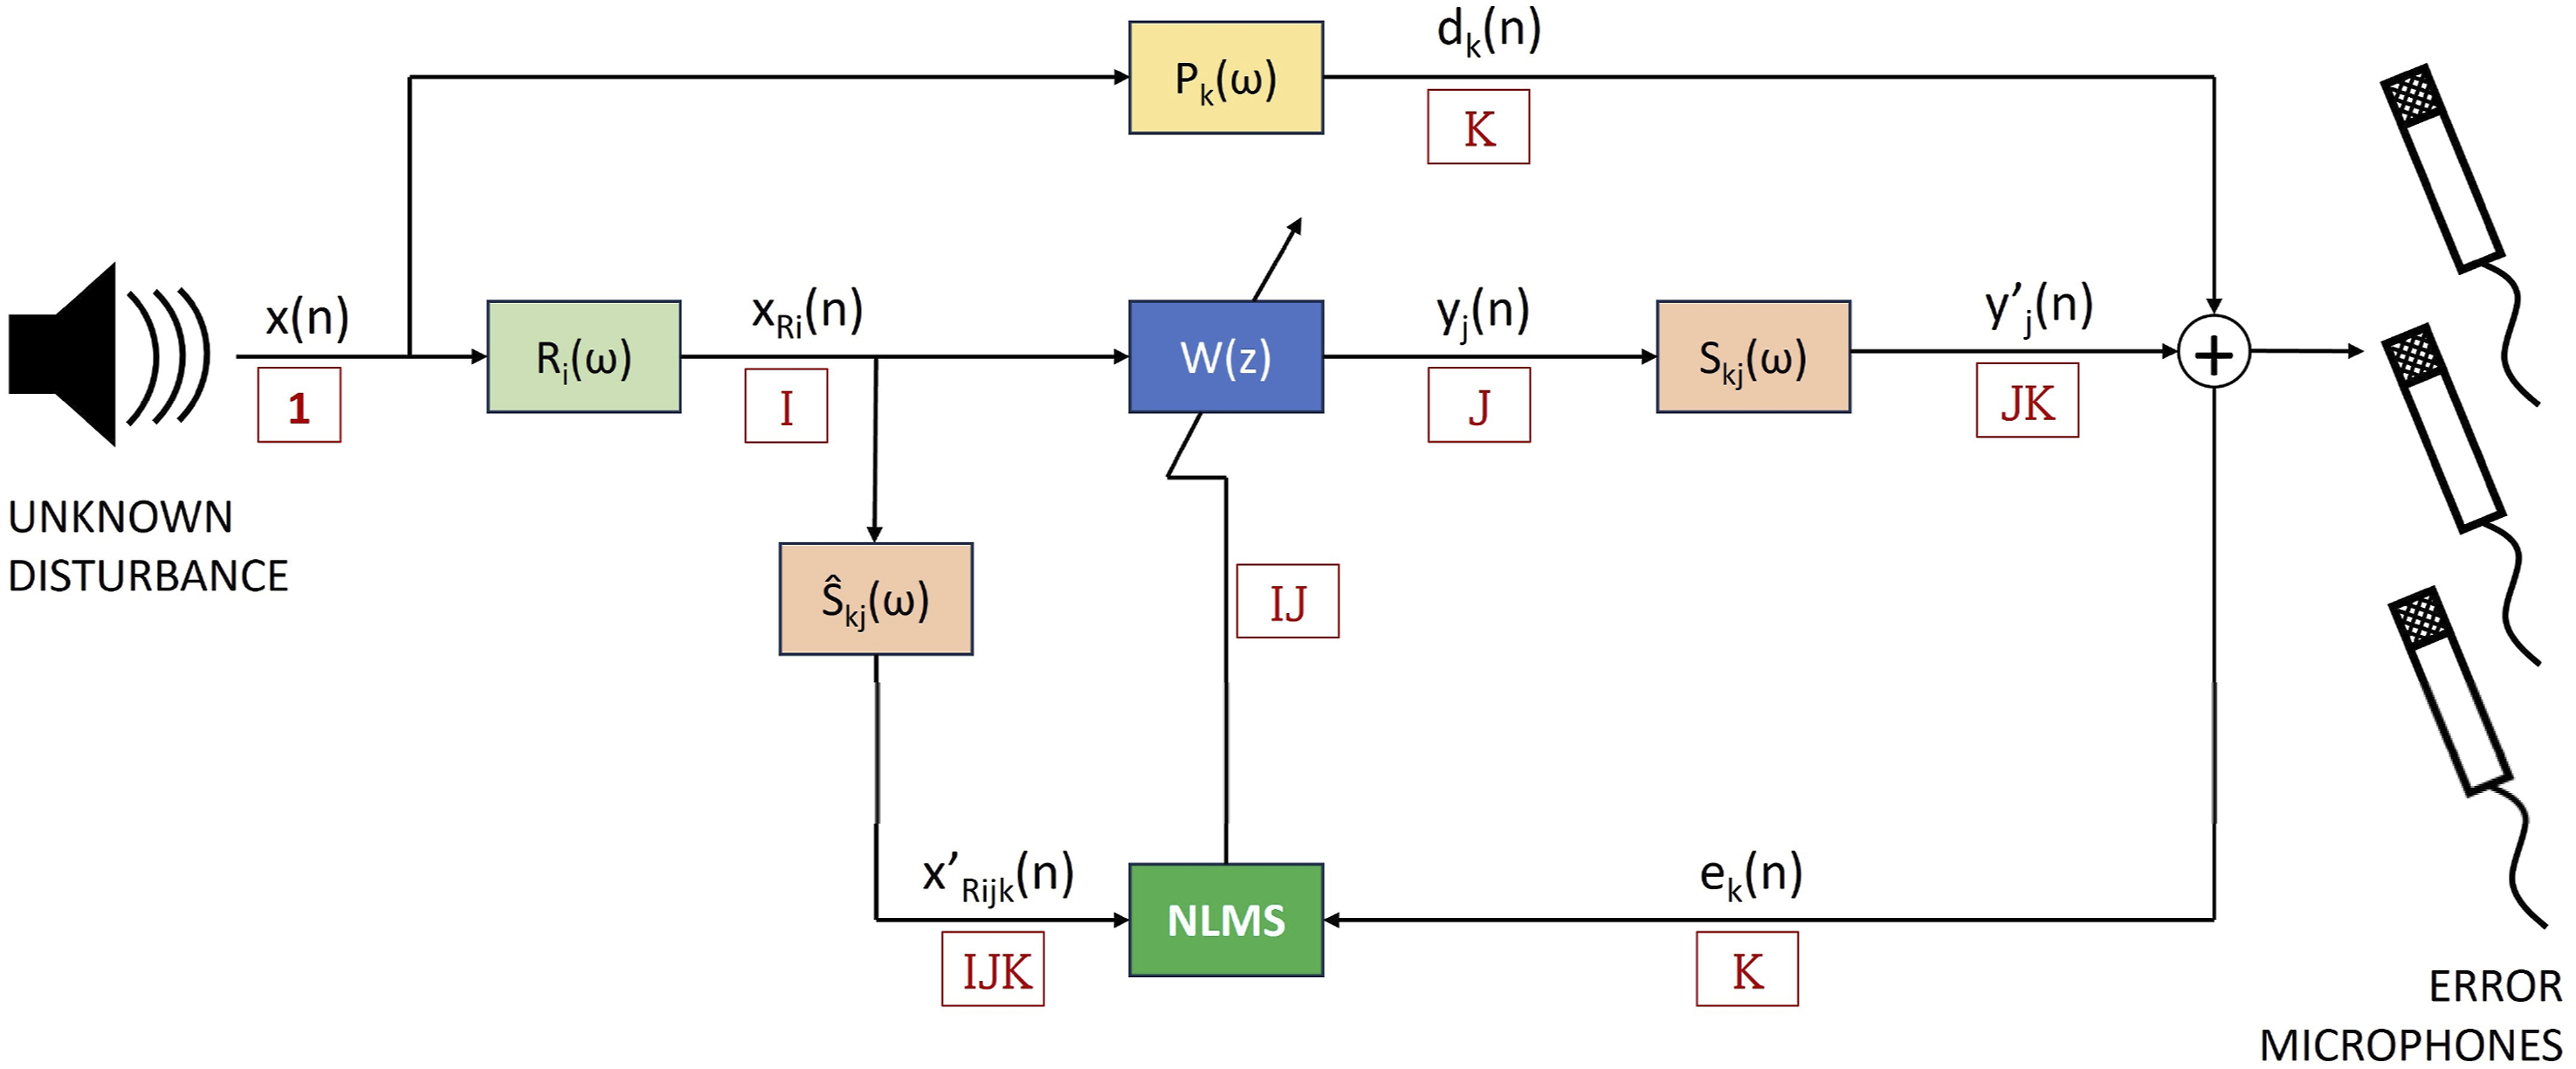
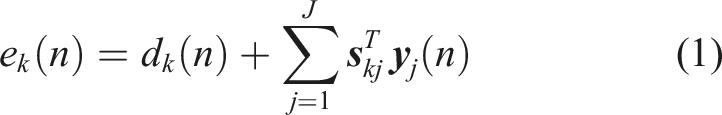
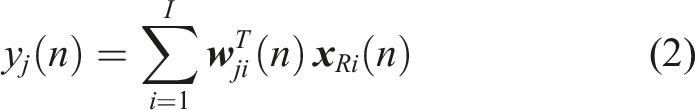
The secondary source signal at each time step n must be evaluated by the adaptive algorithm, which in the case of the complete MC system is composed of I adaptive FIR filters for each secondary source. The signal
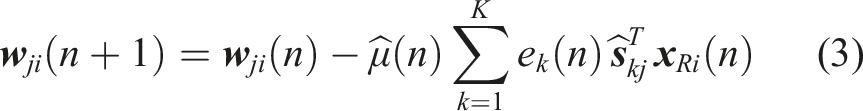
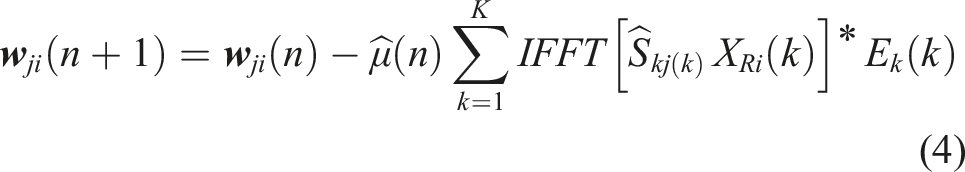
For the computation of the normalized convergence coefficient
2.2. The passenger compartment numerical model
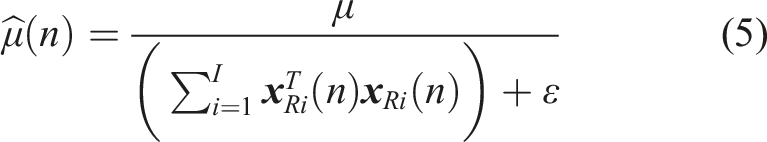
As mentioned above, the aim of the present work is to study the performance of an ANC system on vehicle interior noise. The modeling stage is not limited to a specific car, but aims to be as generic as possible. The challenge is to create a simple model that embodies the main acoustic and vibro-acoustic characteristics of automotive vehicle compartment. The developed geometry of the model is shown in Figure 2. The compartment has been reduced to an irregular and simplified shape. This type of geometry is quite common in car interior acoustic studies (Linga et al., 2019). The most important aspect to note is that each face of the compartment is not parallel to the others. This ensures that, as in the real case, there is no strong modal acoustic field in the car interior. (a) Geometry of the car compartment numerical model. (b) Detailed view of the driver’s window.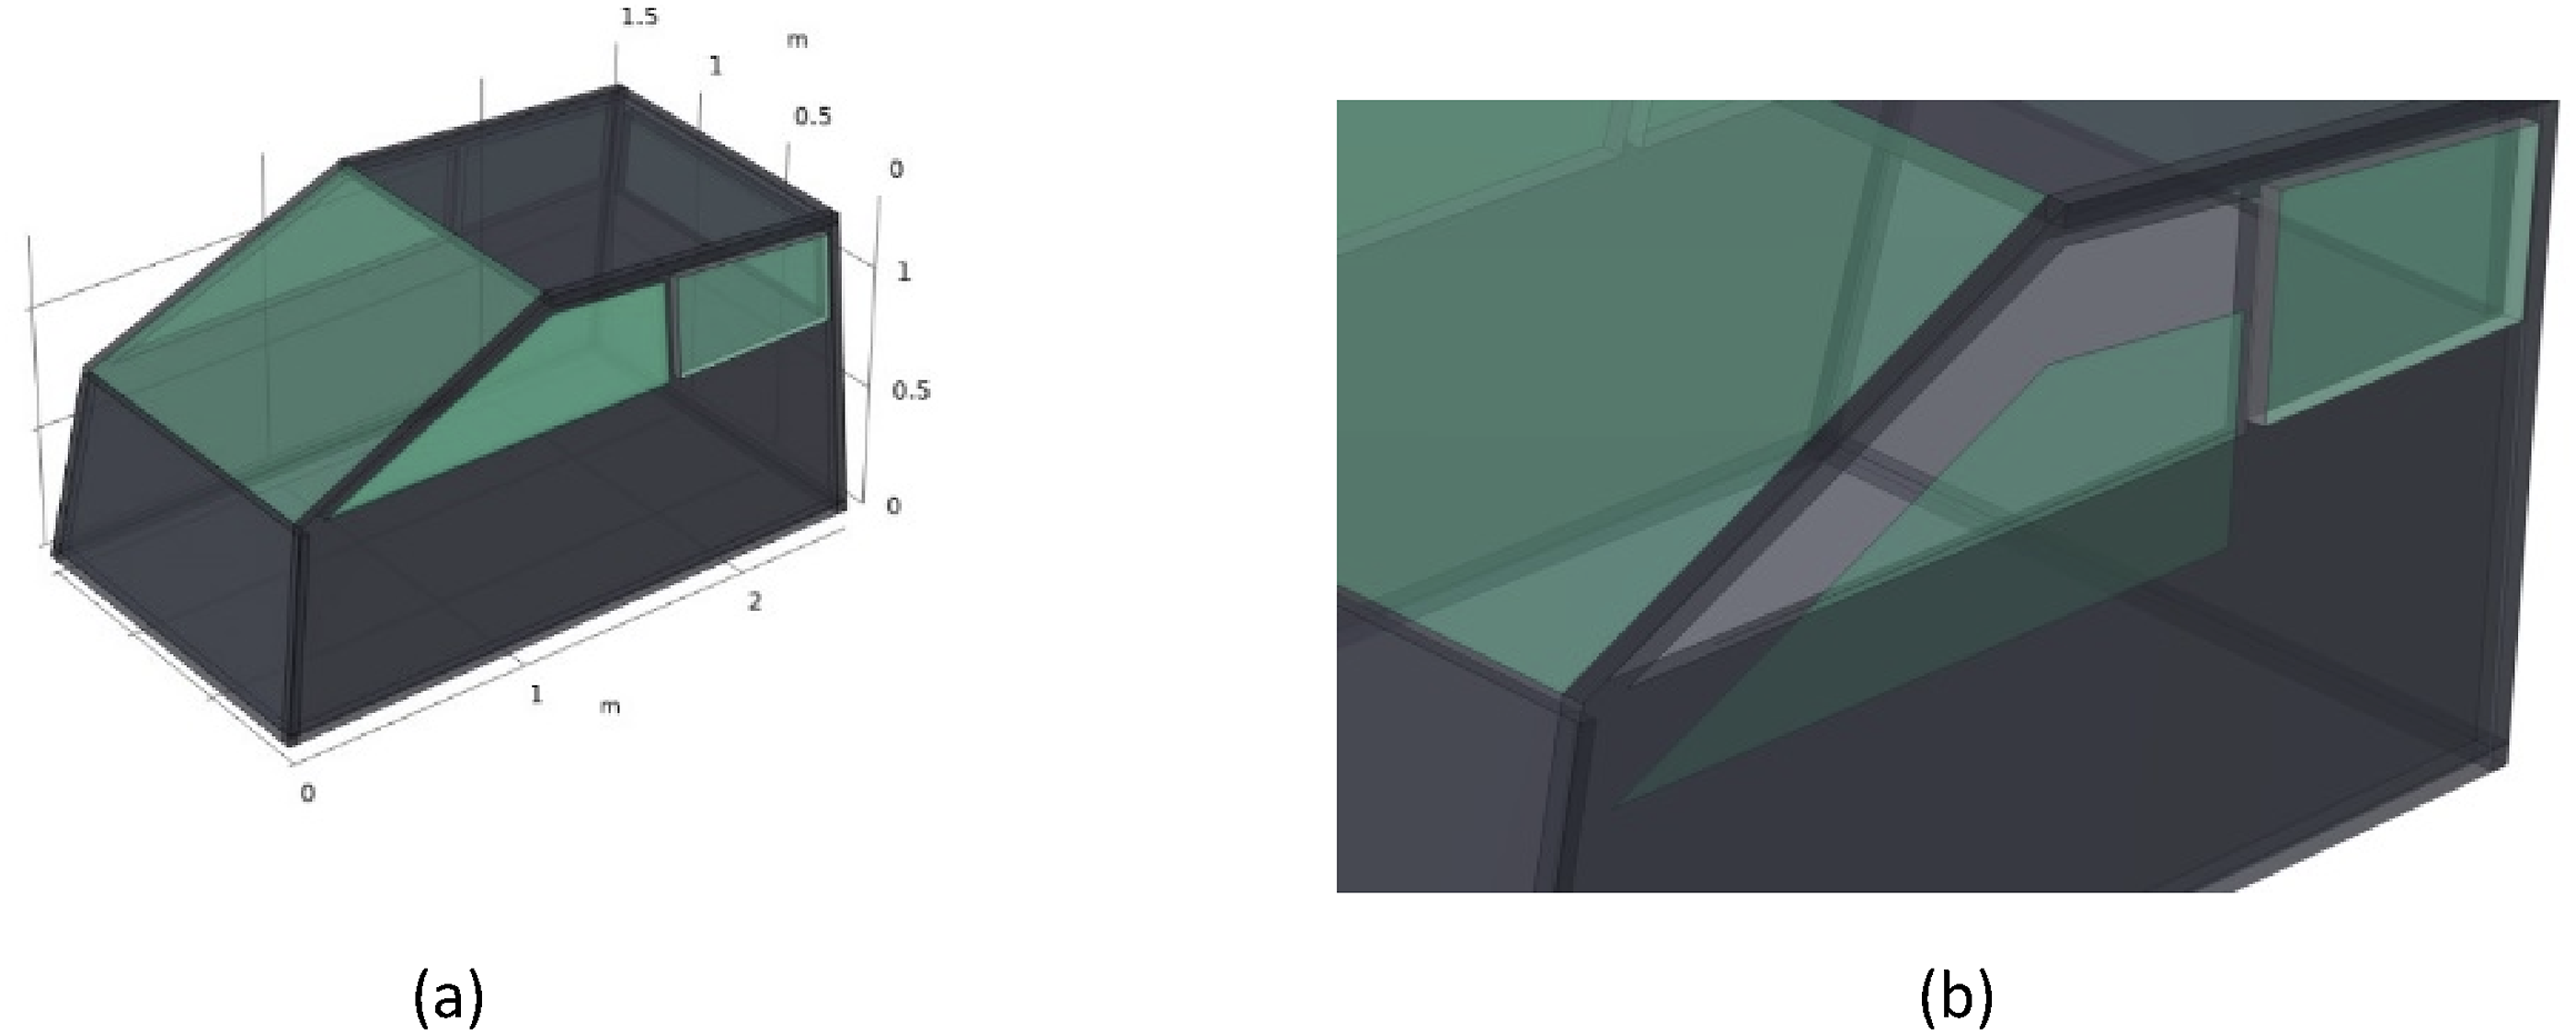
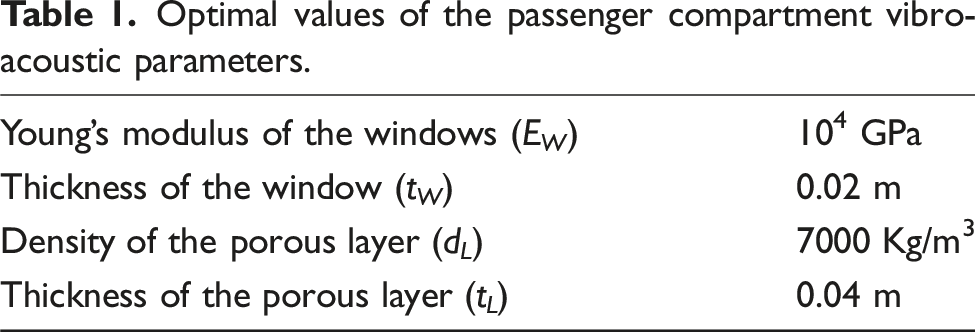
Particular attention is given to modeling the acoustic Transmission Loss (TL) from the outside to the inside of the compartment. The windows are modeled as flexible shells whose main properties affecting the TL are the thickness (
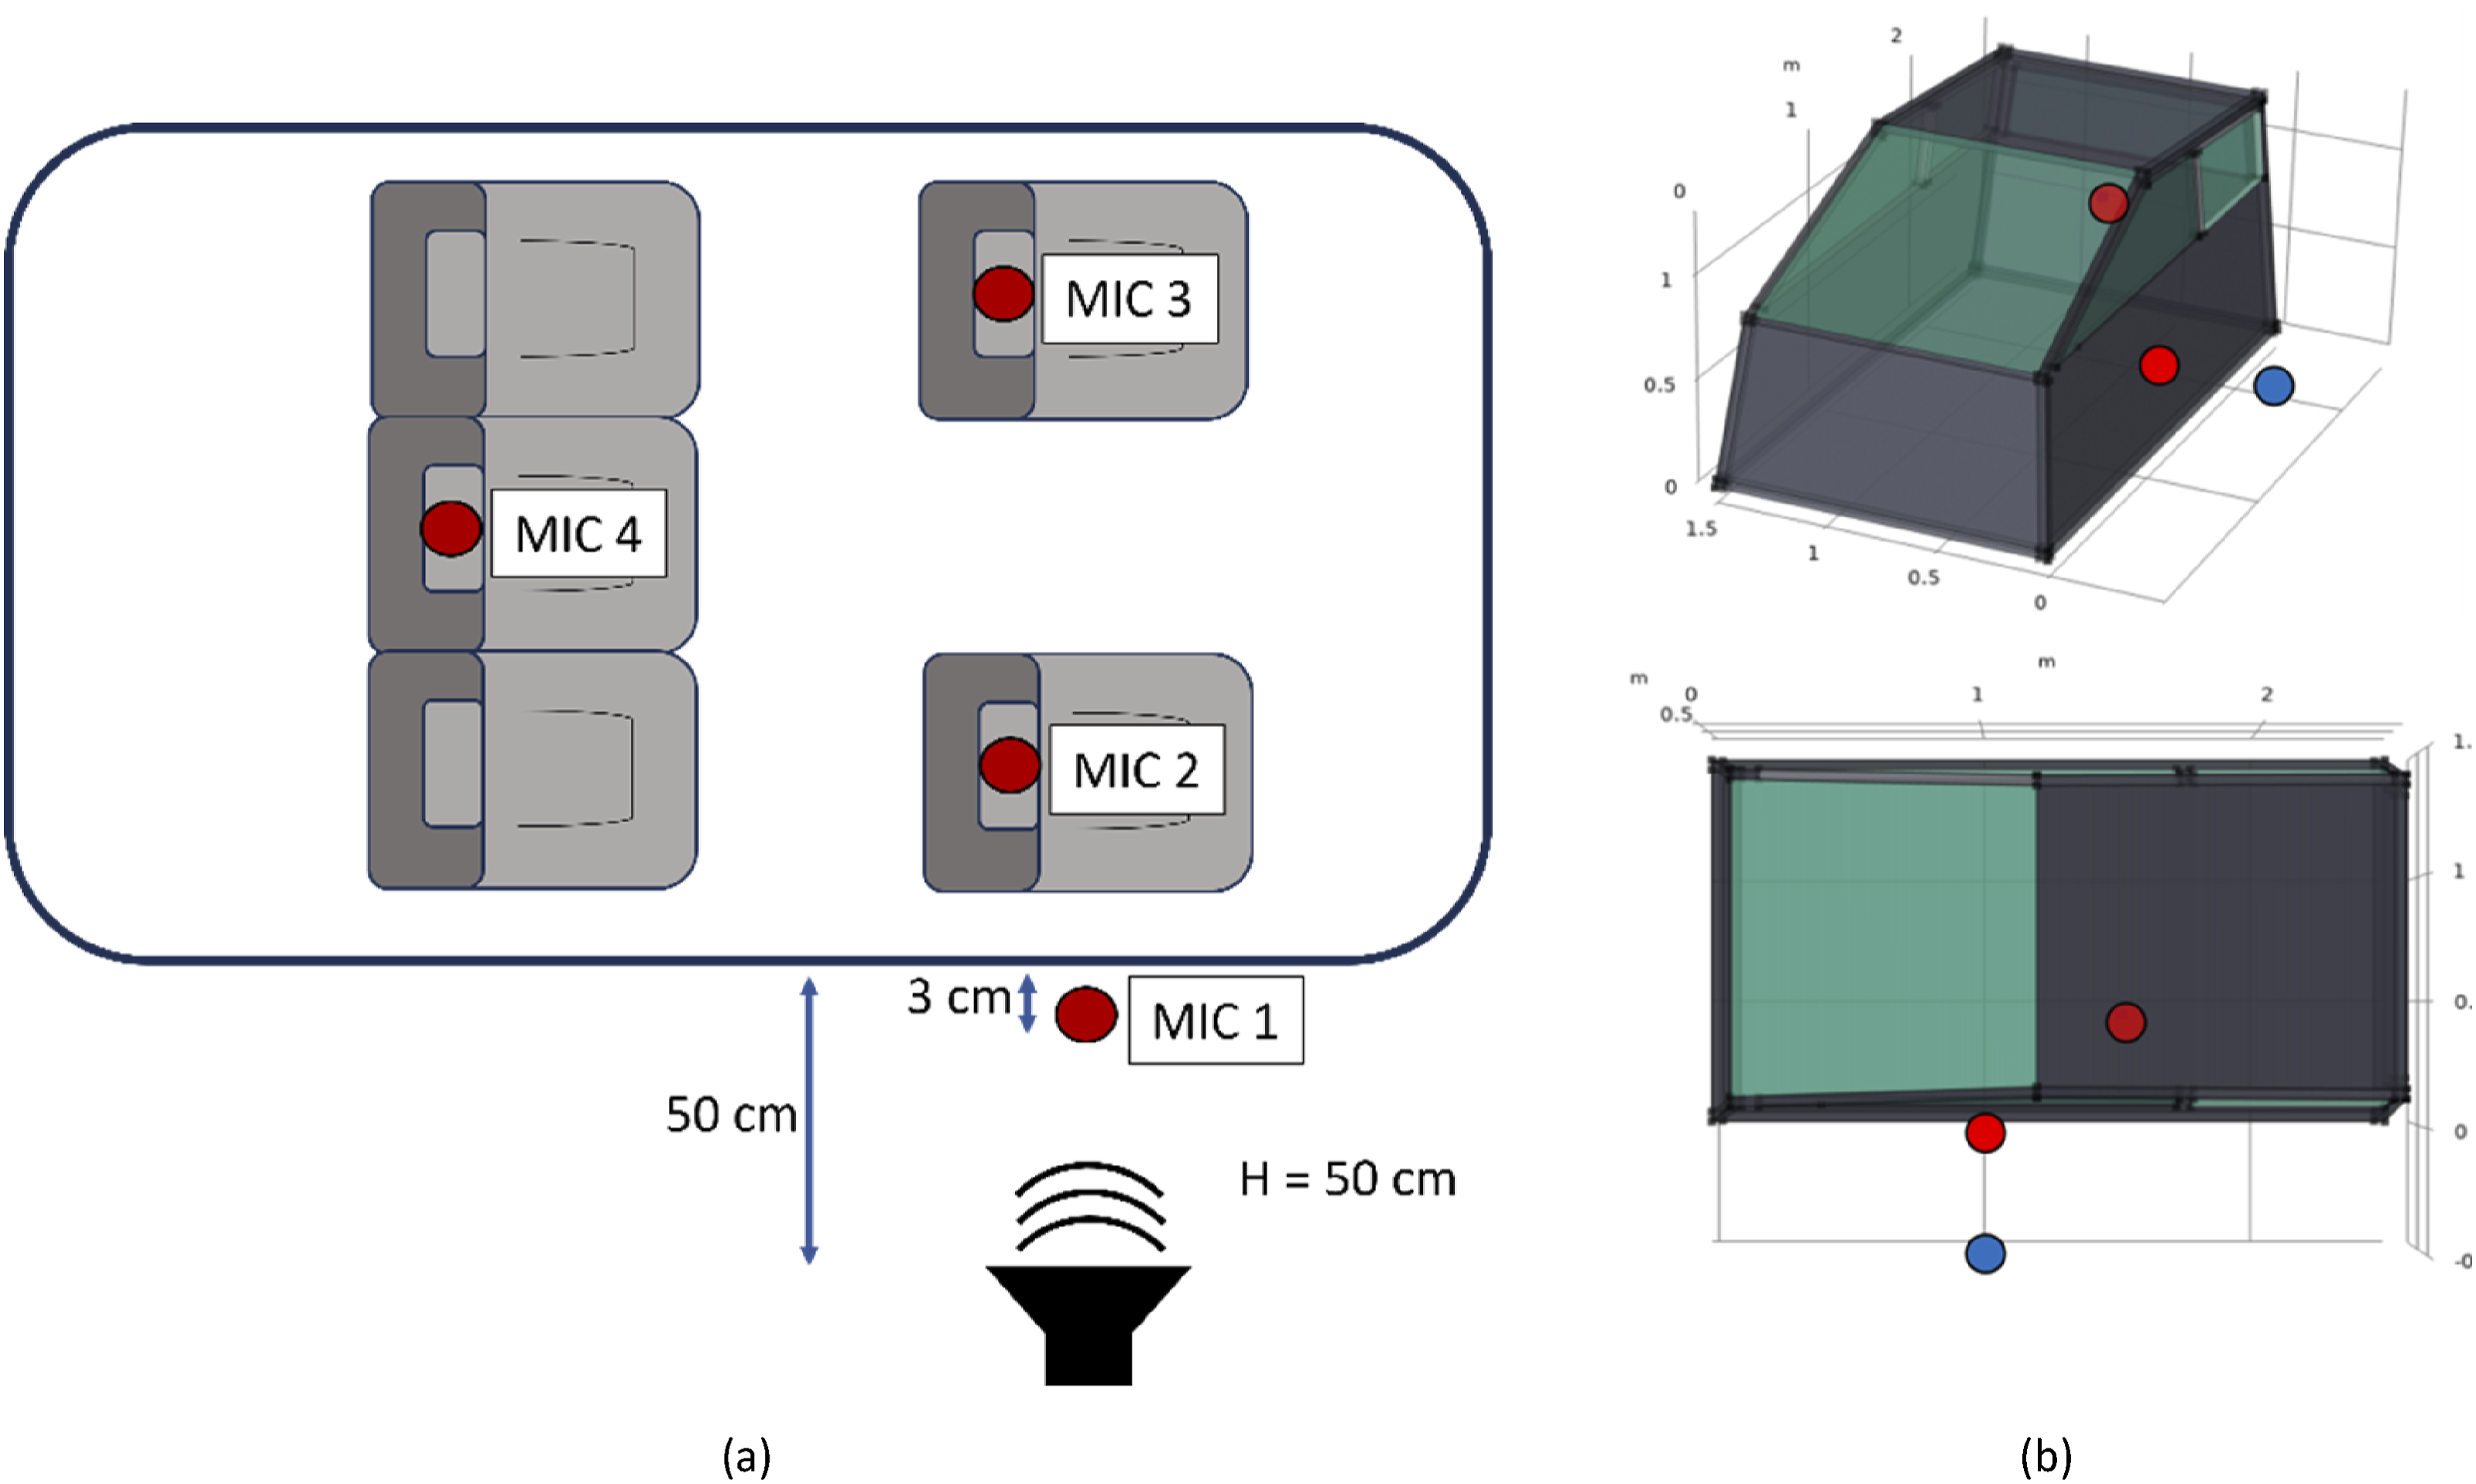
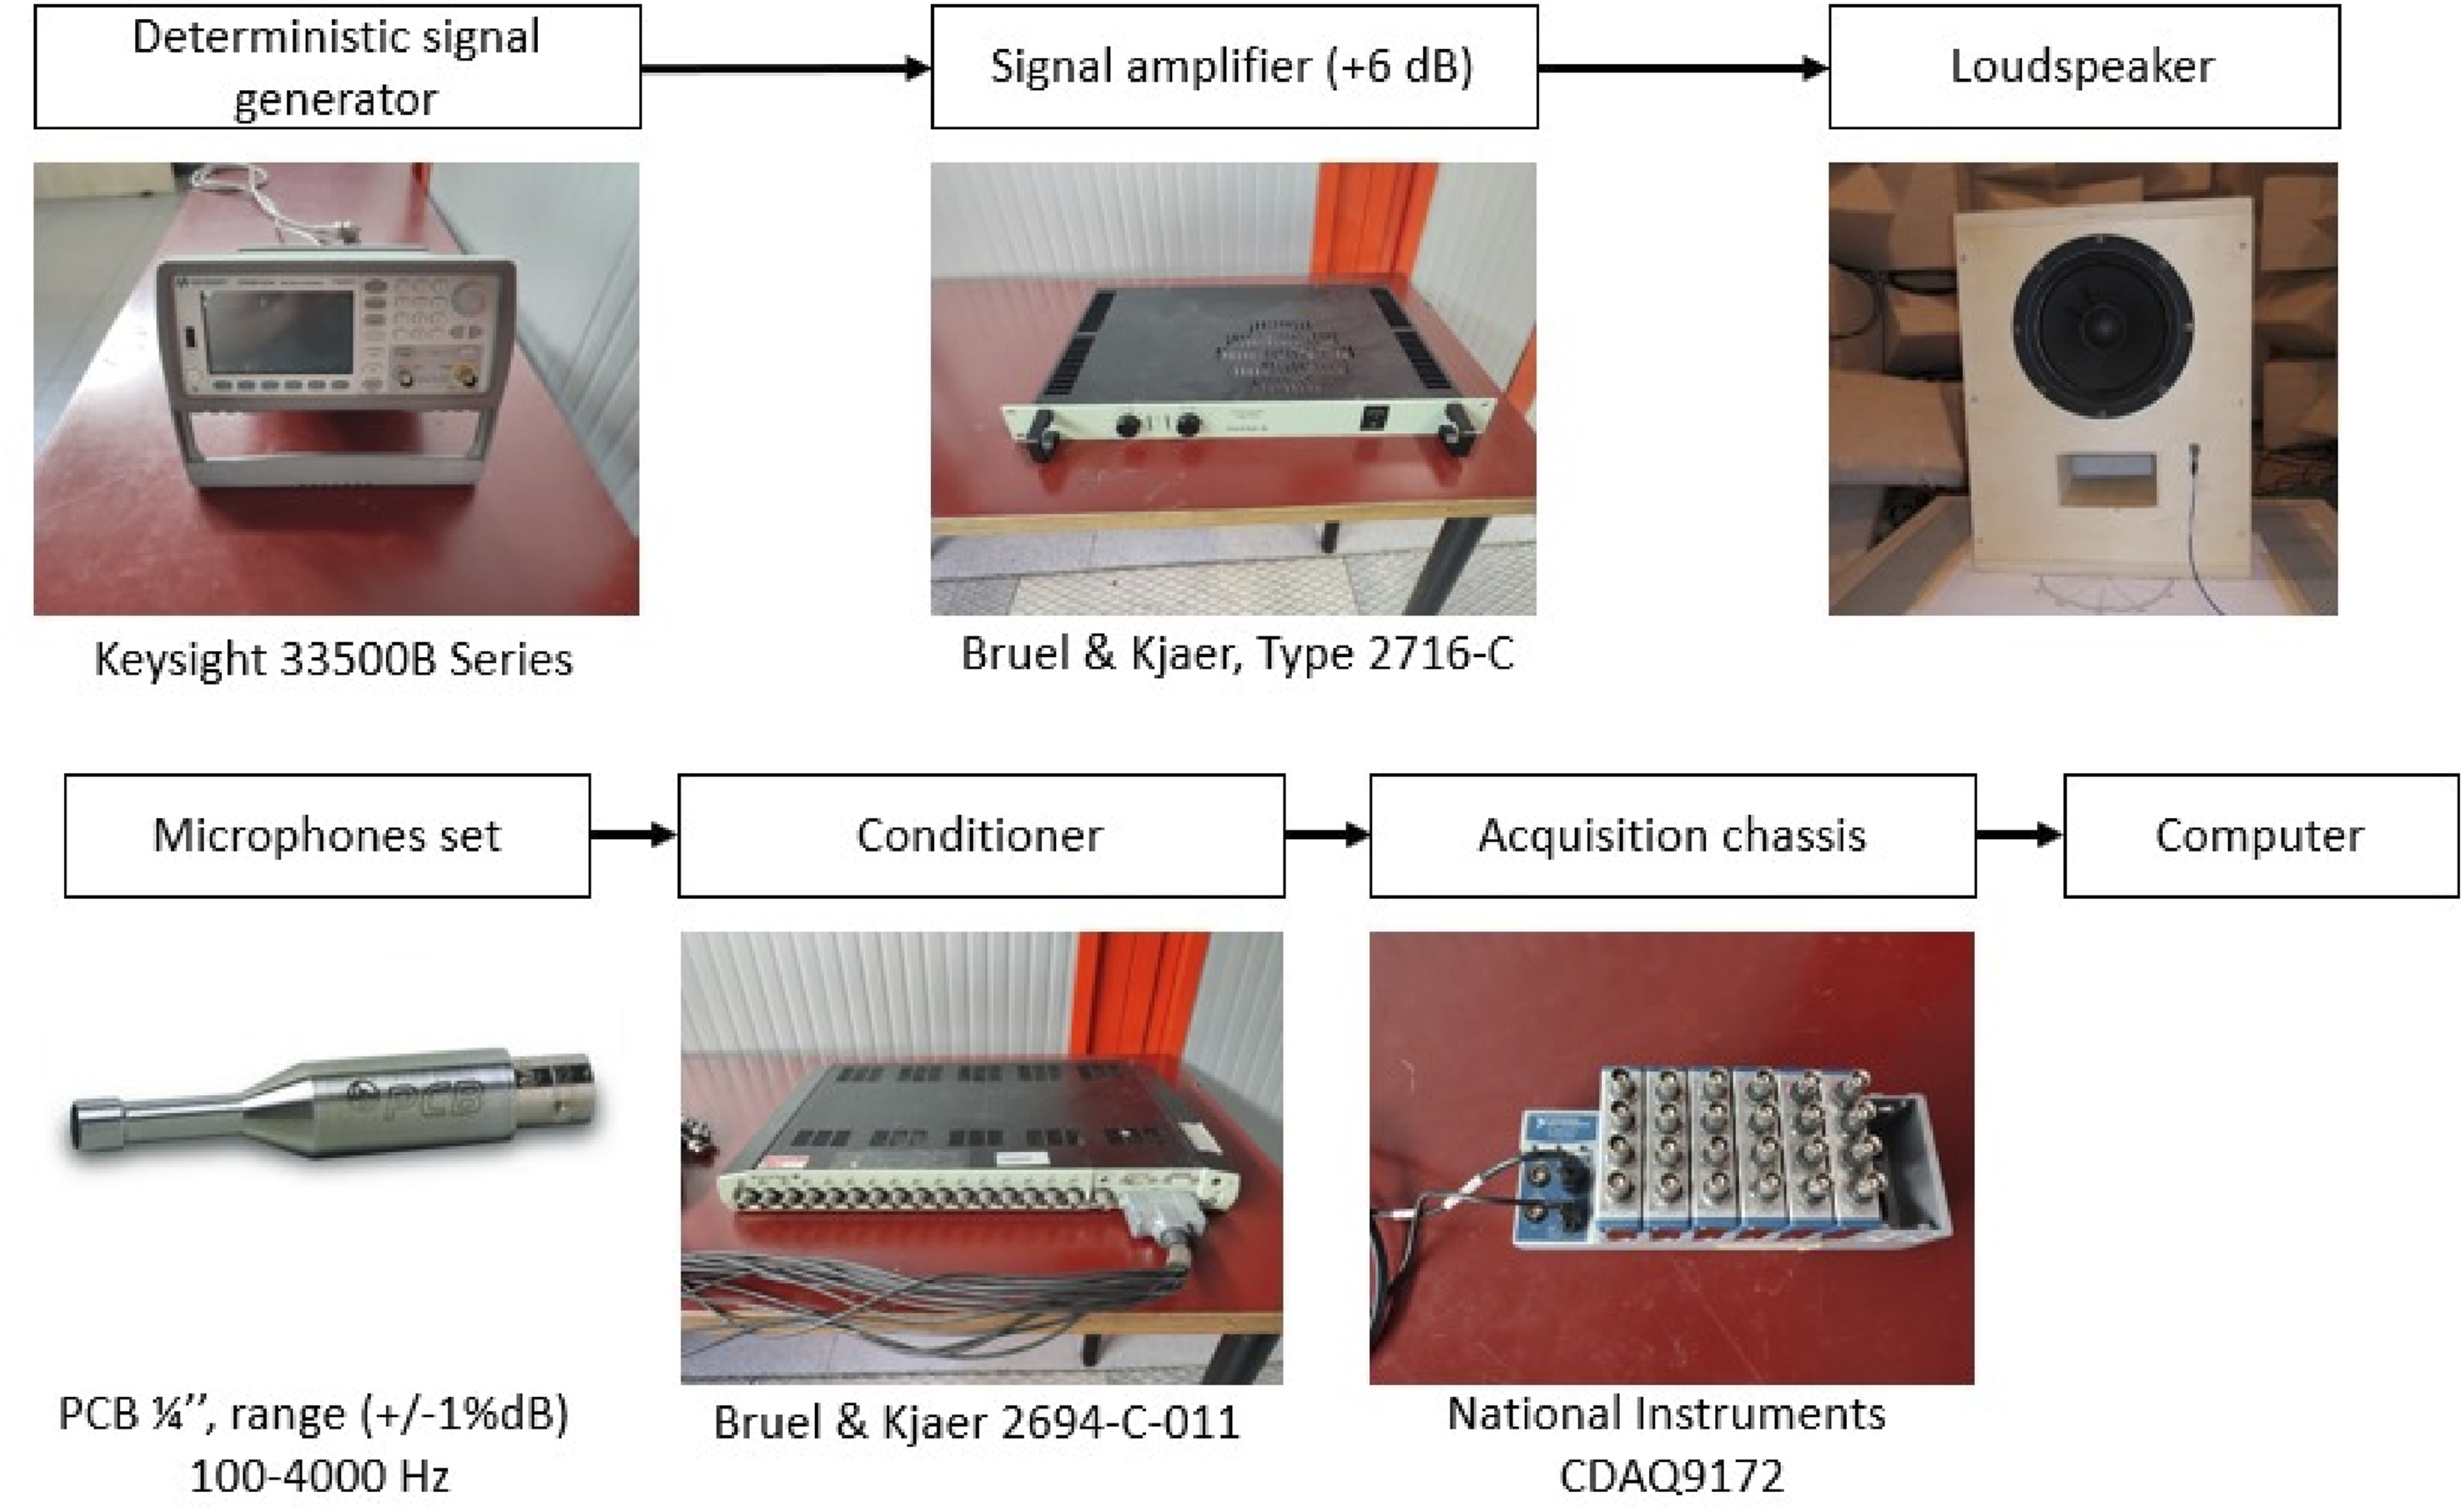
An experimental identification of TL properties was carried out on a real car in order to correctly tune the aforementioned vibro-acoustic parameters of the numerical model. The experimental setup is shown schematically in Figure 3(a). The source is a loudspeaker positioned outside the car in front of the driver’s door, driven by a random noise signal with a bandwidth of 40 Hz−2.5 kHz. In front of the loudspeaker, MIC1 captures the outside sound pressure, while MIC2, MIC3, and MIC4 are placed on three of the headrests. A detailed description of the control and acquisition chain is shown in Figure 4. The main components are: • Deterministic signal generator: Keysight 33500B Series • Power amplifier (+6 dB): Bruel & Kjaer, Type 2716-C • Loudspeaker: Faital Pro 8FE200, 8” - 130 W - 95 dB - 8 Ω • Microphones set: PBC 1/4”, range (+/−1%dB) 100–400 Hz • Signal conditioner: Bruel & Kjear 2694-C-011 • Acquisition chassis: National Instruments CDAQ9172 (a) Schematic representation of the experimental TL identification setup. (b) Correspondent setup implemented on the numerical model. Control chain at the top and acquisition chain at the bottom.
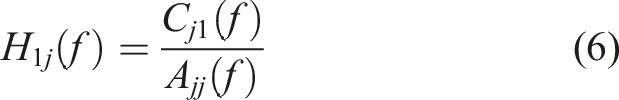
In its formal definition, TL is given by the ratio between the incident and transmitted acoustic power through a partition. In this case, however, a different metric is chosen, defined as the attenuation of the sound pressure amplitude between two specific points located on opposite sides of the partition. The ratio between the measured pressure spectra is calculated using the (a) Comparison between the experimental TL (in blue) and the tuned TL of the numerical model (in red). (b) Total sound pressure level (SPL) viewed from above the car compartment at a height of 1 m when the frequency of the source is 500 Hz.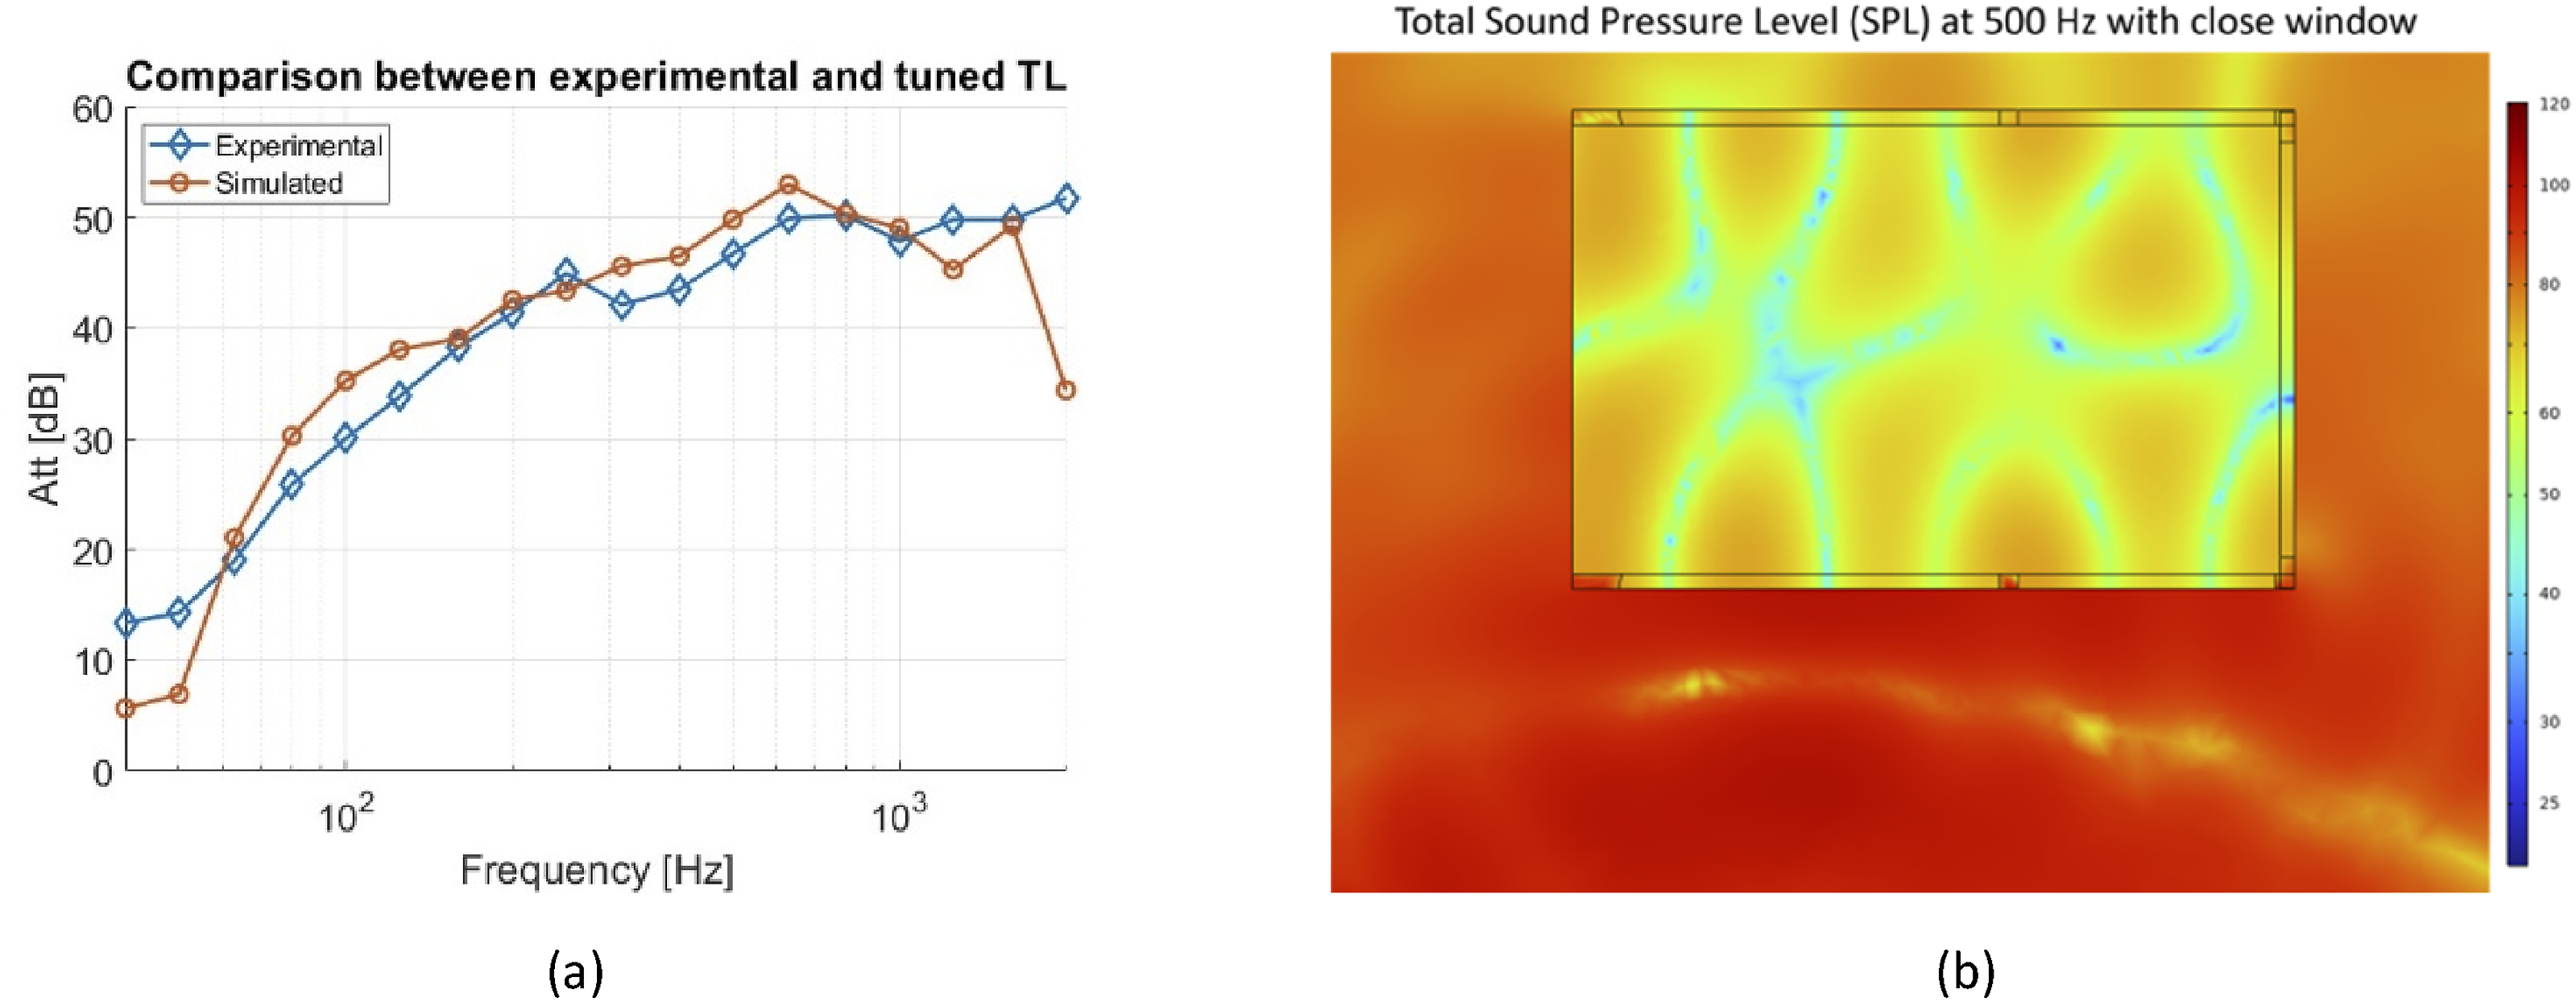

Optimal values of the passenger compartment vibro-acoustic parameters.
2.3. Control system architecture
The system presented in the previous section was integrated into the control layout. The final system architecture is shown in Figure 6. A description of each component follows: • Secondary sources (blue): The idea is to take advantage of the car’s audio system. In fact, it might not be practical to install a different set of loudspeakers dedicated exclusively to ANC. Therefore, in the numerical model, six secondary sources were placed corresponding to the locations of the loudspeakers of the audio system. • Error microphones (red): The main concern when positioning error microphones is that they should be as close as possible to the locations where cancellation is desired. In this case, cancellation should take place at the driver’s ears (headrest). • Reference microphones (in yellow): As mentioned above, the best choice for reference microphones in this application is to place them on the car window. More specifically, they are placed on the upper edge of the driver’s window, inside the passenger compartment. • Primary sources (green): Control performance was analyzed for two different noise source positions. Source S1 is placed at the same location as the loudspeaker used for the experimental identification (see Section 2.2), while source S2 is placed in front of the driver’s window, at a height of 1 m and at a distance of 0.5 m from the window. • Measurement microphones (orange): These microphones are added to the numerical model to evaluate the control performance in terms of attenuation from the outside to the inside of the passenger compartment. Control system layout: secondary sources in blue, primary source in green, reference microphones in yellow, error microphones in red, measurement microphones in orange.
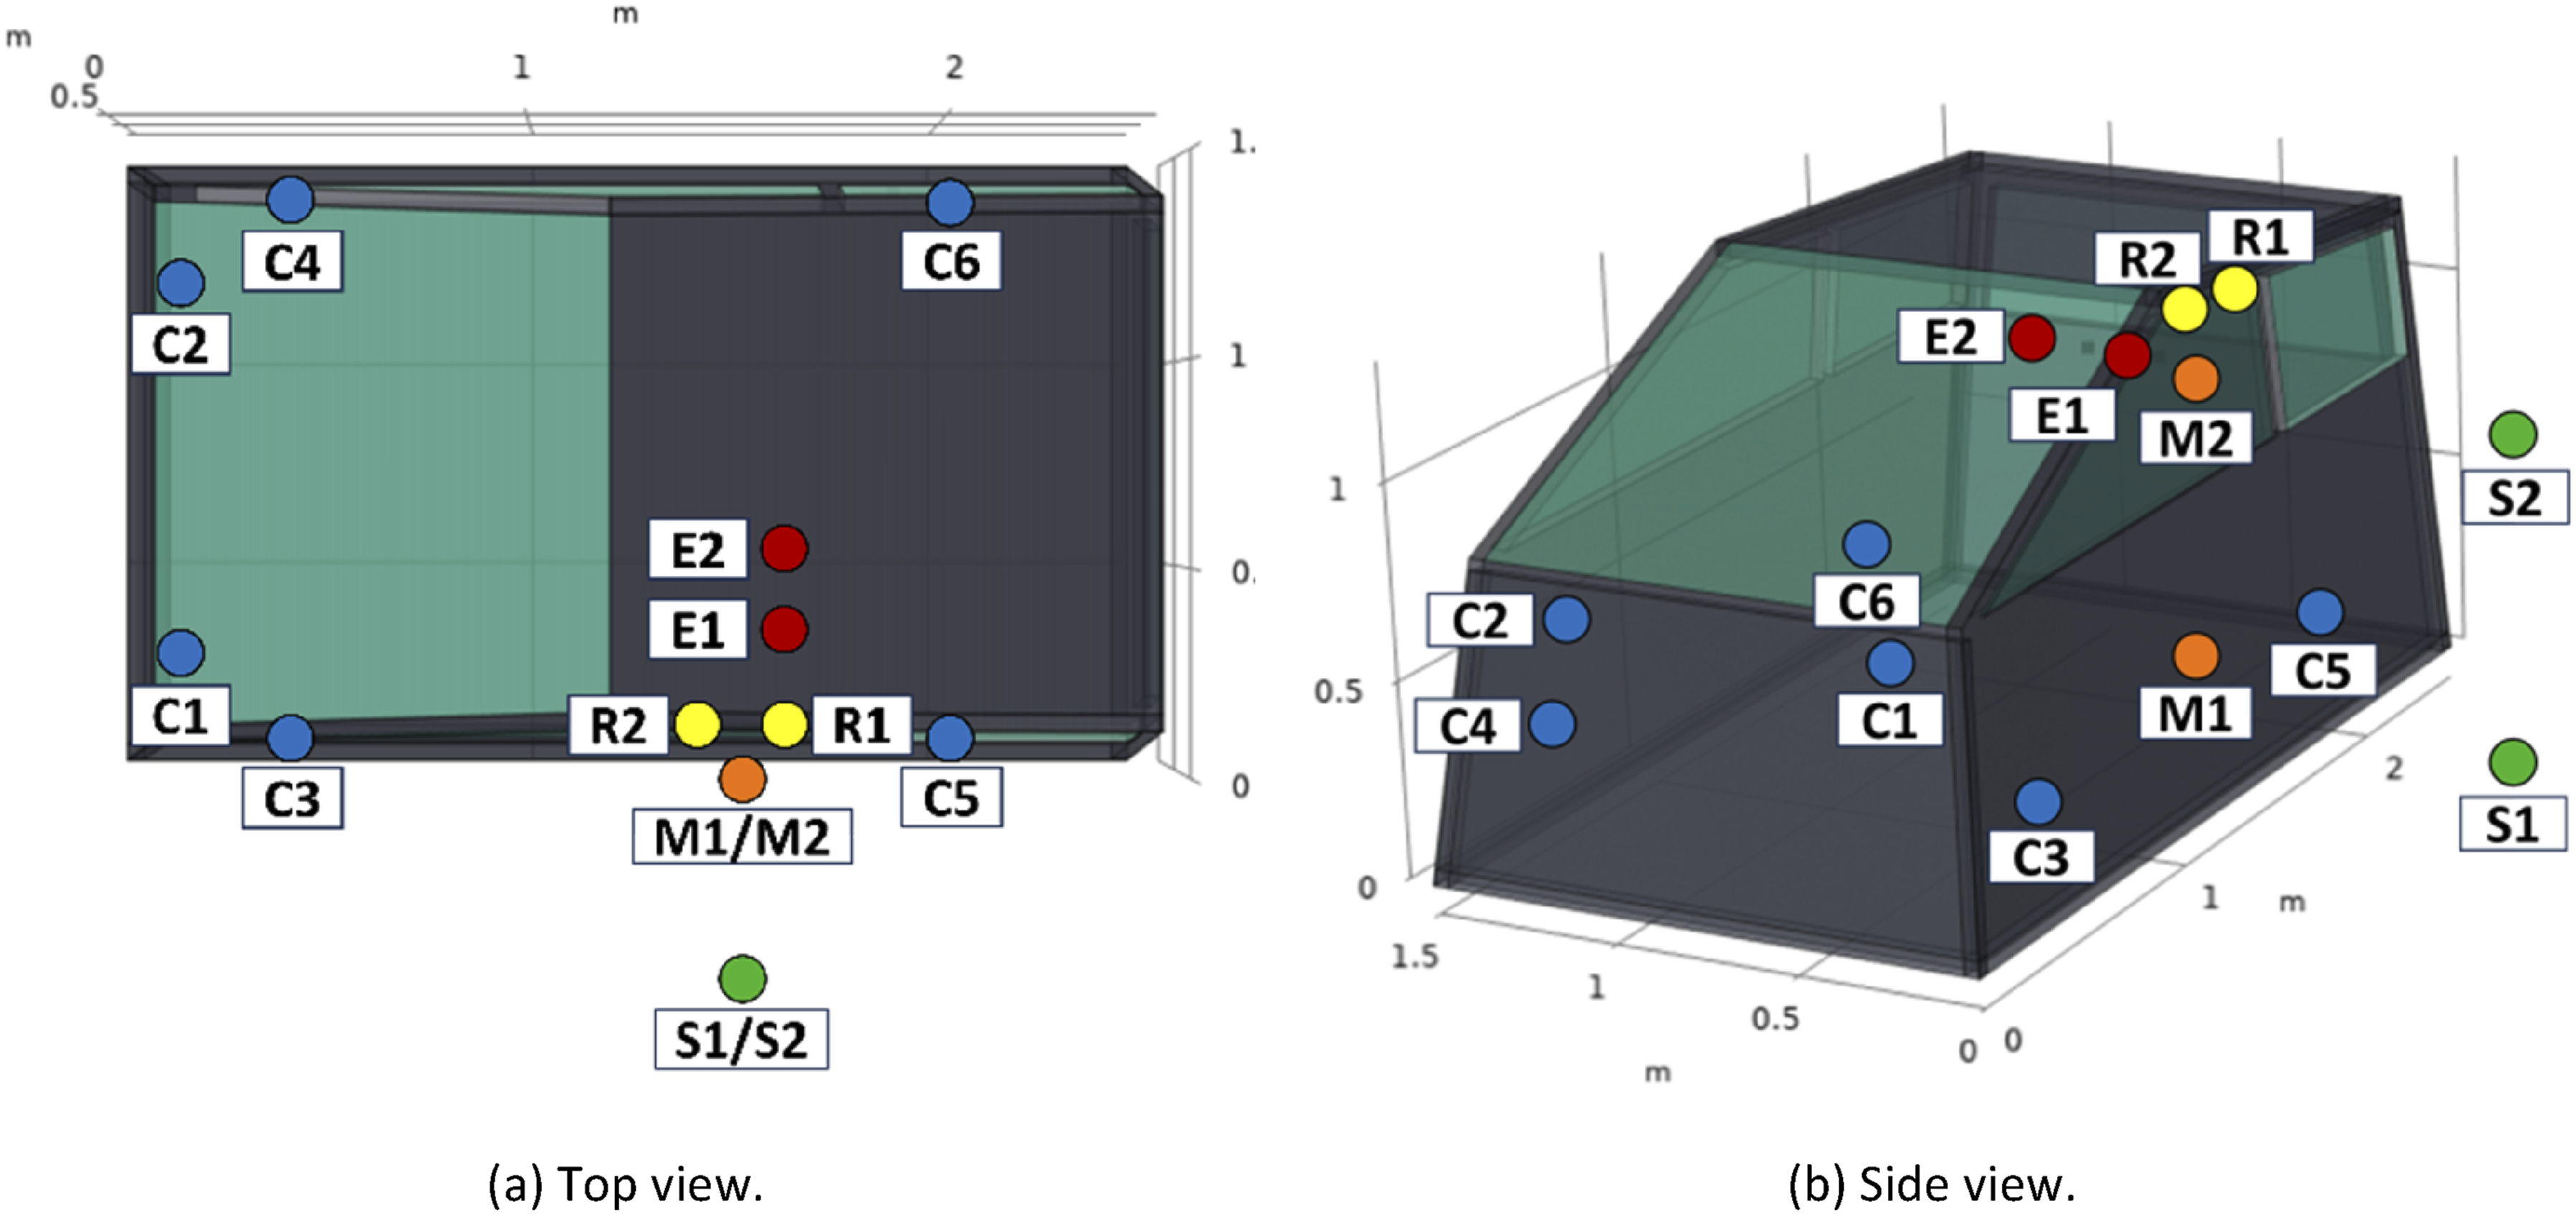
All acoustic sources are modeled as monopoles, while microphones are modeled as omnidirectional pressure probes.
It is worth noting the position of the secondary sources and reference microphones in relation to the error microphones. In the chosen configuration, the distance of the secondary sources from the error microphones is greater than the distance of the reference microphones from the error microphones. This could cause problems if the control has to deal with impulsive or transient disturbances. The control signal from the secondary sources must travel a distance greater than the distance between the reference microphones and error microphones. In other words, the principle of causality is not respected. This is a problem when dealing with abrupt changes in noise. However, assuming that the main contribution to the noise in the passenger compartment is caused by harmonic and stationary noise, the proposed configuration is expected to be effective.
2.4. Control system implementation
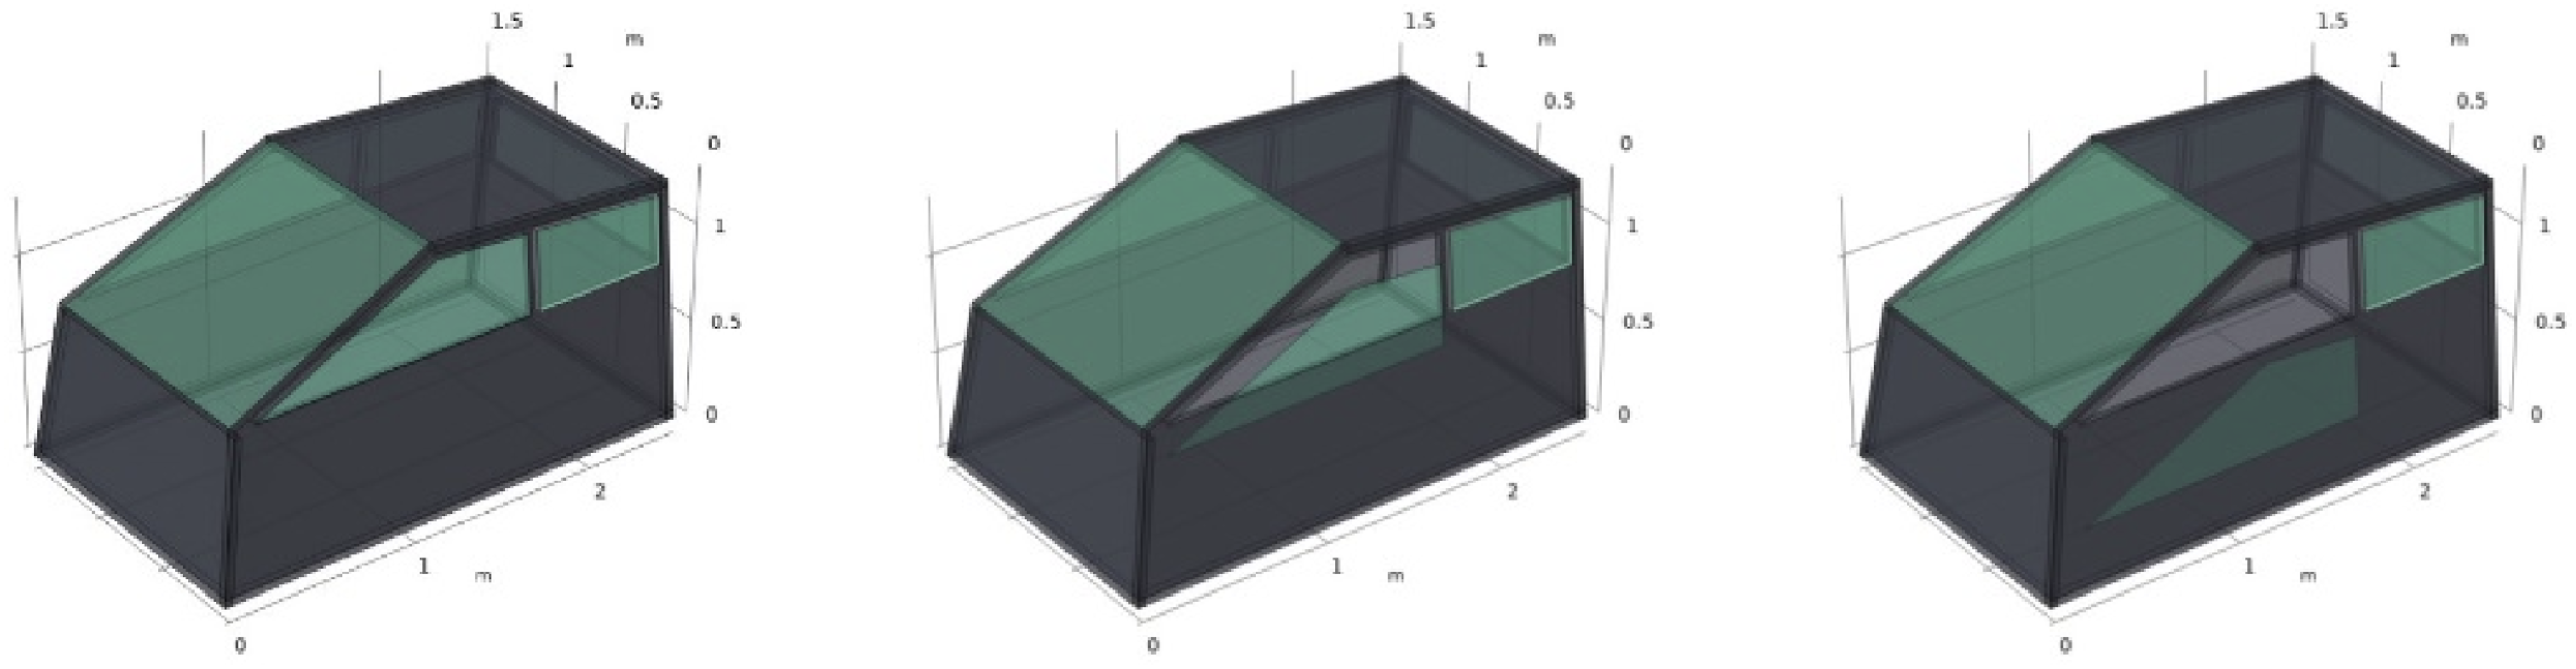
The control system layout described in the previous section can be represented as a block diagram by its acoustic Transfer Functions (TF), as shown in Figure 7(a). These are the primary paths from the noise source to the error microphones ( Block diagrams showing how the system is simulated. (a) is the system representation through its main acoustic transfer functions, and (b) is the content of each of the control blocks. Numerical model of the passenger compartment in the three studied configurations. From left to right: closed, half open, and open driver’s window.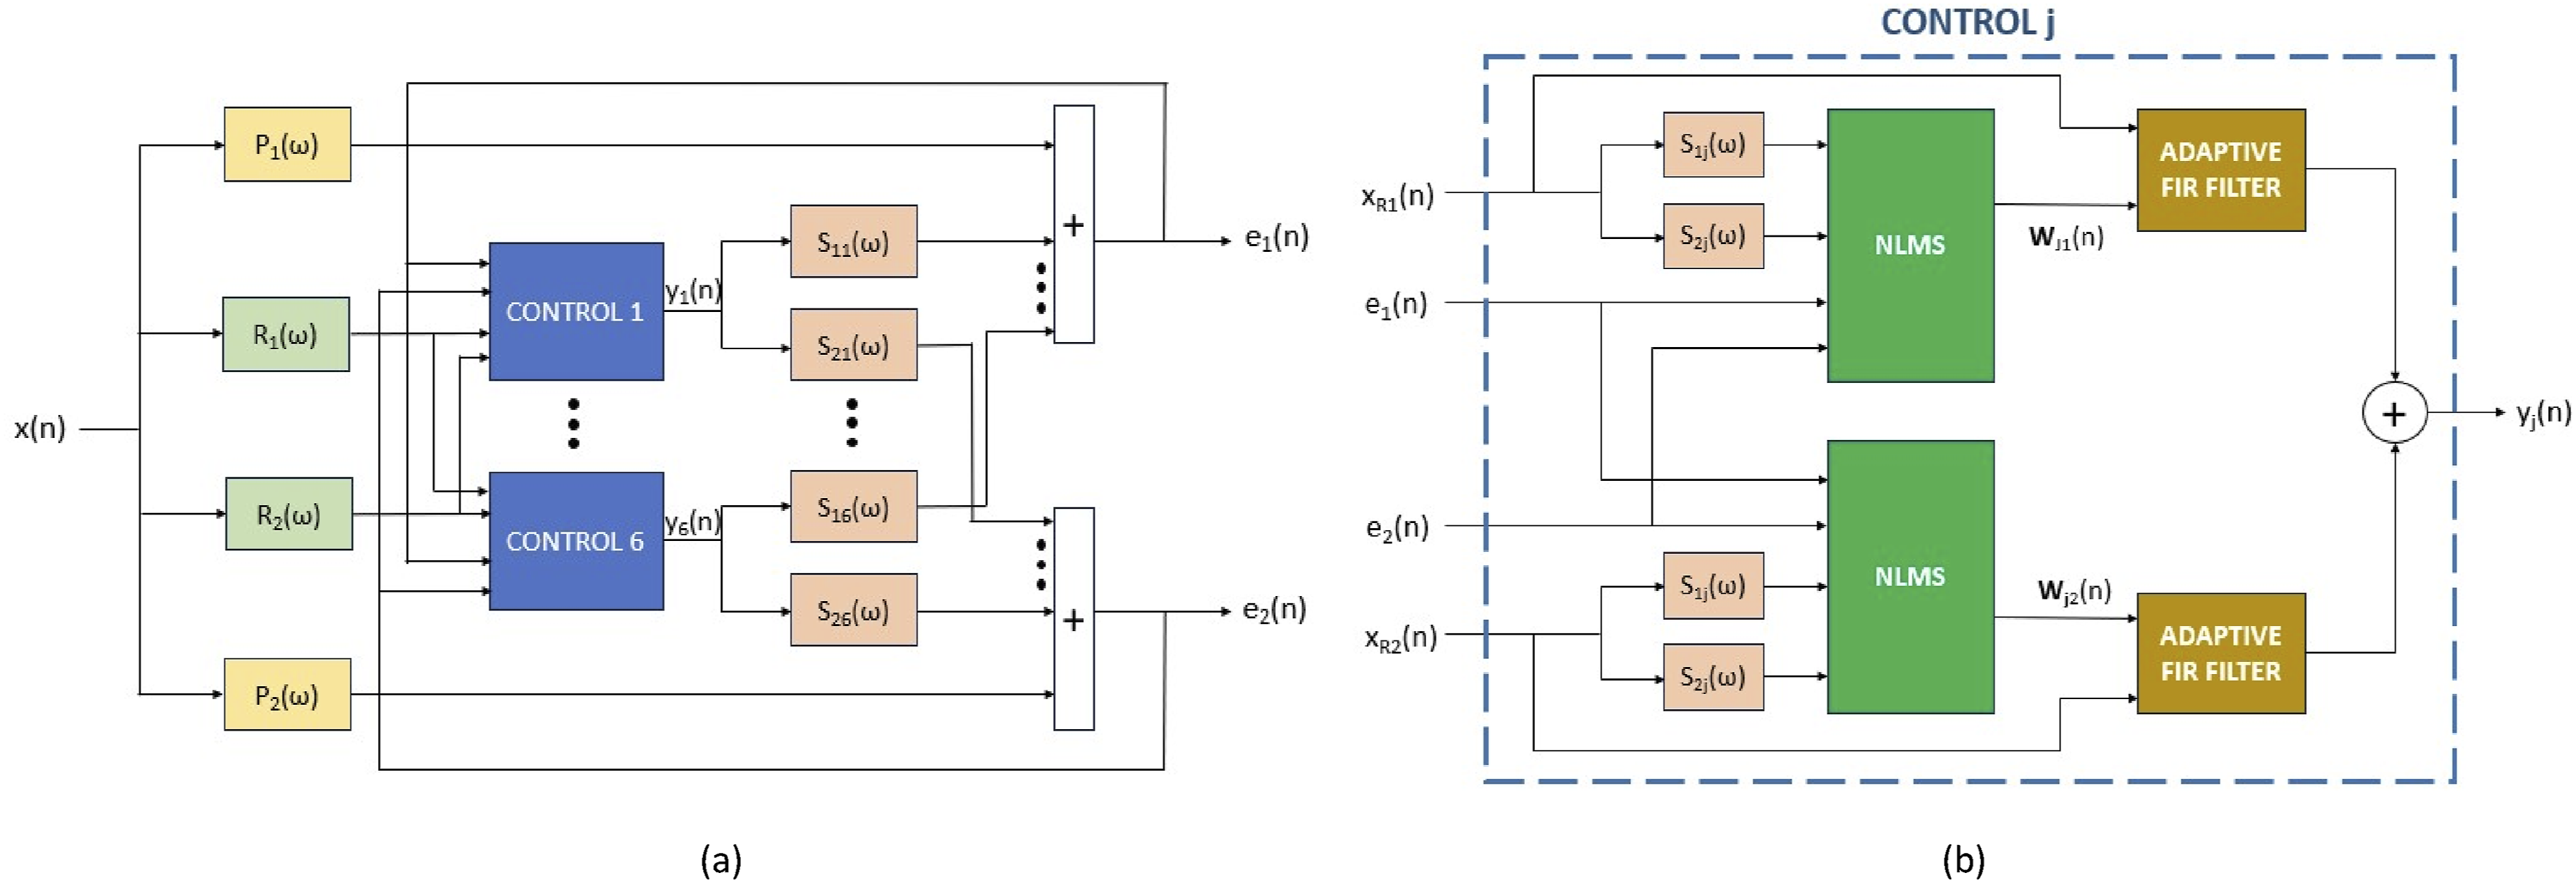
It is worth mentioning that in the control scheme the feedback effects of the secondary sources toward the reference microphones are neglected.
The acoustic transfer function of each path is defined as the ratio between the pressure measured at the microphone location and the volume velocity strength of the source as a function of frequency:
Given all the TFs, the control system is simulated in MATLAB/Simulink. Each of the control blocks shown in blue in the diagram in Figure 7(a) is shown in detail in Figure 7(b). The control logic applied is the complete MC FxNLMS. In this work, the secondary path estimations
3. Results and discussion
An extensive simulation campaign is carried out by combining the following features of the system and the control algorithm:
The system performance is evaluated as a function of the noise source frequency. The computation is performed for each frequency where a stationary monoharmonic signal of unit amplitude is applied as the primary source. All simulations are performed in the time domain with a sampling frequency of
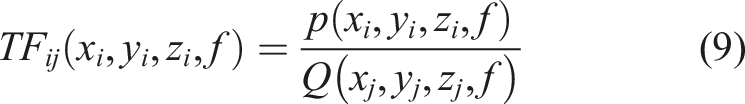
Results are presented in terms of attenuation, whose general expression is given by: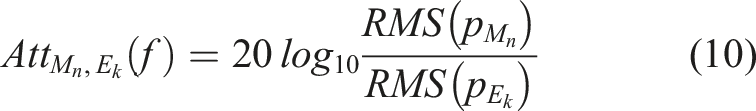
Evaluated considering Root Mean Square (RMS) values of the pressure after 4 s at the error microphones E1 and E2 and at the measurement point M1 (when the noise is coming from S1) and M2 (when the noise is coming from S2). The resulting attenuation functions are shown in Figures 9 and 10. Attenuation is evaluated with and without control in both the implemented versions of the algorithm. In this way, the improvement in performance given by the ANC system can be easily visualized. Att results from simulations with closed window, when noise source is S1 (a) and S2 (b). The color red refers to Att measurements in E1, while blue refers to E2. Att results from simulations when noise source is S1, with half open window (a) and open window (b).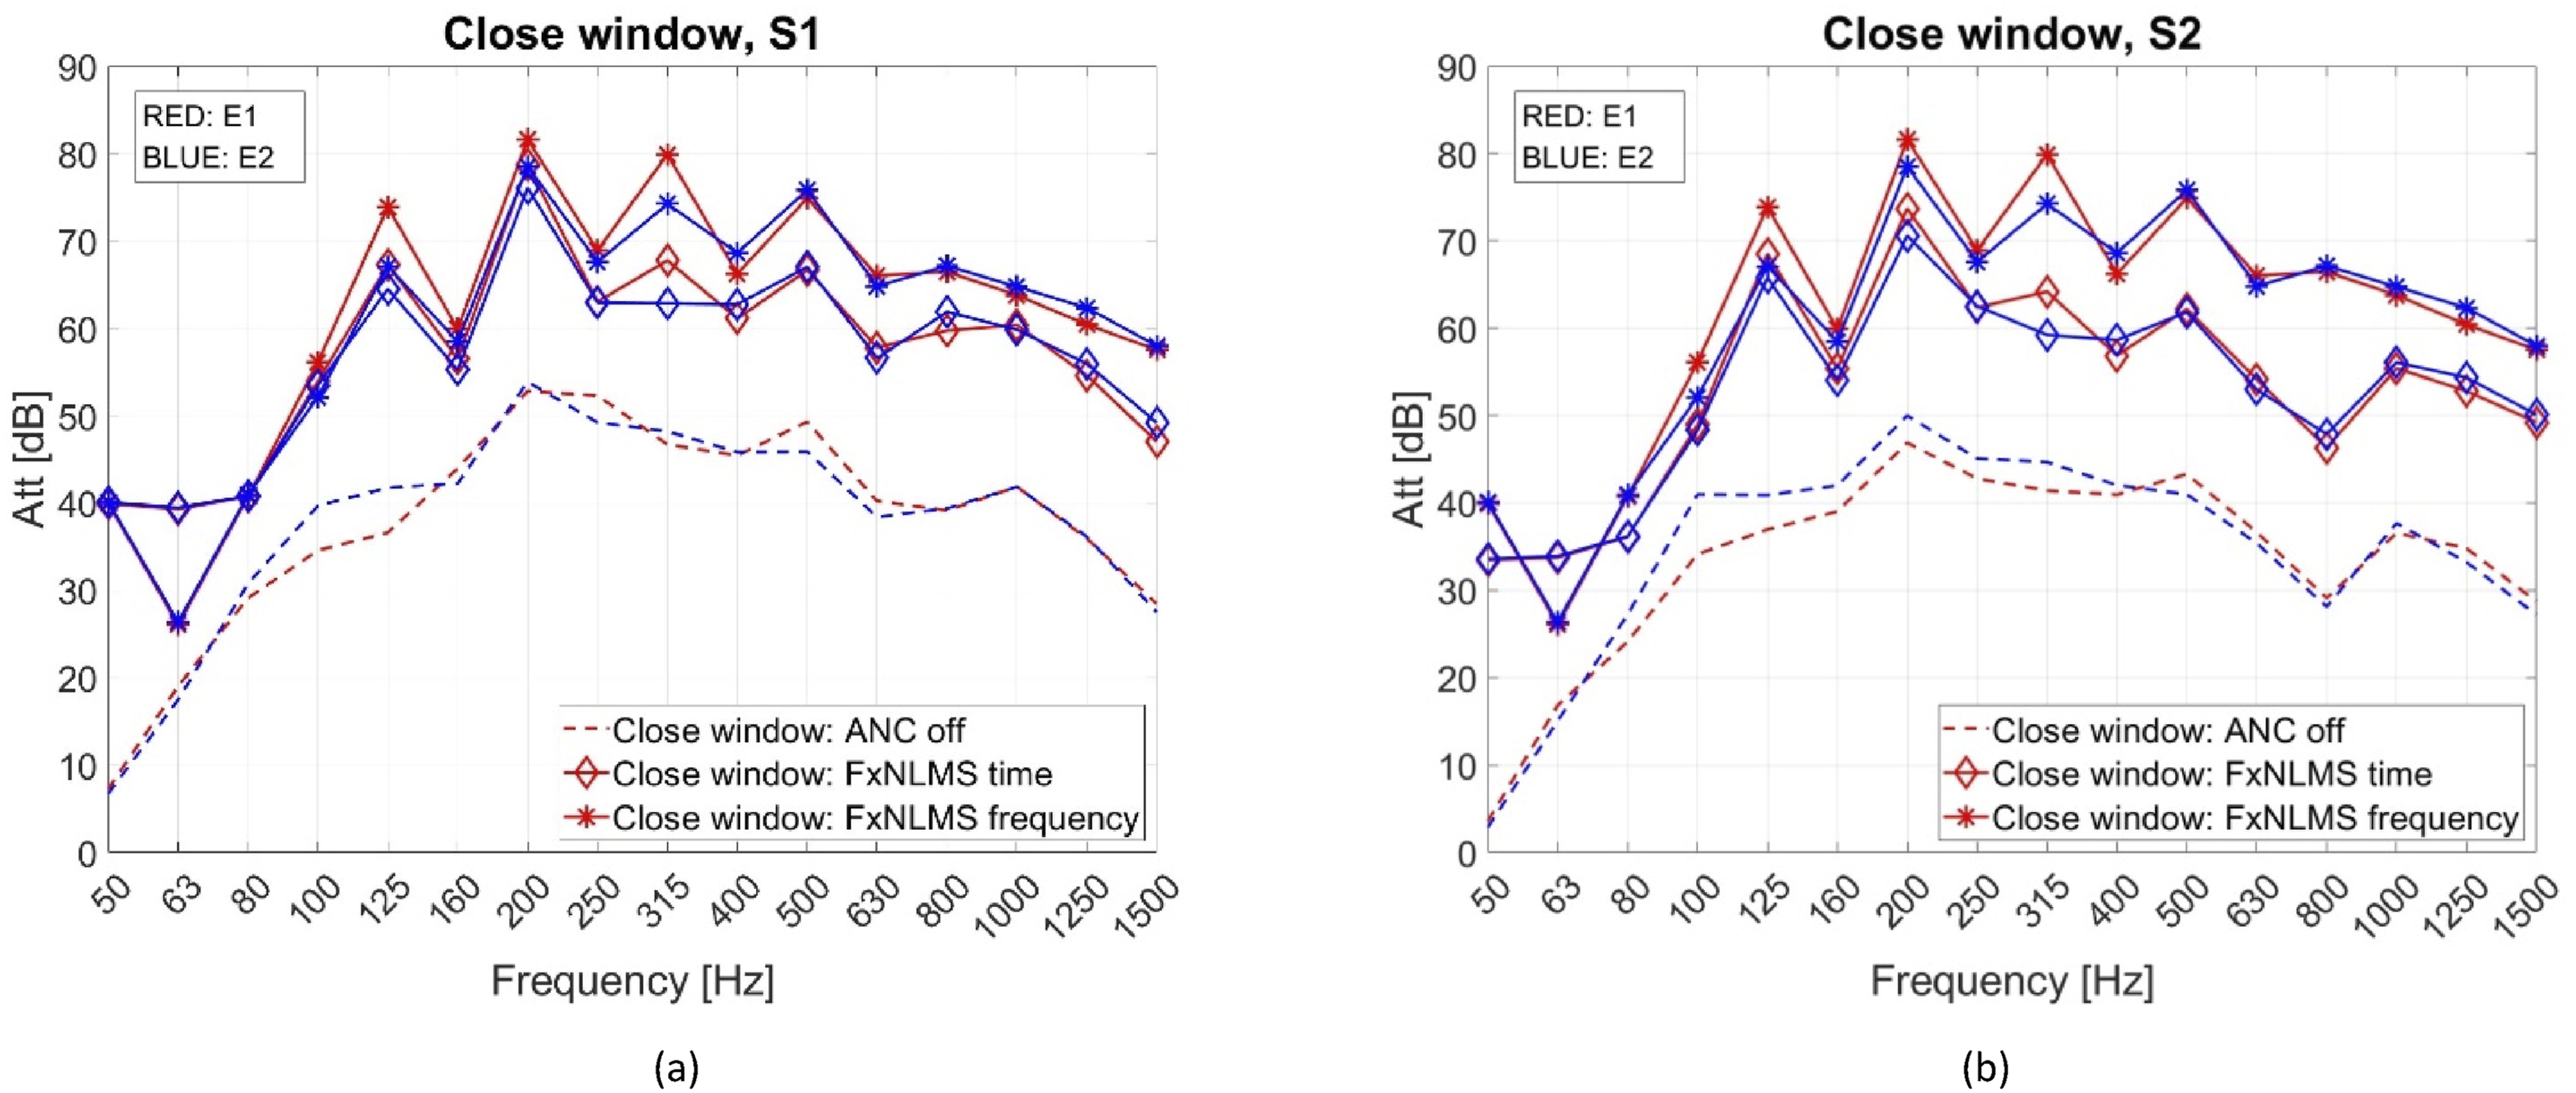
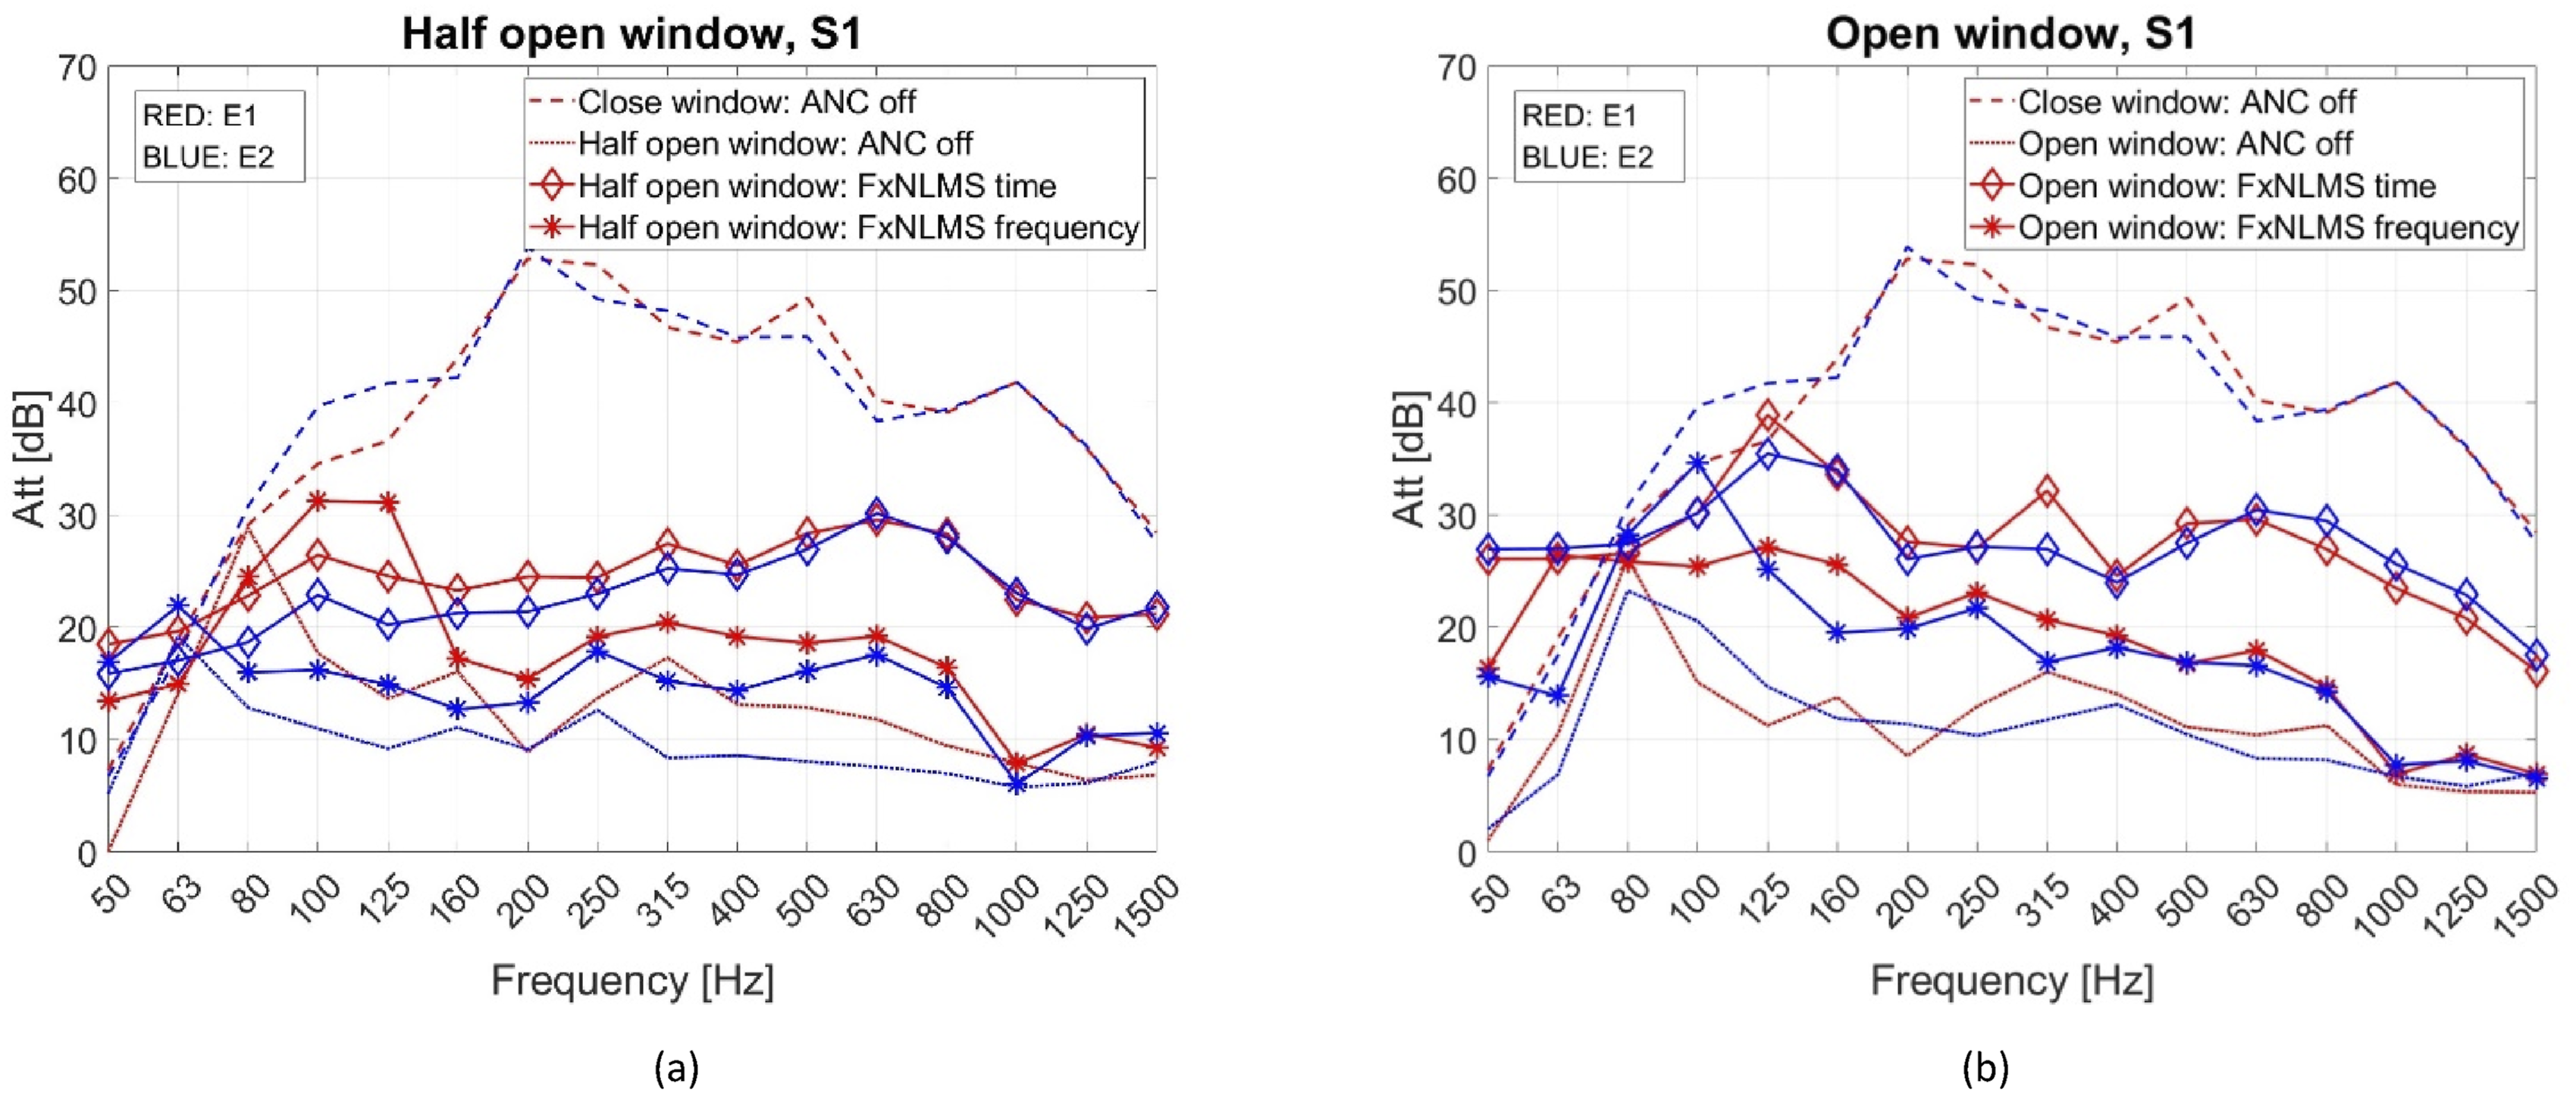
For the first test case, closed window (Figure 9), both control algorithms perform well, with an improvement of 10 to 40 dB in the simulated frequency range. From around 200 Hz, the frequency domain version gives significantly better noise reduction. The performance when considering S1 or S2 is quite similar. The same applies to the other two conditions (half open and open window), so from now on only results related to the primary source S1 will be shown. As it can be seen from Figure 10(a) and (b), the time domain version consistently guarantees good attenuation in the half open and open window conditions. On the other hand, the frequency domain algorithm performs worse, especially when the frequency is increased from 160 Hz for half open window and from 125 Hz for open window. Focusing on the performance of the time domain version, in the frequency range from 100 to 200 Hz, the attenuation in the open window condition is higher compared to the one related to the half open window case. In the same range, it can be noticed that the attenuation at the error microphone E1 is significantly lower when the control is not activated in the open window configuration, meaning more noise measured by the error microphone inside the cabin. This makes the algorithm act more strongly, as shown in equation (3), and ultimately leads to a better attenuation.
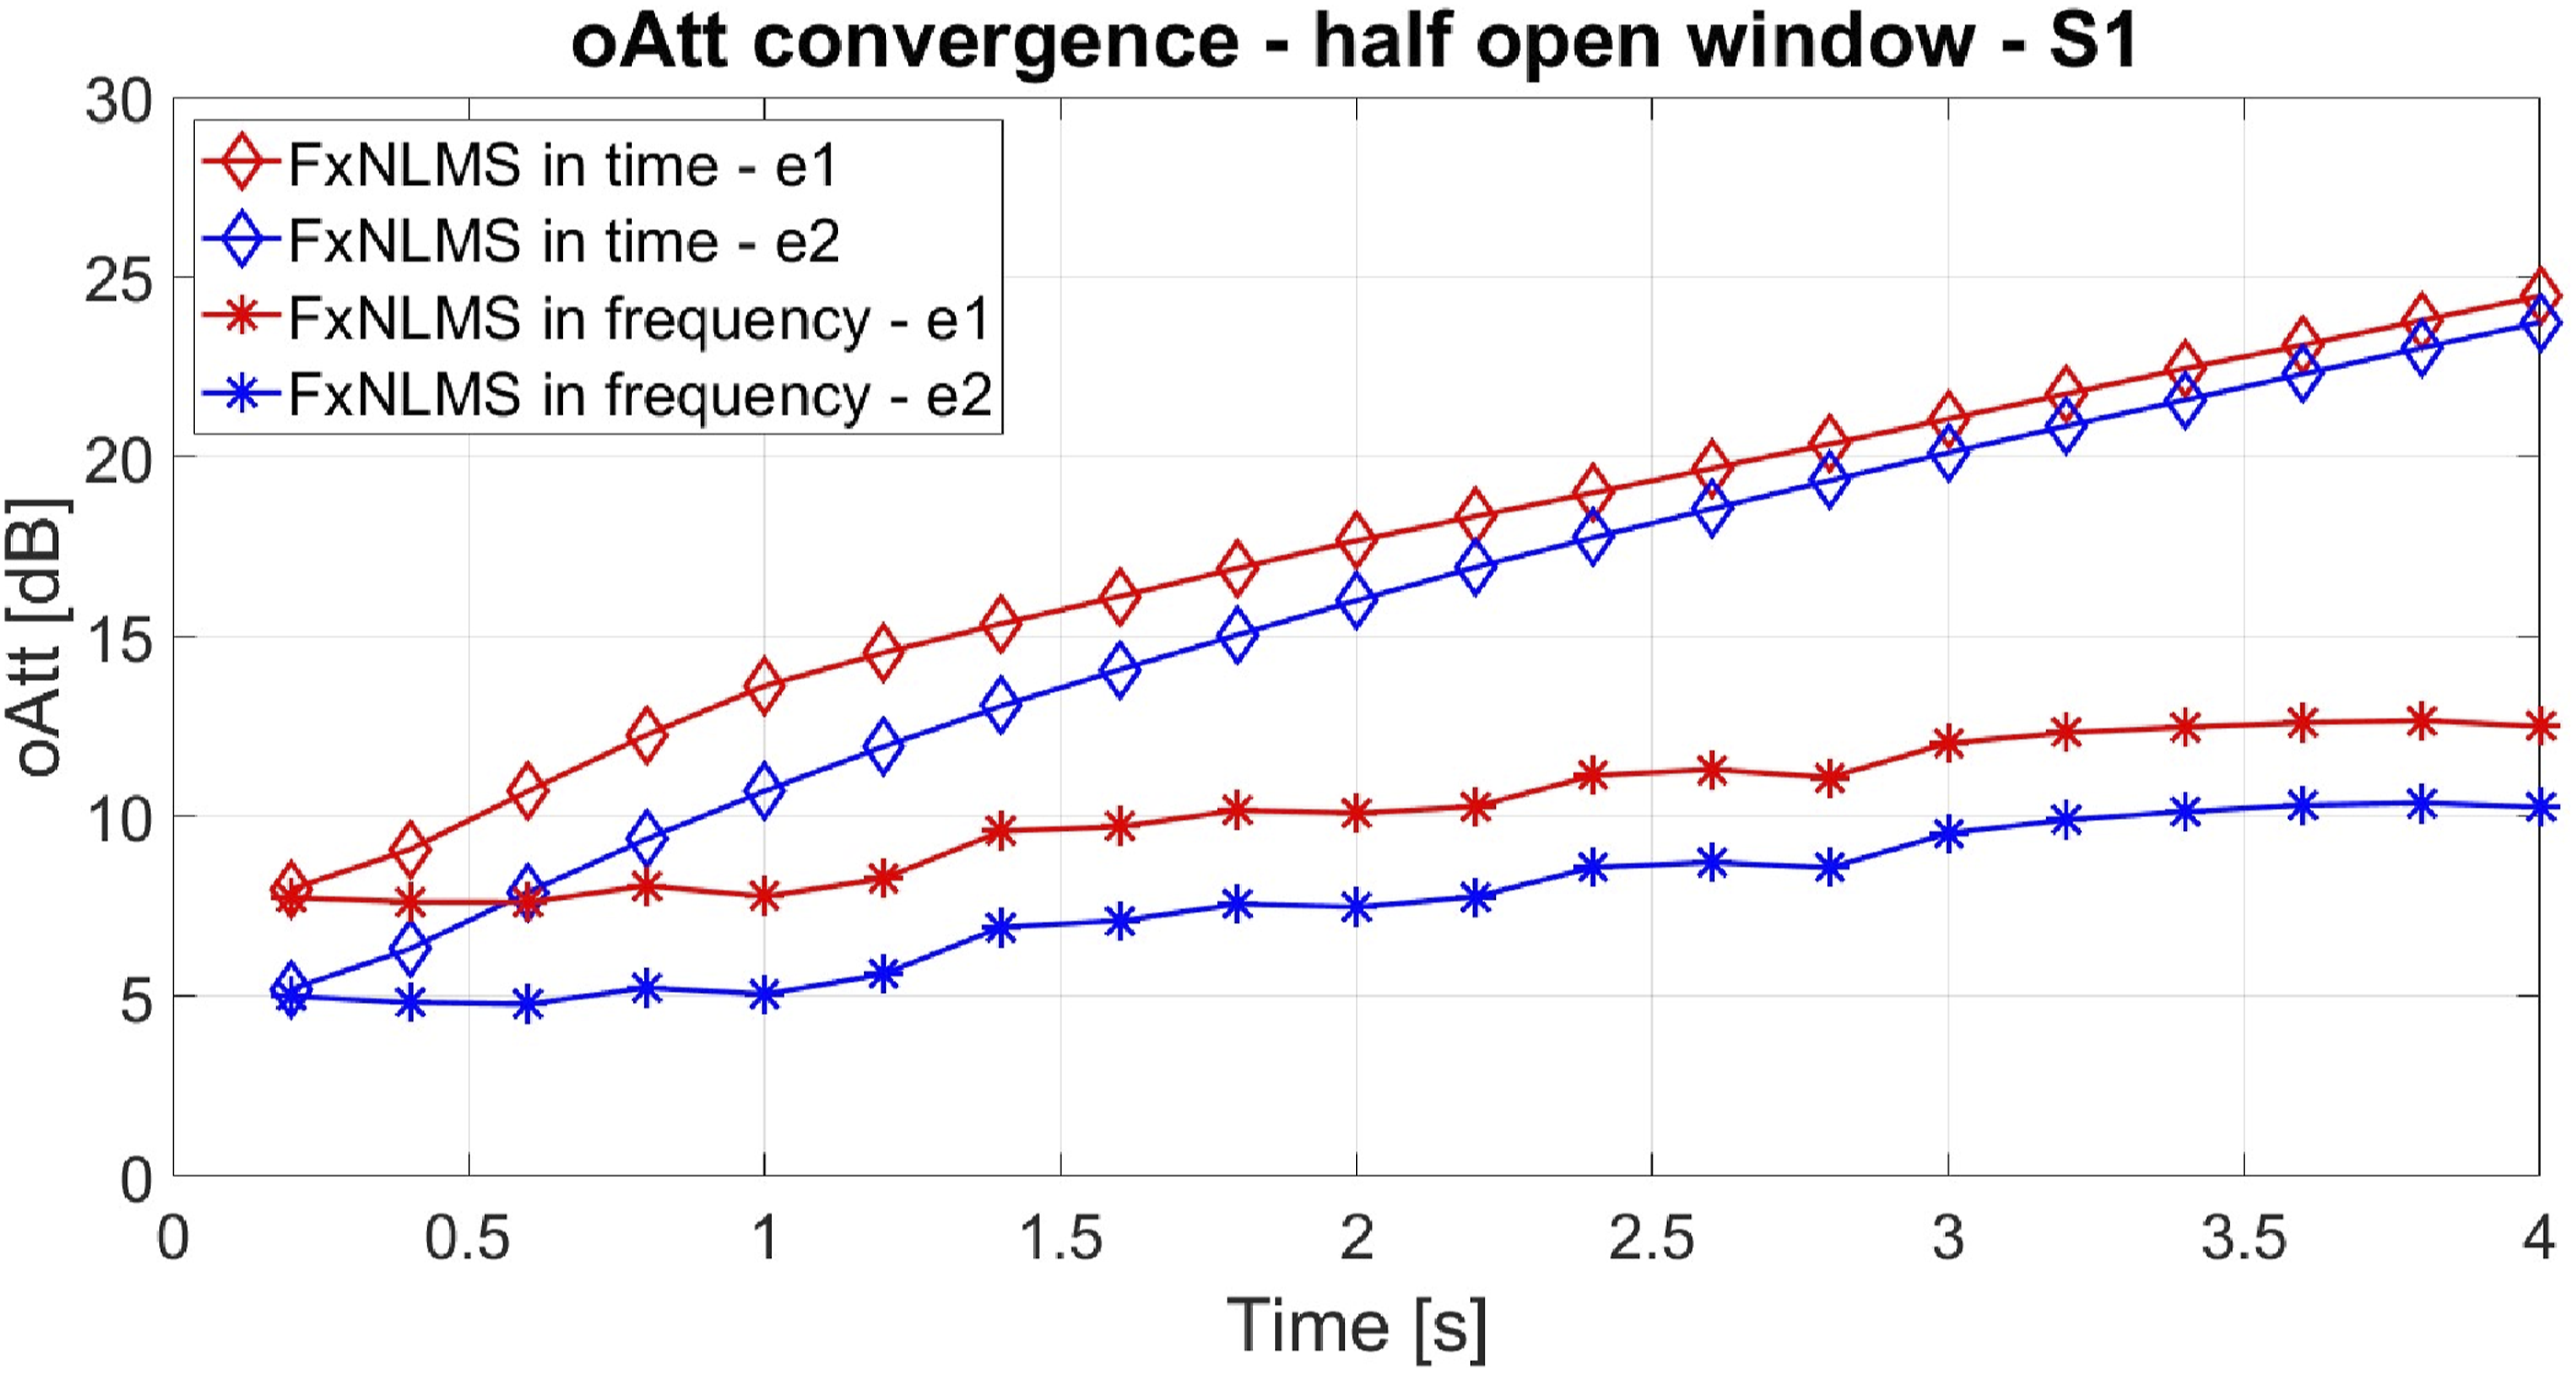
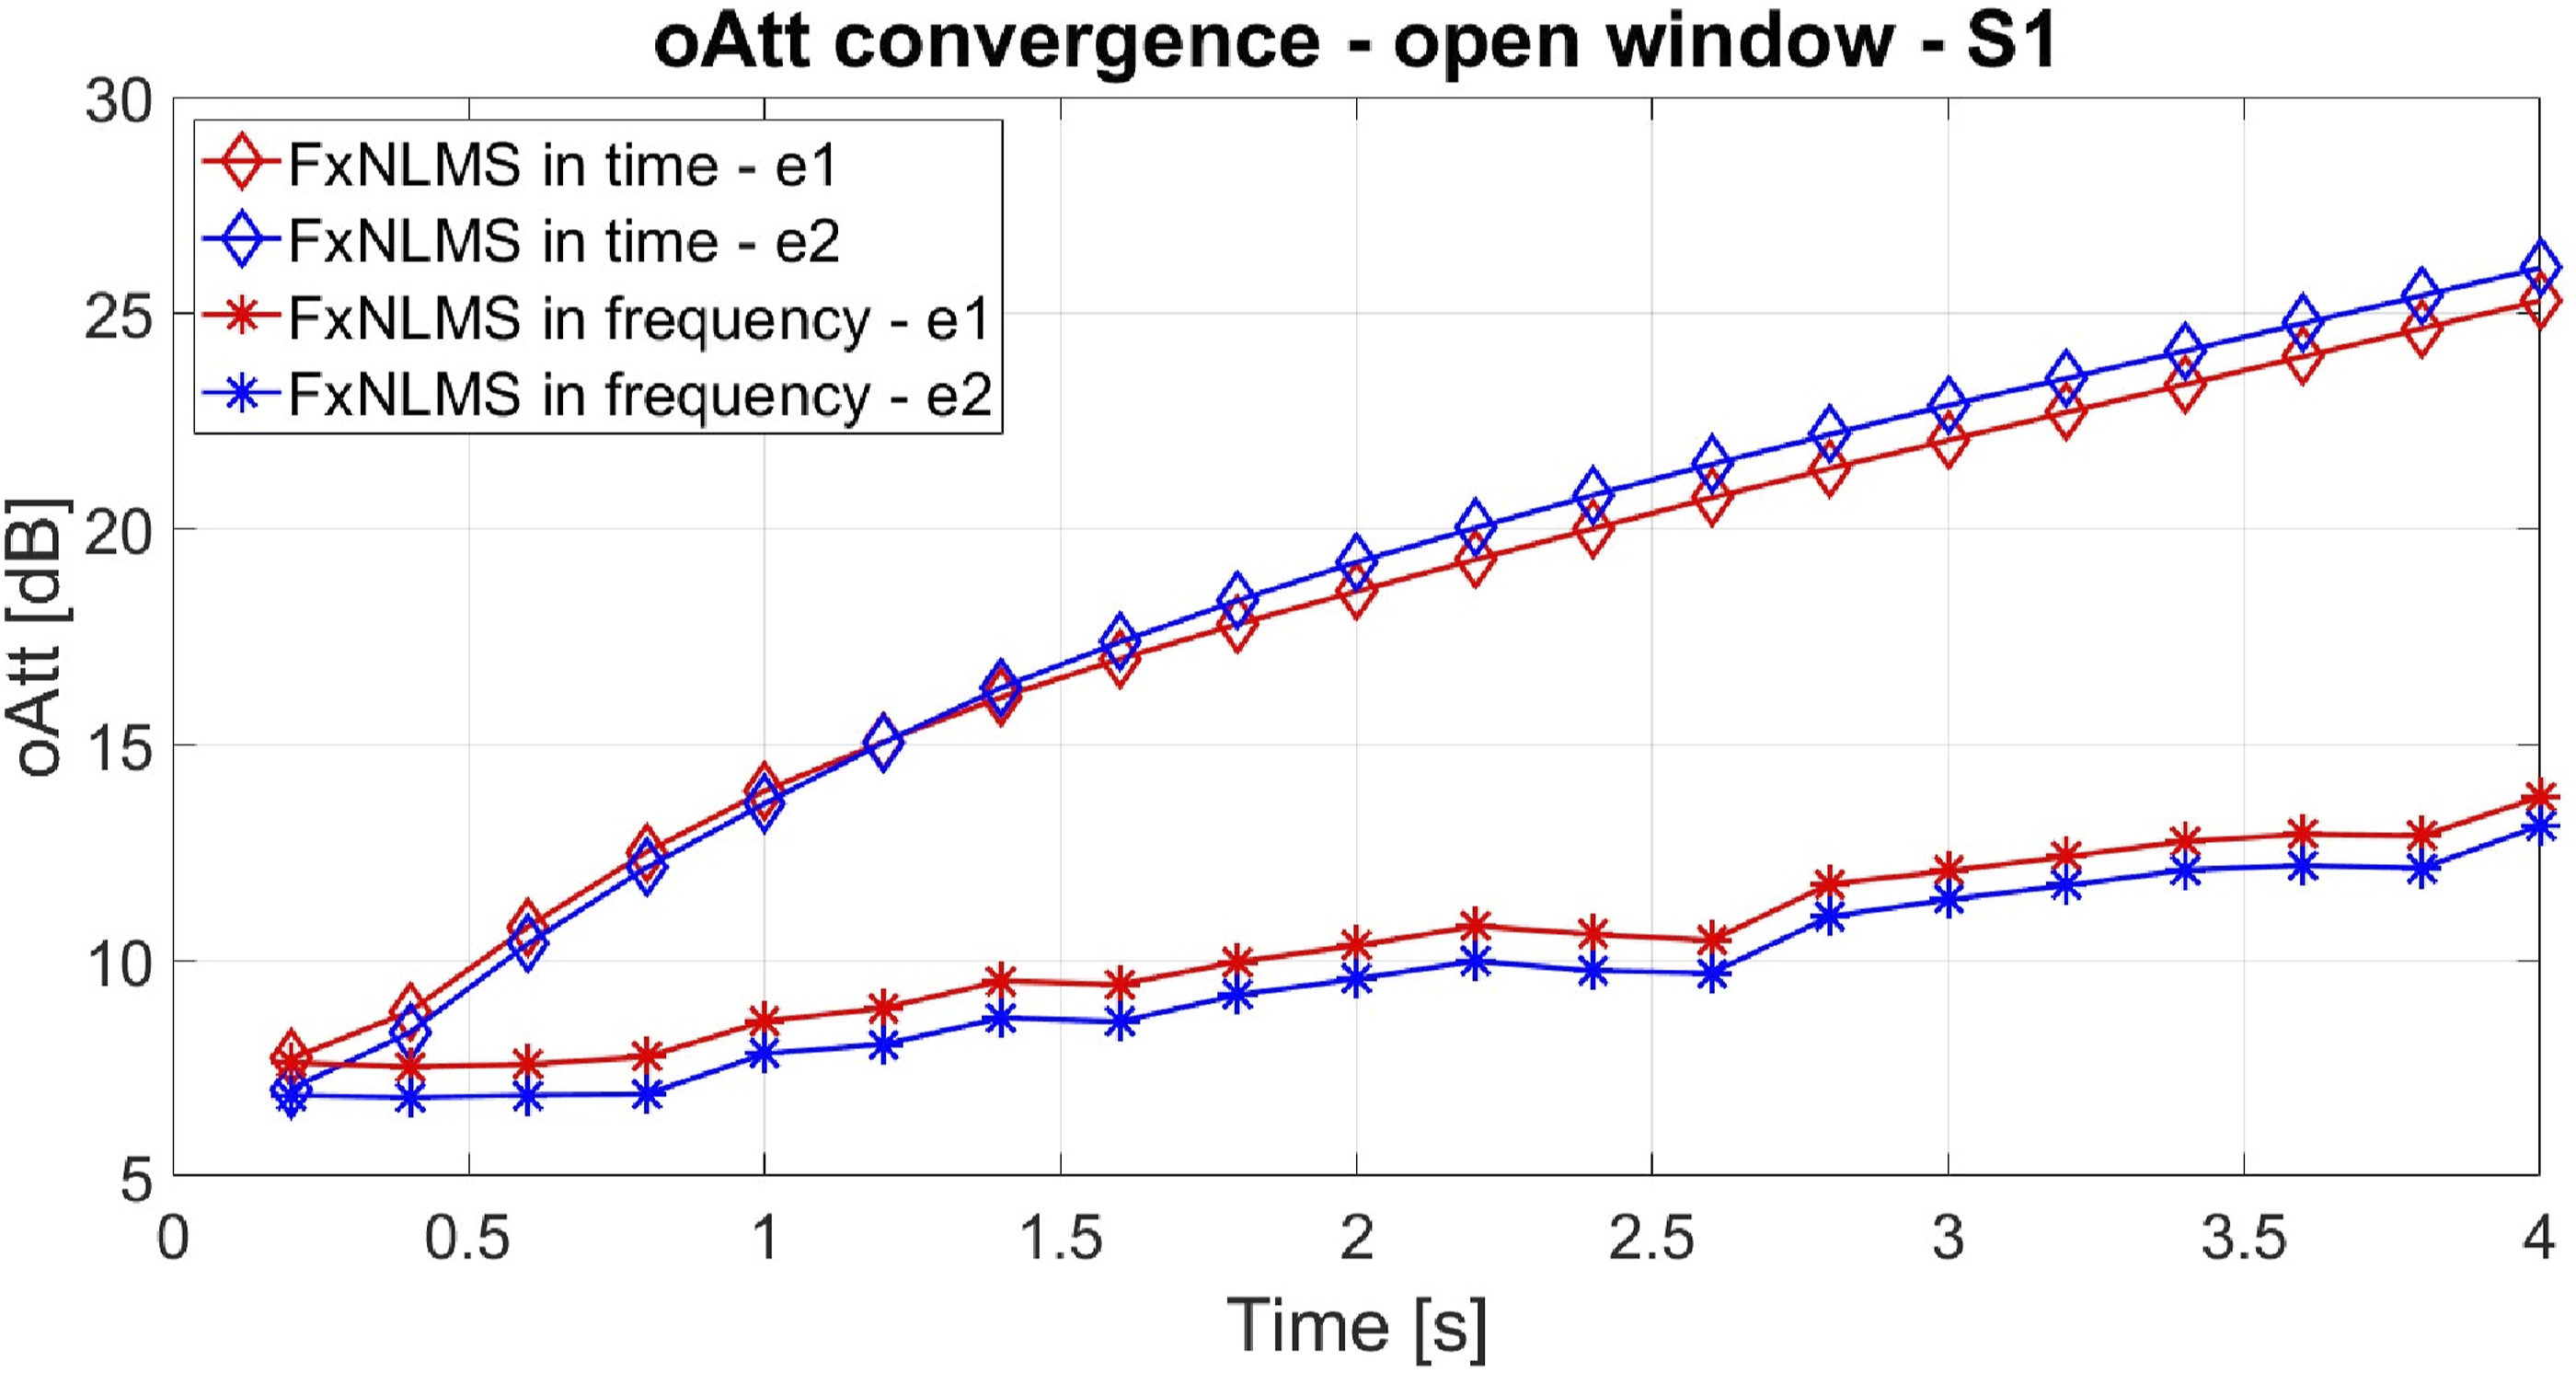
Figures 11–13 also show a convergence analysis of the control algorithm. The time history of the overall attenuation (oAtt) is shown for the first 4 s of the simulation. The oAtt is evaluated at a given time by averaging the Att values over all the analyzed frequencies (50–1500 Hz). In the closed window case (Figure 11) the oAtt curve for the frequency domain version is always slightly higher than the one of the time domain algorithm. On the other hand, for half open and open window (Figures 12 and 13), the oAtt in the time domain FxNLMS is significantly higher from the very first simulation time steps. It is interesting to note that in the half open window configuration there is a significant difference between the two error microphones, especially in the first instants of the simulation. More specifically, error microphone E1 shows higher values. This is probably due to the difference in attenuation between the two error microphones in the absence of control, as can be seen in Figure 10(a). Att is significantly lower for error microphone 2, which is more affected by the reflected sound waves from the passenger compartment walls. This is the case for all the frequencies studied and is also transferred to the oAtt convergence. oAtt results from simulations when noise source is S1 with closed window. oAtt results from simulations when noise source is S1 with half open window. oAtt results from simulations when noise source is S1 with open window.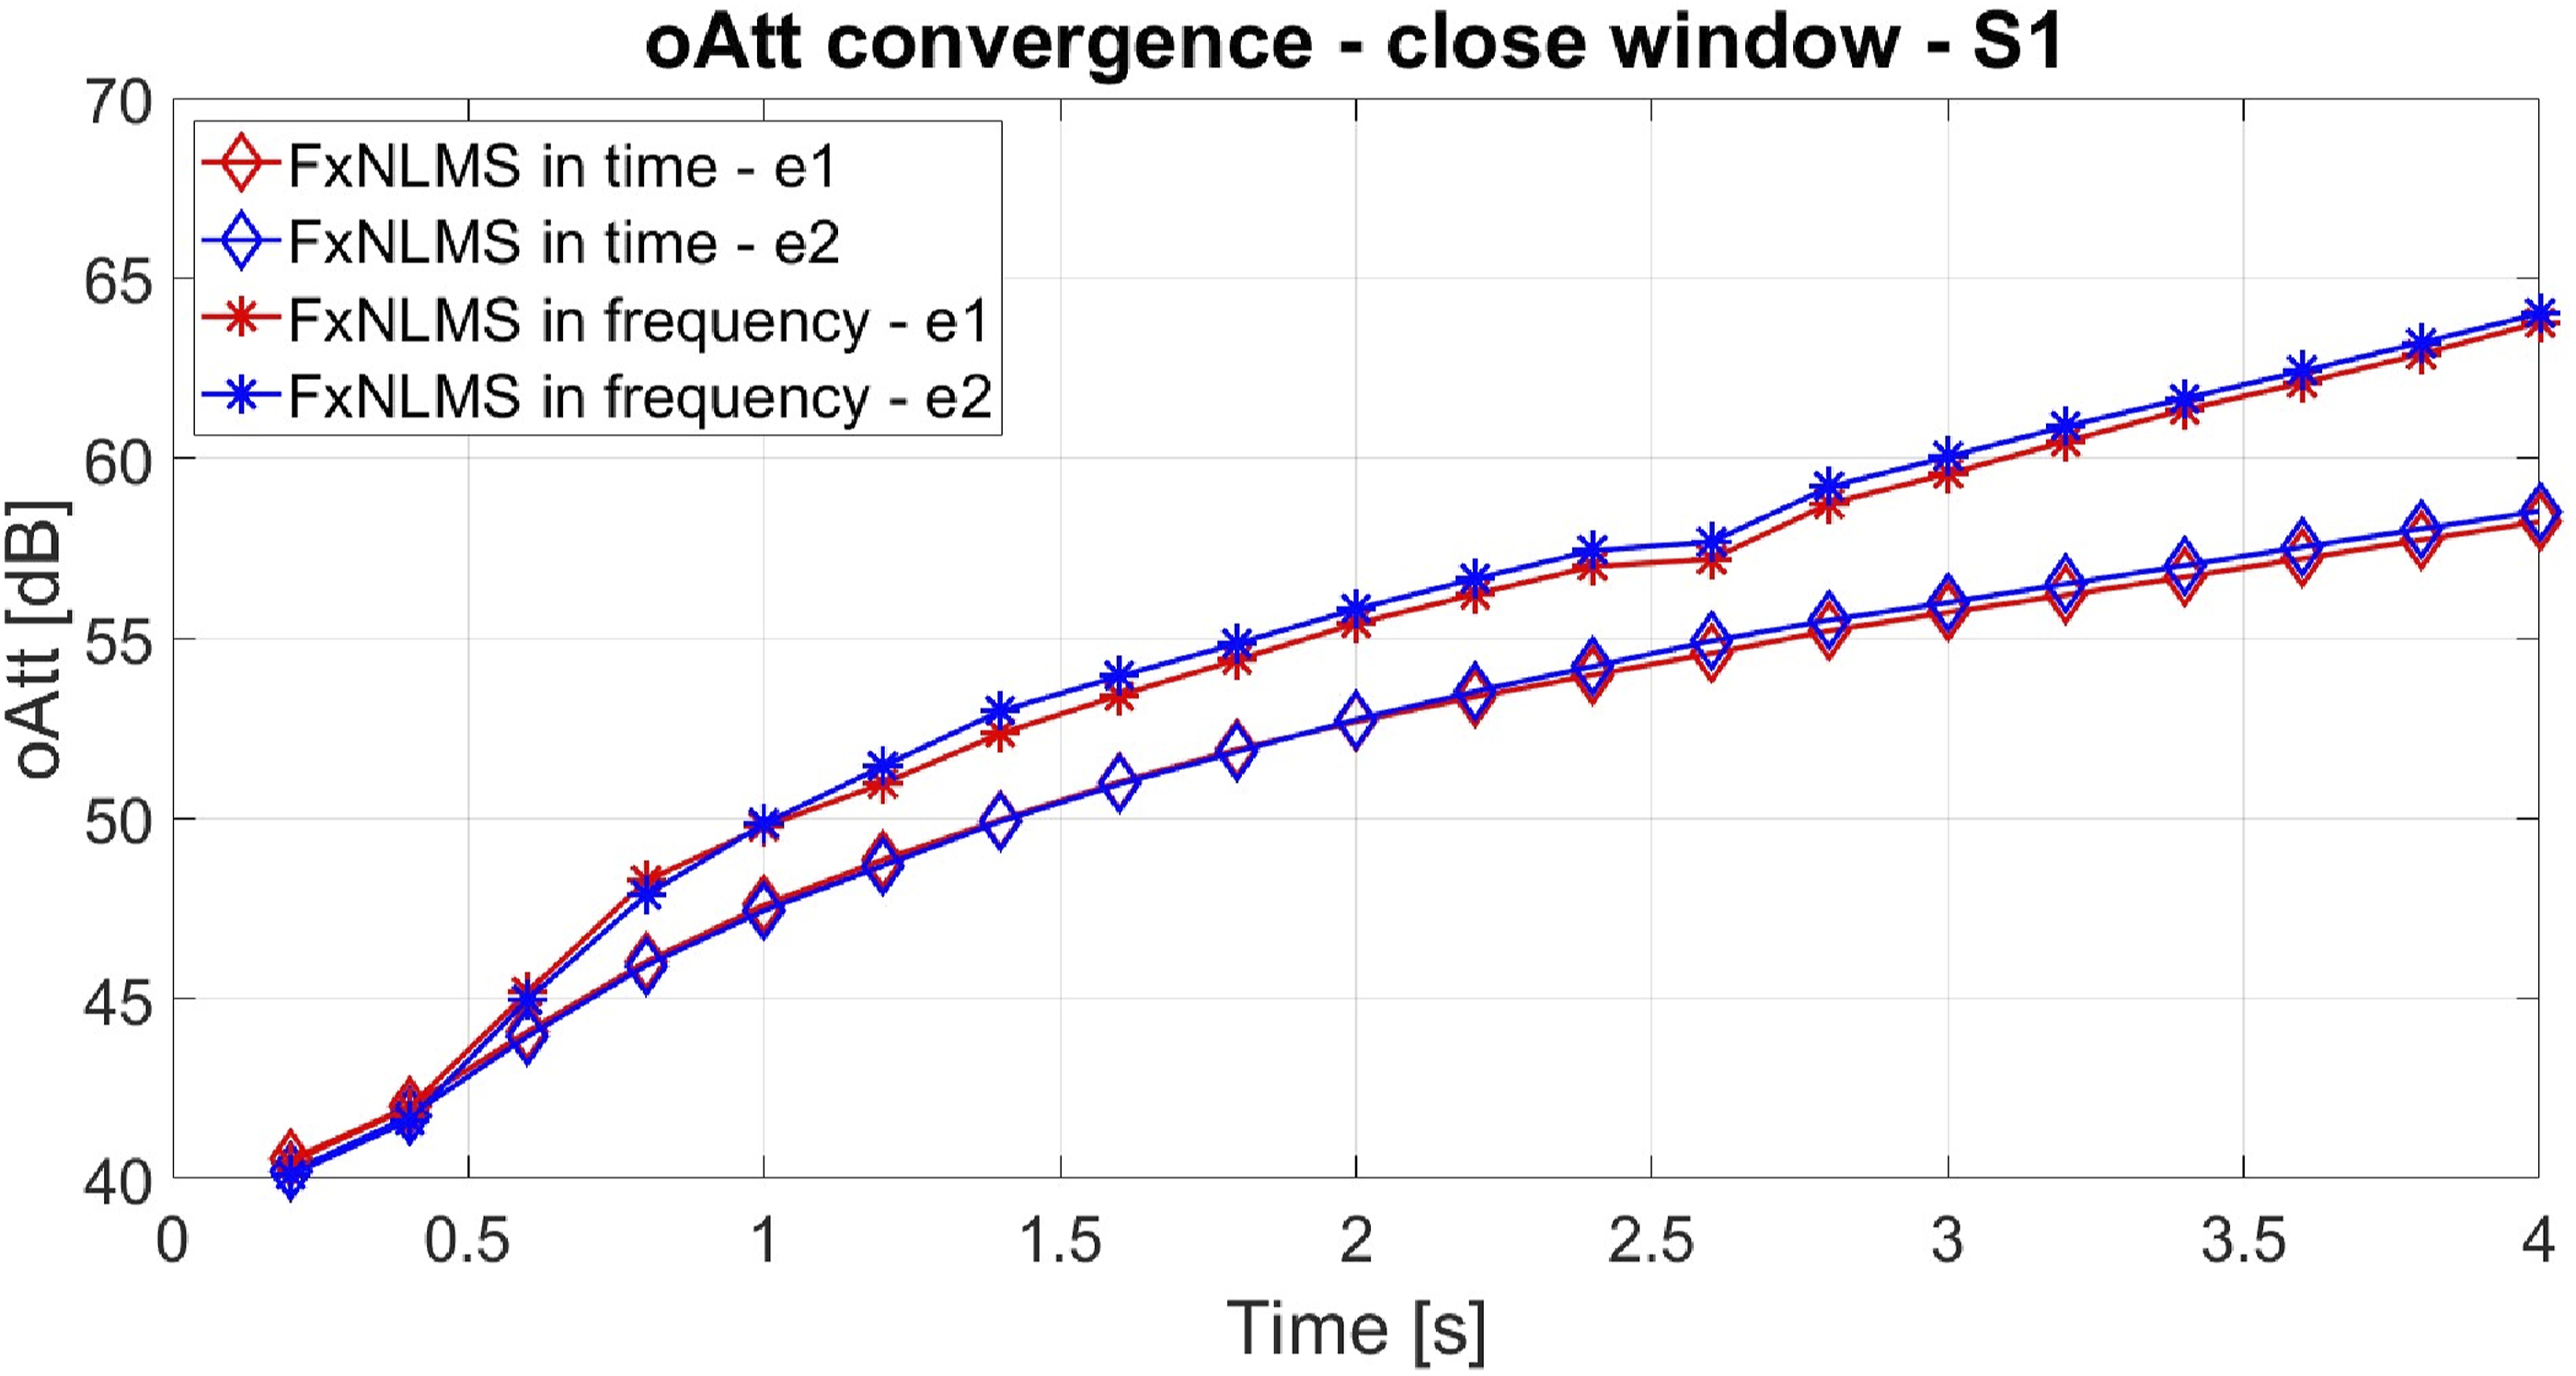
4. Conclusions
This paper presents a simulation campaign to investigate the performance of an ANC system applied to a car passenger compartment, focusing on the reduction of airborne noise coming from the car window at different degrees of opening. The developed MC system is tested for two versions of the FxNLMS control algorithm in the time and frequency domain. During the study a stationary monoharmonic signal was used as the noise source and the ANC performance was analyzed. Results show that the system is able to effectively reduce the disturbance at the location of the error microphones, for both versions of the control algorithm. However, FxNLMS in the time domain has significantly better performance in the open and half open window configurations, which are of particular interest for this study. Indeed, the airborne noise transmission through the car window is drastically higher when it is open, and therefore the attenuation should be optimized for this case. This is beneficial for both noise and ventilation comfort in the passenger compartment environment and could therefore be a starting point for future applications in the automotive sector. The final validation of the system should include a jury test where subjects are asked to listen to real-life recorded noise samples where control is applied through numerical simulations, and finally a practical implementation in a real-life experiment.
Footnotes
Declaration of conflicting interests
The authors declared no potential conflicts of interest with respect to the research, authorship, and/or publication of this article.
Funding
The authors received no financial support for the research, authorship, and/or publication of this article.