
Abstract
Abnormal vibration of gear transmission systems is one of the key factors affecting the operational reliability of tram vehicles. However, the vibration characteristics and excitation mechanisms of gearbox systems under actual operating conditions are not yet fully understood. In this study, field vibration tests were conducted on a tram gearbox system to investigate the characteristics of abnormal vibration. The vibration signals were analyzed using spectral analysis and operational modal analysis methods, and the relationship between gear meshing excitation and structural vibration was examined through theoretical analysis and simulation. The results show that the abnormal vibration is closely related to gear meshing excitation, and significant vibration amplification occurs when the meshing excitation frequency approaches the natural frequencies of the drivetrain structure. The identified modal characteristics reveal that structural resonance plays an important role in the vibration response of the gearbox system. The findings provide useful insights for the diagnosis of abnormal vibration in tram drivetrain systems and offer a reference for vibration control and maintenance of railway gear transmission equipment.
1. Introduction
With the increasing demand for sustainable urban mobility, low-floor trams have become an important mode of public transportation due to their energy efficiency, accessibility, and high passenger capacity. The 100% low-floor configuration, however, requires a compact arrangement of drivetrain components, particularly the gearbox, which is typically integrated within the bogie structure (Hoshi et al., 2007; Li et al., 2004; Zhang et al., 2015). Although this design improves accessibility and operational flexibility, it reduces structural stiffness and introduces complex vibration transmission paths, making the drivetrain system more susceptible to abnormal vibration and resonance during long-term operation (Tomioka and Takigami, 2015).
Abnormal vehicle vibration is a critical issue affecting ride quality, operational safety, and the durability of drivetrain components. Existing studies on low-floor trams mainly focus on vehicle dynamics and ride comfort. For example, multi-module coupling vibration has been identified as an important source of abnormal carbody motion in five-module tram vehicles, where inter-car dampers can effectively suppress vertical vibration (Wang et al., 2024). Similarly, insufficient articulation stiffness may induce excessive carbody pitching near 8 Hz, which can be mitigated by restoring the designed stiffness (Shi et al., 2021). Other studies have reported a “W-shaped” distribution of ride quality across tram modules, caused by track irregularities, low wheel-rail conicity, and weak inter-carbody constraints (Wang et al., 2024). In addition, independently rotating wheels commonly used in low-floor trams lack self-centering capability, which may increase the risk of derailment and wheel-rail wear (Chudzikiewicz et al., 2022). These studies indicate that the dynamic performance of low-floor trams is highly sensitive to structural design and wheel-rail interactions; however, relatively limited attention has been given to the drivetrain subsystem, which can act as an important vibration source.
As a key component of the traction transmission system, the gearbox plays an important role in the vibration behavior of tram vehicles. Gear meshing excitation can generate high-frequency vibration responses that may interact with structural modes of the drivetrain. In recent years, considerable research has been devoted to gearbox vibration monitoring and fault diagnosis. Time-frequency analysis methods such as continuous wavelet transform have been widely used to detect gearbox faults from acoustic or vibration signals (Mokrzan et al., 2023). Trackside monitoring systems combining empirical mode decomposition and decision-tree classifiers have also been developed to identify gearbox faults without onboard sensors (Nowakowski et al., 2023). In addition, improved spectral estimation techniques such as the Trimmed Window Discrete Fourier Transform have demonstrated higher-frequency estimation accuracy for noisy vibration signals (Wolf et al., 2021). For non-stationary signals, advanced time-frequency methods have been proposed to identify amplitude- and phase-modulated fault features in gearbox vibration responses (Shen et al., 2022).
Recent advances in machine learning have further expanded the capability of gearbox condition monitoring. For example, speed-integrated long short-term memory (SI-LSTM) models incorporate rotational speed information to improve fault diagnosis accuracy under variable-speed conditions (Chen et al., 2025). Domain adaptation approaches have also been proposed to transfer knowledge from simulation data to experimental datasets with limited labeled samples (Jiang et al., 2024). Meanwhile, comprehensive reviews have summarized gearbox dynamic mechanisms and artificial intelligence-based diagnostic approaches in railway vehicles (Zhao and Chen, 2024). From a dynamic perspective, studies have shown that wheel polygonization can strongly excite gearbox resonance and increase drivetrain dynamic stress (Zhu et al., 2022). Despite these advances, most studies focus on signal-based fault detection rather than the interaction between drivetrain excitation and structural vibration modes under real operating conditions.
In low-floor trams, the reduced structural stiffness and constrained installation space of drivetrain components may increase the likelihood of modal coupling and resonance amplification caused by gearbox excitation. However, the excitation mechanisms and transmission characteristics of such abnormal vibrations under real operational conditions remain insufficiently understood (Liu et al., 2024; Men et al., 2024).
To address this issue, this study investigates the abnormal vibration behavior of a gearbox in a five-module low-floor tram through field vehicle dynamic tracking tests. By combining vibration monitoring, time-frequency analysis, operational modal identification, and spectral modulation analysis, the excitation source, transmission path, and modal coupling mechanisms of the drivetrain vibration are systematically analyzed. A schematic workflow of the experimental and analytical procedure is presented in Figure 1. The results provide useful insights into the root causes of abnormal drivetrain vibration and offer a theoretical basis for condition monitoring and structural optimization of low-floor tram systems. The schematic workflow of the experimental and analytical procedure.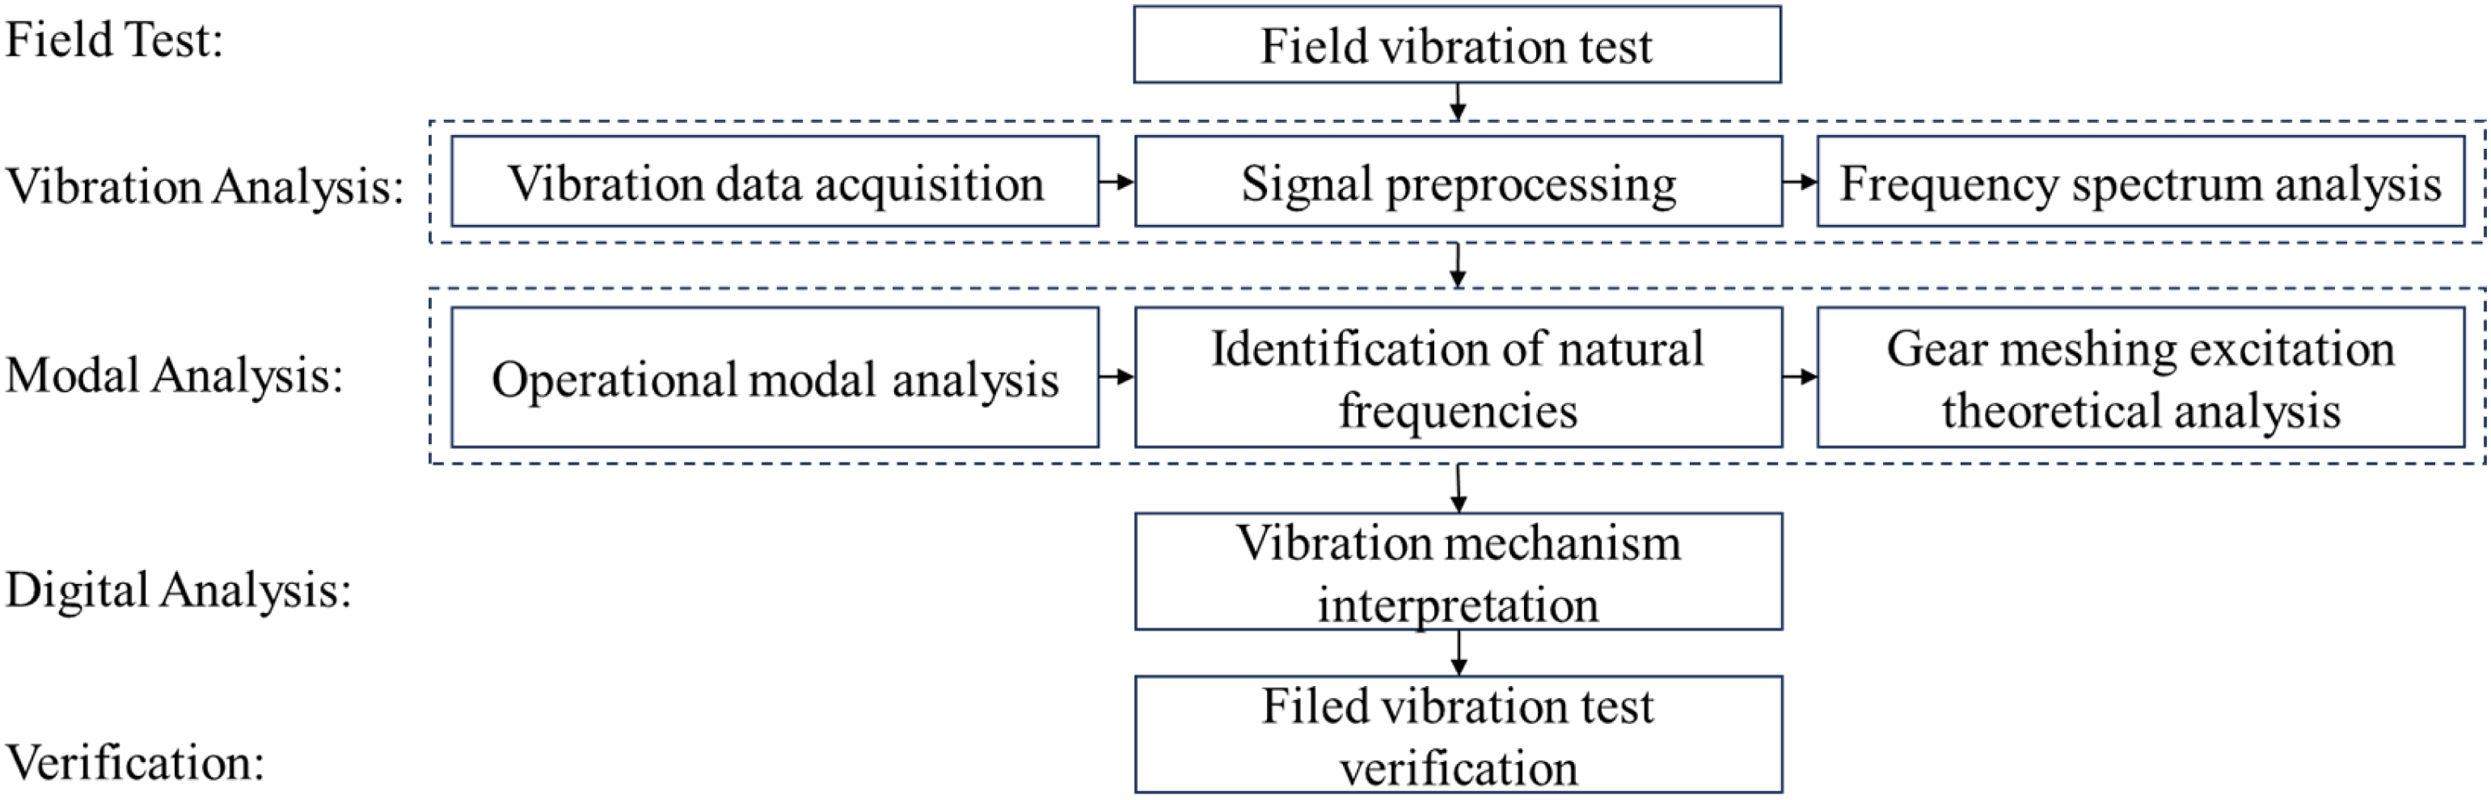
2. Vehicle dynamics tracking test
2.1. Experimental overview
During actual operation, a type of 100% low-floor tram exhibited abnormal vibration in the gearbox, which severely affected vehicle stability and ride comfort. To identify the causes and characteristics of this abnormal vibration, vehicle dynamics tracking test were conducted focusing on the transmission system and vehicle stability quality. The test vehicle was a five-module low-floor tram in normal service operation, with a consist configuration of M1 + F2 + T3 + F4 + M5, as shown in Figure 2. In this configuration, “M” denotes motorized modules equipped with complete traction systems and powered bogies; “F” represents floating modules without bogies; and “T” is a trailer module supported by a trailer bogie. To comprehensively capture the dynamic responses of critical components during operation and evaluate ride quality, a multi-channel synchronized data acquisition scheme was adopted. Multiple accelerometers were mounted on the bogies and carbody structures to record vibration signals in real time. Configuration of a five-module 100% low-floor tram.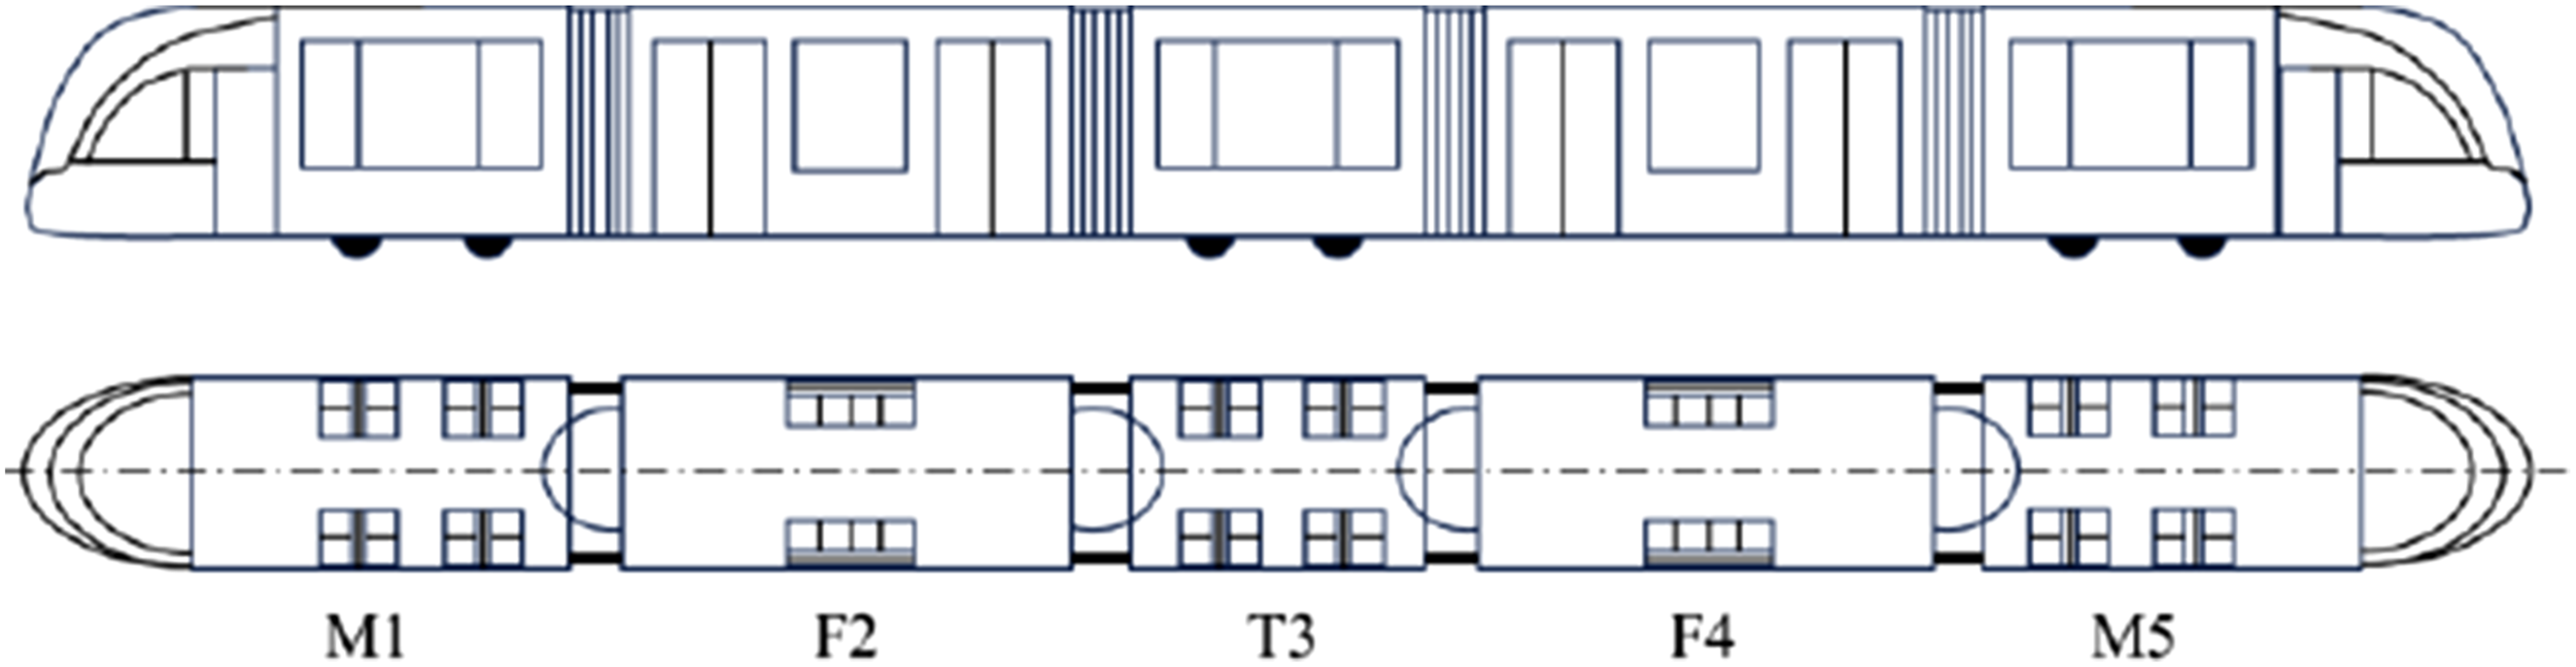
Vehicle dynamics tracking tests were carried out using piezoelectric accelerometers with measurement ranges of 5 g, 18 g, and 100 g, enabling reliable detection of both low-frequency bogie modal responses and high-frequency gear-mesh excitations. The vibration signals were collected using a mobile data acquisition system with a sampling frequency of 5 kHz, ensuring high-resolution dynamic measurements. The accelerometers were mounted using threaded studs and adhesive bases to ensure rigid coupling with the measurement surfaces. As the bogie of module M1 exhibited representative abnormal gearbox vibrations and contained a complete traction drive system, it was selected as the primary object for drivetrain dynamic response analysis. Sensors were installed on key structural components, including the motor, gearbox, axle bridge, and longitudinal beam. Within the gearbox, sensors were arranged at each gear stage, while the axle bridge and longitudinal beam were instrumented at their central sections.
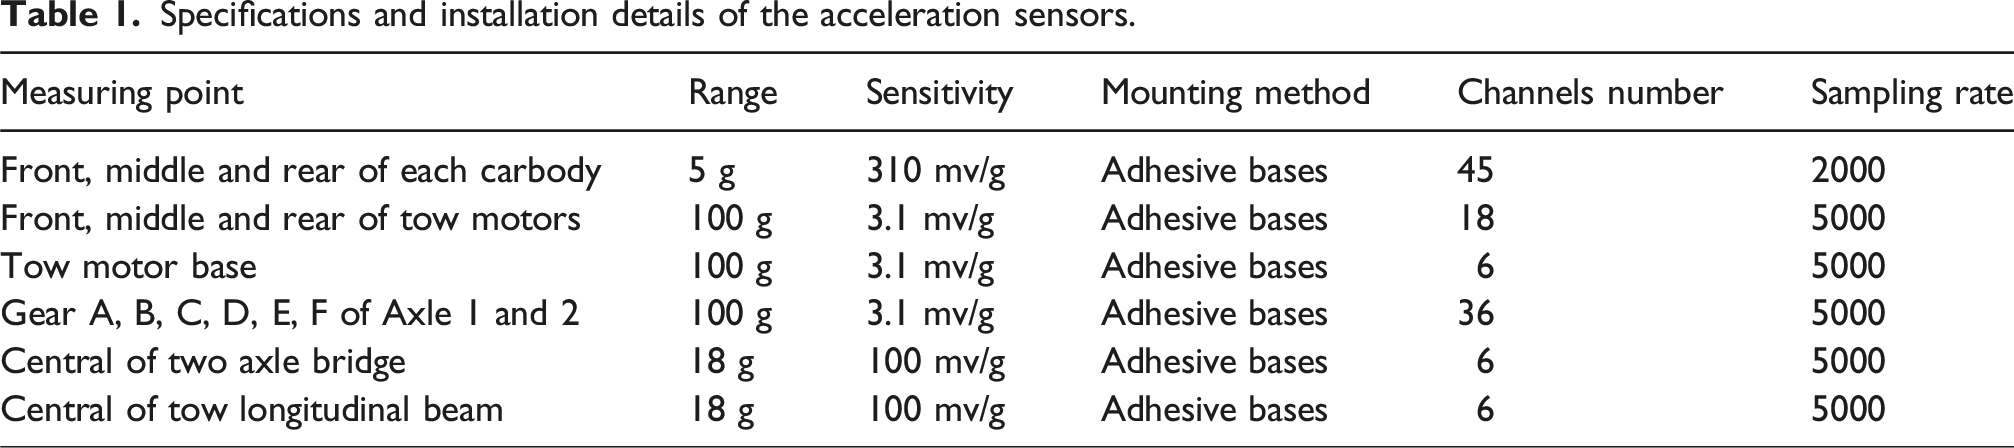
Figure 3 shows the layout of representative measurement points on bogie position 1 (marked by red triangles) together with photographs from the field tests. The sensor configuration on bogie position 2 was symmetrically arranged relative to position 1, resulting in a total of 24 structural measurement points. These sensors recorded vibration responses in the longitudinal, lateral, and vertical directions during vehicle operation, enabling synchronous monitoring of excitation sources, transmission paths, and structural responses, thereby facilitating identification of abnormal vibration propagation mechanisms. The specifications and installation details of the accelerometers are summarized in Table 1. Due to the focus of the experimental analysis on gearbox-related higher-frequency excitations, no dedicated low-frequency spectral analysis was performed in this study. Measurement points in tracking test for power bogie: (a) Schematic diagram of acceleration measuring points; (b) actual measuring points of motor and gearbox. Specifications and installation details of the acceleration sensors.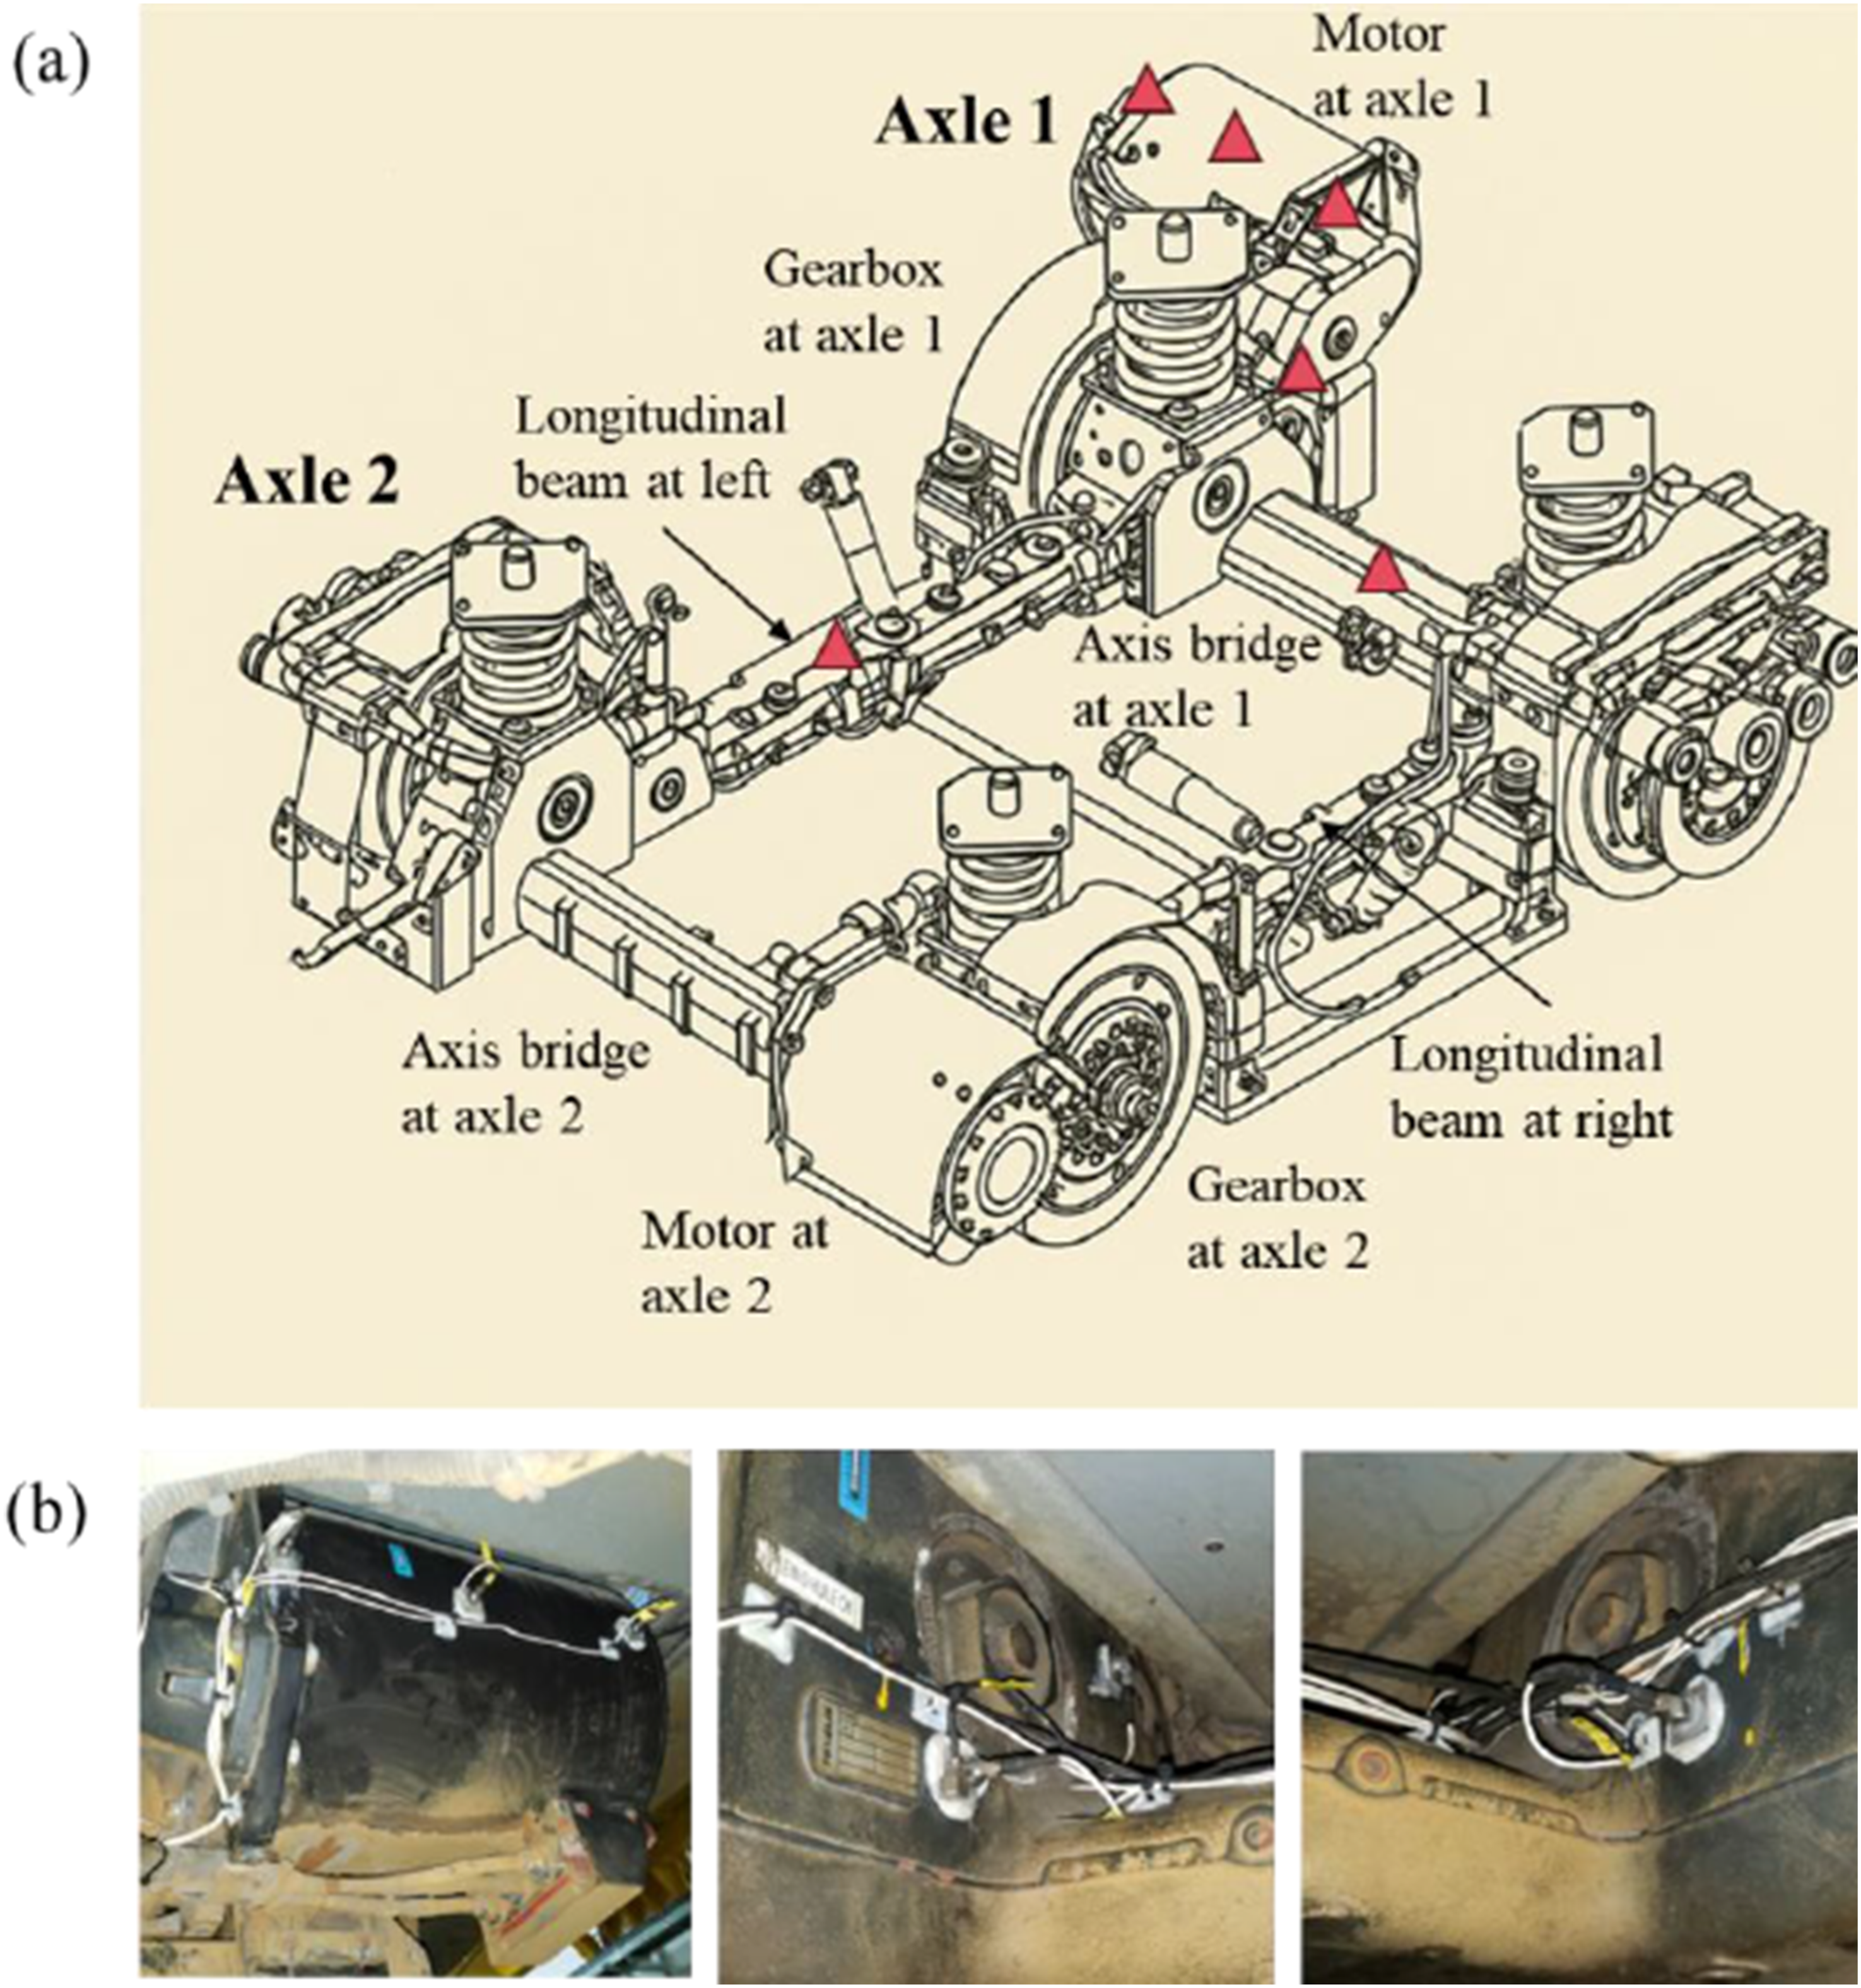
Furthermore, to evaluate the impact of abnormal vibration on vehicle operational performance, accelerometers were installed inside the passenger compartments of each module. This arrangement was based on the technical standard GB 5599-2019: Evaluation Criteria for Ride Quality of Urban Rail Transit Vehicles (GB/T 5599-2019), enabling calculation of vehicle running stability indices and assessment of the influence of gearbox vibration on the overall dynamic performance of the tram.
2.2. Vehicle status analysis
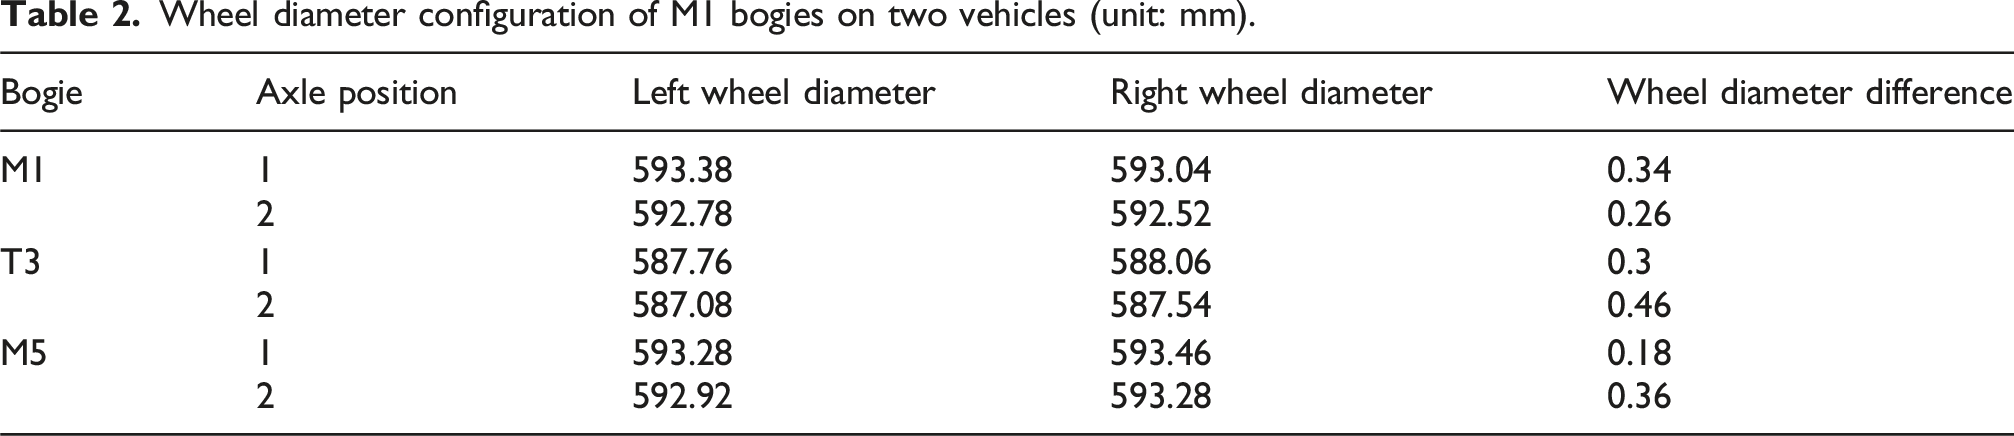
Wheel diameter configuration of M1 bogies on two vehicles (unit: mm).
According to the configuration of the vehicle’s transmission system, this type of tram adopts a two-stage gear transmission structure. The power path is illustrated in Figure 4. The traction motor serves as the power source, transmitting torque sequentially through gears A, B, C, D, E, and finally to gear F, which is directly connected to the driven wheelset. In this setup, gear A is the motor output gear; gears B through E are intermediate reduction gears housed within the gearbox; and gear F functions as the final drive gear coupled to the wheels. Schematic diagram of the gear transmission system.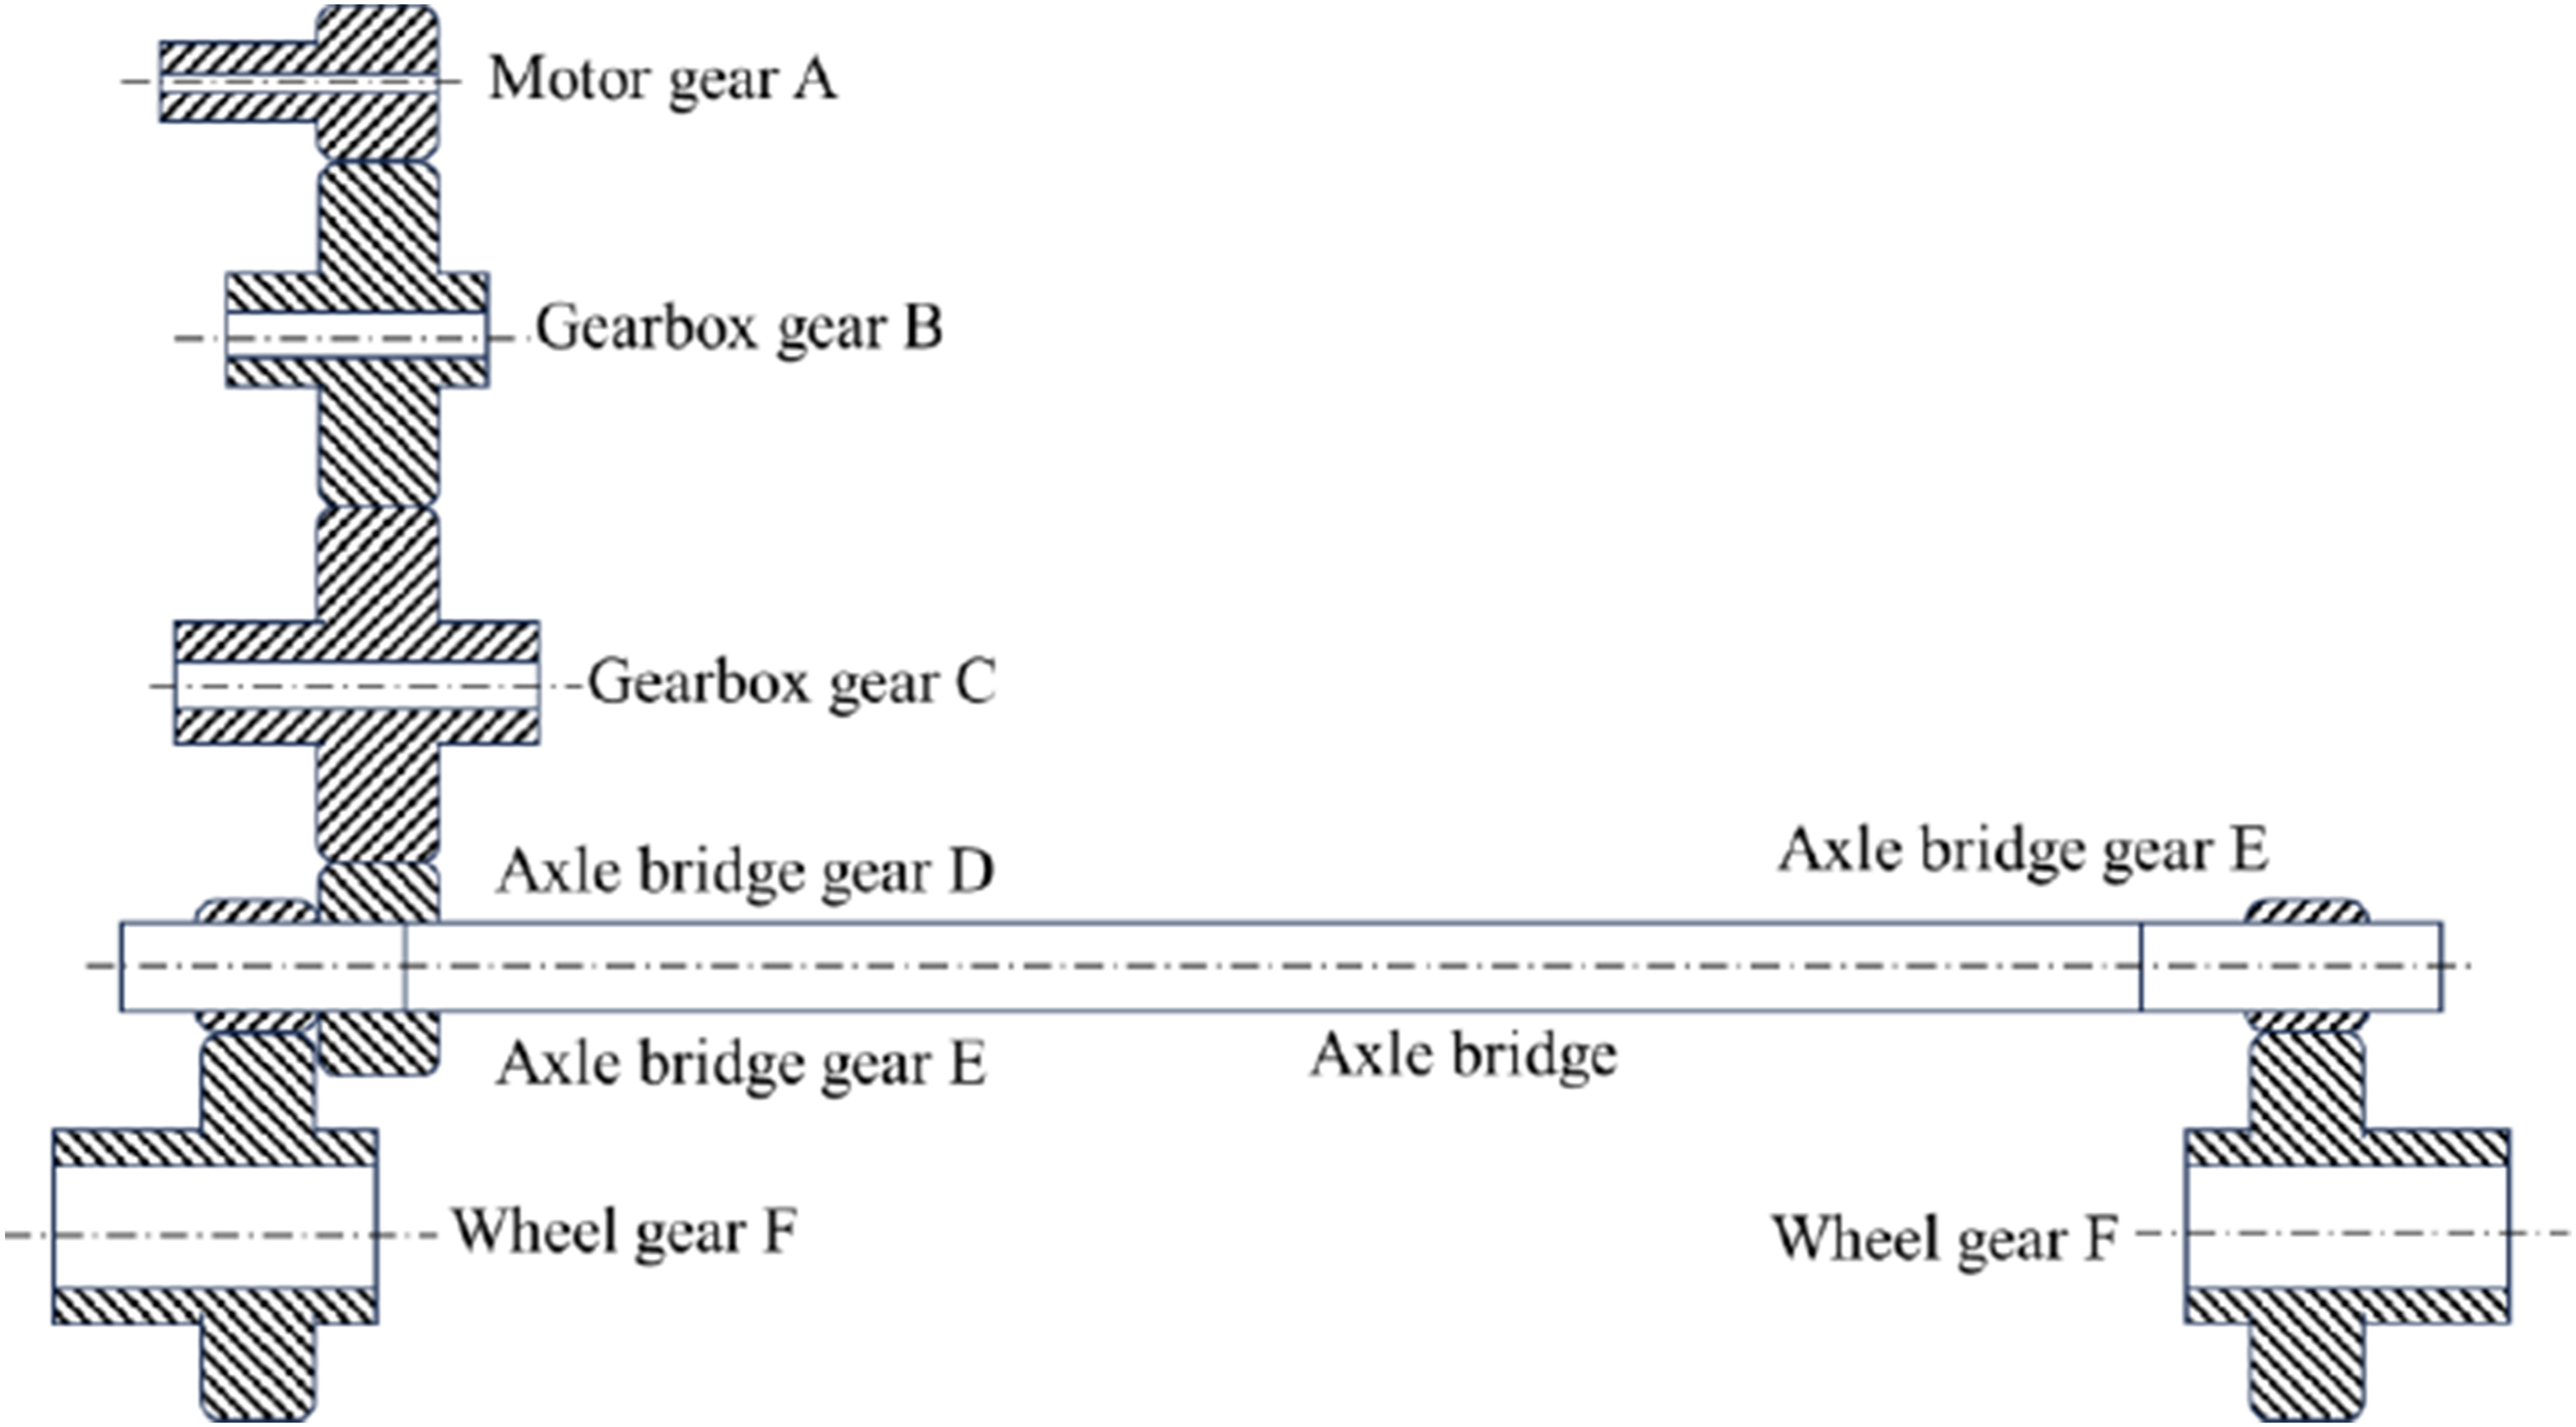
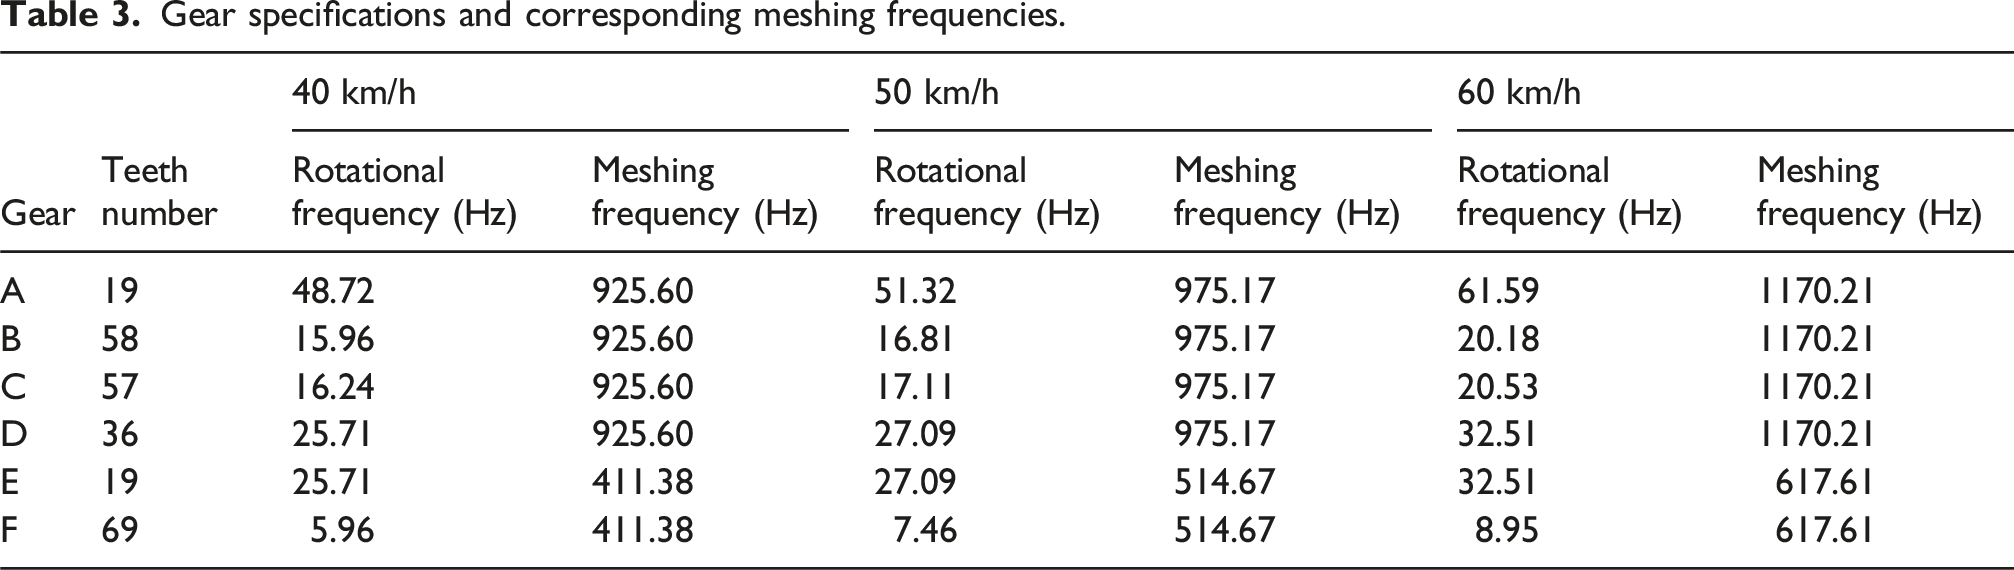
At different operating speeds, each component in the transmission system generates corresponding rotational and meshing frequencies. The wheel rotation frequency is directly proportional to the vehicle speed. After the wheel rotation frequency is determined, the rotation frequency of other gears is uniquely determined by the transmission ratio of the gear pair and does not change with the vehicle speed, that is, the transmission ratio is constant. The rotational frequency of the wheelset can be expressed as: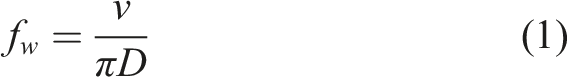
The meshing frequency is essentially a reflection of the relative motion of the gear pair, which is related to the rotational frequency and number of teeth of the active/driven wheels involved in meshing, and the corresponding gear meshing frequencies are given by:
Gear specifications and corresponding meshing frequencies.
3. Vibration characteristics analysis
3.1. Acceleration response analysis
To investigate the abnormal vibration characteristics of the gearbox system during operation, acceleration responses at key structural locations were analyzed from multiple perspectives, including overall vehicle response, local vibration behavior, speed influence, and spatial distribution of vibration energy.
Acceleration signals were collected from multiple measurement points during vehicle operation. Figure 5 shows the time-domain responses of three-directional acceleration and train speed at the measurement point on gear C. The results indicate that the lateral and vertical vibration components were significantly stronger than the longitudinal component. During high-speed operation, the acceleration levels generally exceeded 20 g, while the lateral acceleration reached peak values of approximately 60 g, indicating strong dynamic excitation in the gearbox structure. Time-domain acceleration signals in three directions at gear C.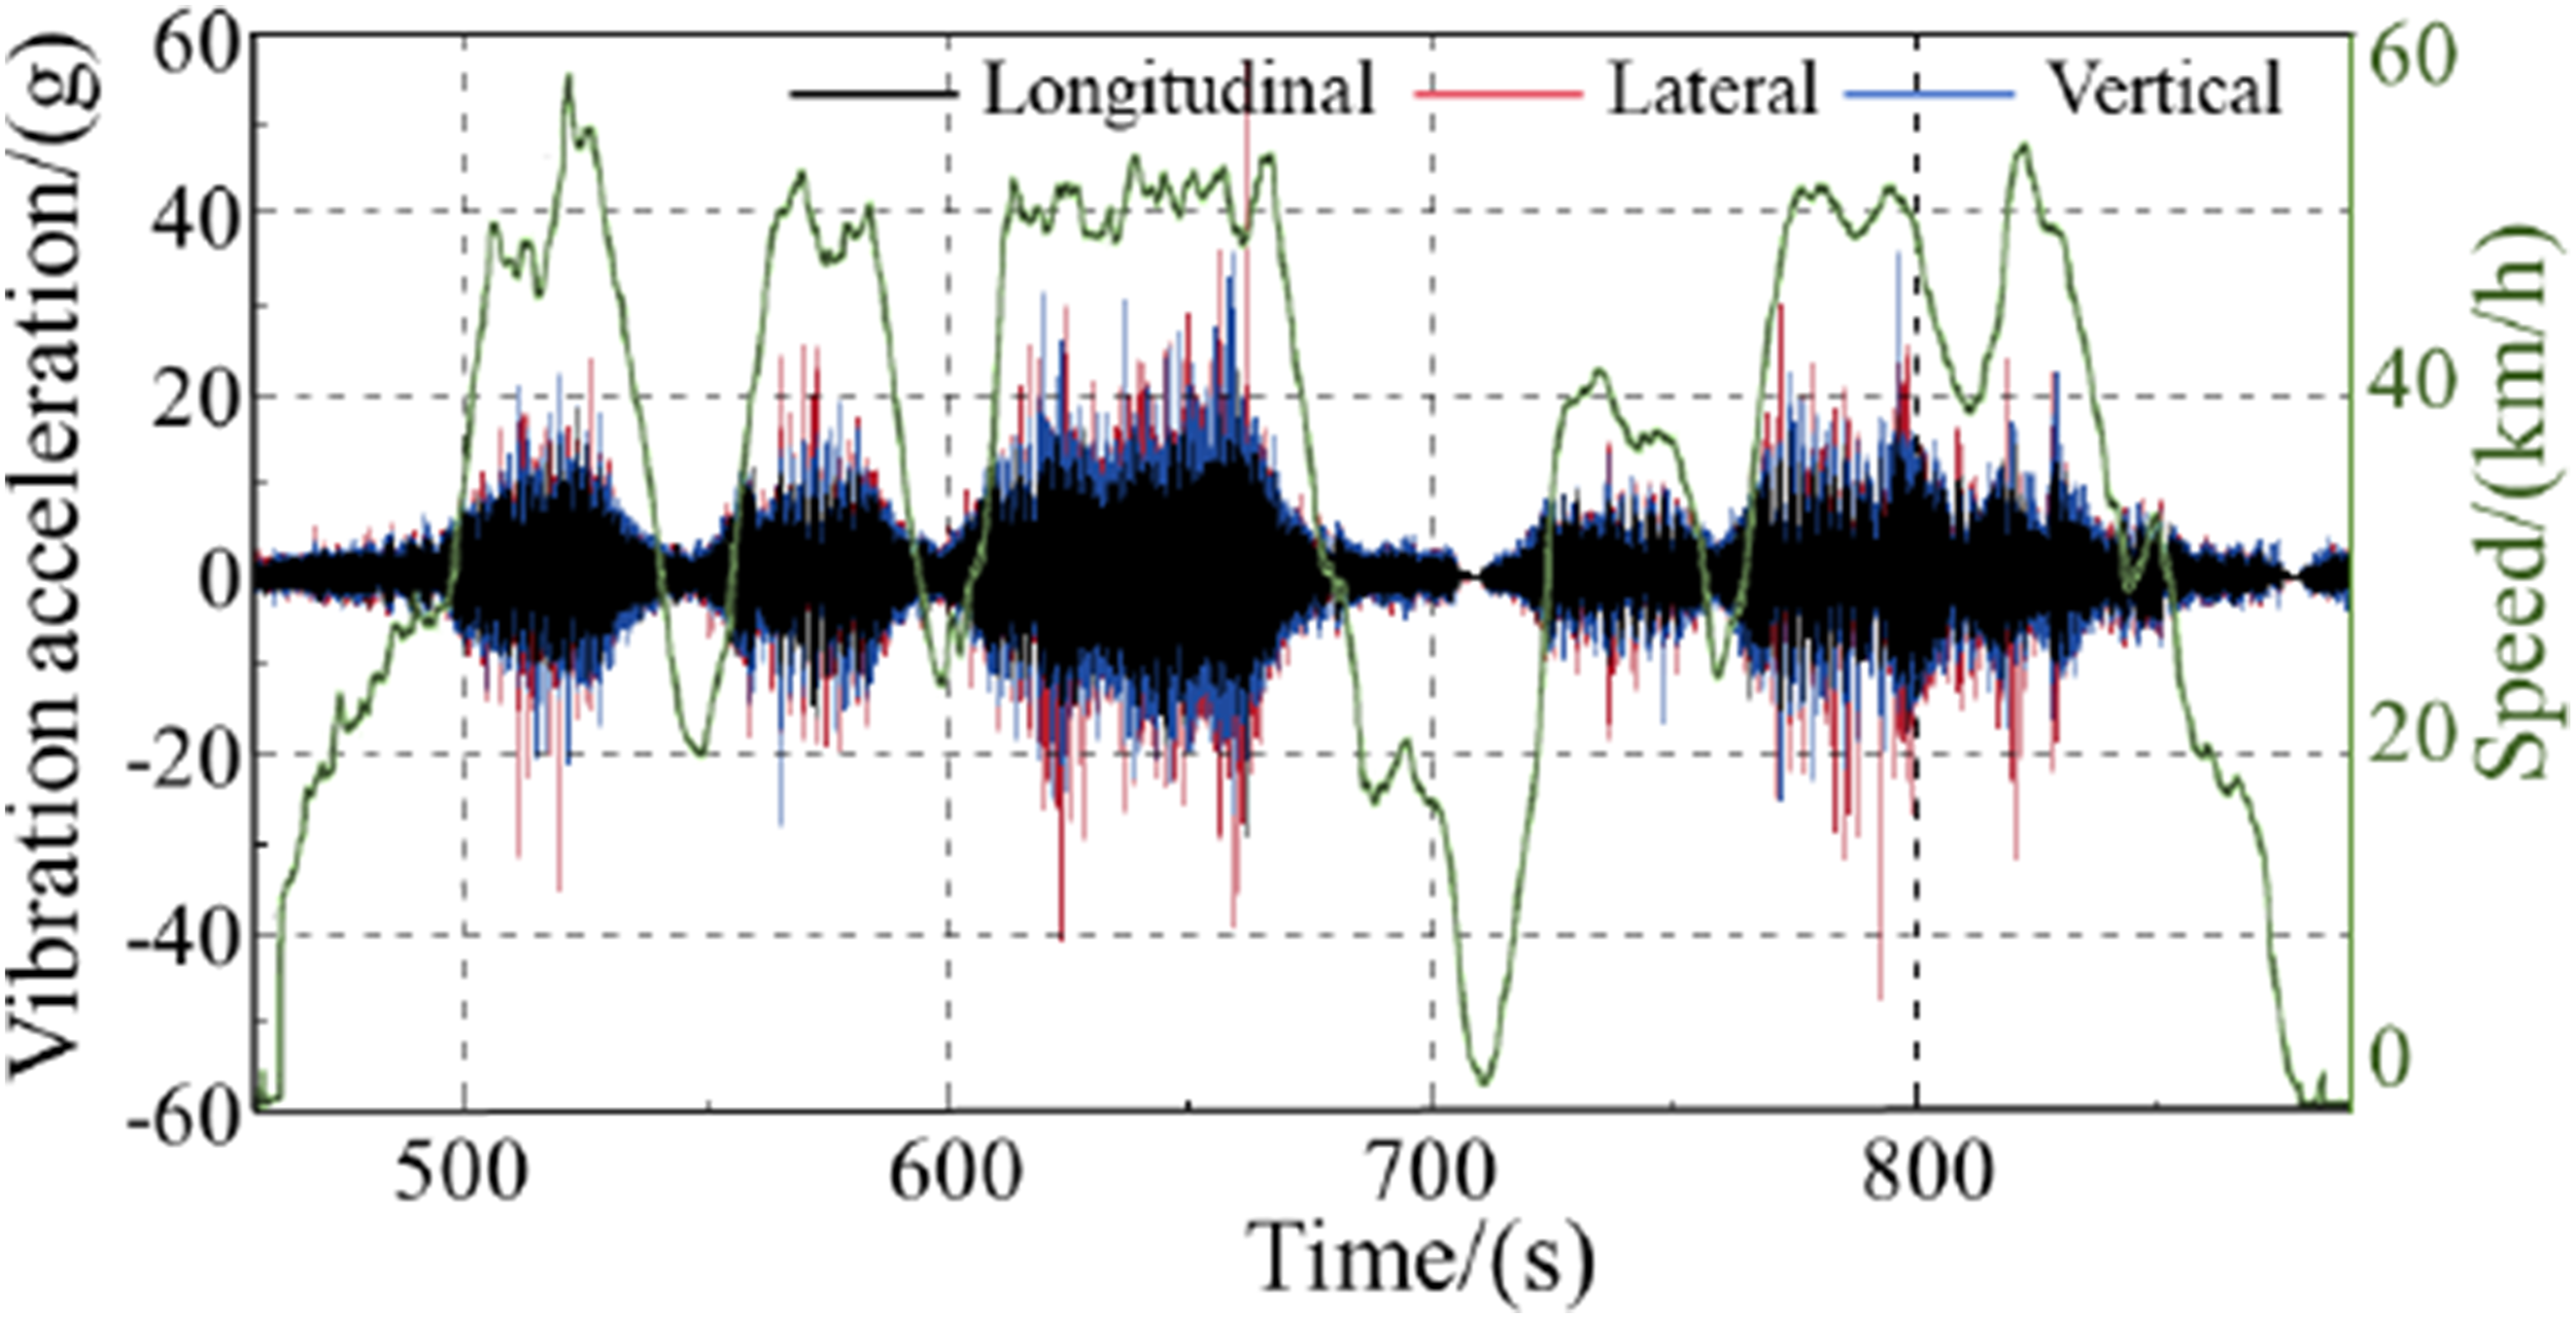
Although such peaks are mainly associated with transient vibration responses caused by irregular gear meshing, repeated exposure to high vibration levels may increase cyclic stresses in gearbox components and potentially lead to fatigue damage, loosening of mechanical connections, and accelerated wear of drivetrain components. Therefore, identifying abnormal vibration characteristics is essential for improving the reliability and maintenance strategy of tram gearbox systems. To further evaluate the vibration characteristics across structural regions, representative interstation segments were selected for statistical analysis. The median values of three-directional max acceleration at each measurement point were calculated, and the results are shown in Figure 6. A comparison of results across different measurement points reveals that high-intensity vibration was mainly concentrated at the motor base (M-base) and gear stages B, C, and D, which are located near the motor. Notably, the motor base exhibited the strongest lateral vibration, with a median peak value reaching 50 g. Median of three-directional max acceleration at key structural locations.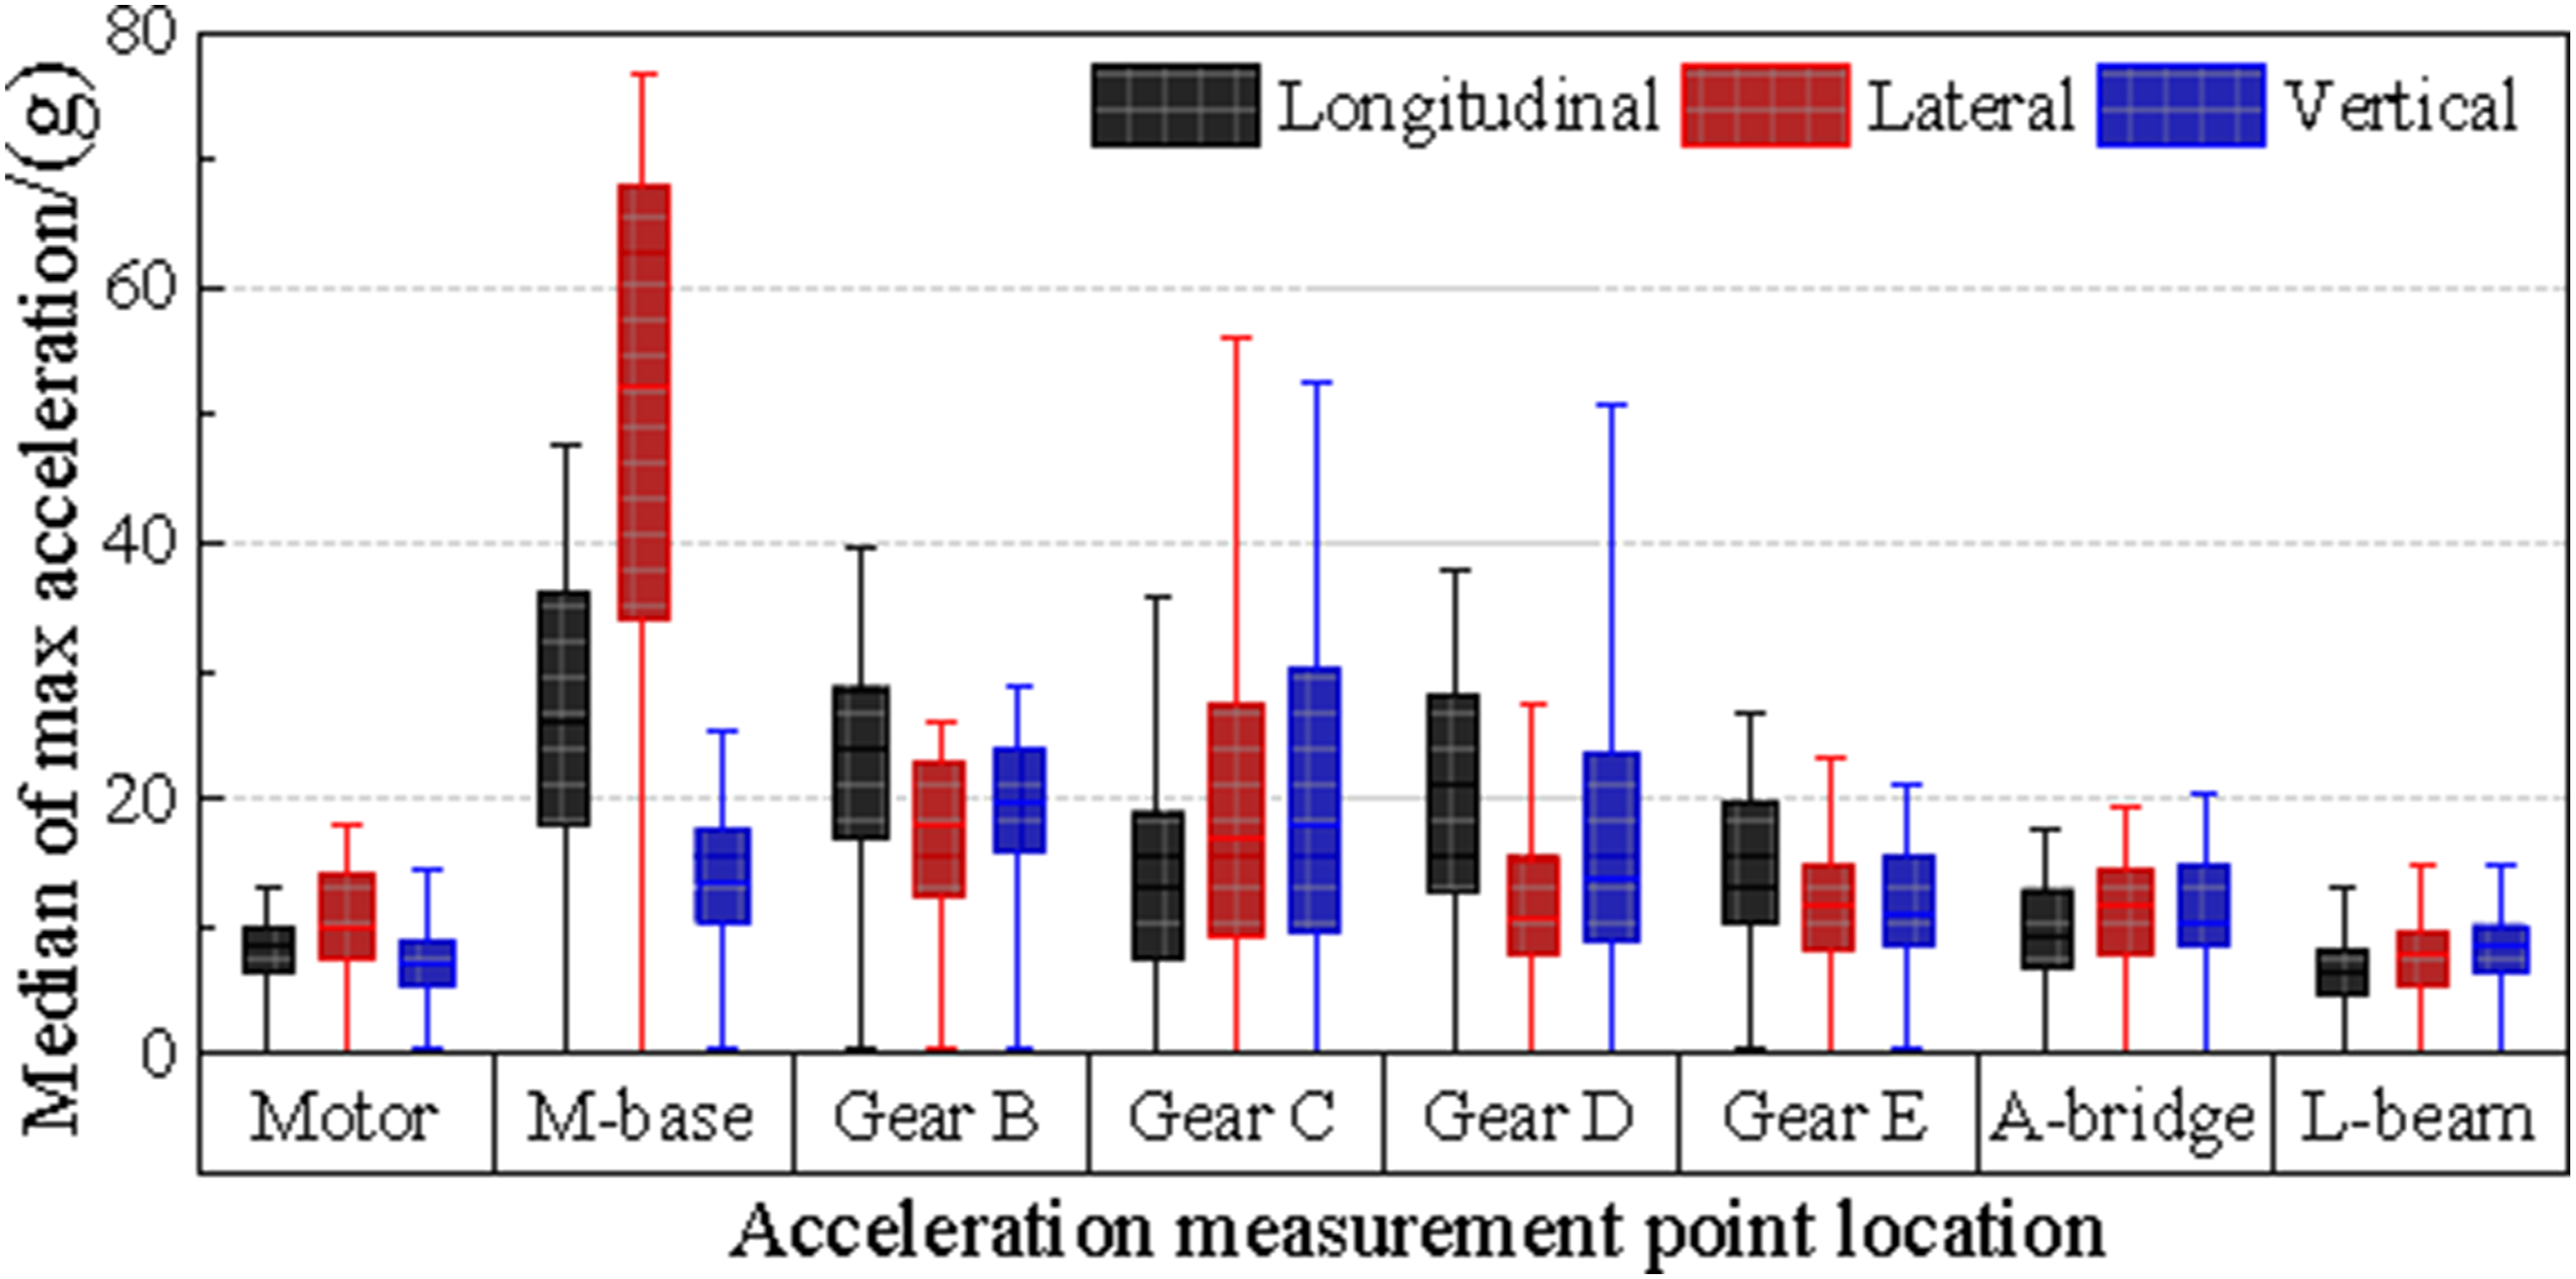
Although vibration energy generally attenuates along the transmission path, the measured vibration amplitude at a specific location depends strongly on the structural dynamic characteristics. The motor base may be located near the anti-node of a structural vibration mode, resulting in resonance amplification when the excitation frequency approaches the natural frequency of the structure. Therefore, even though the excitation originates from the gearbox, higher vibration amplitudes may appear at the motor base due to local structural resonance and low-damping characteristics. In contrast, the motor body, the gear E (farther from the motor), the center of axle bridge (A-bridge), and longitudinal beam (L-beam) showed relatively low vibration levels, with median peaks below 20 g and minimal directional differences, indicating that these areas were less affected by strong excitation transmission. To distinguish sporadic impact events from sustained vibration levels, percentile statistics of the acceleration amplitude were calculated, and values remain significantly lower than 60 g, indicating that the extremely high acceleration occurs only as a short-duration transient event rather than representing the typical vibration level of the system.
These findings suggest that vibration responses are primarily concentrated along the power transmission chain from the motor to gear D, forming a localized excitation path. In particular, the lateral vibration was significantly amplified, implying that the interface between the motor and the motor base may serve as a critical energy coupling point. This interface is likely the main entry point for fault-induced excitation and thus warrants special attention regarding its structural stiffness and connection integrity.
3.2. Vehicle stability analysis
To evaluate the impact of abnormal vibration on the vehicle’s ride quality, a time-frequency analysis was performed using STFT based on acceleration data collected from the carbody measurement points (Qi et al., 2023; Shi et al., 2018). In the vibration signal processing procedure, the raw acceleration signals were collected during on-line operation were segmented into 5 s intervals in time histories, corresponding to approximately steady-speed conditions (Qi, Luo, et al., 2026; Qi, Wang, et al., 2026). For each segment, fast Fourier transform (FFT) analysis was performed to obtain the frequency spectrum. Then, the characteristic vibration indicators were then extracted, including root mean square (RMS) acceleration, dominant frequency components. By conducting STFT analysis on the vibration acceleration of each measuring point, its time-frequency characteristics can be obtained, and Figure 7 shows the results of gears B, C, D and the motor base. The horizontal axis denotes running time, while the vertical axis shows frequency. The color scale represents the relative energy intensity, where darker shades correspond to stronger vibration energy, thereby visualizing the frequency components and intensity of the gearbox’s abnormal vibration. Time-frequency spectrogram of lateral acceleration: (a) Gear B; (b) Gear C; (c) Gear D; (d) Motor base.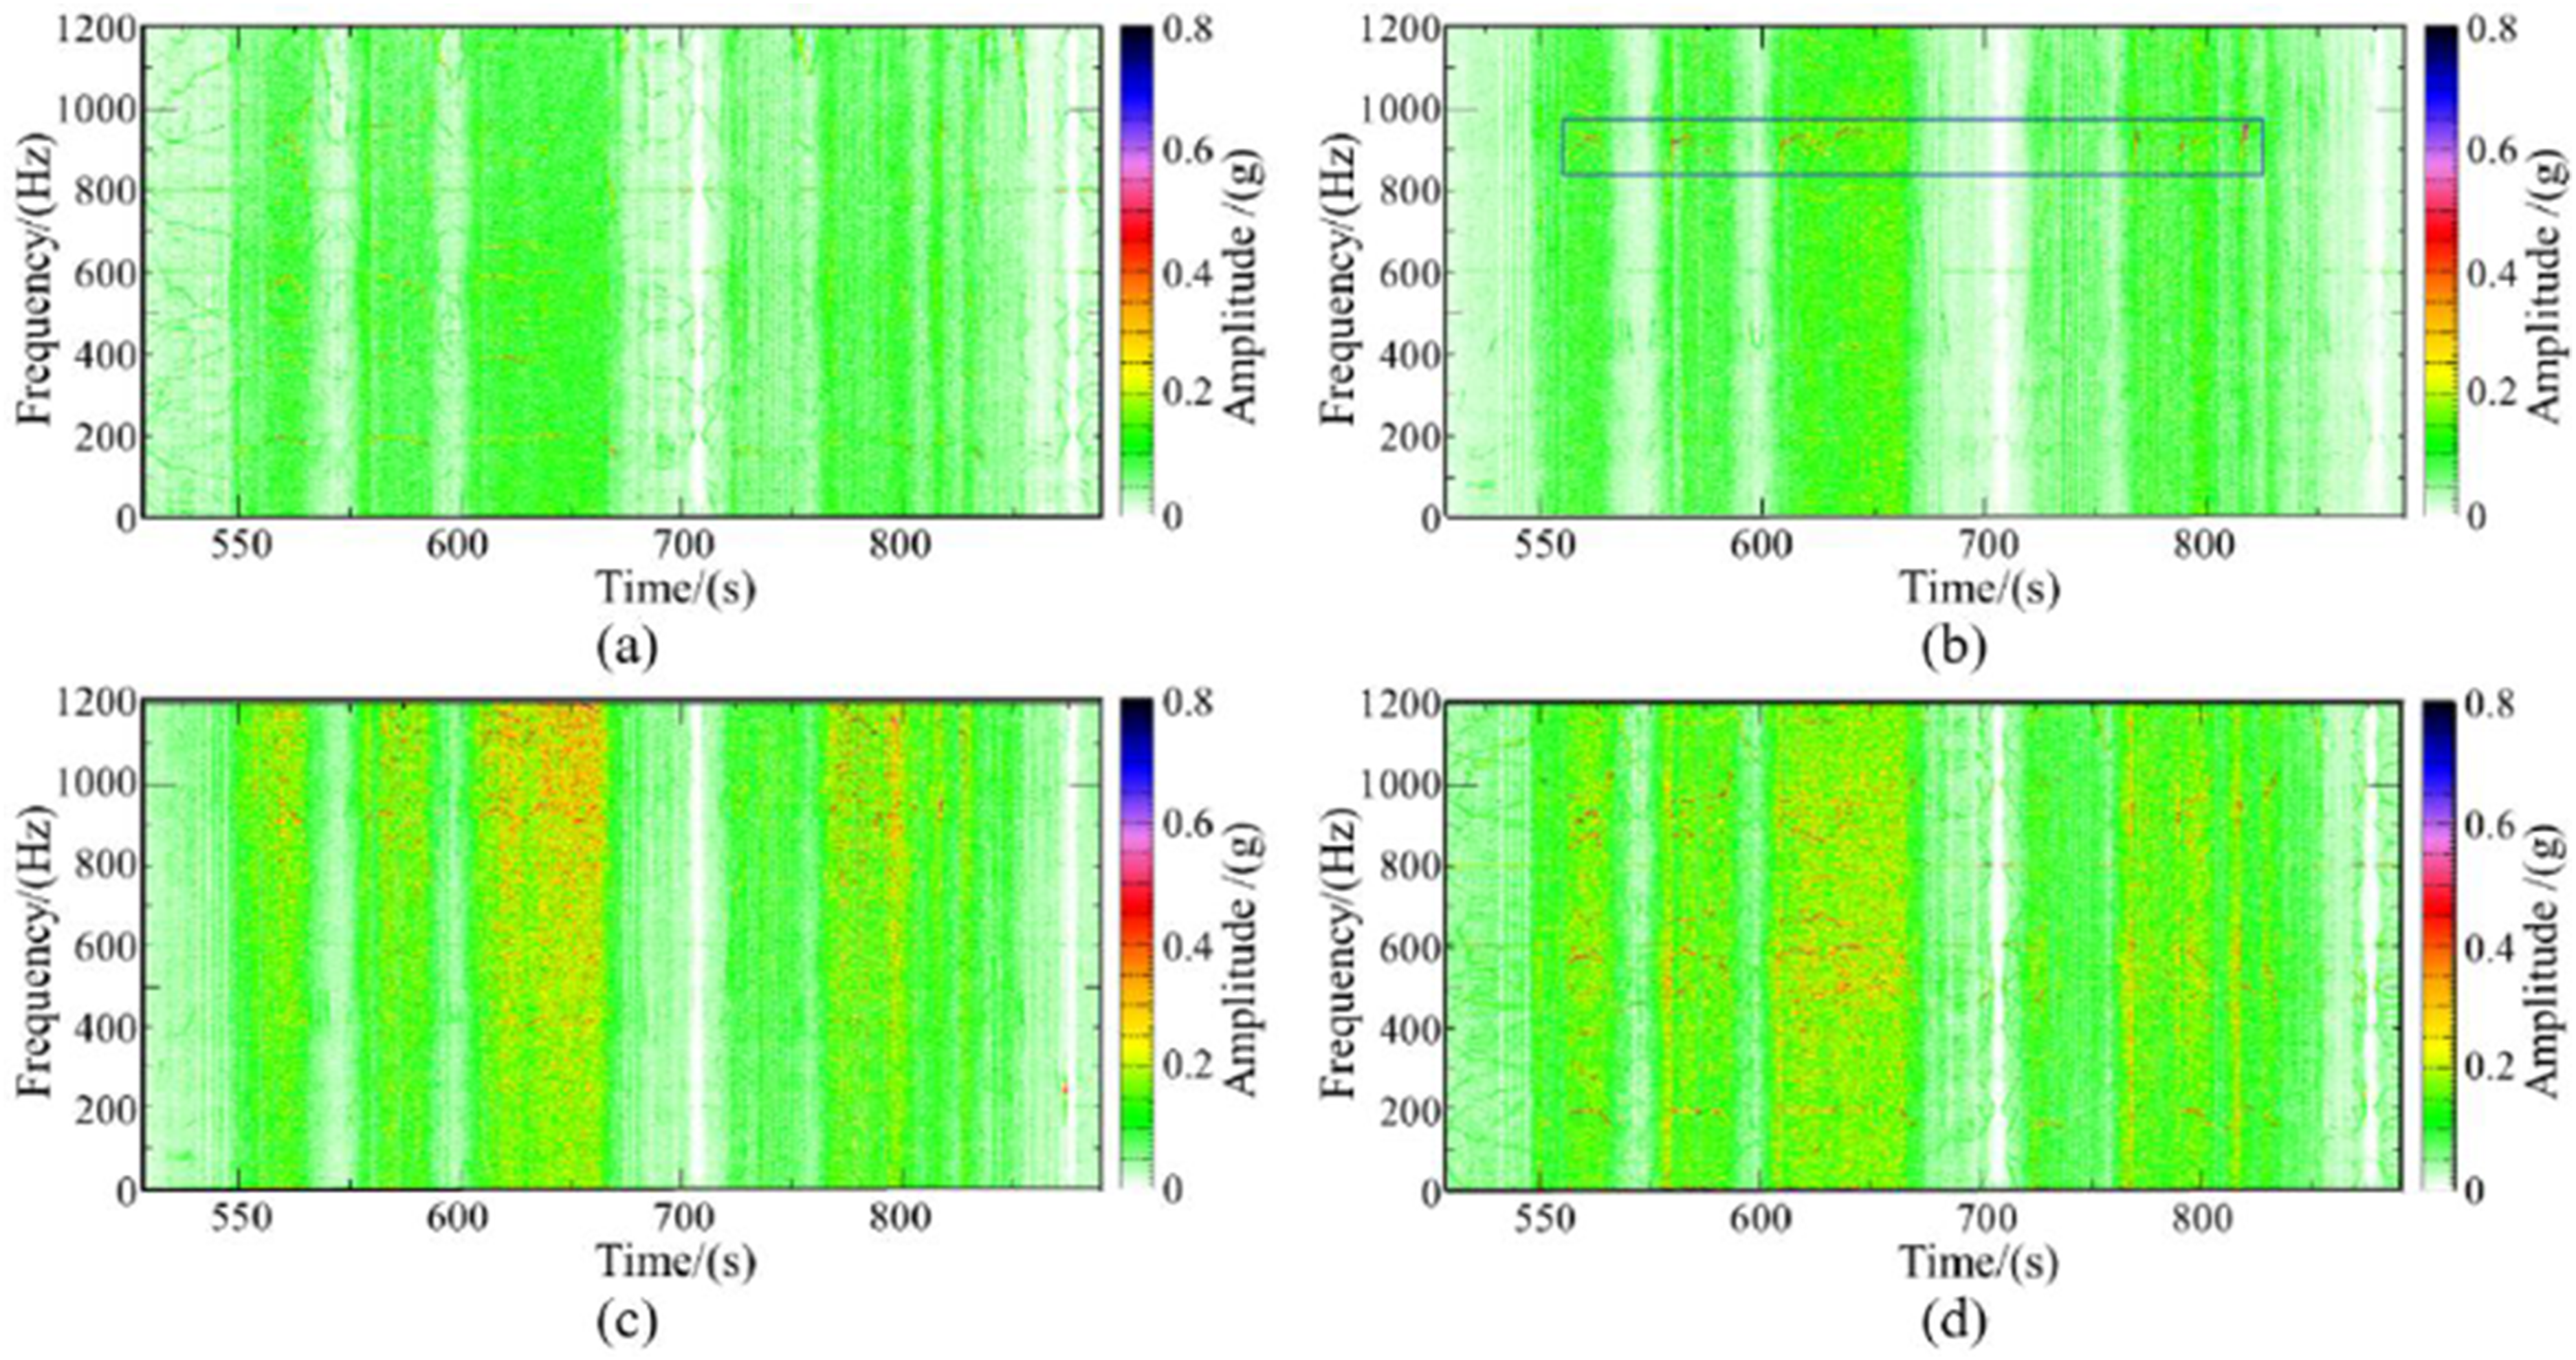
In Figure 7(b), it can be observed that a pronounced energy band appears around 960 Hz during the vehicle acceleration process in gear C. This band corresponds to the theoretical meshing frequency between gear B and C within the speed interval of approximately 50 km/h. Due to speed fluctuations during the analyzed time window and the limited frequency resolution of the STFT, the observed frequency band appears slightly lower than the theoretical instantaneous value, 975.17 Hz. This band shows a distinct linear growth trend with running speed, indicating a speed-excited resonance phenomenon. It can be observed that the dominant frequency components at the motor base are highly consistent with the gear meshing frequency and its modulation sidebands identified at the gearbox measurement points. In particular, the presence of similar sideband structures around the meshing frequency indicates a strong dynamic correlation between the two locations. Considering the mechanical connection between the gearbox and motor base, these results suggest that the gearbox excitation is a primary contributing source of the motor base vibration. Notably, the vibration intensity at this frequency increases significantly near 50 km/h, suggesting that resonance amplification becomes dominant under medium-to-high speed operation. In addition, the sideband structures with spacing of approximately 16.5 Hz are clearly visible around the main meshing frequency. These sidebands correspond to the rotational frequency of gear B, confirming the presence of modulation effects induced by local gear faults. Such modulation not only introduces additional frequency components but also amplifies vibration energy transmitted to the gearbox housing.
According to the GB 5599-2019 standard (GB 5599-2019, 2019), the lateral ride quality index was calculated using acceleration signals obtained from carbody mounted measurement points. The data were segmented into 5 s intervals, and the following equation was used to evaluate lateral ride quality: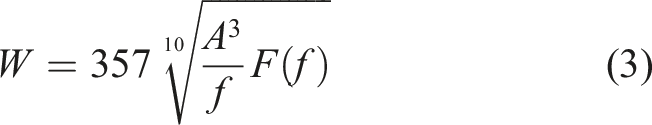
The lateral ride quality indices were computed for the carbody modules M1 and F2. To isolate the influence of gear excitation, a band-stop filter was applied to remove components within the 15∼18 Hz range, effectively excluding vibrations near the 16.5 Hz wheel rotational frequency. The results are shown in Figure 8. It is evident that, prior to filtering, the M1 module exhibited significant deterioration in lateral ride quality at speeds above 40 km/h. At 50 km/h, the lateral index reached 2.68, exceeding the excellent limit of 2.5. After applying the band-stop filter, the ride quality indices for both M1 and F2 modules decreased noticeably throughout the entire analysis window. In particular, the filtered lateral index for M1 dropped to 2.24, thus falling within the excellent range. This confirms that the vibration near 16.5 Hz, associated with the wheel rotational frequency, is the primary contributor to the exceeded ride quality limit and is closely related to gear meshing excitation. Analysis of lateral ride quality index for carbody modules.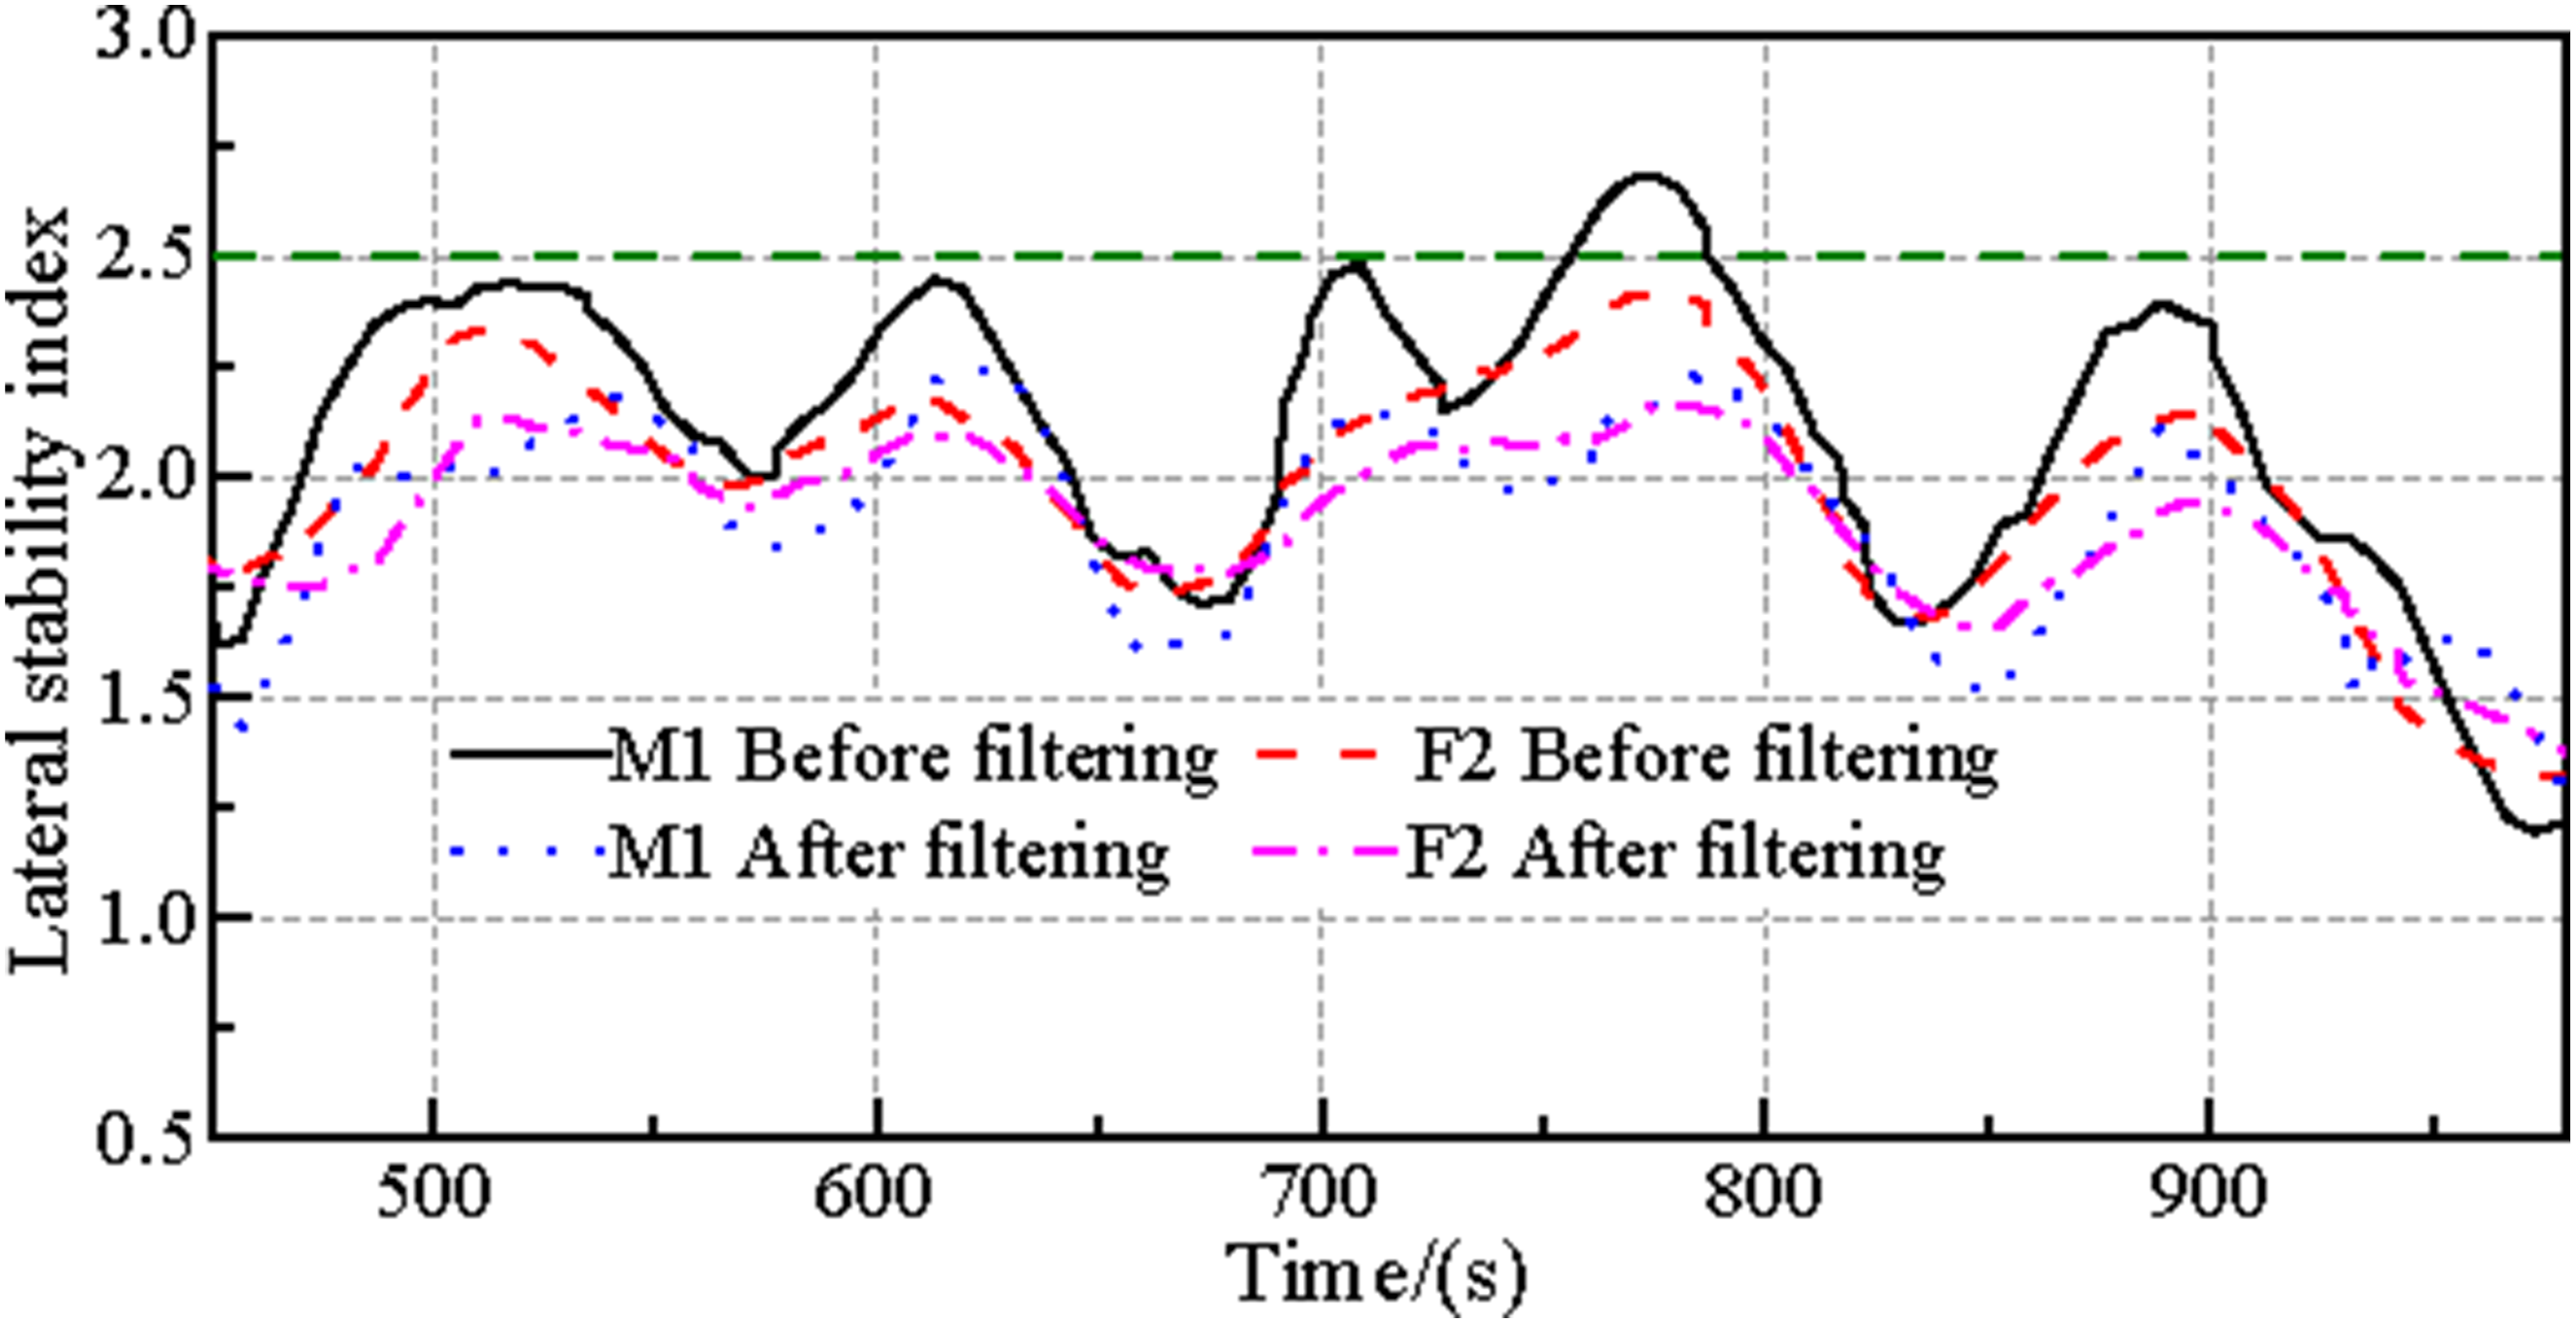
3.3. Vibration amplification effect
Operating speed is a key factor influencing the vibration characteristics and response behavior of the gearbox system. Notably, near the gear meshing frequency of approximately 960 Hz, vibration energy increases significantly with speed. To quantitatively assess the effect of speed, data from representative segments within the 10∼60 km/h range were selected. The root mean square (RMS) values of lateral acceleration were calculated for key component measurement points using a 1 s analysis window with a 1 s step size. Figure 9 presents the statistical results of lateral acceleration RMS values for each key measurement point under varying speed levels, and the variation of RMS values of vibration acceleration at each measuring point based on 10 km/h for every 10 km/h. Statistical values of lateral acceleration RMS at key measurement points under different speeds.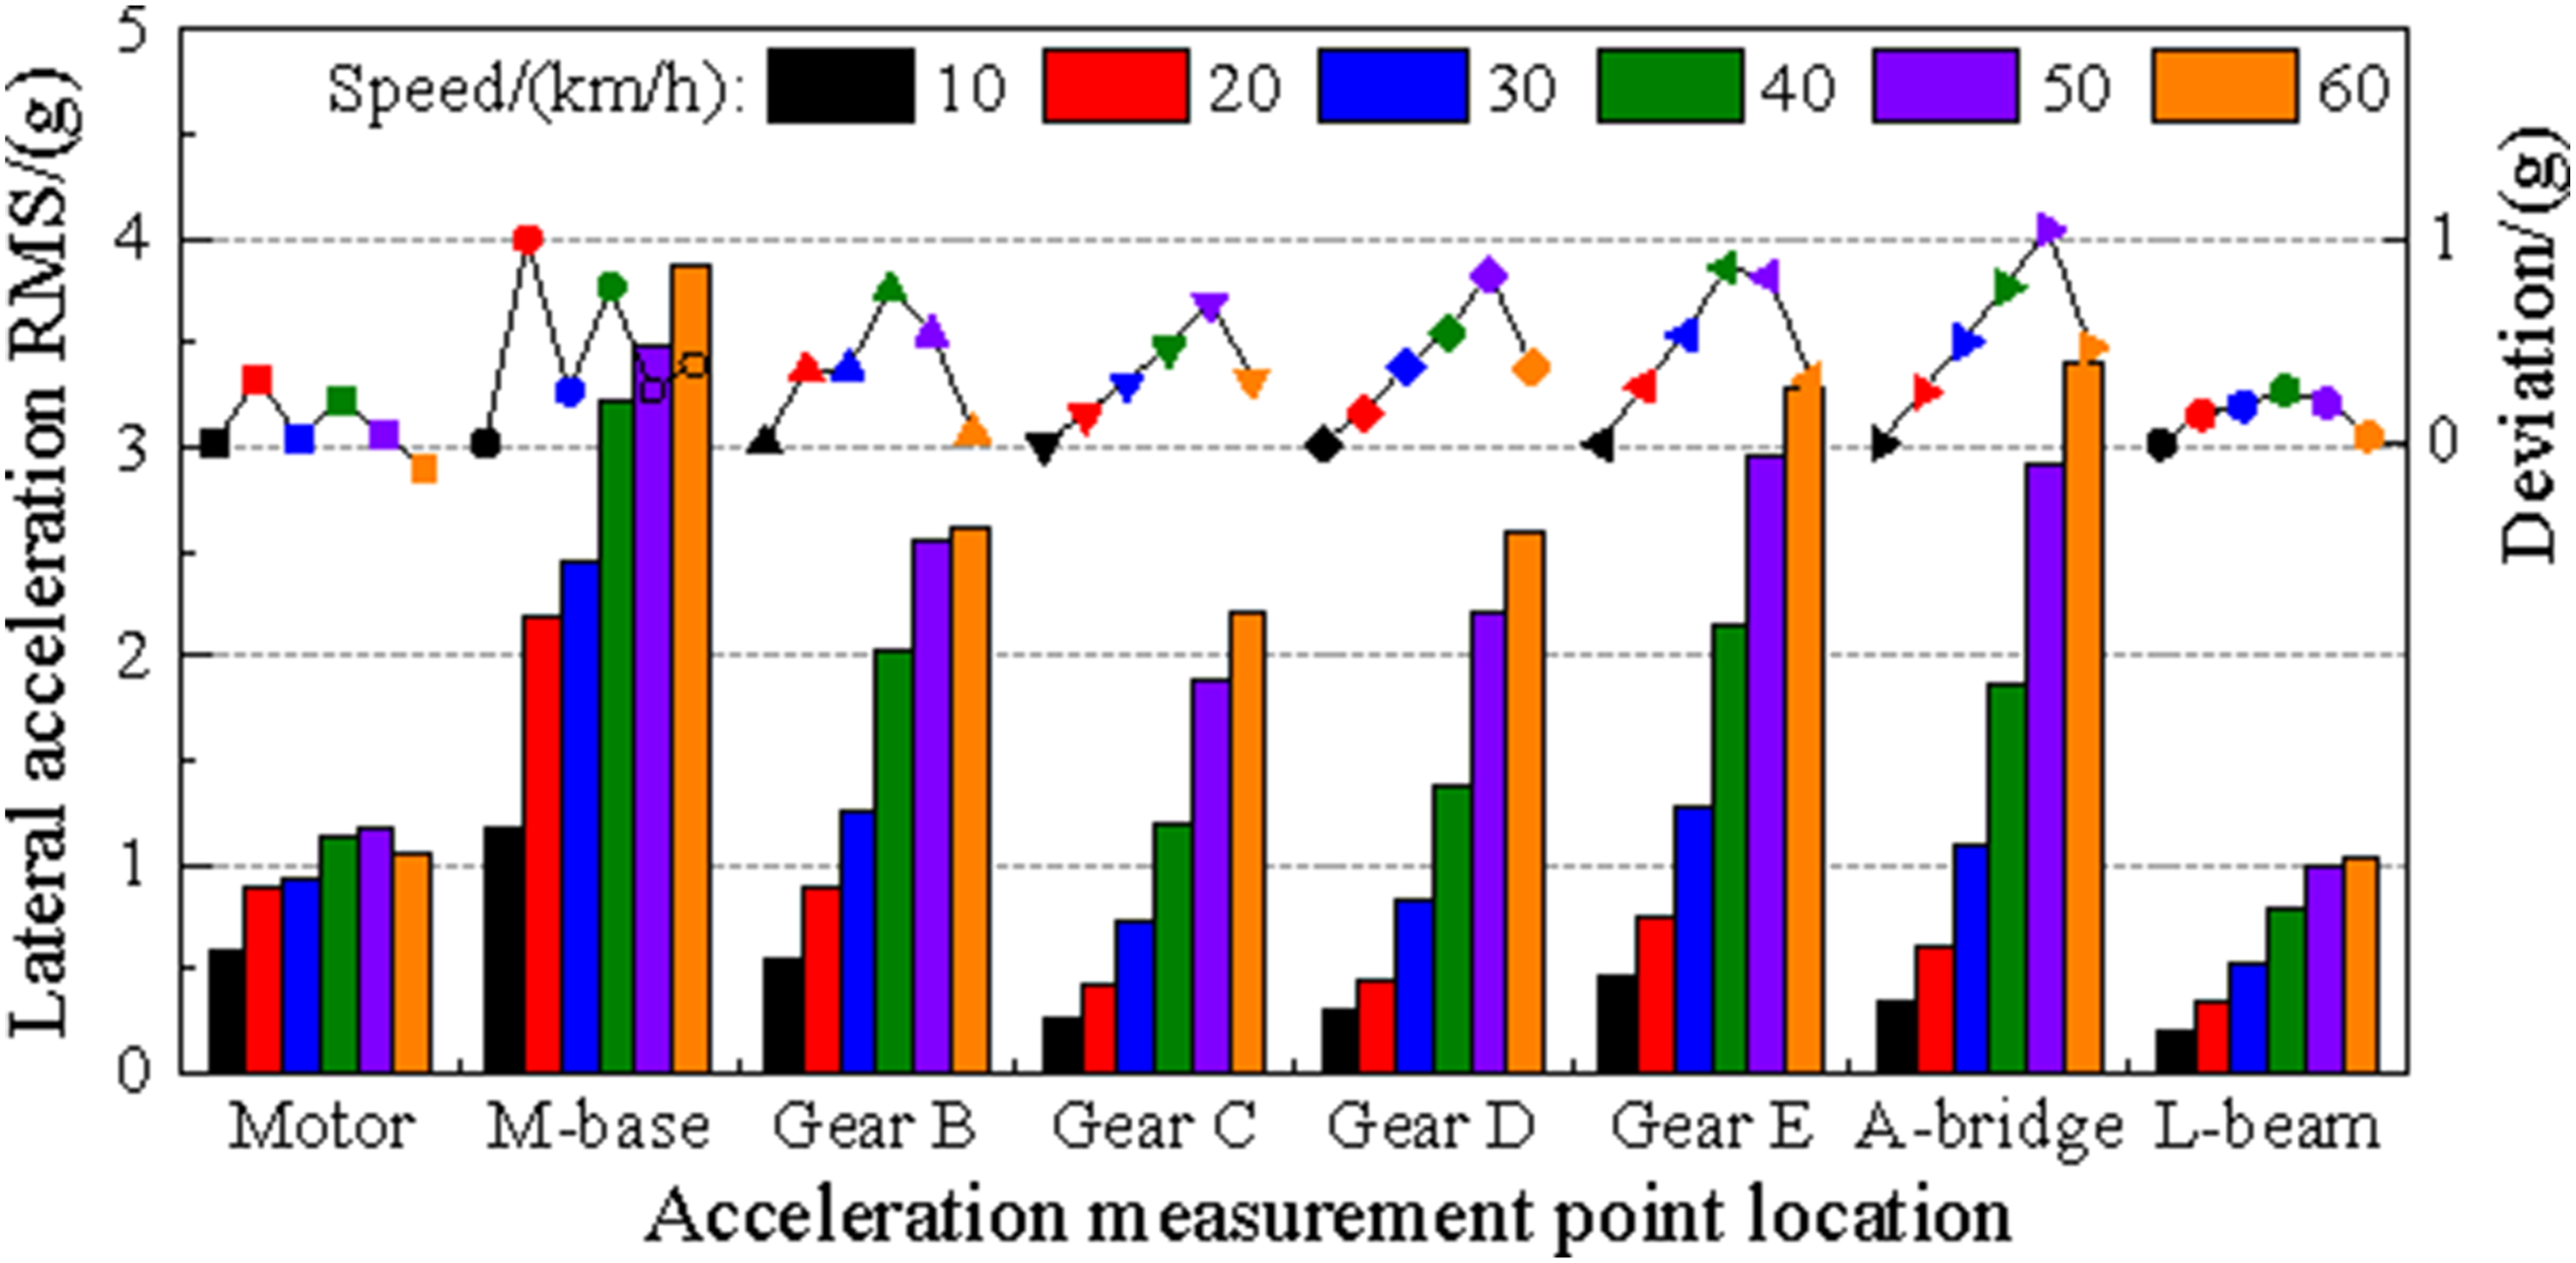
From the bar chart in Figure 9, it is evident that the vibration amplitude of the motor itself exhibits limited variation with speed, with less than a 50% increase at 60 km/h. In contrast, the motor base, gears B, C, D, and the axle bridge show rapid increases in vibration amplitude, with most components experiencing over 200% growth and gear-related vibration increasing by up to 1000%. These results indicate that the original excitation is significantly amplified under high-speed conditions due to resonance with structural modes. The vibration energy becomes highly concentrated along the “motor-gearbox-axle bridge” transmission path, forming a typical speed-induced resonance behavior. This further confirms a strong coupling between the observed vibration anomaly and structural modal characteristics, with the excitation source likely linked to the interface between the motor and motor base. From the influence of speed changes on lateral acceleration, it can be seen that during the process of increasing speed from 10 km/h to 50 km/h, the incremental vibration acceleration on each gear and axle bridge changes significantly with the increase of speed, almost showing a linear growth, indicating its strong sensitivity to speed changes.
4. Structural modal analysis
To investigate the structural vibration characteristics and potential resonance mechanisms of the motor-gearbox-axle bridge drivetrain system during operation, operational modal analysis (OMA) was conducted using vibration data obtained from field vehicle dynamic tracking tests. Since the operational excitation sources are unknown and broadband in nature, the random decrement technique (RDT) was employed to extract representative free-decay responses from the measured acceleration signals (Cole, 1973). The extracted signals were subsequently used for modal parameter identification using the LMS PolyMAX algorithm, while the stabilization diagram (SD) was used to determine stable modal poles and ensure reliable modal identification (Peeters and Roeck, 2001). The identified modal parameters include natural frequencies, damping ratios, and corresponding mode shapes.
The measurement layout is shown in Figure 10(a). A total of 20 accelerometers (P1∼P20) were installed across the drivetrain structure, including the motor housing, motor base, gearbox, axle bridge, and longitudinal beam. Specifically, P1∼P3 were located on the motor body, P4 on the motor base, P5 and P6 near the shafts of gears B and C. Measurement points P7∼P10 were distributed on the axle bridge and longitudinal beam, while the remaining sensors were symmetrically arranged on the opposite side of the structure. Considering the expected rotational frequency range of the drivetrain components, the modal analysis frequency band was limited to 0∼30 Hz to capture potential coupling between wheelset rotational frequencies and low-order structural modes of the supporting components (Shi et al., 2020, 2023). Characteristic mode shapes of power bogie: (a) Modal test measurement points on bogie LMS model; (b) vibration shape of three modes (Modal A, B, C).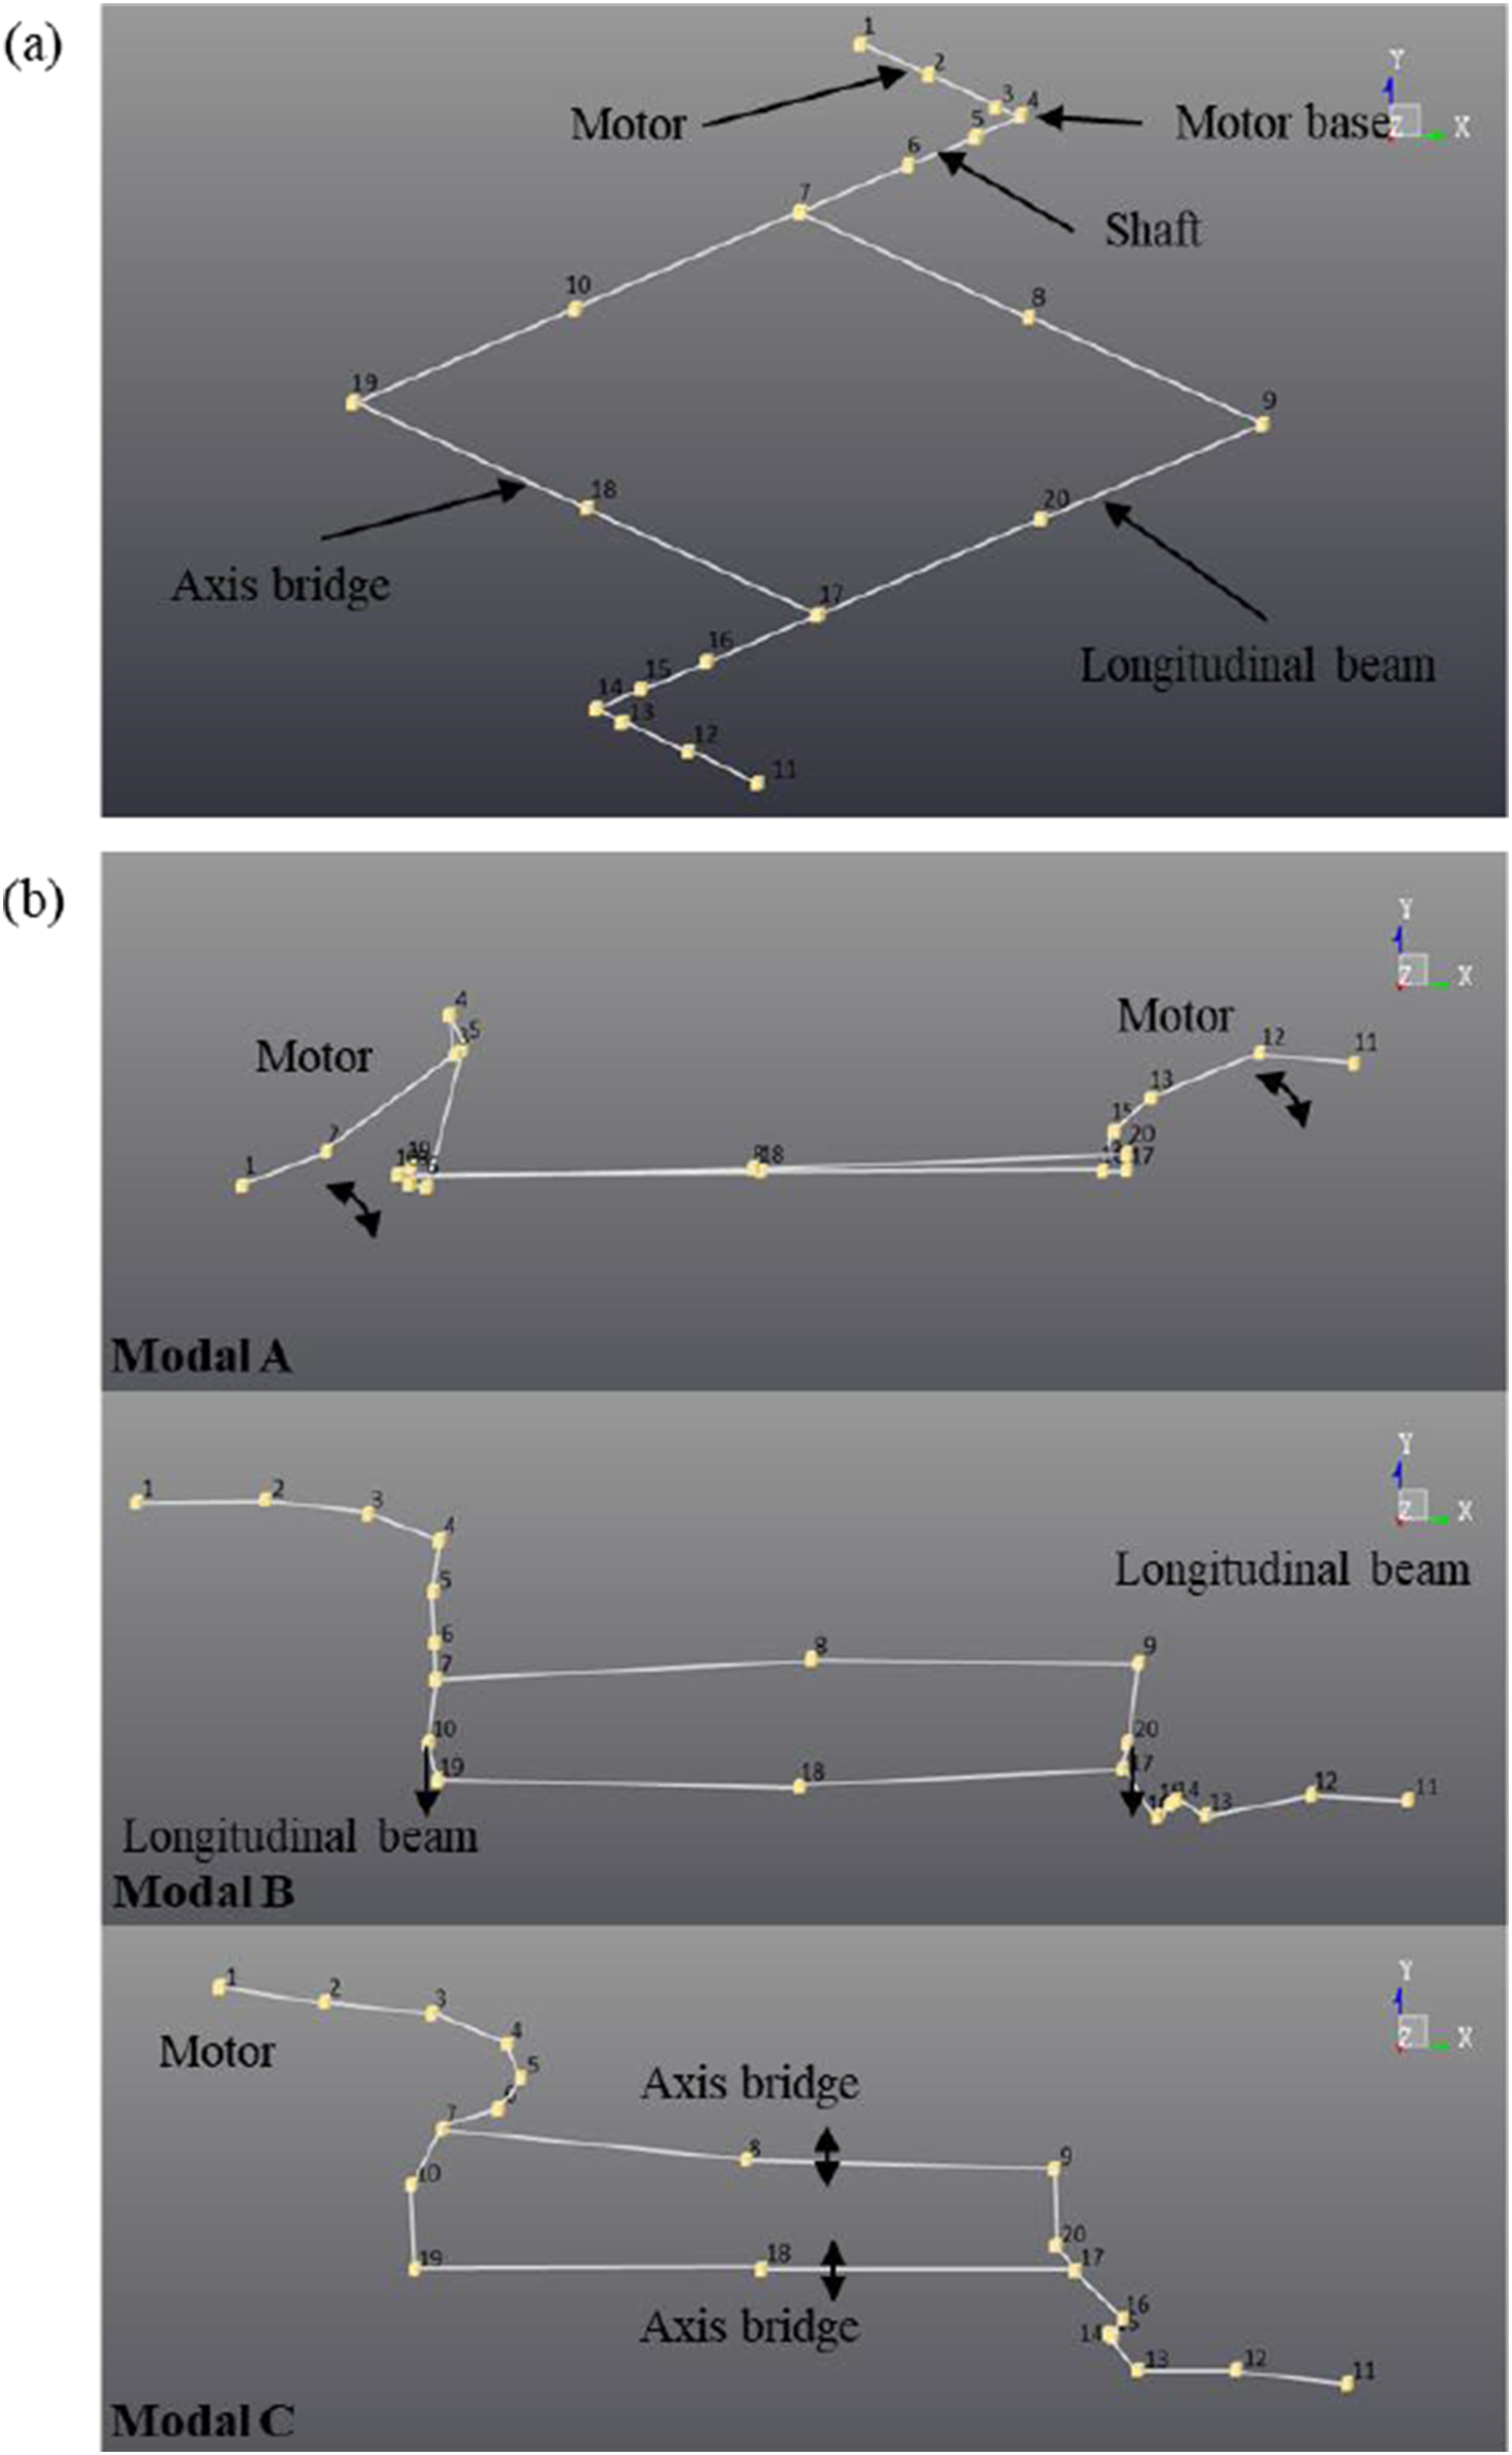
Gear specifications and corresponding meshing frequencies.
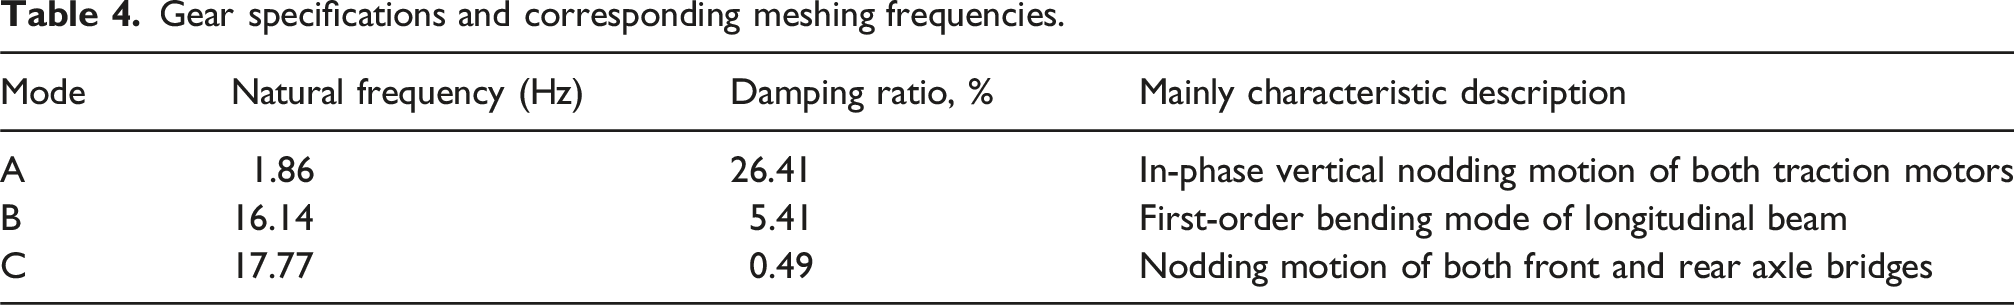
To further verify the reliability of the modal identification results, a stabilization diagram was constructed by gradually increasing the model order. A pole was considered stable when the variation in modal frequency between adjacent orders was less than 1%, the damping ratio deviation was within 5%, and the modal shapes remained consistent across measurement channels. The stabilization diagram shown in Figure 11 confirms the existence of the three dominant modes and indicates that Modal B and Modal C exhibit relatively low-damping ratios, making them susceptible to excitation under operational conditions. Stabilization diagram of identified characteristic modes.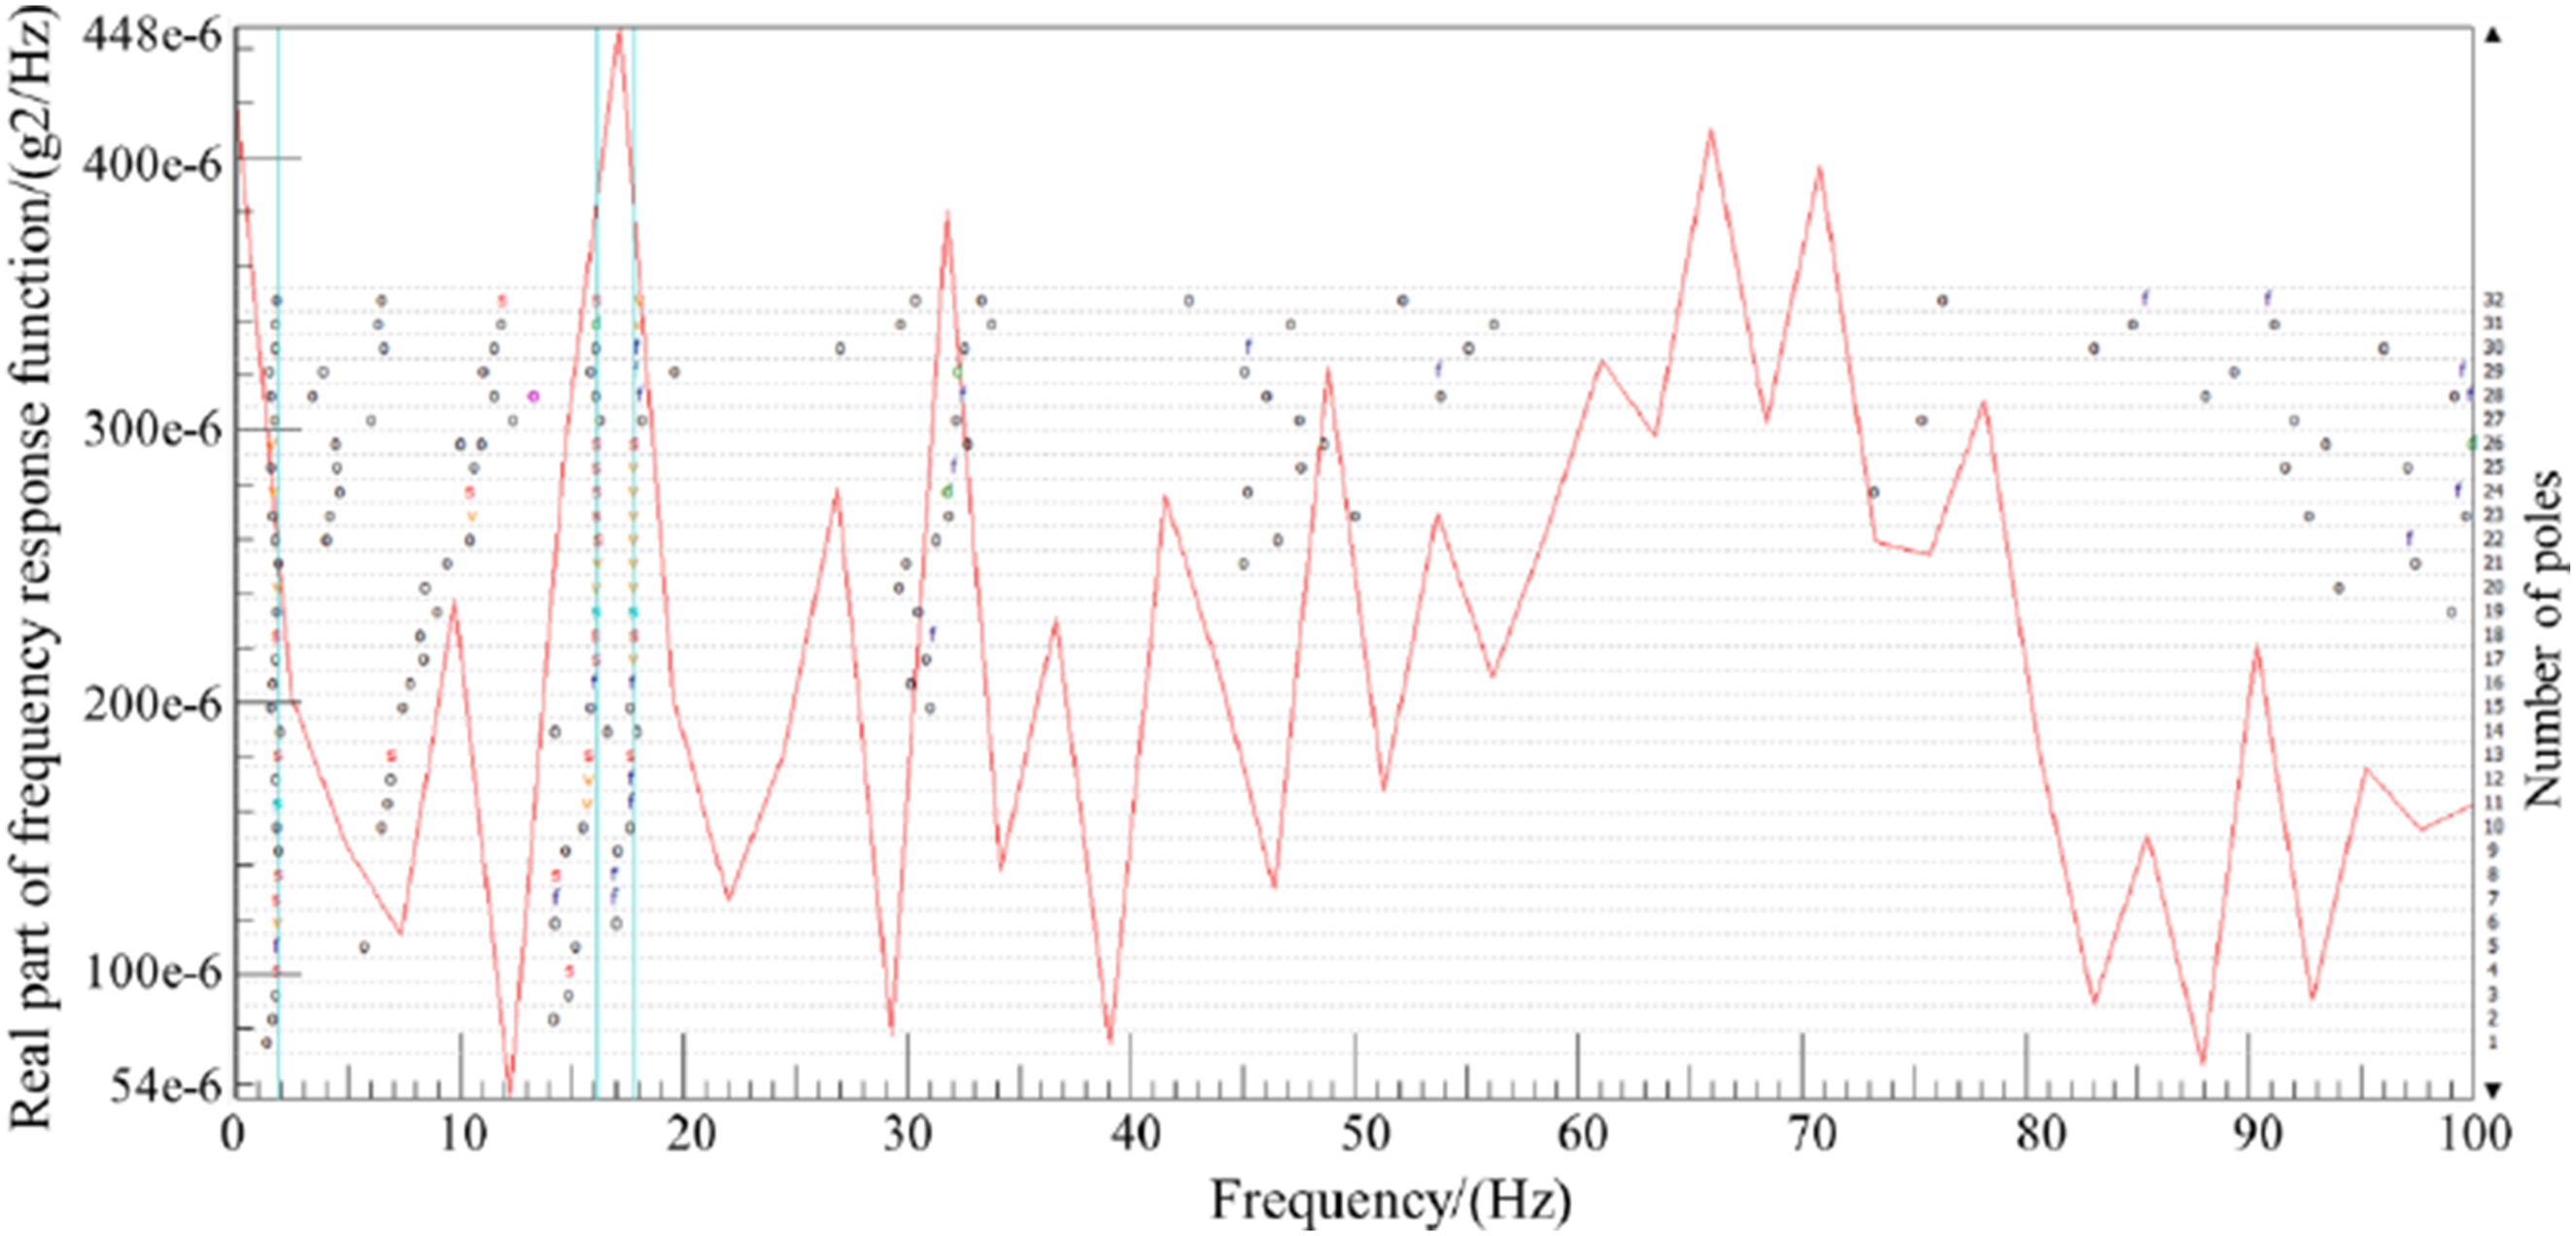
The corresponding mode shapes reveal that the structural deformation is primarily concentrated in the motor-motor base connection region, involving nodding and lateral motions of the motor relative to the supporting structure. Such flexible support characteristics can amplify dynamic disturbances generated by gear meshing, allowing vibration energy to propagate through the gearbox and axle bridge. Consequently, when drivetrain excitation frequencies approach the natural frequencies of these modes, modal participation may occur, resulting in localized vibration amplification within the transmission system. These results indicate that the observed abnormal gearbox vibration is strongly related to the interaction between periodic drivetrain excitation and low-damping structural modes of the bogie system. The identified modal characteristics therefore provide an important basis for subsequent vibration mechanism analysis and fault diagnosis of the drivetrain system.
5. Fault cause analysis
5.1. Digital analysis of meshing vibration
The primary source of vibration in gear transmission systems is meshing excitation, whose frequency characteristics typically manifest as the gear meshing frequency and its higher-order harmonics. Under ideal conditions, the system’s vibration response can be modeled as a combination of steady-state harmonic components. However, when local gear faults occur, such as spalling, pitting, uneven wear, or tooth breakage, the meshing stiffness becomes periodically time-varying (Shi et al., 2025; Wang et al., 2024). This leads to amplitude modulation in the vibration signal, which in the frequency domain appears as sidebands centered around the meshing frequency, spaced at intervals corresponding to the rotational frequency of the faulty gear. This modulation phenomenon forms a crucial basis for gear fault diagnosis.
In the absence of faults, the time-domain vibration signal due to gear meshing can be expressed: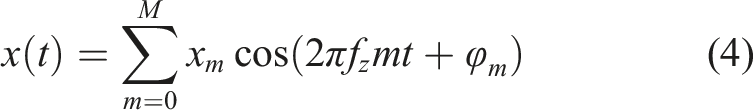
When a gear has a localized structural defect, the meshing stiffness is subject to periodic disturbances during operation. Let 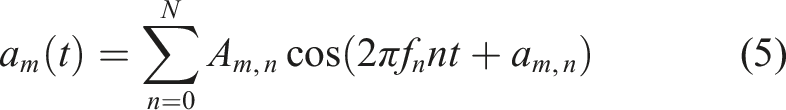
Combining equations (4) and (5), the resulting modulated signal can be written as: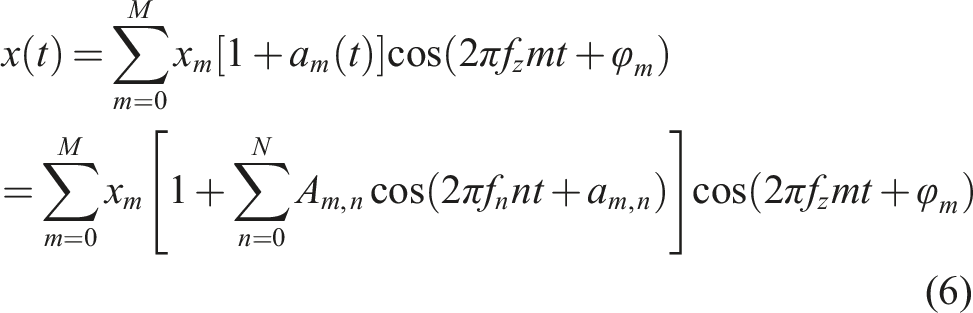
If a band-pass filter is applied to 
Focusing on the first-order meshing harmonic (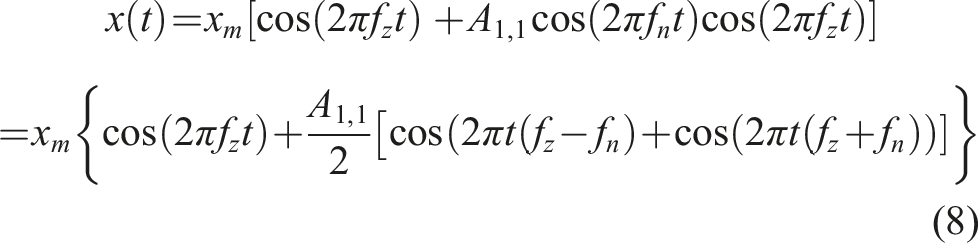
After applying the Fourier transform to
To better explain the vibration mechanism induced by the gear transmission system, a simplified dynamic model of the gear pair is considered. In a typical gear transmission system, the vibration excitation mainly originates from the time-varying meshing stiffness and transmission error during the gear meshing process. The dynamic behavior of a gear pair can be approximately represented by a single-degree-of-freedom vibration model:
The periodic variation of meshing stiffness introduces vibration components at the gear meshing frequency and its harmonics, which can be observed in the measured vibration spectra. The theoretical analysis presented above mainly serves as a guideline for interpreting the meshing-related vibration mechanisms and provides a reference basis for the subsequent simulation analysis.
5.2. Experimental verification
In practical gear transmission systems, local defects such as tooth wear, pitting, or breakage may lead to irregular meshing conditions and introduce periodic disturbances during gear engagement. These disturbances typically produce characteristic vibration signatures, including increased energy at the gear meshing frequency, modulation sidebands spaced by the gear rotational frequency, and intermittent impacts in the time domain (Barszcz and Randall, 2009; Randall and Antoni, 2011).
As indicated by the previous spectral and time-frequency analyses, a dominant vibration component near 960 Hz was observed in the powered bogie gearbox. To further examine potential modulation characteristics, the lateral acceleration signal of gear C at 50 km/h was subjected to localized spectral magnification analysis. As shown in Figure 12, the dominant spectral peak appears near 946.33 Hz, corresponding to the gear meshing excitation. Two symmetric sidebands occur at 946.33 Hz and 962.80 Hz, yielding a spacing of approximately ±16.5 Hz. This spacing matches the rotational frequency of gear B (16.81 Hz) rather than that of gear C (17.11 Hz). The relative error between the measured spacing and the theoretical rotational frequency of gear B is approximately 1.8%, confirming that the sidebands originate from the rotational modulation of gear B. It should be clarified that based on the train speed around 50 km/h, the theoretical meshing frequency is consistent with the measured value of 946.33 Hz. The slight deviation can be attributed to the averaging effect of the FFT time window, and the minor time misalignment between signals (Wang et al., 2024; Zhu et al., 2015). Specifically, the frequency spectrum is derived from a finite time window, during which the train speed varies, leading to an averaged frequency representation. Localized magnification analysis of meshing frequency response.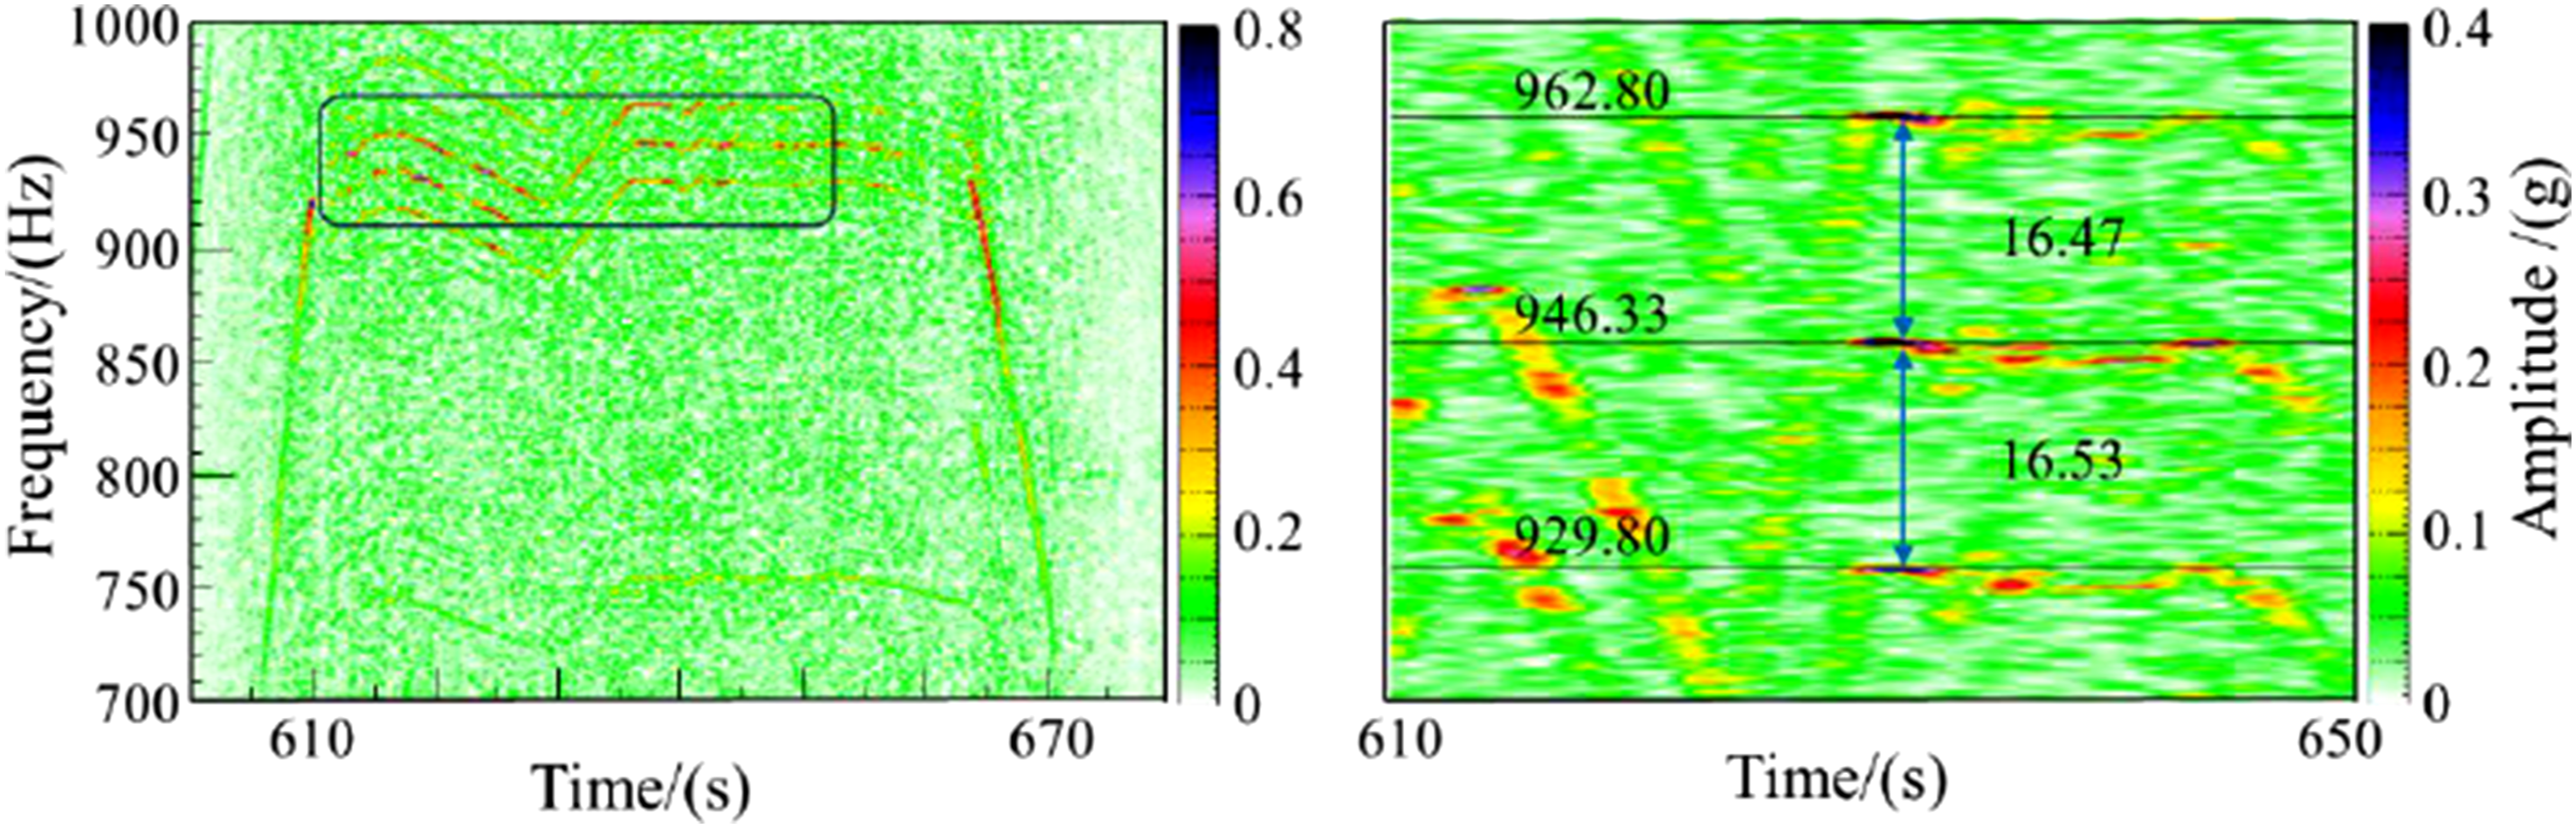
In addition, a low-frequency vibration component close to 16.5 Hz can be identified in the spectrum, which is consistent with the rotational excitation of gear B. According to spectral modulation theory, such sideband structures indicate amplitude modulation caused by localized defects. These observations suggest that periodic stiffness variation associated with gear B introduces modulated meshing excitation, which propagates through the drivetrain and excites adjacent components. The vibration spectra measured at different drivetrain locations exhibit consistent dominant components around the meshing frequency and its sidebands, indicating that the excitation originates from the gearbox and propagates along the drivetrain structure. However, the vibration amplitudes vary across locations due to differences in structural stiffness, damping, and modal characteristics.
To further validate the fault attribution, comparative experiments were conducted using the structurally symmetric M5 module, whose bogie was free of abnormal vibration. The acceleration sensors originally installed on the M1 bogie were relocated to identical positions on M5, and the measurements were repeated under the same operating conditions. As shown in Figure 13, the three-directional acceleration amplitudes at gear C on M5 remained below 15 g, significantly lower than the 20 g peaks observed on M1. Moreover, the time-frequency spectrogram shows no energy concentration near 960 Hz and no evident modulation sidebands, indicating the absence of meshing anomalies in the M5 gearbox. Experimental validation of vehicle vibration behavior at normal condition: (a) Time-domain signals of three-directional acceleration and train speed; (b) time-frequency spectrogram of lateral acceleration.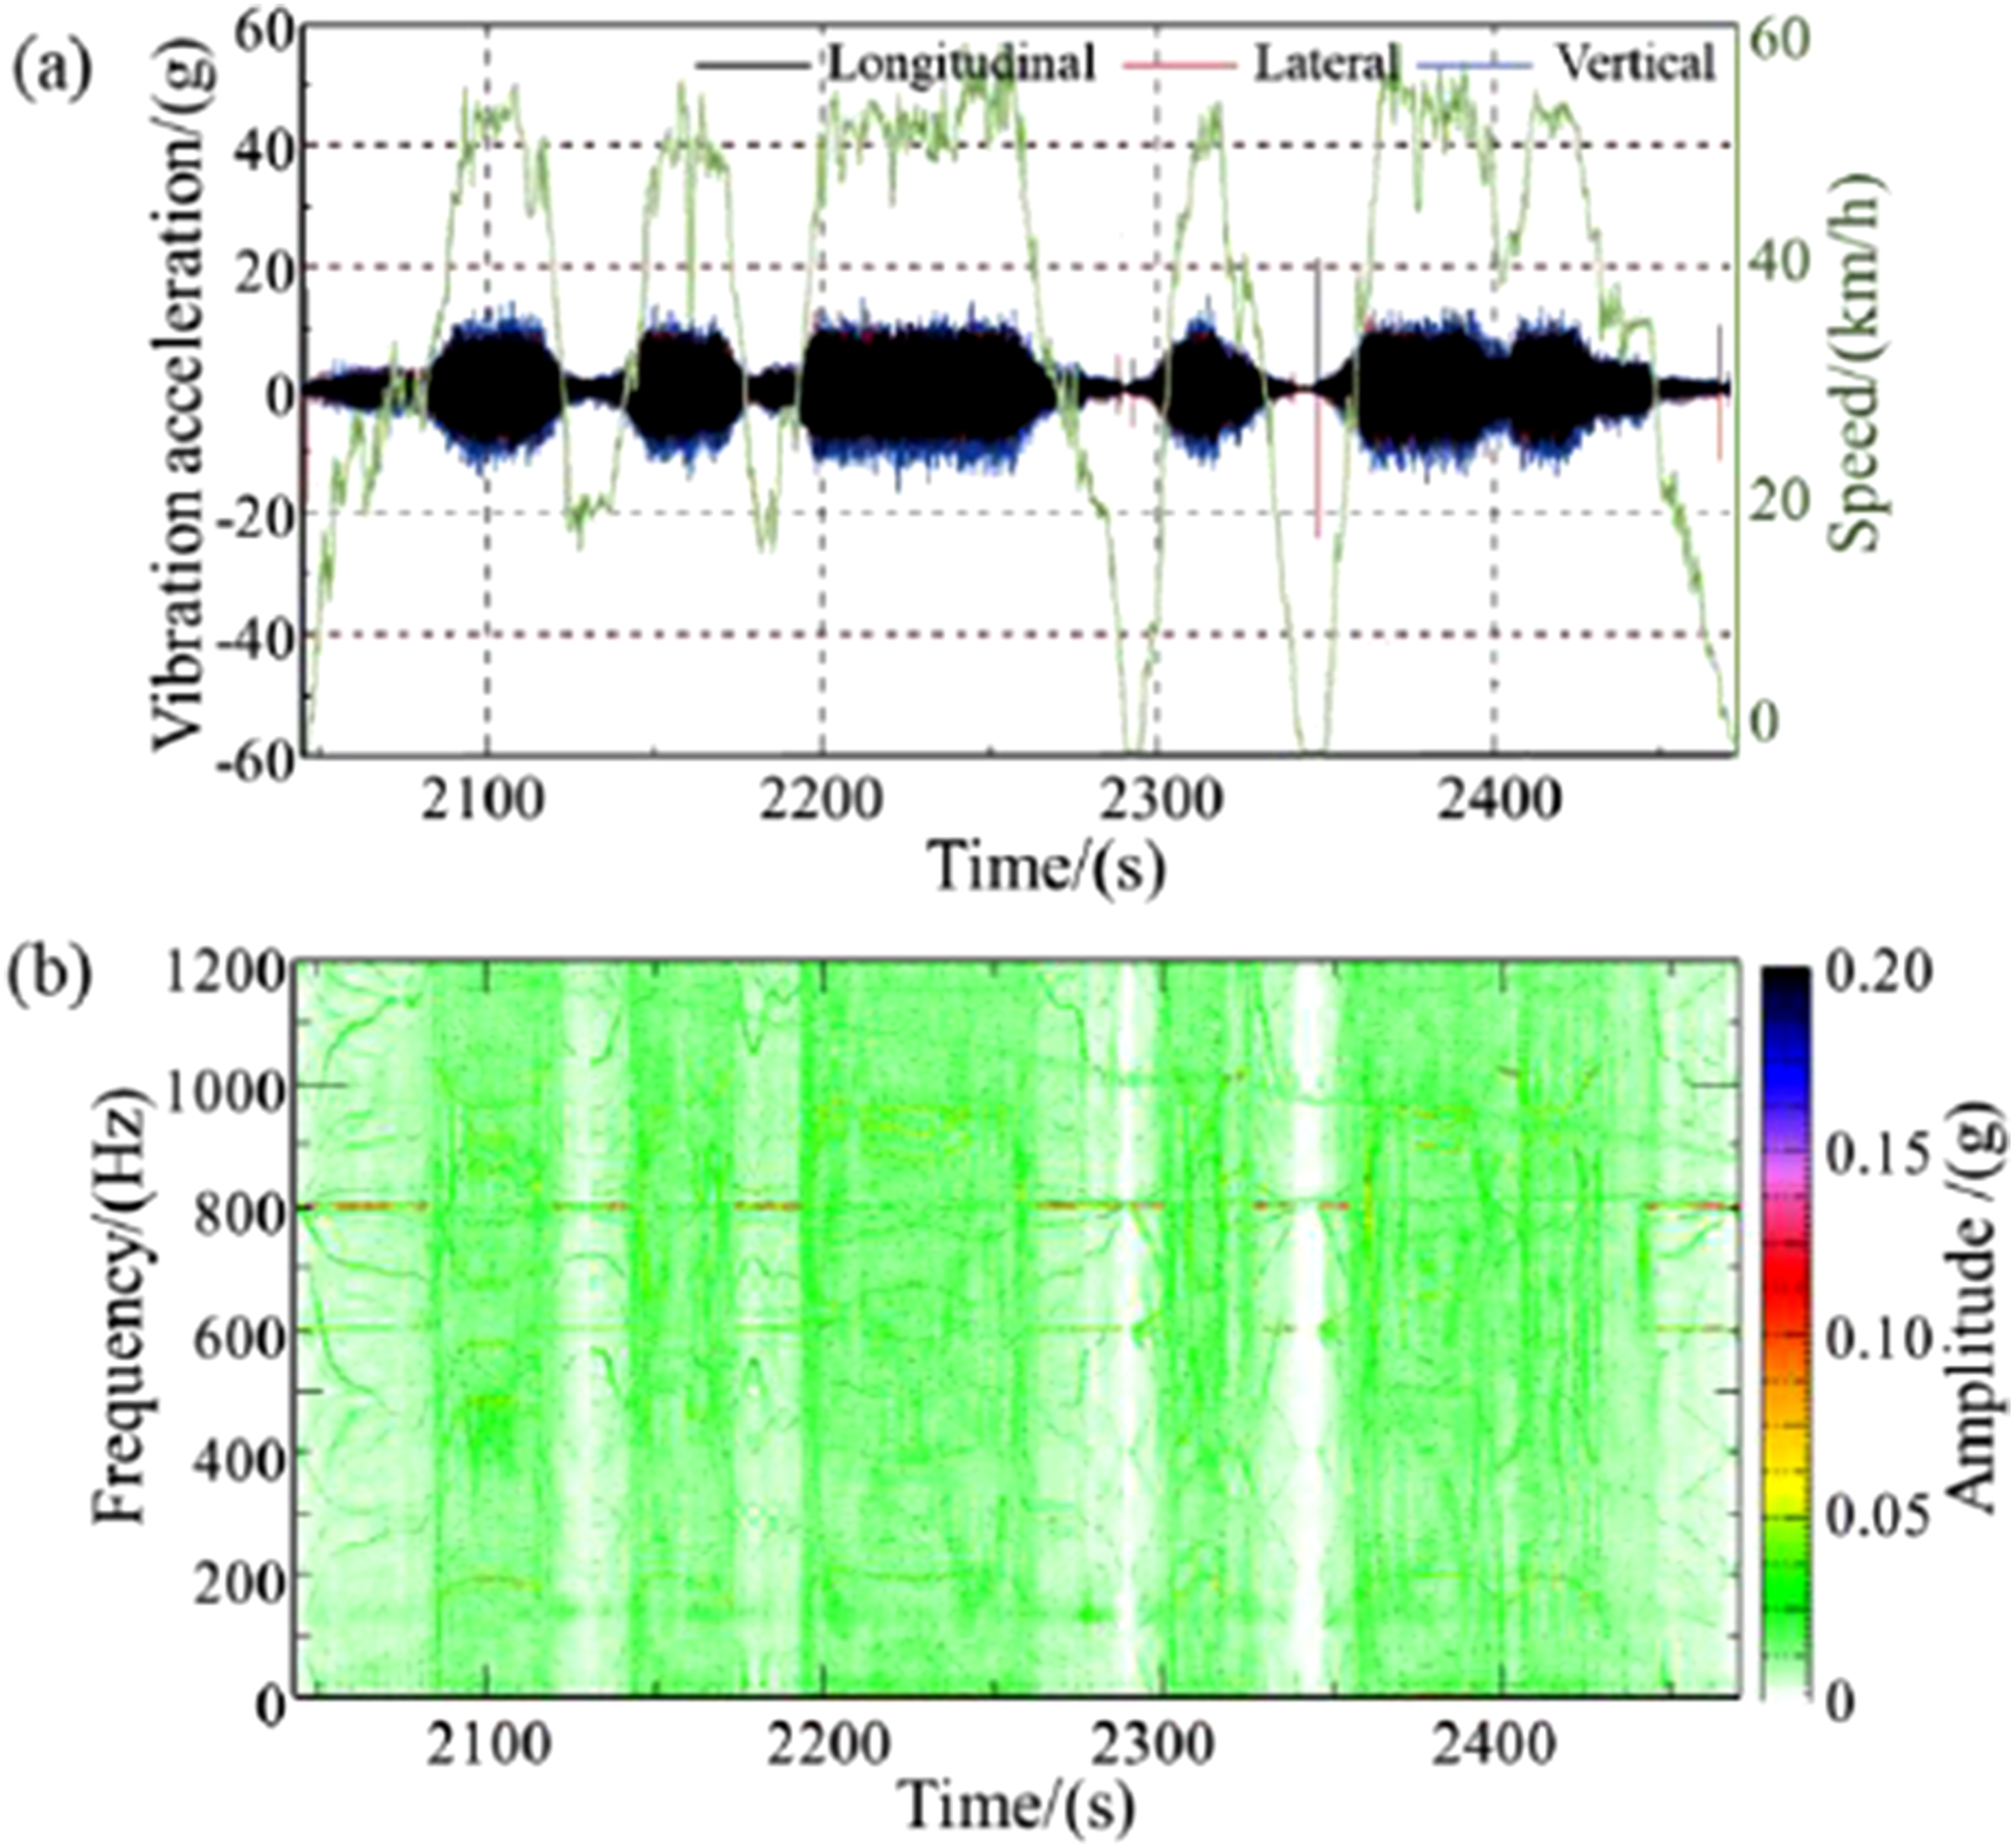
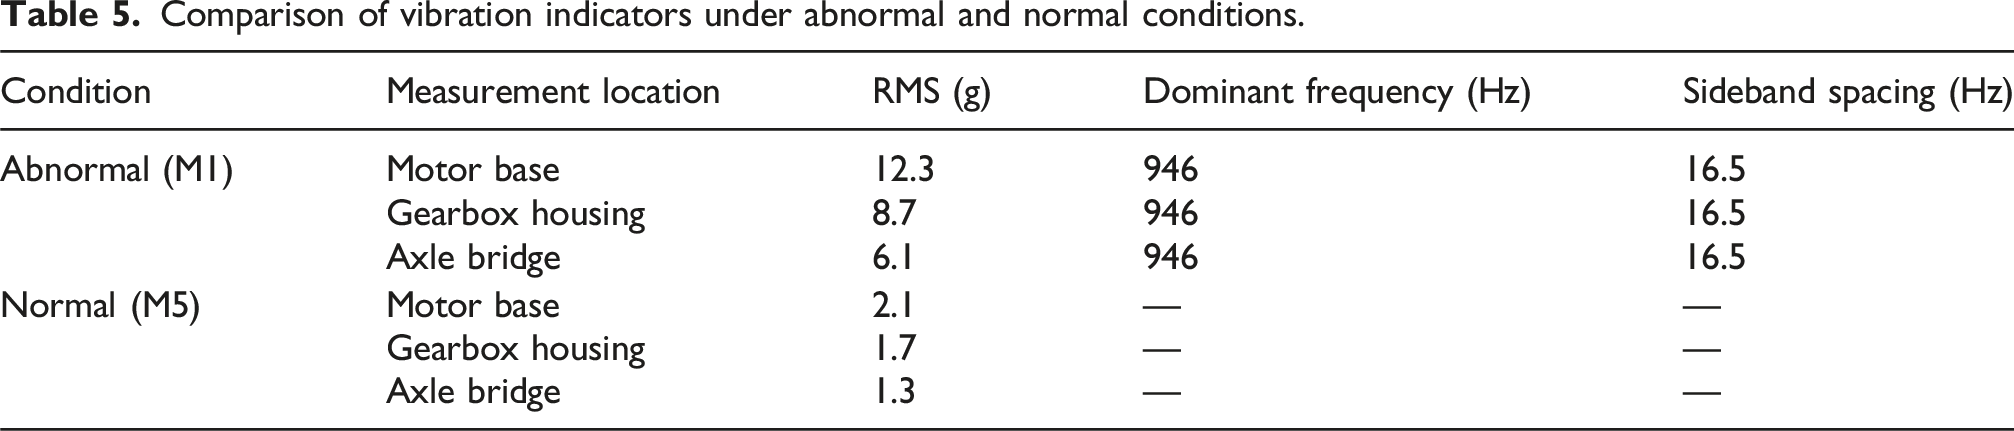
Further comparison of the lateral stability index between M1 and M5, as shown in Figure 14, reveals that M5 consistently maintained values below 2.25, while M1 exceeded 2.5 at speeds above 50 km/h. This difference indicates that abnormal gearbox vibration has a direct influence on vehicle lateral dynamic performance. As vehicle speed increases, the rotational speed of the drivetrain also increases, which enhances the meshing excitation amplitude and contributes to the higher ride quality index observed in the abnormal module. A comparison of the main vibration indicators is summarized in Table 5. Under abnormal conditions, the dominant spectral component at 946 Hz with a sideband spacing of 16.5 Hz appears consistently at the motor base, gearbox housing, and axle bridge. In contrast, the normal module exhibits significantly lower RMS vibration levels and no identifiable meshing-related spectral components. Comparison of lateral stability index at different conditions. Comparison of vibration indicators under abnormal and normal conditions.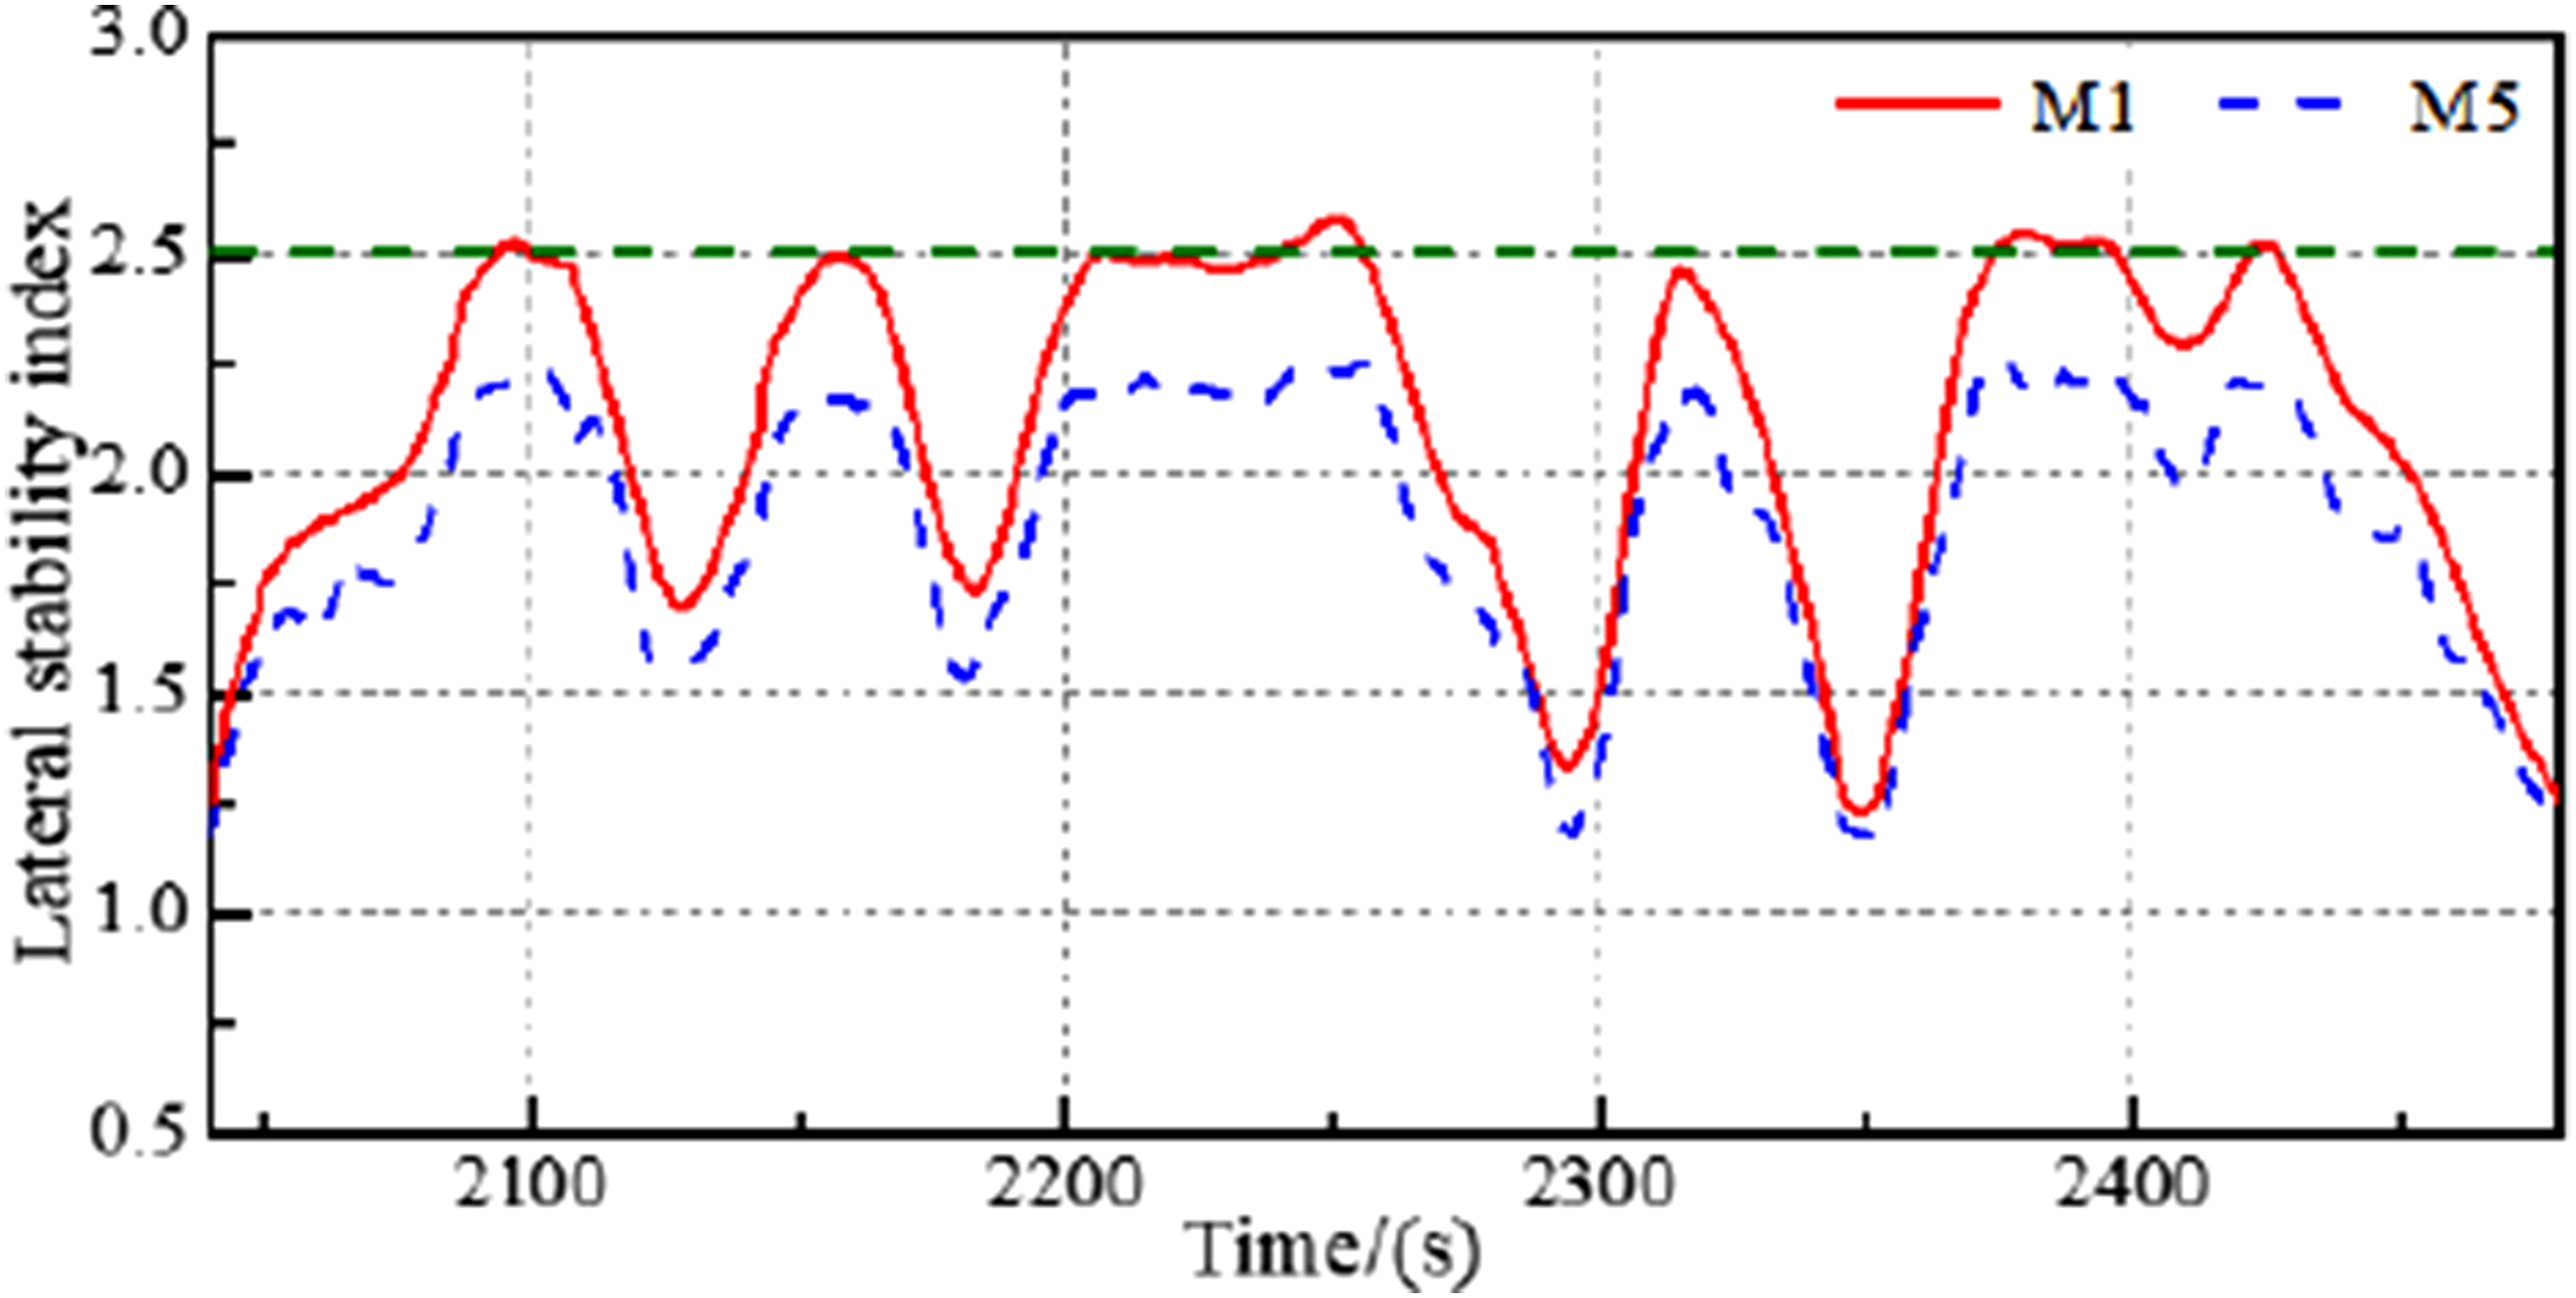
The spatial distribution of vibration amplitudes further indicates that the measurement points near the bearing seat of gear B exhibit higher vibration levels than other locations, supporting the localization of the excitation source. Combining the spectral characteristics, time-frequency analysis, and spatial vibration distribution, the abnormal vibration can be primarily attributed to meshing excitation associated with gear B. Operational modal analysis indicates several structural modes associated with the motor-gearbox assembly. In particular, Modal B (16.14 Hz) and Modal C (17.77 Hz) are close to the rotational excitation frequency of gear B. When the excitation frequency approaches these structural natural frequencies, modal coupling may occur, leading to amplified vibration responses, especially at the motor base.
It should be noted that vibration components near the gear meshing frequency are not always sufficient to conclusively confirm gear faults, as similar features may also arise from other drivetrain sources such as motor electromagnetic excitation or bearing defects. In practical engineering diagnosis, the excitation source is typically identified through a combination of frequency matching, sideband analysis, spatial vibration comparison, and evaluation of alternative excitation mechanisms. The significant vibration observed at the motor base is strongly correlated with the excitation originating from the gearbox. This is supported by the consistency in dominant frequencies and modulation sideband structures between the two signals, as well as the mechanical transmission path connecting the gearbox and motor base. Therefore, the gearbox is considered a primary contributing source of the motor base vibration, although other potential influences cannot be completely excluded. Overall, the results indicate that the enhanced meshing excitation associated with gear B, when interacting with low-damping structural modes, leads to resonance amplification and localized abnormal vibration in the drivetrain system. These findings highlight the importance of integrating modal analysis and vibration monitoring for early detection of gearbox faults in low-floor tram vehicles.
6. Conclusion
This study investigated abnormal vibrations observed in the gearbox of a low-floor tram during actual operation. Through comprehensive vehicle dynamics tracking test, time-frequency analysis, operational modal identification, and spectral modulation modeling, the excitation mechanism and transmission path of the gearbox vibration were systematically analyzed. The main conclusions are as follows: (1) Significant abnormal vibration was identified in the powered bogie gearbox, with the lateral acceleration at gear C reaching peak values up to 60 g and dominant frequency components centered around 960 Hz. The vibration intensity increased notably with speed, exhibiting speed-dependent resonance behavior above 50 km/h, which severely degraded ride quality. (2) Modal analysis revealed the presence of low-damping structural modes at 16.14 Hz and 17.77 Hz, which are close to the rotational frequencies of gears B and C. These modes exhibit strong modal coupling potential and serve as amplification channels for localized excitation energy within the gearbox structure. (3) Spectral modulation analysis identified sideband structures around 960 Hz spaced by approximately 16.5 Hz, corresponding to the rotational frequency of gear B. Combined with comparative testing, gear B was confirmed to exhibit local damage, serving as the primary source of abnormal meshing excitation. (4) The abnormal excitation propagates through flexible interface structures, particularly the motor base, to the gearbox and axle bridge, where it couples with system modes and induces resonance. This coupling mechanism forms a speed-sensitive excitation path, leading to significant amplification of lateral vibration and degraded dynamic stability at high speeds. (5) By adjusting relevant parameters such as gear tooth numbers, rotational speed, and structural properties, the proposed approach can be applied to the vibration analysis and fault diagnosis of other train types. The results provide a useful reference for the diagnosis of abnormal vibration in railway gear transmission systems.
Transient high acceleration peaks may occur in railway drivetrain systems due to short-term dynamic excitations such as wheel-rail interaction irregularities, gear meshing impacts, or structural resonance amplification. Since these peaks are intermittent and not sustained over time, they are unlikely to represent continuous mechanical loading conditions.
Footnotes
Funding
The authors disclosed receipt of the following financial support for the research, authorship, and/or publication of this article: This work was supported by National Key Research and Development Program of China (Grant No. 2023YFB2603700), National Natural Science Foundation of China (Grant No. 42501557), China Postdoctoral Science Foundation (Grant No. 2023TQ0253), Natural Science Foundation of Sichuan Provincial (Grant No. 2025ZNSFSC0395), and State Key Laboratory of Rail Transit Vehicle System Open Project (Grant No. RVL2505).
Declaration of conflicting interests
The authors declared the following potential conflicts of interest with respect to the research, authorship, and/or publication of this article: Author Xinyun Peng was employed by the company AVIC Chengdu Aircraft Industry (Group) Co., Ltd. The remaining authors declare that the research was conducted in the absence of any commercial or financial relationships that could be construed as a potential conflict of interest.
AI usage statement
The authors used artificial intelligence tools (Chat GPT) to assist with language editing and improving the clarity of the manuscript. All scientific content, interpretations, and conclusions were developed and verified by the authors.