
Abstract
The phenomenon of fluid-structure interaction (FSI) is prevalent in many engineering fields, including aerospace and civil structures, maritime applications, and flow control problems. This novel study examines the FSI of a stiff cantilever plate attached to a cylinder in an AEROLAB Educational Wind Tunnel (EWT) under airflow excitation. The 37 accelerometers mounted to the structure are considered to be part of the structure itself, and an experimental modal analysis (EMA) is performed using a single hammer impact location to determine the first seven out-of-plane natural frequencies and mode shapes, where the results are shown to validate the finite element analysis (FEA) modal analysis. A constant temperature anemometry (CTA) experiment is performed at a free-stream velocity of 30 m/s with 48 measurement locations. The captured data allows for visualization of the mean velocity and turbulence intensity, and a frequency domain analysis at 24 measurement locations identifies the vortex shedding frequencies. Additional test results are provided for velocities of 20 m/s and 10 m/s. An operational modal analysis (OMA) is performed at an airflow velocity of 30 m/s and excellent correlation between the EMA and OMA mode shapes is observed, with modal assurance criterion (MAC) values along the diagonal greater than or equal to 97.41%. Excellent agreement between the natural frequencies captured between methods is achieved, with a percent difference of 3.384% or less. Lastly, using a transfer function and its coherence function, the airflow excitation is observed to partially correlate with the vibration response at a point on the plate.
Keywords
1. Introduction
Fluid-structure interaction (FSI) may be defined as the coupling of a structure’s dynamic response to the excitation of a working fluid and the subsequent excitation the structure imparts on that working fluid (Modarres-Sadeghi, 2021). The current literature contains various FSI simulation and test configurations, including splitter plates that are either attached (Teksin and Yayla, 2016; Xie et al., 2021) or detached (Mittal et al., 2023; Wu et al., 2014) and rigid or flexible (Duan and Wang, 2021). Other configurations include splitter plates placed in front of a circular cylinder (Chutkey et al., 2018) or behind a circular cylinder (Shukla et al., 2013). Jin and Chamorro (2017) studied hinged splitter plates in the wake of elliptic cylinders and Ro (2014) studied flow past a square prism. Huang and Zhang (2013) performed an FSI numerical simulation of cantilever plate flutter coupled with fluid loading. Most fluid mediums tested or simulated include air or water but other incompressible fluids, such as glycerin (Abdi et al., 2019), may be used.
In one FSI experiment, non-contact digital image correlation (DIC) (Jones and Iadicola, 2025) was used by Lynch et al. (2020) to observe the response of a jointed beam excited by supersonic flow in a shock tube, where in addition to an initial impulse load from the shock, vortex shedding imparted periodic loading on the structure. The vortex shedding frequency was observed to vary depending on the shock-wave strength, and the structure’s response amplitude was largest when the shedding frequency closely matched the structure’s natural frequency. Eitner et al. (2023) experimentally investigated the effects of a ramp-induced shock-wave/boundary-layer interaction with compliant panels of different thicknesses at Mach 2 flow to simulate a control surface on a supersonic flight vehicle. By using DIC and pressure-sensitive paint on the panel, researchers were able to simultaneously observe full-field panel deformation and surface pressures. They noted that the shock foot had minimal effect on the vibration of the panel, but that the shock foot primarily oscillated at the panel’s first natural frequency. The authors concluded that the shock foot oscillation was caused by a one-way coupling with the panel vibration. Non-contact photogrammetry was used by Whalen et al. (2020) to investigate the interaction between hypersonic flow and a plate clamped on all sides, where mode shapes correlated well with expected results from the classical plate theory, but natural frequencies shifted due to temperature changes in the plate from varying shock-wave/boundary-layer interaction intensities. Akilli et al. (2008) examined the effects that splitter plates of differing lengths attached to a circular cylinder had on vortex shedding suppression in water flow using non-contact particle image velocimetry (PIV). They discovered that the vortex shedding frequency decreased with increasing splitter plate length until the splitter plate length to cylinder diameter ratio,
In addition to the non-contact methods discussed, constant temperature anemometry (CTA) is another measurement technique used in the study of FSI. This method allows for instantaneous flow velocity measurement, where the hot-wire probe is placed directly in the flow field of interest. Although it is an invasive technique, CTA has high spatial and temporal resolution. Ergin and White (2005) used the CTA technique to measure the velocity components in the streamwise and spanwise directions of a wind tunnel for studying the transient disturbance growth caused by surface roughness arrays. Jaunet et al. (2014) used CTA to measure the unsteadiness of the reflected shock-wave in a shock-wave/boundary-layer interaction experiment in a closed-loop supersonic wind tunnel. Here they showed that wind tunnel wall heating results in lower fluctuation frequencies than when the wall is not heated. Weiss et al. (2005) performed experiments in supersonic flow to demonstrate the high-bandwidth capabilities of CTA when using a post-test software correction method. Plotnikov (2023) developed a constant temperature anemometer with circuitry designed to protect the hot-wire probe from overheating and burning out, especially during test set up.
The novelties of this work are as follows. Much of the FSI research in the literature focuses on large, nonlinear deformation of a structure, while a novelty of the current work is the presentation of an extensive set of experimental FSI data at multiple airflow velocities of 30 m/s, 20 m/s, and 10 m/s where the vortex-induced vibrations are not visible to the naked eye due to the rigidity of the experimental structure. Moreover, due to accelerometer mass loading, a unique approach to realizing the finite element analysis (FEA) modal analysis was implemented in which the sensors were modeled as part of the structure itself, as the accelerometers were considered to be part of the experimental structure under test, resulting in excellent correlation between the simulation and test results. Among other key insights, one novel finding of the work is the behavior of the airflow velocity near the plate surface and at its lower edge, or threshold, where the upstream velocity is reduced relative to the position below the lower edge of the plate, but further downstream the velocity is increased at the plate threshold relative to the position below the lower edge of the plate. Lastly, physical insight is gained through the novel use of the coherence function to compute a measure of the correlation between the airflow excitation and vibration response signals, where partial correlation is found from 57 to 174 Hz for the 30 m/s airflow velocity case. Additional details are provided throughout the text.
This work experimentally examines the FSI of a rigid cantilever plate attached to a rigid cylinder using the measurement techniques of experimental modal analysis (EMA), CTA, and operational modal analysis (OMA) with relatively low-speed airflow excitation inside an AEROLAB Educational Wind Tunnel (EWT). The experimental setup in this work is an example of one-way coupled FSI, where the density of the fluid (air) is much less than the density of the structure (aluminum). The result is that the fluid imparts energy into the structure and causes it to vibrate, but the structure’s vibration has a negligible effect on the fluid. The studied configuration of a cylinder with an attached cantilever plate has numerous real-world engineering applications, including cylindrical structures with appendages (Konar and Ghosh, 2026), pipelines with attachments (Yan et al., 2023), and masts with mounted plates (Li et al., 2022). In each of these applications, the primary goal of the affixed appendage or plate is rooted in passive vibration suppression to extend the fatigue life of structures. Another prominent application of cantilever plates attached to cylinders is energy harvesting, in which an electromechanical transducer turns mechanical energy from vibration into electrical energy (Song et al., 2017; Wani et al., 2025). In this work, an efficient contact-based experimental approach is proposed for capturing airflow and modal data simultaneously by instrumenting the experimental structure with the required number of accelerometers to capture modal data in a single measurement run. In the CTA results, this work also accounts for extraneous vortex shedding frequencies that are inherent to the wind tunnel. The paper is structured as follows. The equation governing the vortex shedding frequency is discussed in Section 2. The EMA setup is detailed in Section 2.1, CTA setup is discussed in Section 2.2, and OMA setup is discussed in Section 2.3. The results and analysis are discussed in Section 3, with the FEA modal analysis results presented in Section 3.1, the EMA results and analysis presented in Section 3.2, the mean velocity and turbulence intensity results and analysis detailed in Section 3.3, and the power spectral density (PSD) results and analysis discussed in Section 3.4. Lastly, the OMA results and analysis are discussed in Section 3.5. Some conclusions of the work are given in Section 4.
2. Methods
The frequency, f, of vortex shedding over a cylinder is calculated by
2.1. EMA setup
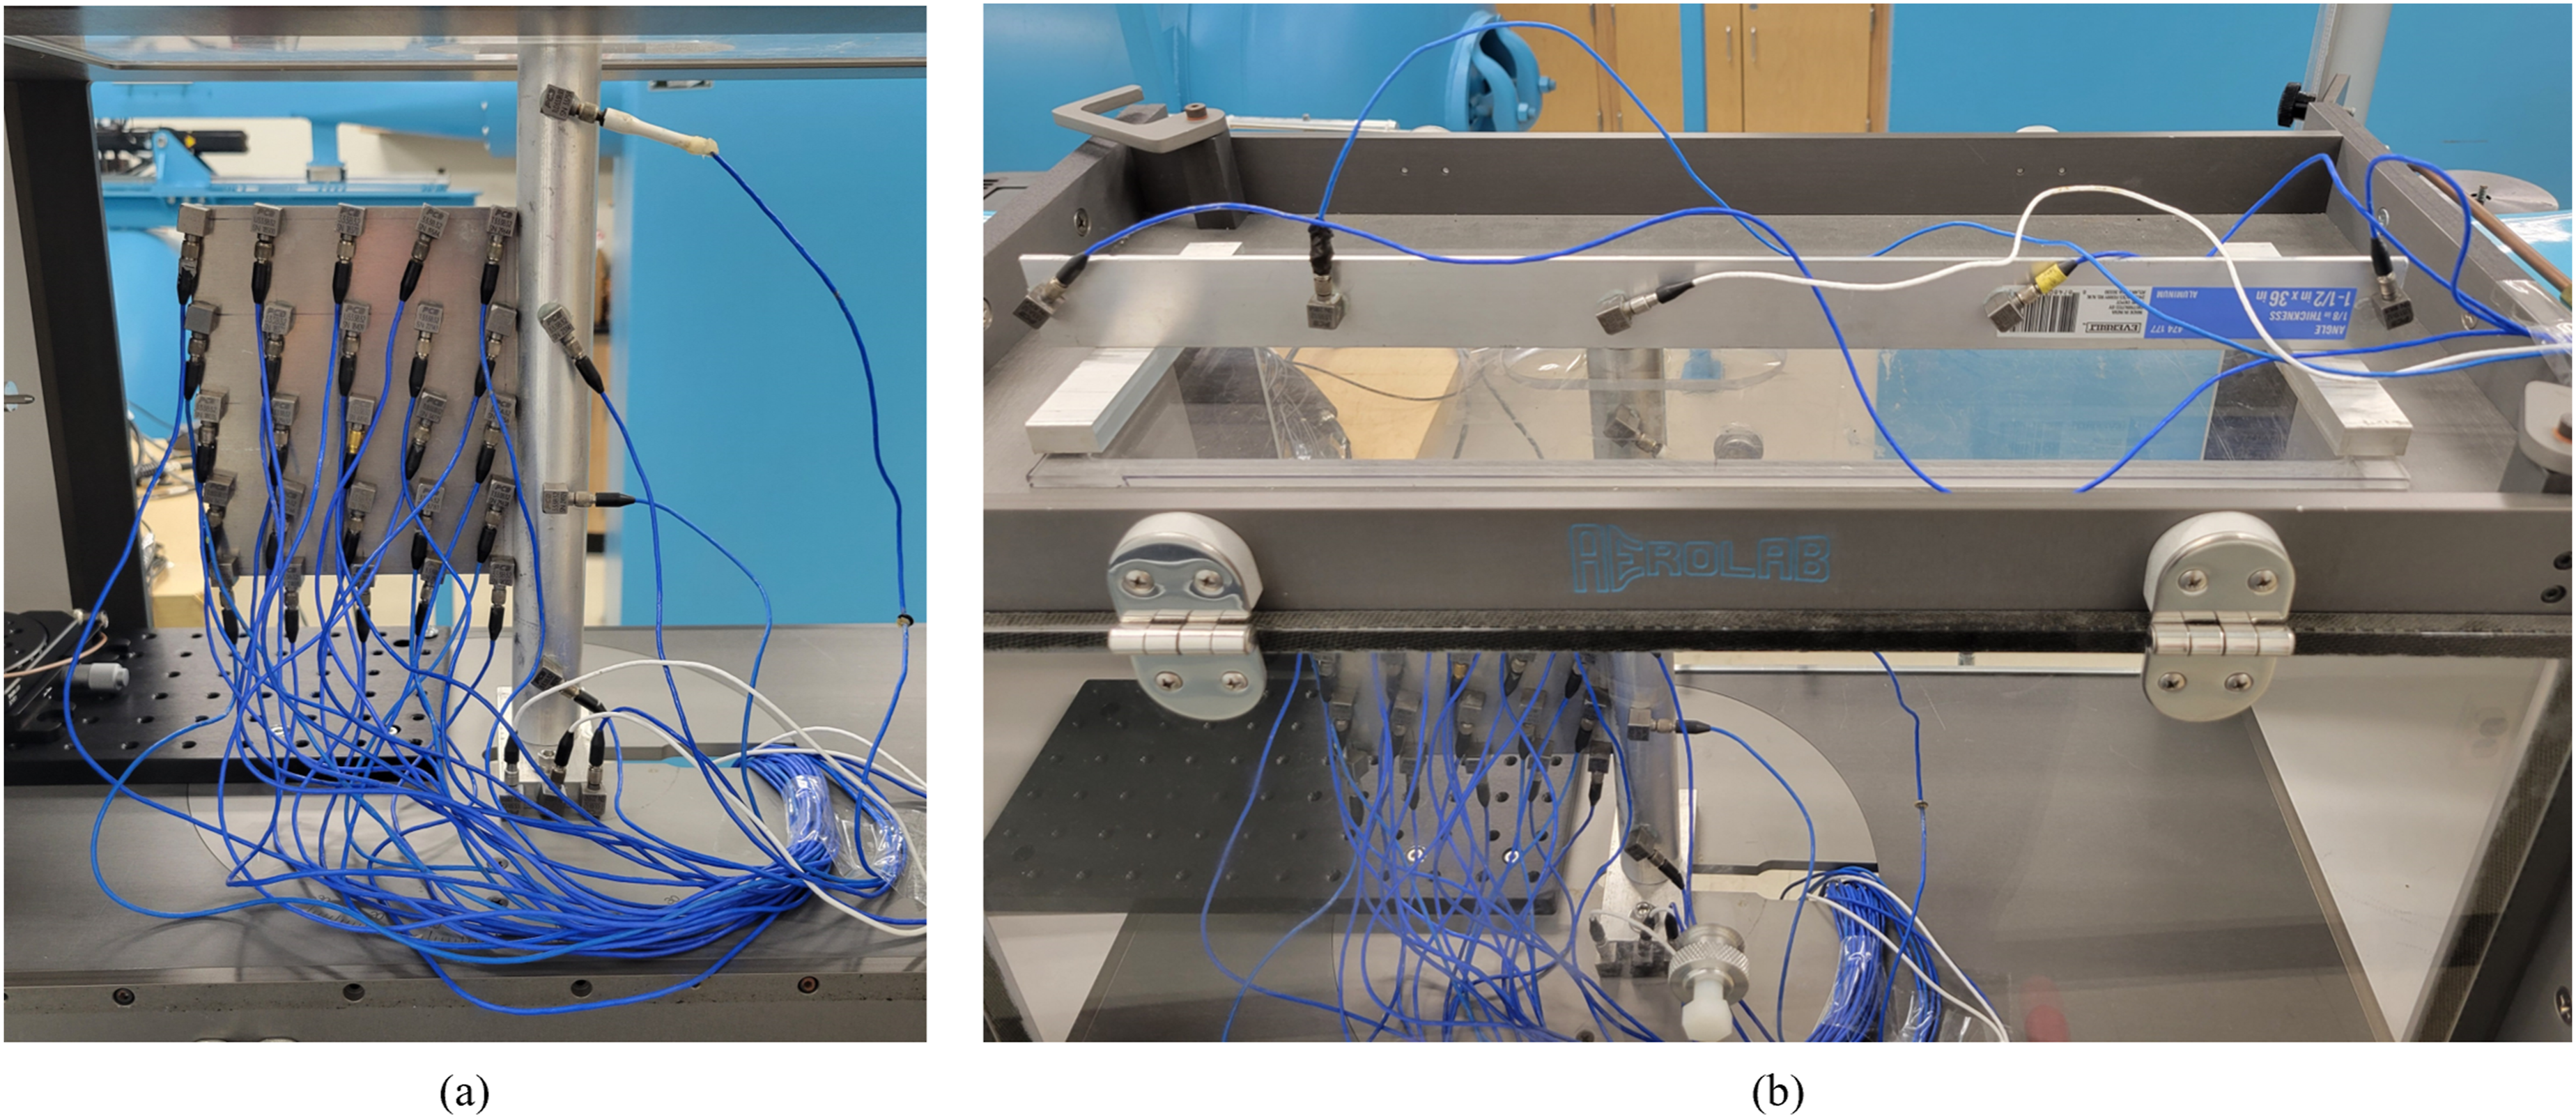
The experimental structure was developed as described in Will and Zhu (2023), where the structure was designed to fit in the EWT with a test section of 304.8 mm wide, 304.8 mm tall, and 609.6 mm long. The cantilever plate extends 128.6 mm aft of the 31.8 mm diameter cylinder, yielding a splitter plate length to cylinder diameter ratio, Setup and test equipment used for the EMA. Detail of the experimental structure showing (a) the experimental structure instrumented with 32 of 37 accelerometers and (b) the upper mounting bracket instrumented with 5 of the 37 accelerometers.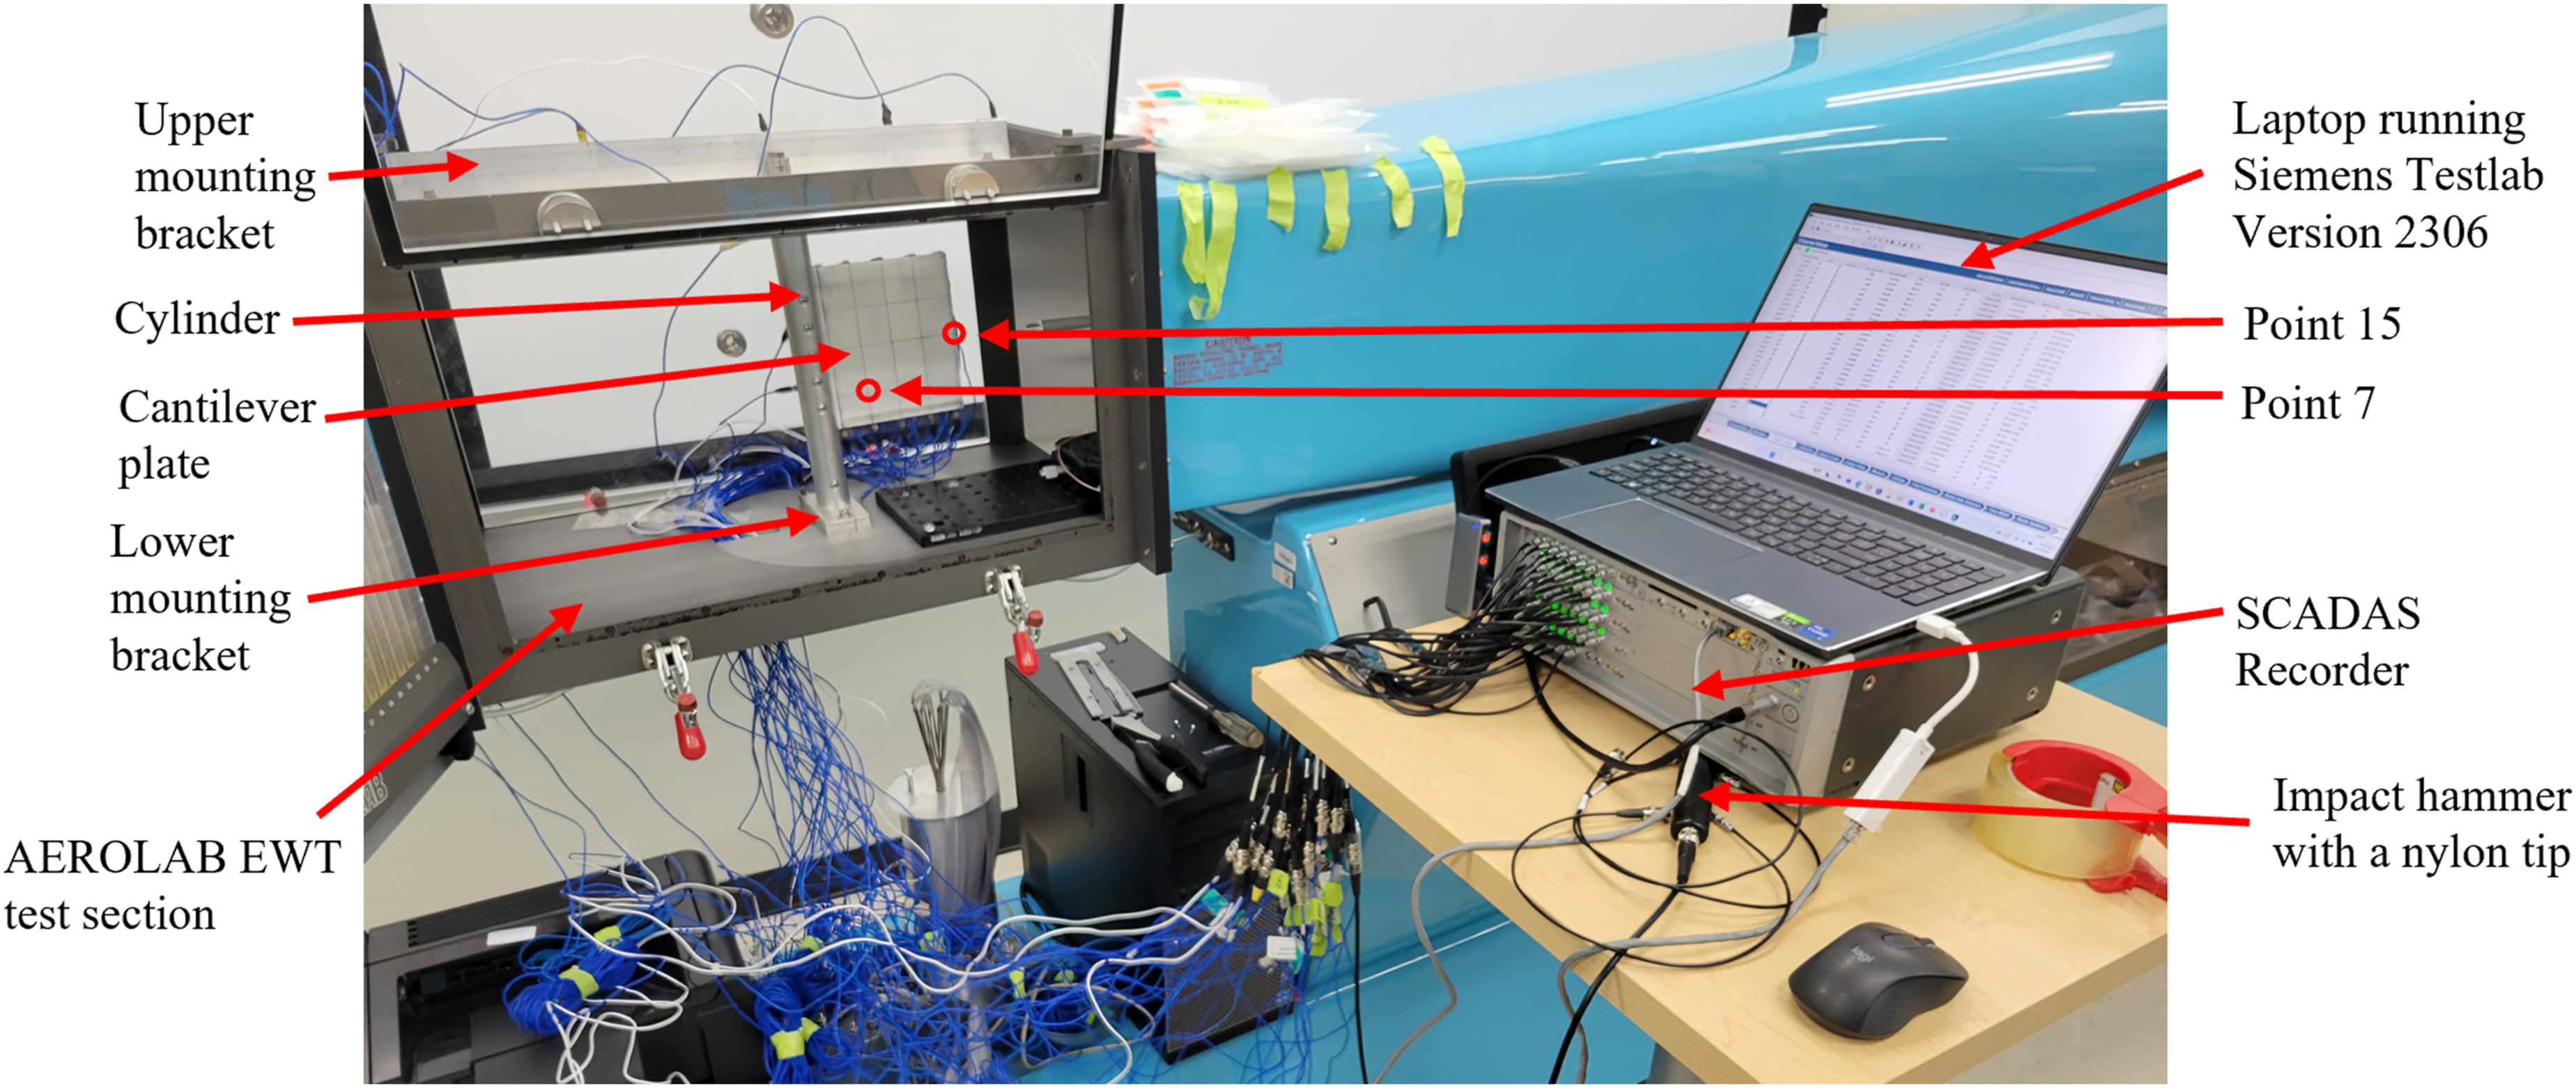
2.2. CTA setup
The CTA technique is an instantaneous flow velocity measurement technique that relies on the principle of heat transfer between an electrically heated wire and the surrounding fluid (Jørgensen, 2005). Wires are typically made of tungsten with 5 μm diameter and 1.25 mm length, allowing CTA systems to have high spatial and temporal resolution on the order of tenths of a millimeter and up to 100 kHz, respectively. A CTA experiment was performed using a Dantec Dynamics MiniCTA 54T42, 55P11 probe, hot-wire calibrator, StreamWare Basic V7.00 software, and a National Instruments NI-9215 data acquisition board. A probe holder was fabricated and mounted to a Thorlabs XYR1 translation and rotation stage for correct positioning of the probe. Calibration of the hot-wire probe was performed using the hot-wire calibrator and a supply of filtered air. The ambient pressure was measured with a Traceable 38RJ43 barometer and the calibrator’s thermistor resistance was measured with a Klein Tools MM420 multimeter for entry into the StreamWare Basic software. The software generated a 5th-order polynomial transfer function to convert the measured CTA voltages to airflow velocities. The calibration procedure was performed before and after the experiment, as the ambient temperature and pressure tend to drift over time.
The measurement uncertainty of the velocity data is estimated by adding in quadrature the root-sum-of-the-squares of the individual unsystematic uncertainty contributions and the root-sum-of-the-squares of the individual systematic error contributions. The set-up repeatability is estimated to have a relative standard uncertainty of 0.1%, the calibrator is estimated to have a relative standard uncertainty of 0.5%, the linearization is estimated to have a relative standard uncertainty of 0.5%, the probe angle has a negligible relative standard uncertainty for an assumed probe misalignment angle of 1°, and the temperature variations are estimated to have a systematic error of 1.5% per °C (Jørgensen, 1996, 2005). In one experiment in the present work, a temperature increase between the pre-test calibration and the post-test calibration was observed to be 1.02°C, yielding a measurement error due to the temperature variation of 1.53%. Adding in quadrature the root-sum-of-the-squares of the individual unsystematic uncertainty contributions and the root-sum-of-the-squares of the individual systematic error contributions yields a standard uncertainty value of 1.69%. Multiplying the standard uncertainty by a coverage factor of k = 2 for a 95% confidence level (Jørgensen, 2005) yields a relative expanded uncertainty of 3.38%.
After calibration, the hot-wire probe was placed upstream of the cylinder and the EWT fan speed was adjusted until the time-averaged free-stream velocity was 30 m/s over a period of 60 s (tests were also performed at velocities of 20 m/s and 10 m/s). The probe was then roved through 48 points around the cylinder and cantilever plate while collecting 60 s of data at each point at a sample rate of 10 kHz. Referring to the coordinate axes shown in Figure 3, the probe was roved through each combination of the following positions: • X: 0 mm, 50.8 mm, 101.6 mm, 152.4 mm • Y: 0 mm, 76.2 mm, 104.3 mm • Z: 12.7 mm, 25.4 mm, 38.1 mm, 50.8 mm Setup and test equipment used for the CTA experiment. Figure adapted from Will and Zhu (2025).
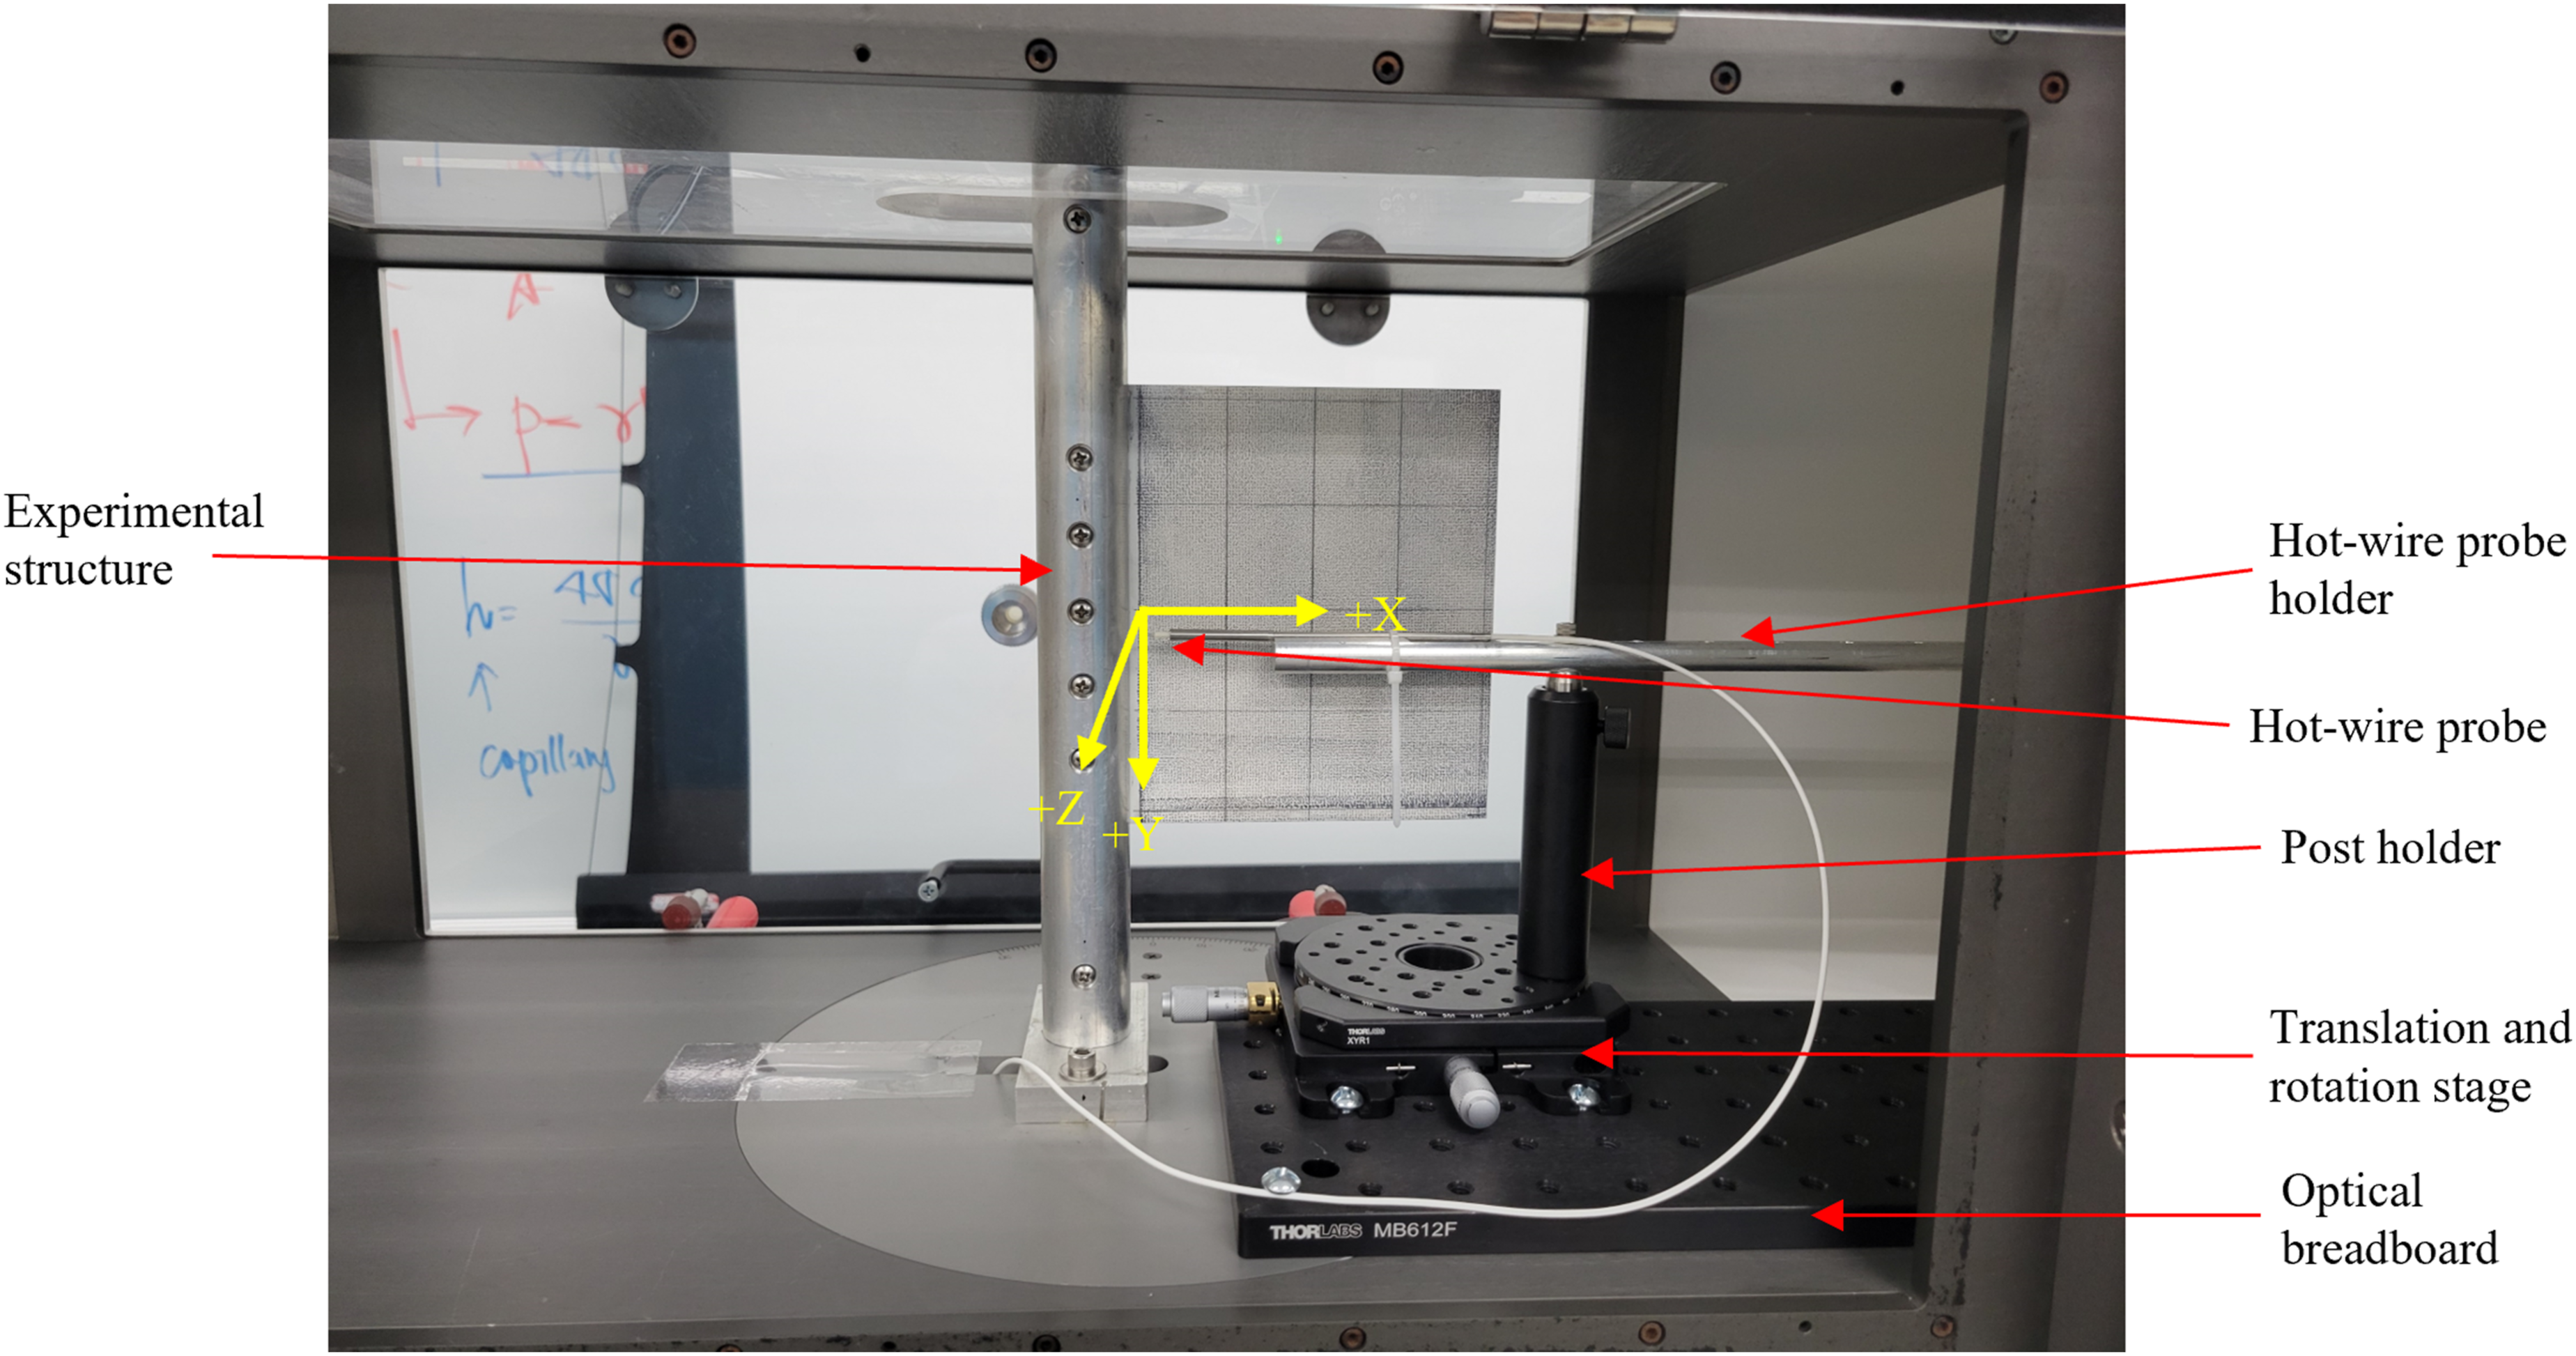
In the +Y-direction, Y = 0 mm is at the mid-plane of the cantilever plate, referred to as the “on-plate” plane, Y = 76.2 mm is at the lower edge of the cantilever plate, referred to as the “threshold” plane, and Y = 104.3 mm is 28.1 mm below the threshold of the cantilever plate, referred to as the “off-plate” plane. These planes were selected to gain an understanding of how the airflow and vortex shedding frequencies are affected by the cantilever plate.
2.3. OMA setup
An OMA experiment was performed using the CTA equipment, SCADAS Recorder, 37 fixed accelerometers, Testlab, and StreamWare Basic. The accelerometers were fixed to the structure in the same positions as those of the EMA test shown in Figures 1 and 2. A calibration of the hot-wire probe was performed and the EWT was set to a free-stream velocity of 30 m/s.
3. Results and analysis
3.1. FEA modal analysis results
An FEA modal analysis simulation was performed using Siemens NX and Simcenter 3D, in which all components of the experimental structure were accurately modeled, including the 37 accelerometers attached to the structure. Meshing was performed and materials were assigned to each component. Fasteners were modeled using RBE2 and zero-length CBUSH elements for assigning stiffness values, and appropriate constraints were applied to the structure to accurately model the experimental setup in the lab. For additional details on the FEA techniques used, it is recommended that the interested reader review Will and Zhu (2023). The simulation was run and the first seven FEA mode shapes and their natural frequencies are presented in Figure 4. First seven FEA mode shapes and their corresponding natural frequency values.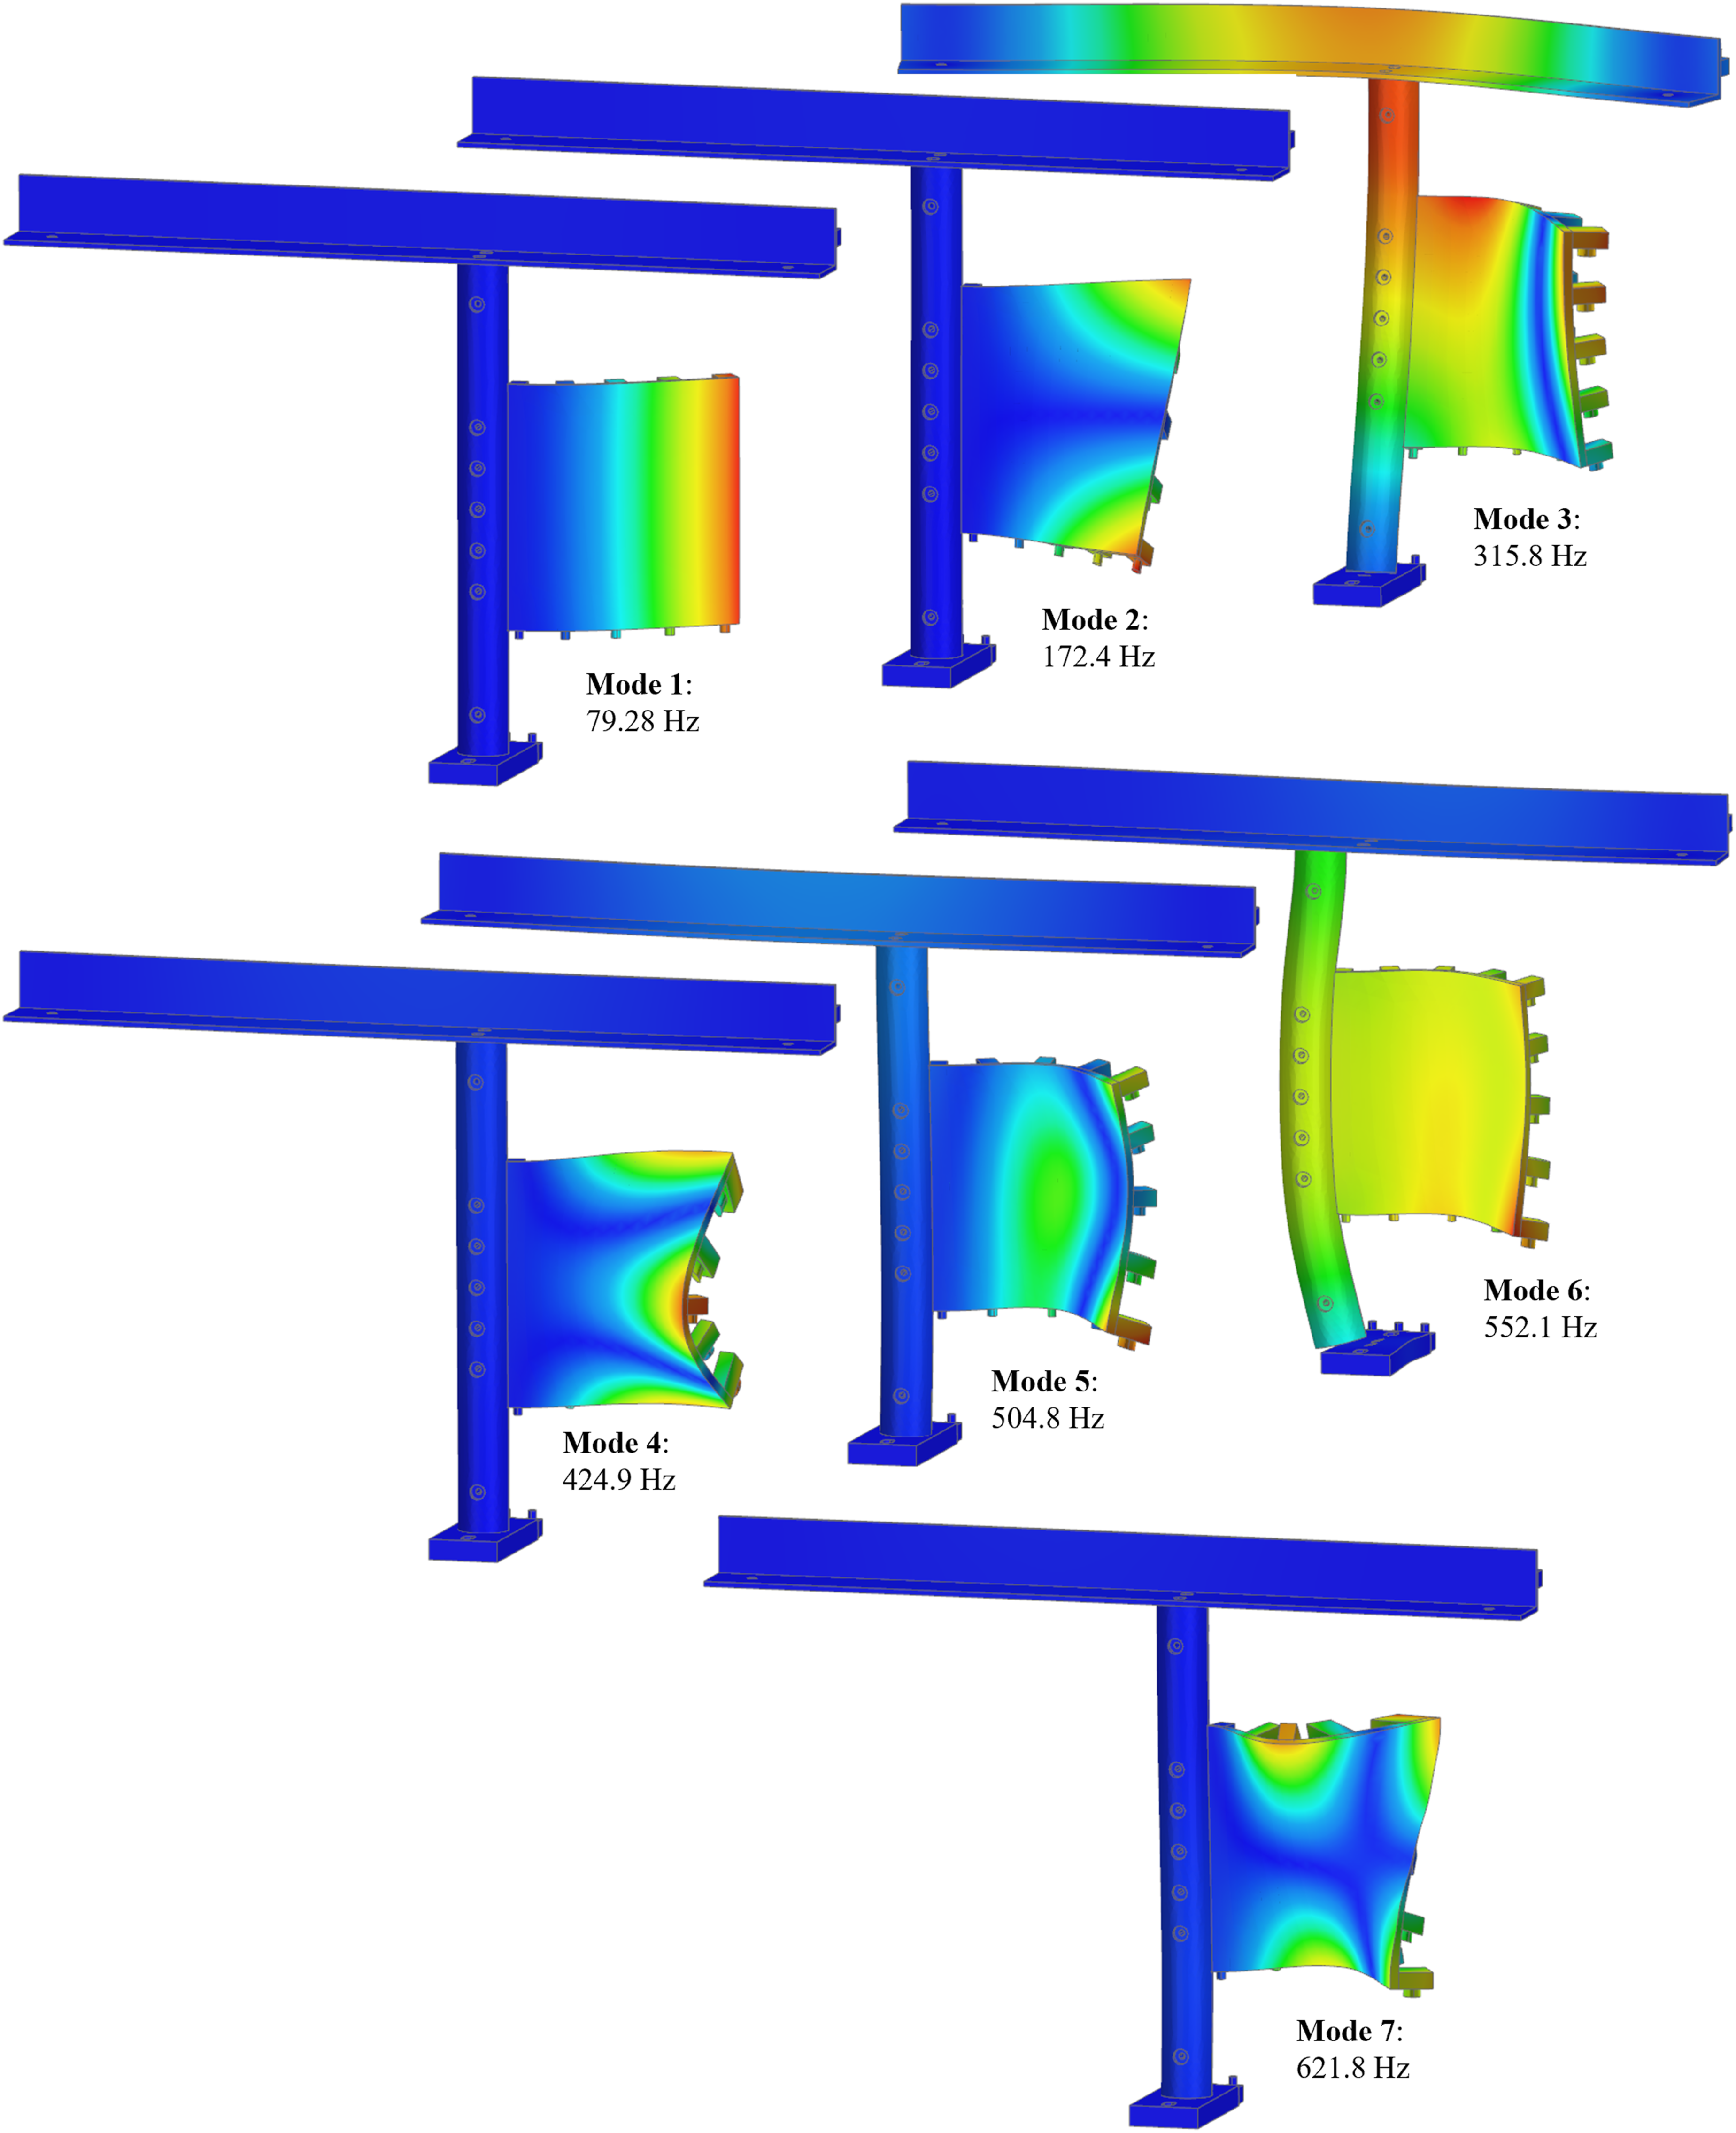
3.2. EMA results and analysis
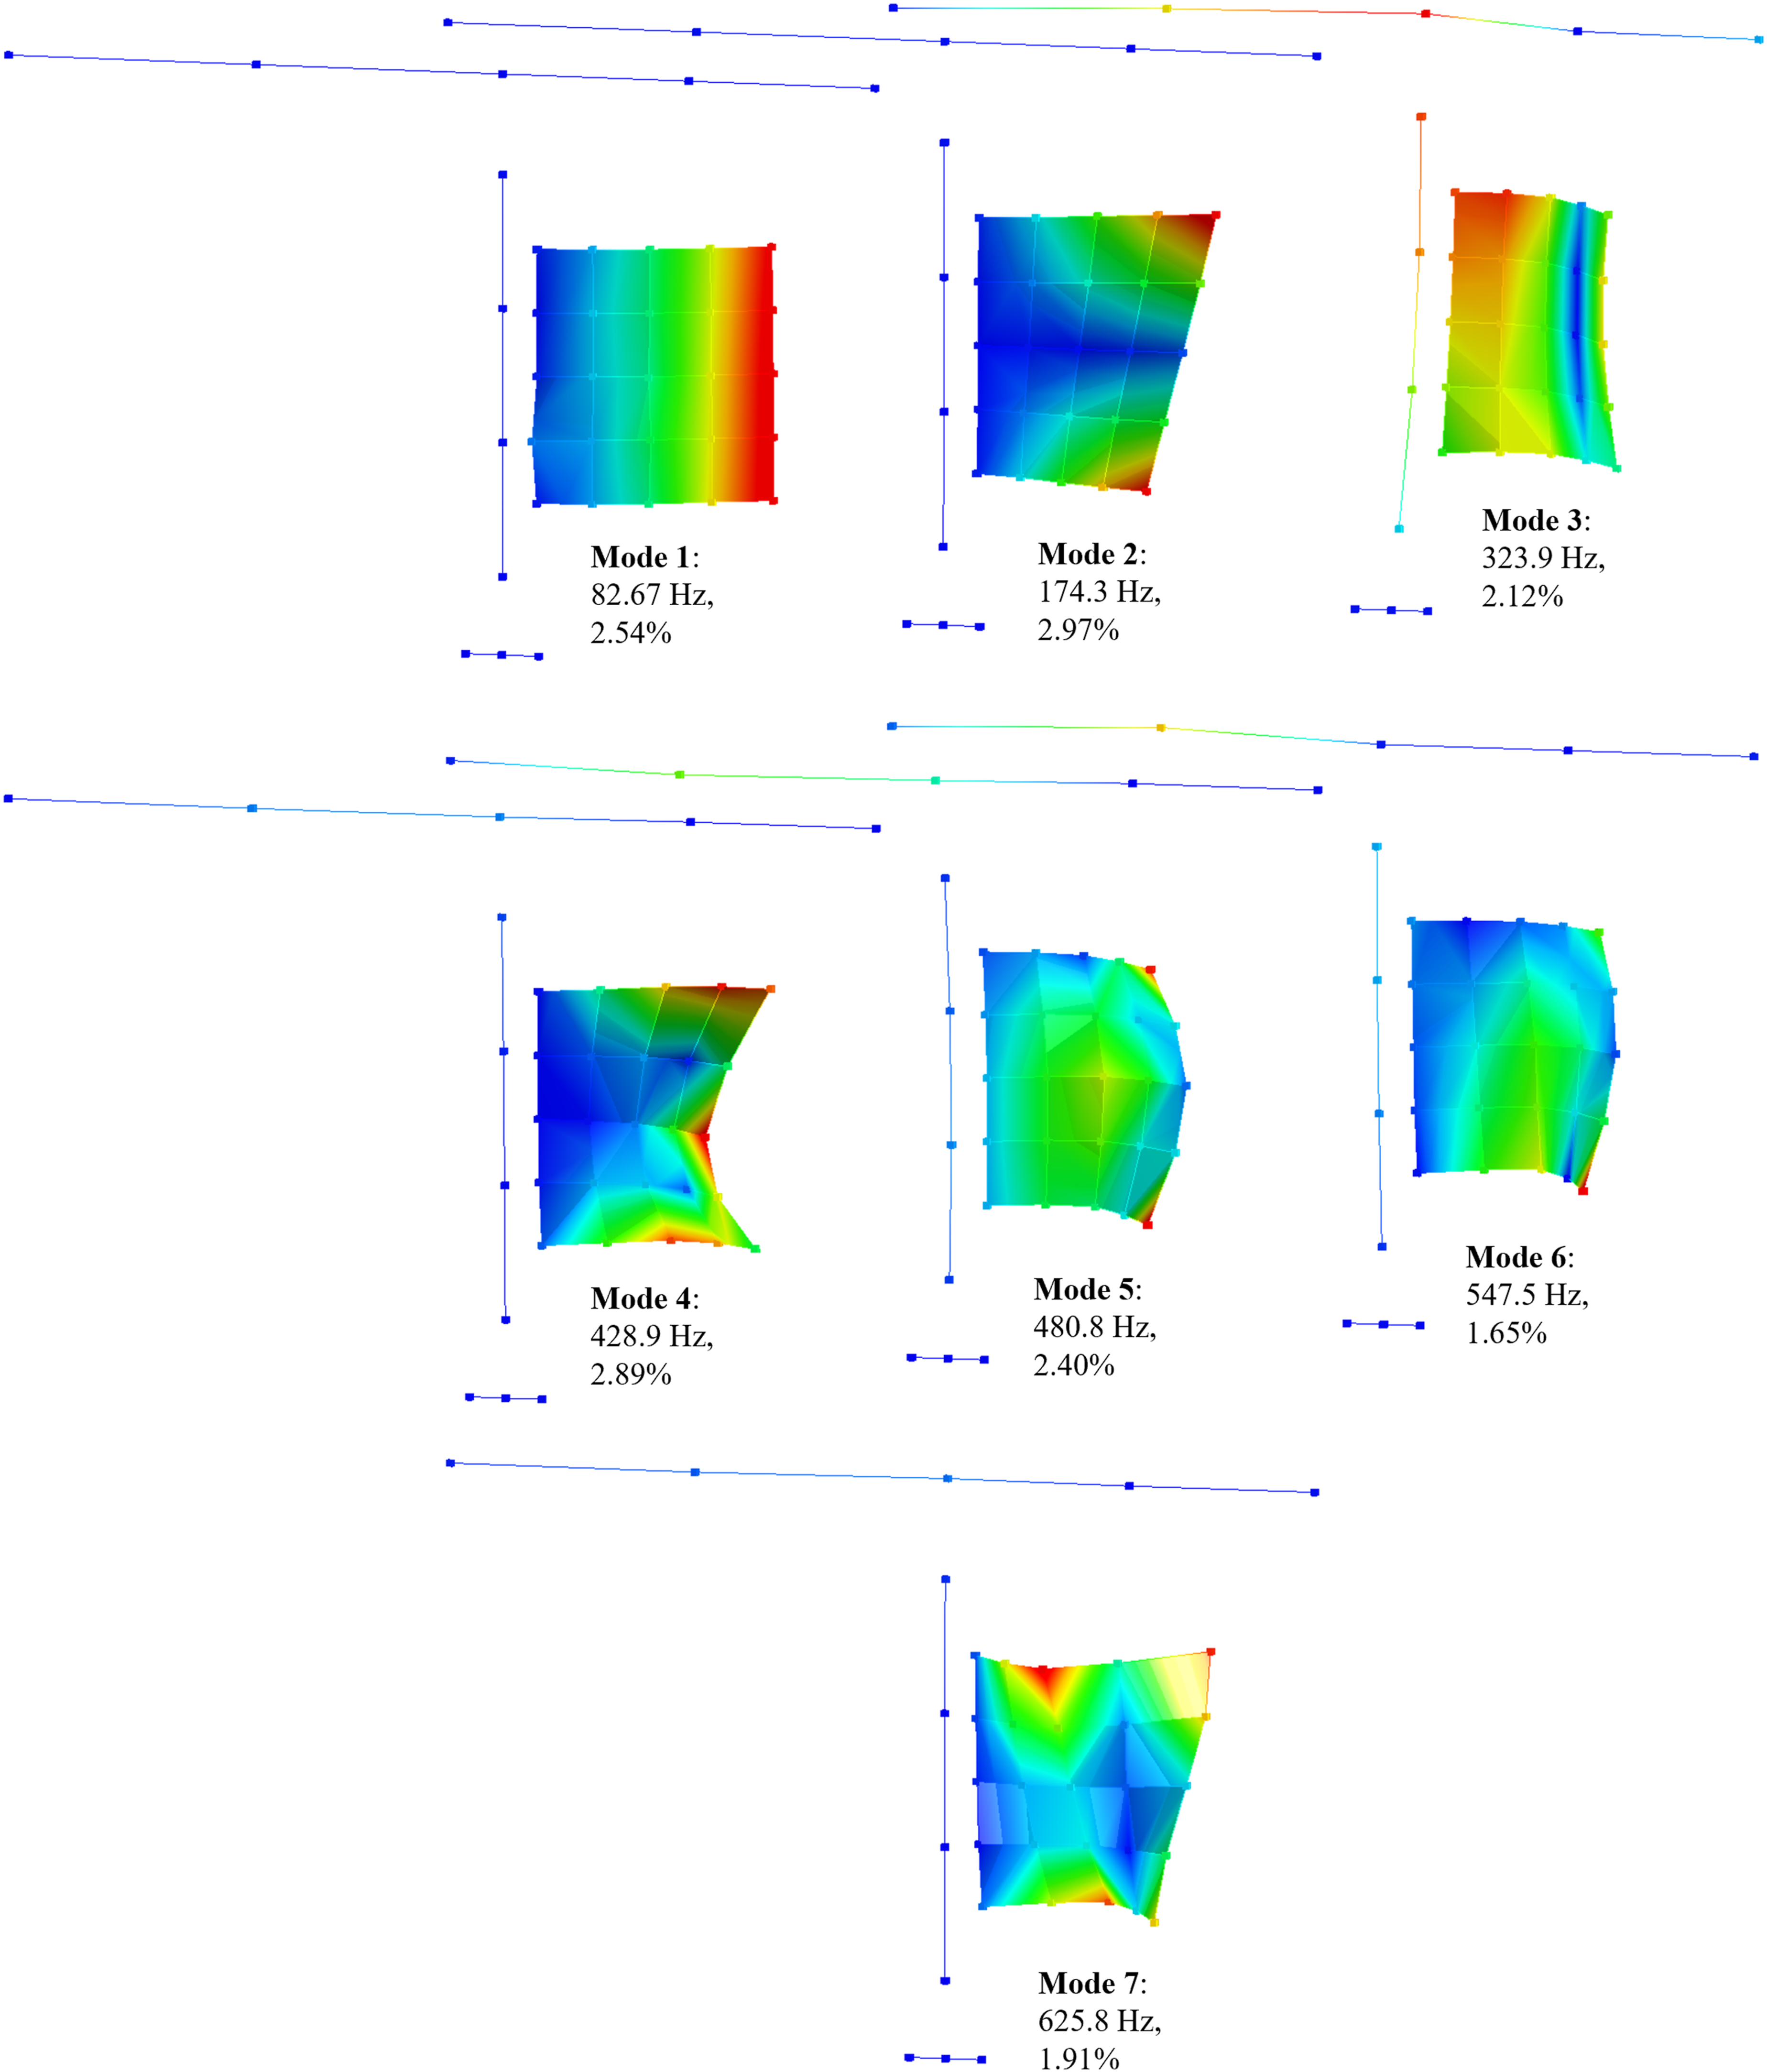
After three hammer impacts, Testlab’s PolyMAX (Peeters et al., 2004) algorithm was used to curve fit the FRFs. The first seven stable modes were selected within a frequency band of 0–700 Hz, as shown in Figures 5 and 6, where the modes are indicated by the FRF peaks in Figure 5. Mode 1 is the first bending mode of the plate, mode 2 is the first torsional mode of the plate, and mode 3 is an out-of-plane bending mode of the cylinder, upper mounting bracket, and plate. Modes 4 through 7 are out-of-plane bending or torsional modes of the plate with minor out-of-plane bending of the cylinder and the upper mounting bracket. Due to its relatively short length and the fact that it is fastened to the stiff base of the EWT test section, the lower mounting bracket exhibits little to no bending in any of the first seven modes. Resulting EMA FRF from modal curve fitting using the PolyMAX algorithm. First seven mode shapes and their corresponding frequency and damping values.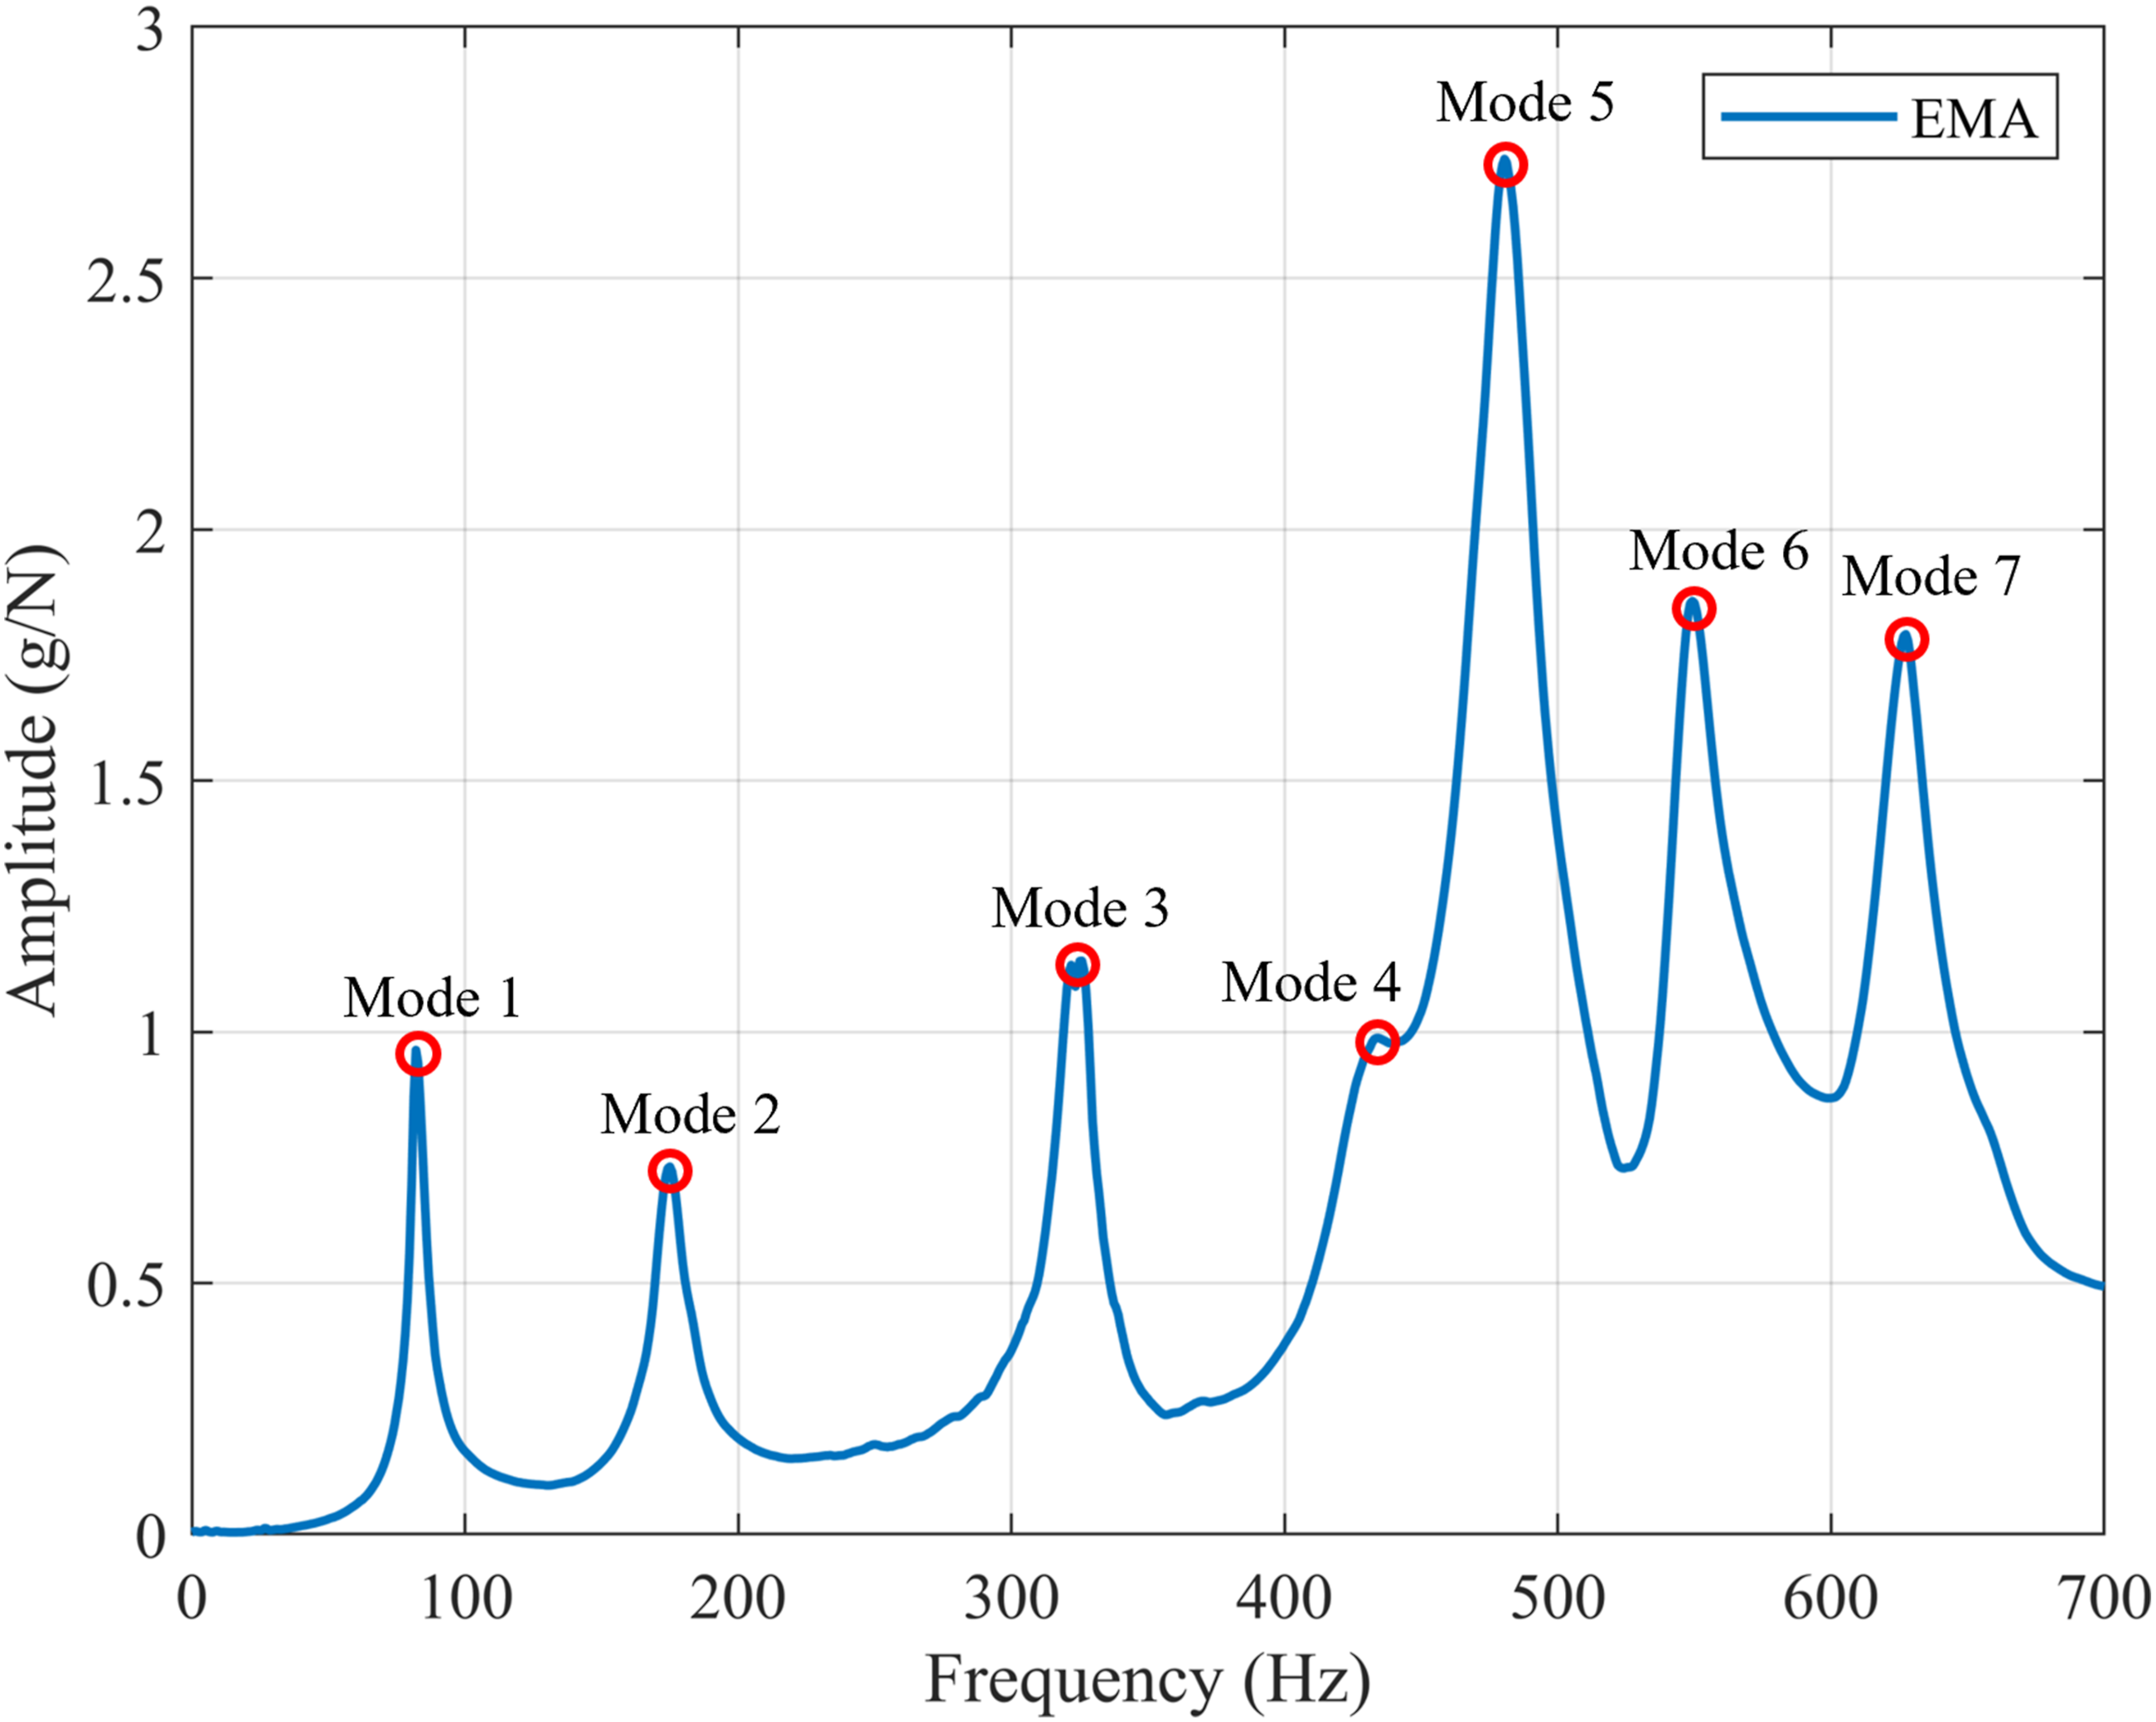
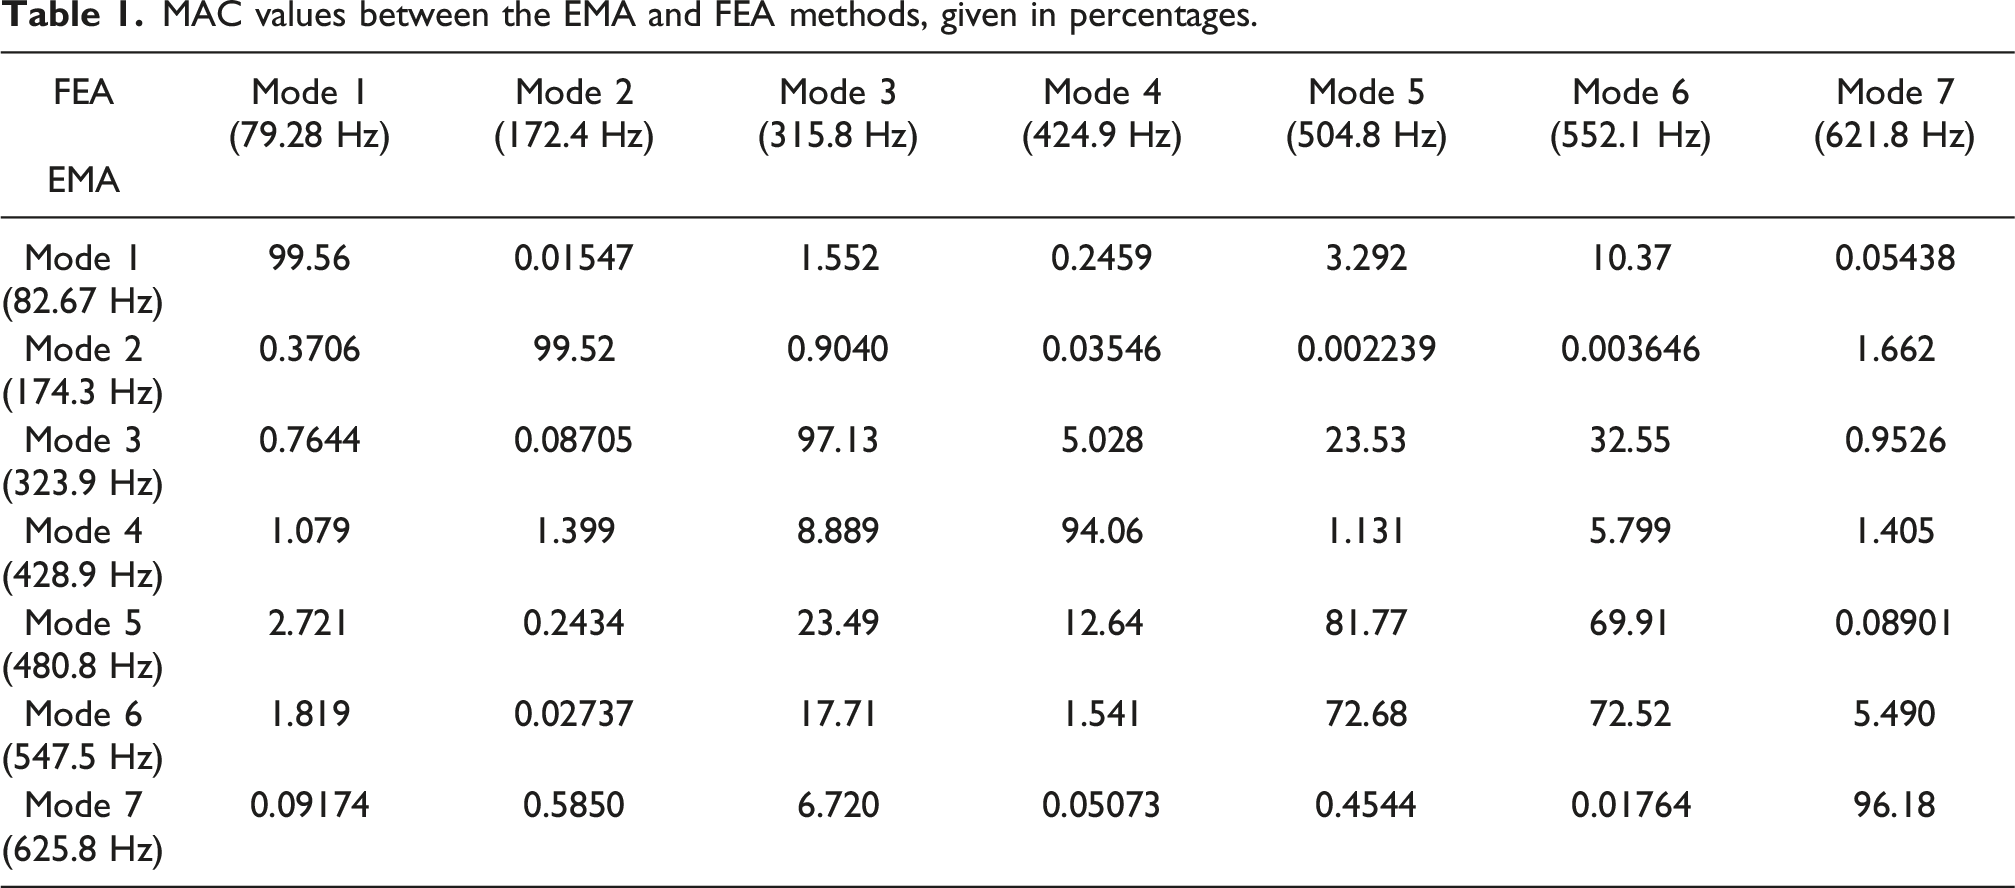
MAC values between the EMA and FEA methods, given in percentages.
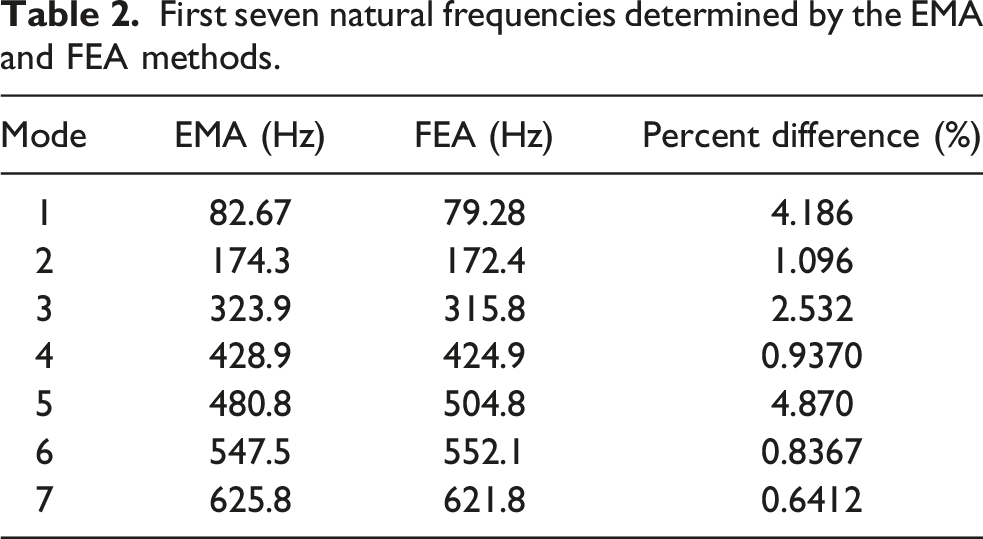
First seven natural frequencies determined by the EMA and FEA methods.
3.3. CTA mean airflow velocity and turbulence intensity results and analysis
A post-test calibration was performed using updated ambient pressure and thermistor resistance measurements. The CTA voltage data were converted into two datasets of airflow velocities using the pre-test and post-test calibration curves. The two datasets were averaged (Jørgensen, 2005) and the mean airflow velocity distribution at each of the four measurement planes in the X-direction were plotted for a free-stream velocity of 30 m/s, as shown in Figure 7. The plot shows the largest velocity range of 38.0 m/s at the X = 0 mm plane in Figure 7(a), with a minimum velocity of 4.7 m/s and a maximum velocity of 42.7 m/s. The minimum velocity occurs directly behind the cylinder (X = 0 mm) and closest to the plate (Z = 12.7 mm) at the on-plate and threshold positions. The maximum velocity occurs at X = 0 mm and near Z = 25.4 mm along the Y-direction, as the airflow accelerates over the curved surface of the cylinder. After the velocity reaches its maximum value near Z = 25.4 mm, the velocity begins to decrease back towards the free-stream velocity as the distance along the Z-direction increases. At the X = 50.8 mm plane in Figure 7(b), the velocity range decreases to 35.2 m/s, with a minimum velocity of 7.5 m/s and a maximum velocity of 42.7 m/s. The minimum velocity occurs closest to the plate at the on-plate and threshold positions and the maximum velocity occurs near Z = 25.4 mm and Z = 38.1 mm along the Y-direction. After reaching its maximum value, the velocity begins to decrease back towards the free-stream velocity as the distance along the Z-direction increases. At the X = 101.6 mm plane in Figure 7(c), the velocity range decreases further to 25.5 m/s, with a minimum velocity of 12.4 m/s and a maximum velocity of 37.9 m/s. The minimum velocity occurs closest to the plate at the on-plate position and the velocity increases as the distance along the Y-direction increases, indicating the reduced velocity caused by the plate. At the X = 152.4 mm plane in Figure 7(d), the velocity range decreases again to 16.5 m/s, with a minimum velocity of 17.9 m/s and a maximum velocity of 34.4 m/s. The minimum velocity occurs closest to the plate at the on-plate position. As the distance along the Y-direction increases, the velocity increases at the threshold and then decreases at the off-plate position, indicating that the abrupt transition of the threshold causes a small increase in velocity. To summarize these results, at each X-plane the velocity is always at a minimum closest to the plate due to boundary layer effects and shielding from the cylinder. The transition at the threshold yields interesting results closest to the plate where for X = 0 mm and X = 50.8 mm, the velocity is reduced. However, closest to the plate and further downstream at X = 101.6 mm and X = 152.4 mm, the velocity increases at the threshold. This key difference is likely caused by disturbance of the vortices at the plate threshold. Mean airflow velocity around the cylinder and plate at planes (a) X = 0 mm, (b) X = 50.8 mm, (c) X = 101.6 mm, and (d) X = 152.4 mm for a free-stream velocity of 30 m/s.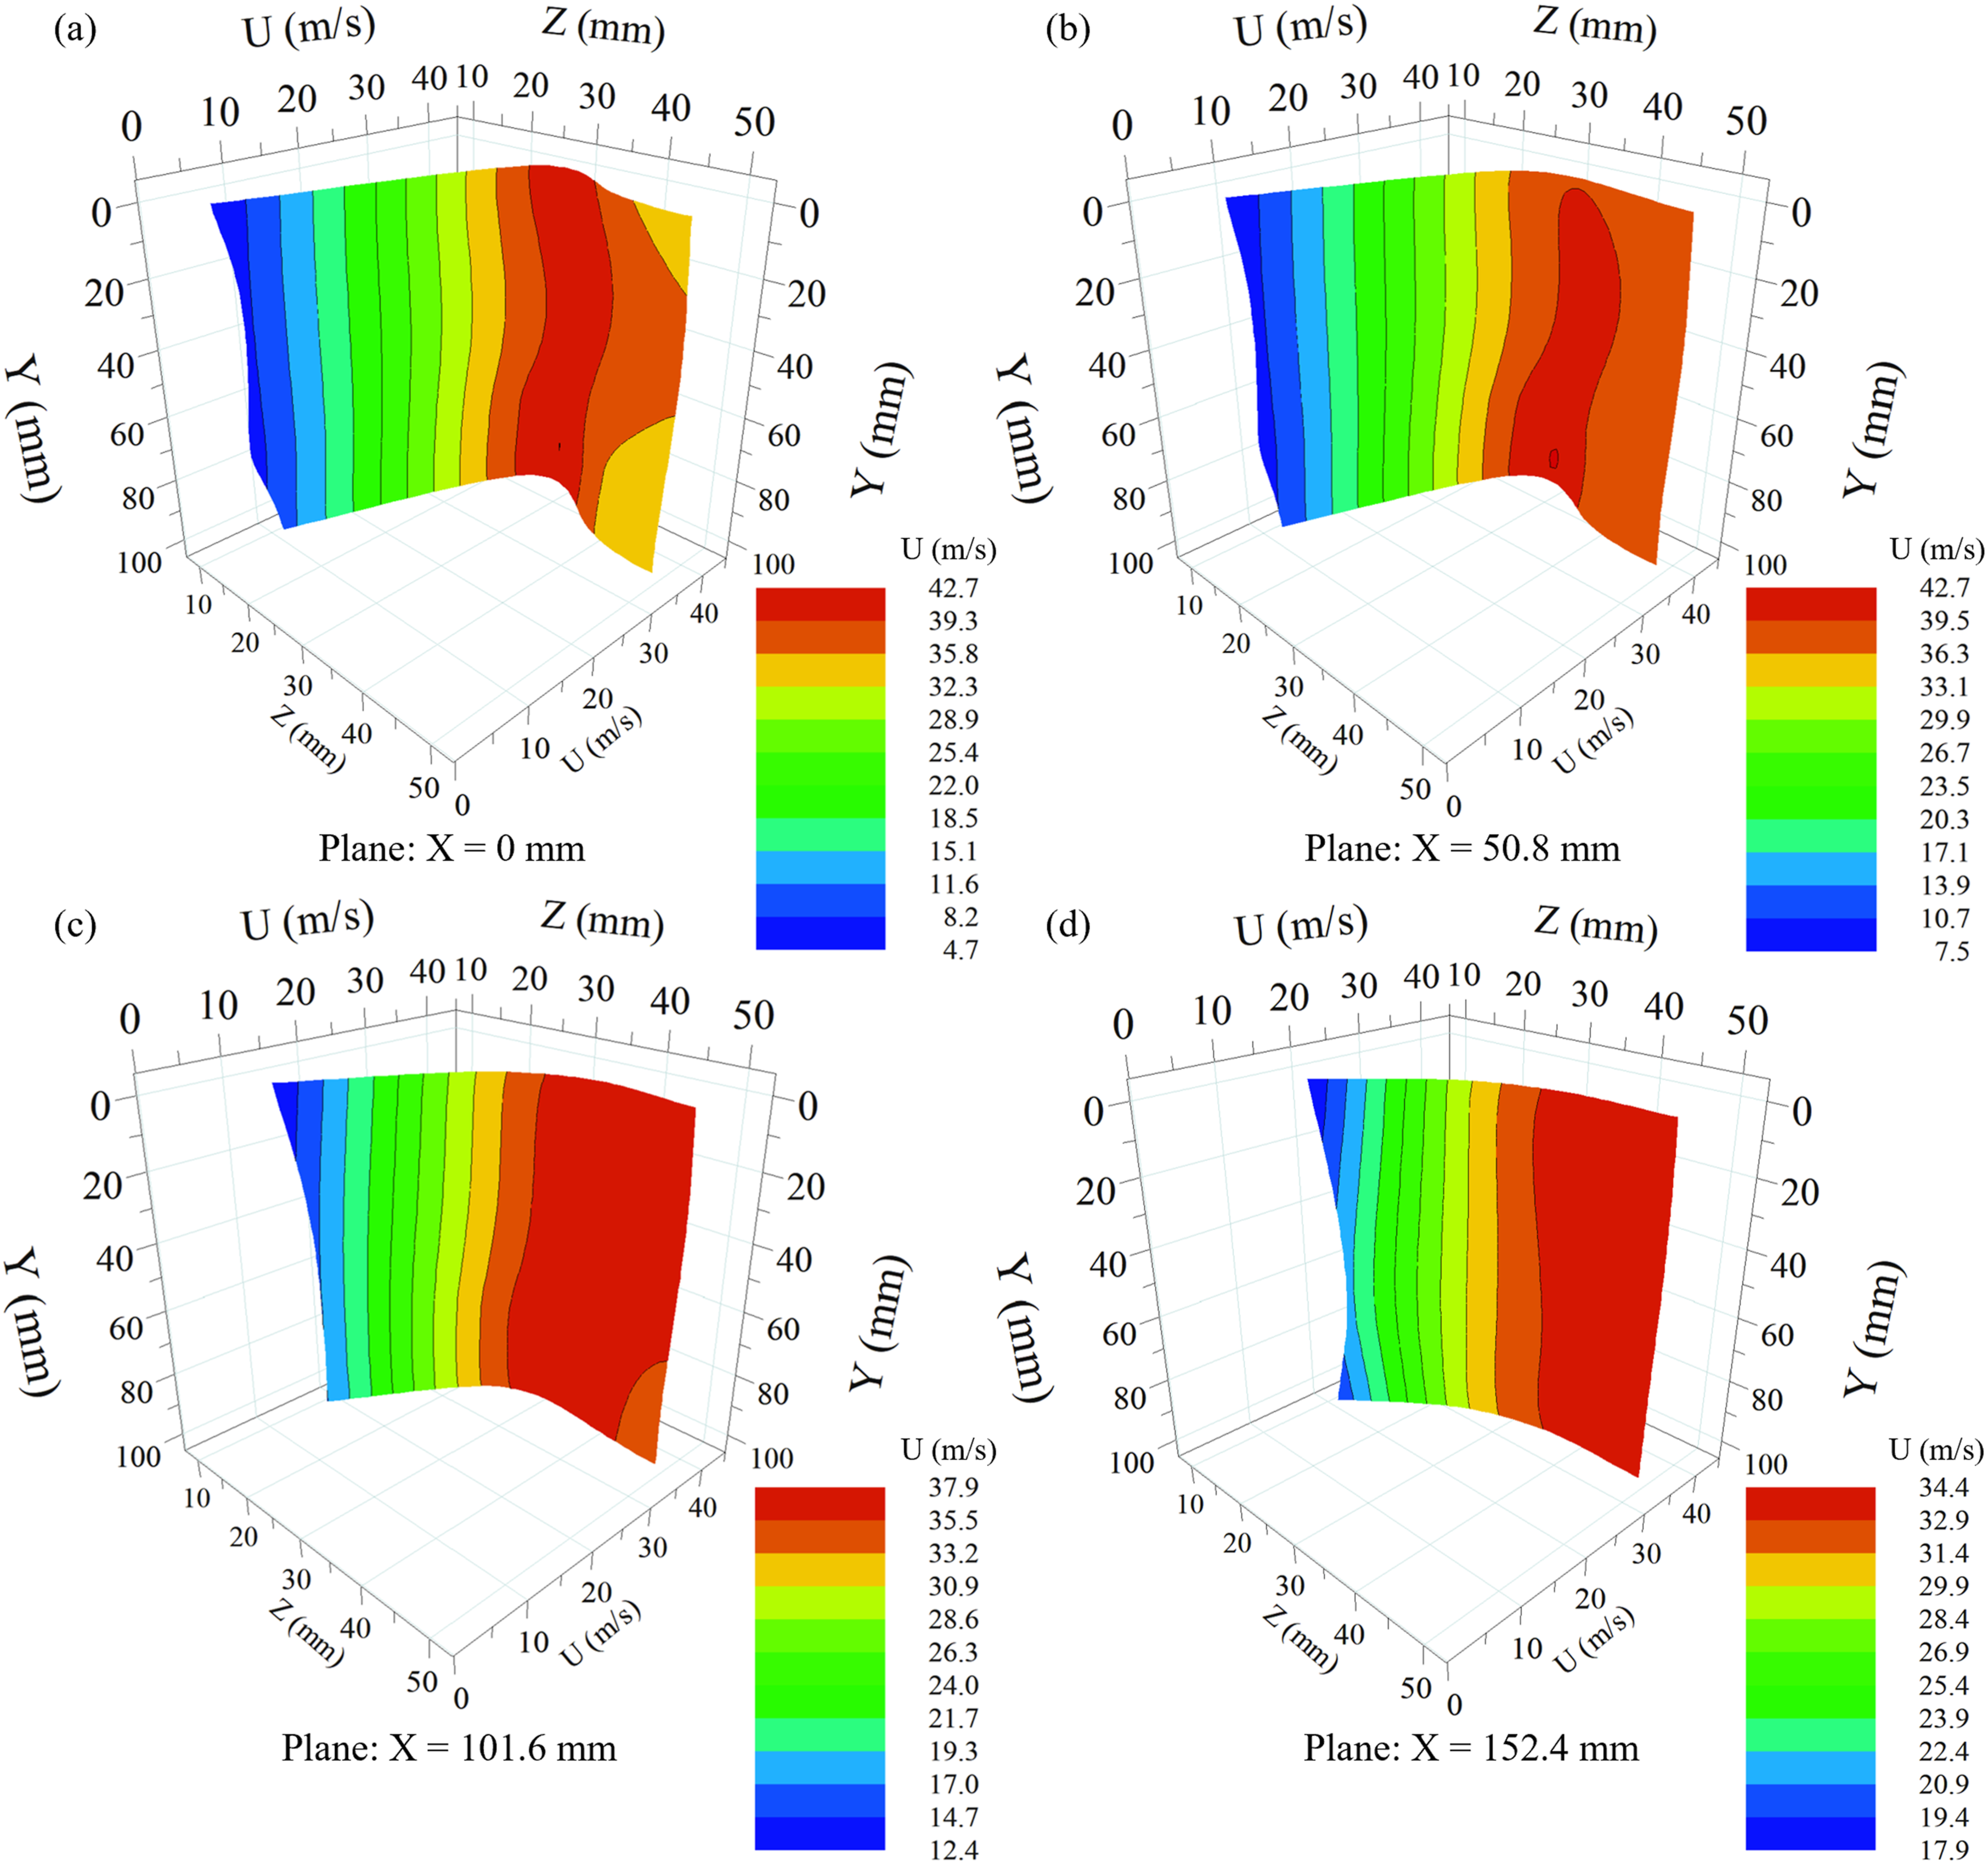
Next, the turbulence intensity of the airflow was calculated at each of the four measurement planes in the X-direction for a free-stream velocity of 30 m/s, as shown in Figure 8, where the turbulence intensity ranges from 1.2% to 57.2%. The turbulence intensity at each X-plane is highest closest to the cantilever plate near Z = 12.7 mm and decreases as the distance from the plate increases in the +Z-direction. As the turbulence intensity is relatively high near Z = 12.7 mm along the Y-direction for each X-plane, it is evident that the turbulence is caused by the airflow’s interaction with the cylinder and cantilever plate. Turbulence intensity around the cylinder and cantilever plate at planes (a) X = 0 mm, (b) X = 50.8 mm, (c) X = 101.6 mm, and (d) X = 152.4 mm at a free-stream velocity of 30 m/s. The turbulence intensity ranges from 1.2% to 57.2%.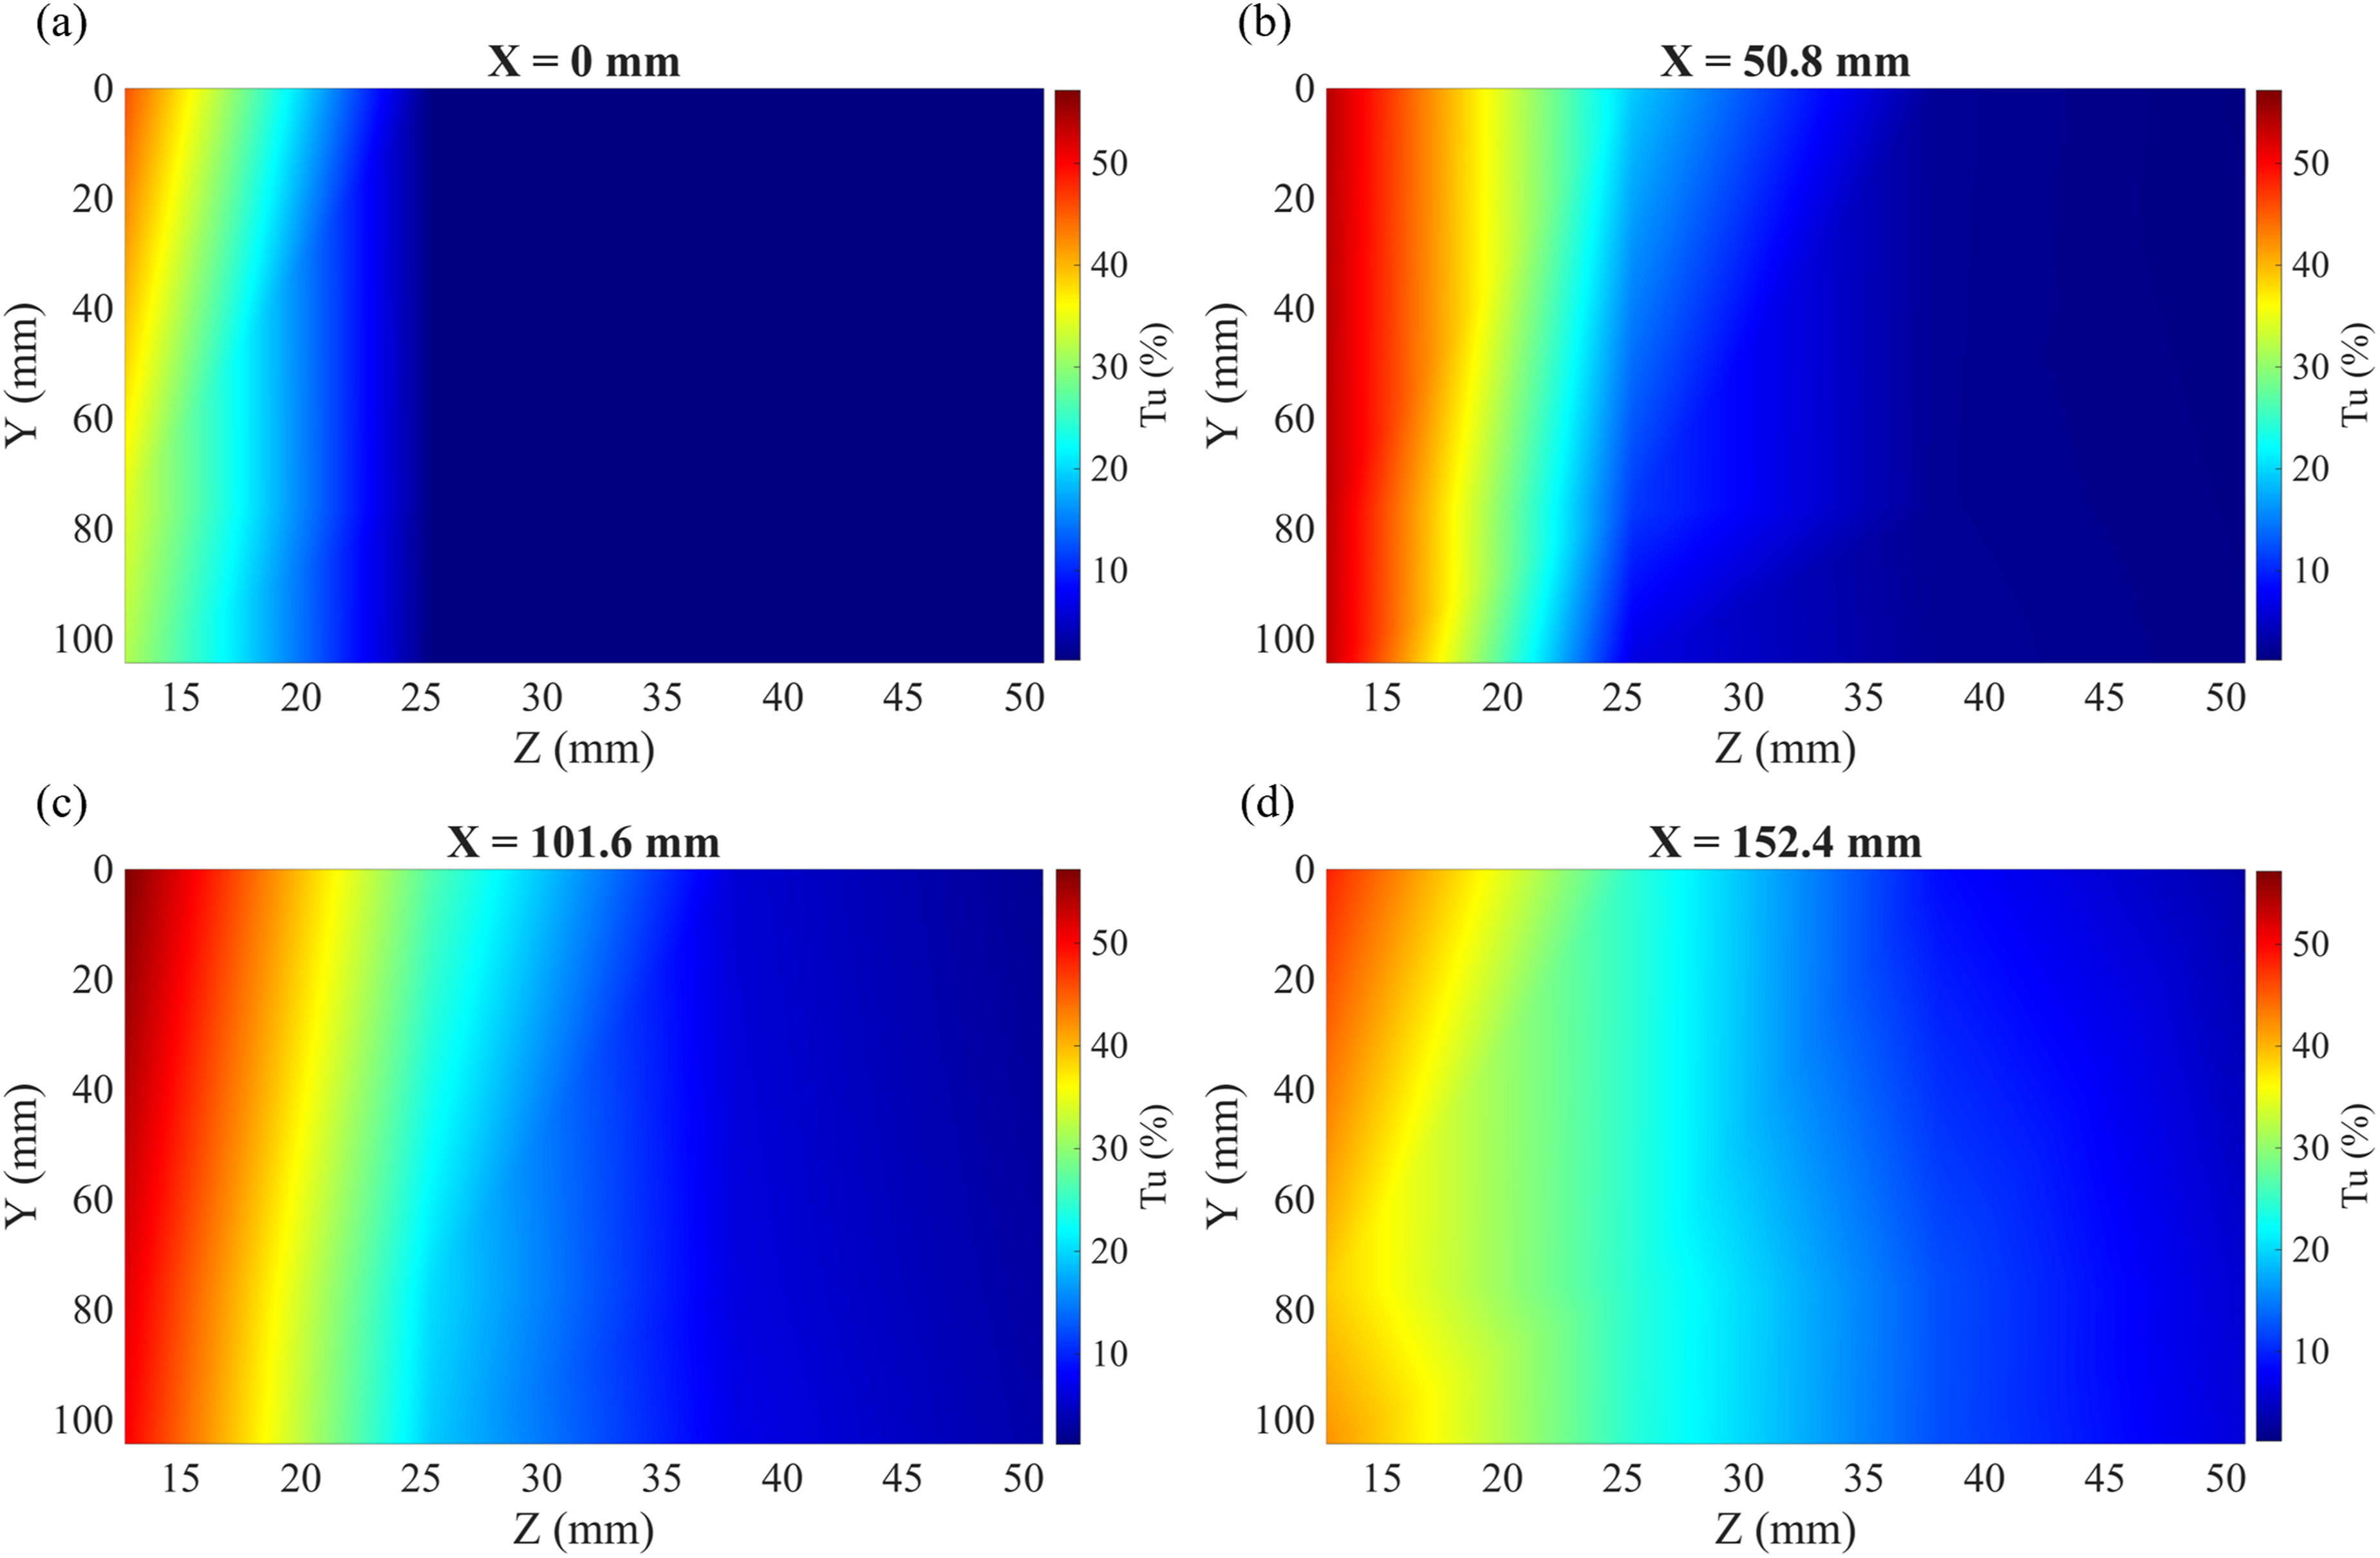
3.4. CTA PSD results and analysis
The PSD of the voltage versus time signal provides insight into the energy distribution of the signal with respect to frequency (Jørgensen, 2005), where the peaks indicate the vortex shedding frequencies at the probe location. The PSD was plotted for the Z = 12.7 mm and Z = 50.8 mm planes (24 of the 48 test points) by applying a Hamming window 1000 measurements in length and using 500 overlapped measurements with a block size of 131,072 measurements, as shown in Figures 9 and 10. Each subplot contains a PSD curve of the on-plate, threshold, and off-plate positions to illustrate the effect that the plate has on the airflow. Peaks of interest in the PSDs are those that fall within a shedding frequency range of 3.0 Hz up to the theoretical shedding frequency defined by equation (1), plus a tolerance of 15%. For the free-stream velocity of 30 m/s, the range of interest is from 3.0 Hz to 217.0 Hz. Although there may be multiple peaks, the location and natural frequency of the peaks with the highest prominence are identified. PSDs of the voltage versus time signals for the Z = 12.7 mm plane. PSDs of the voltage versus time signals for the Z = 50.8 mm plane.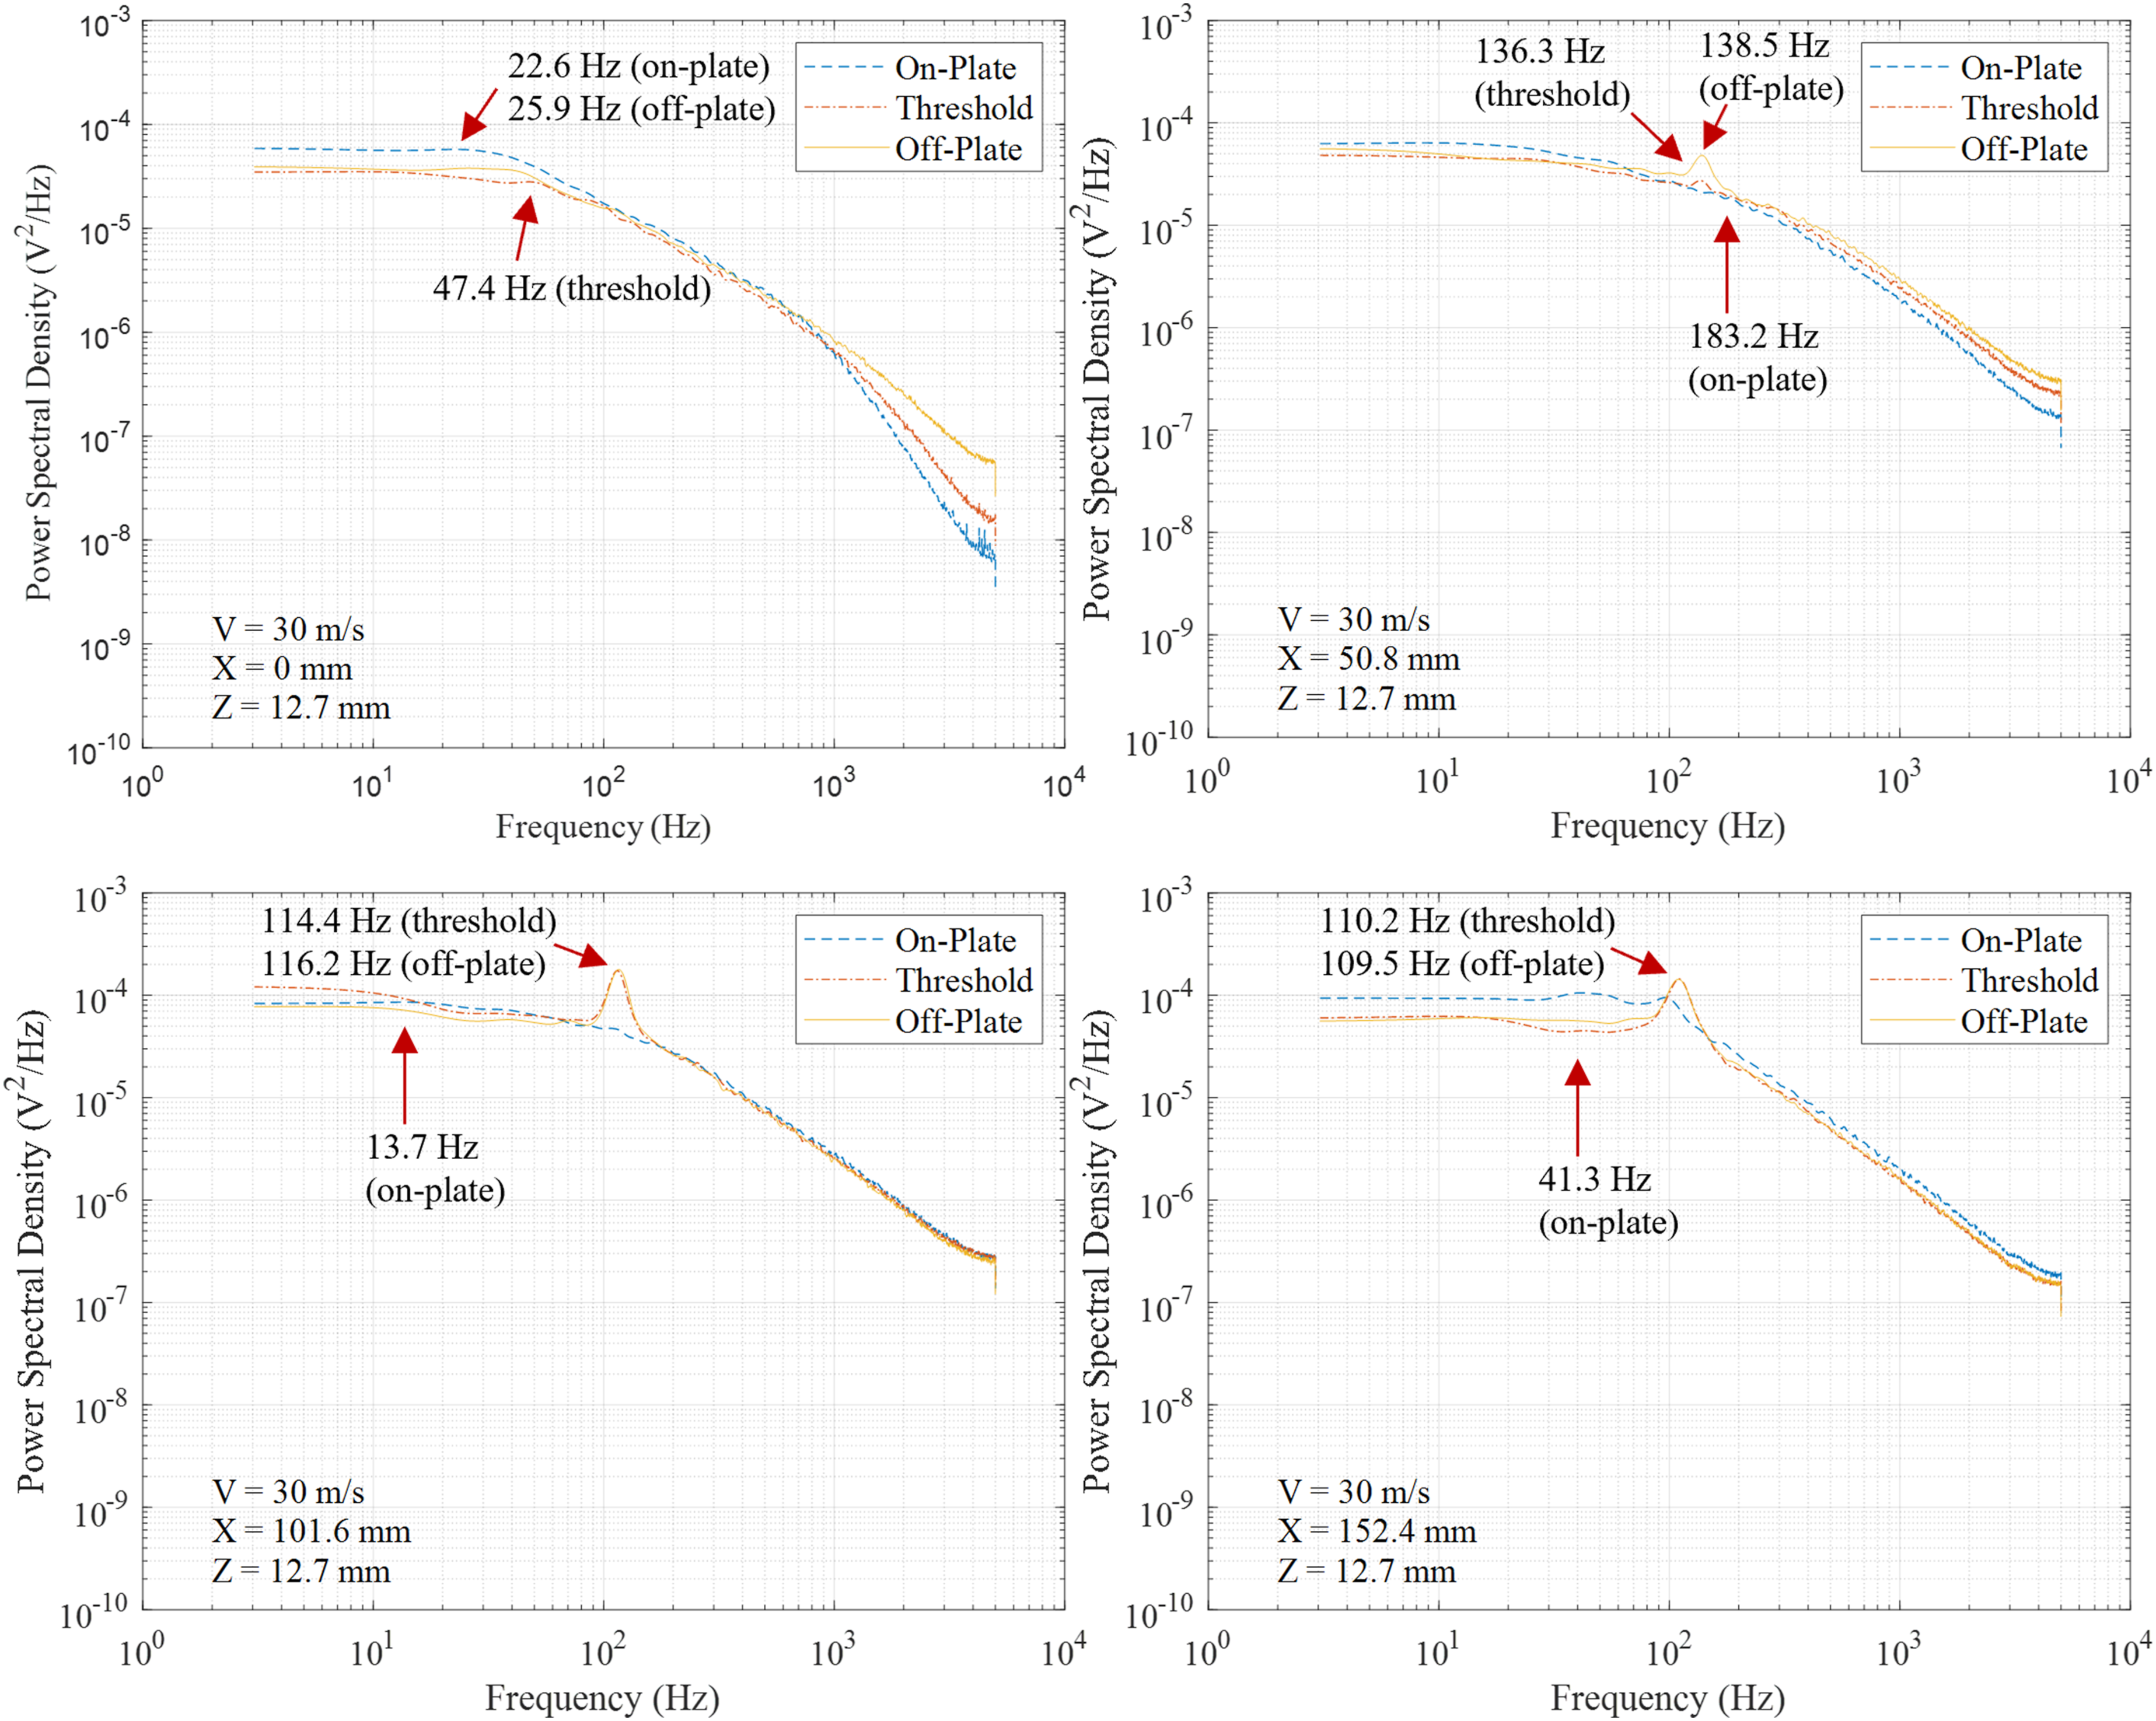
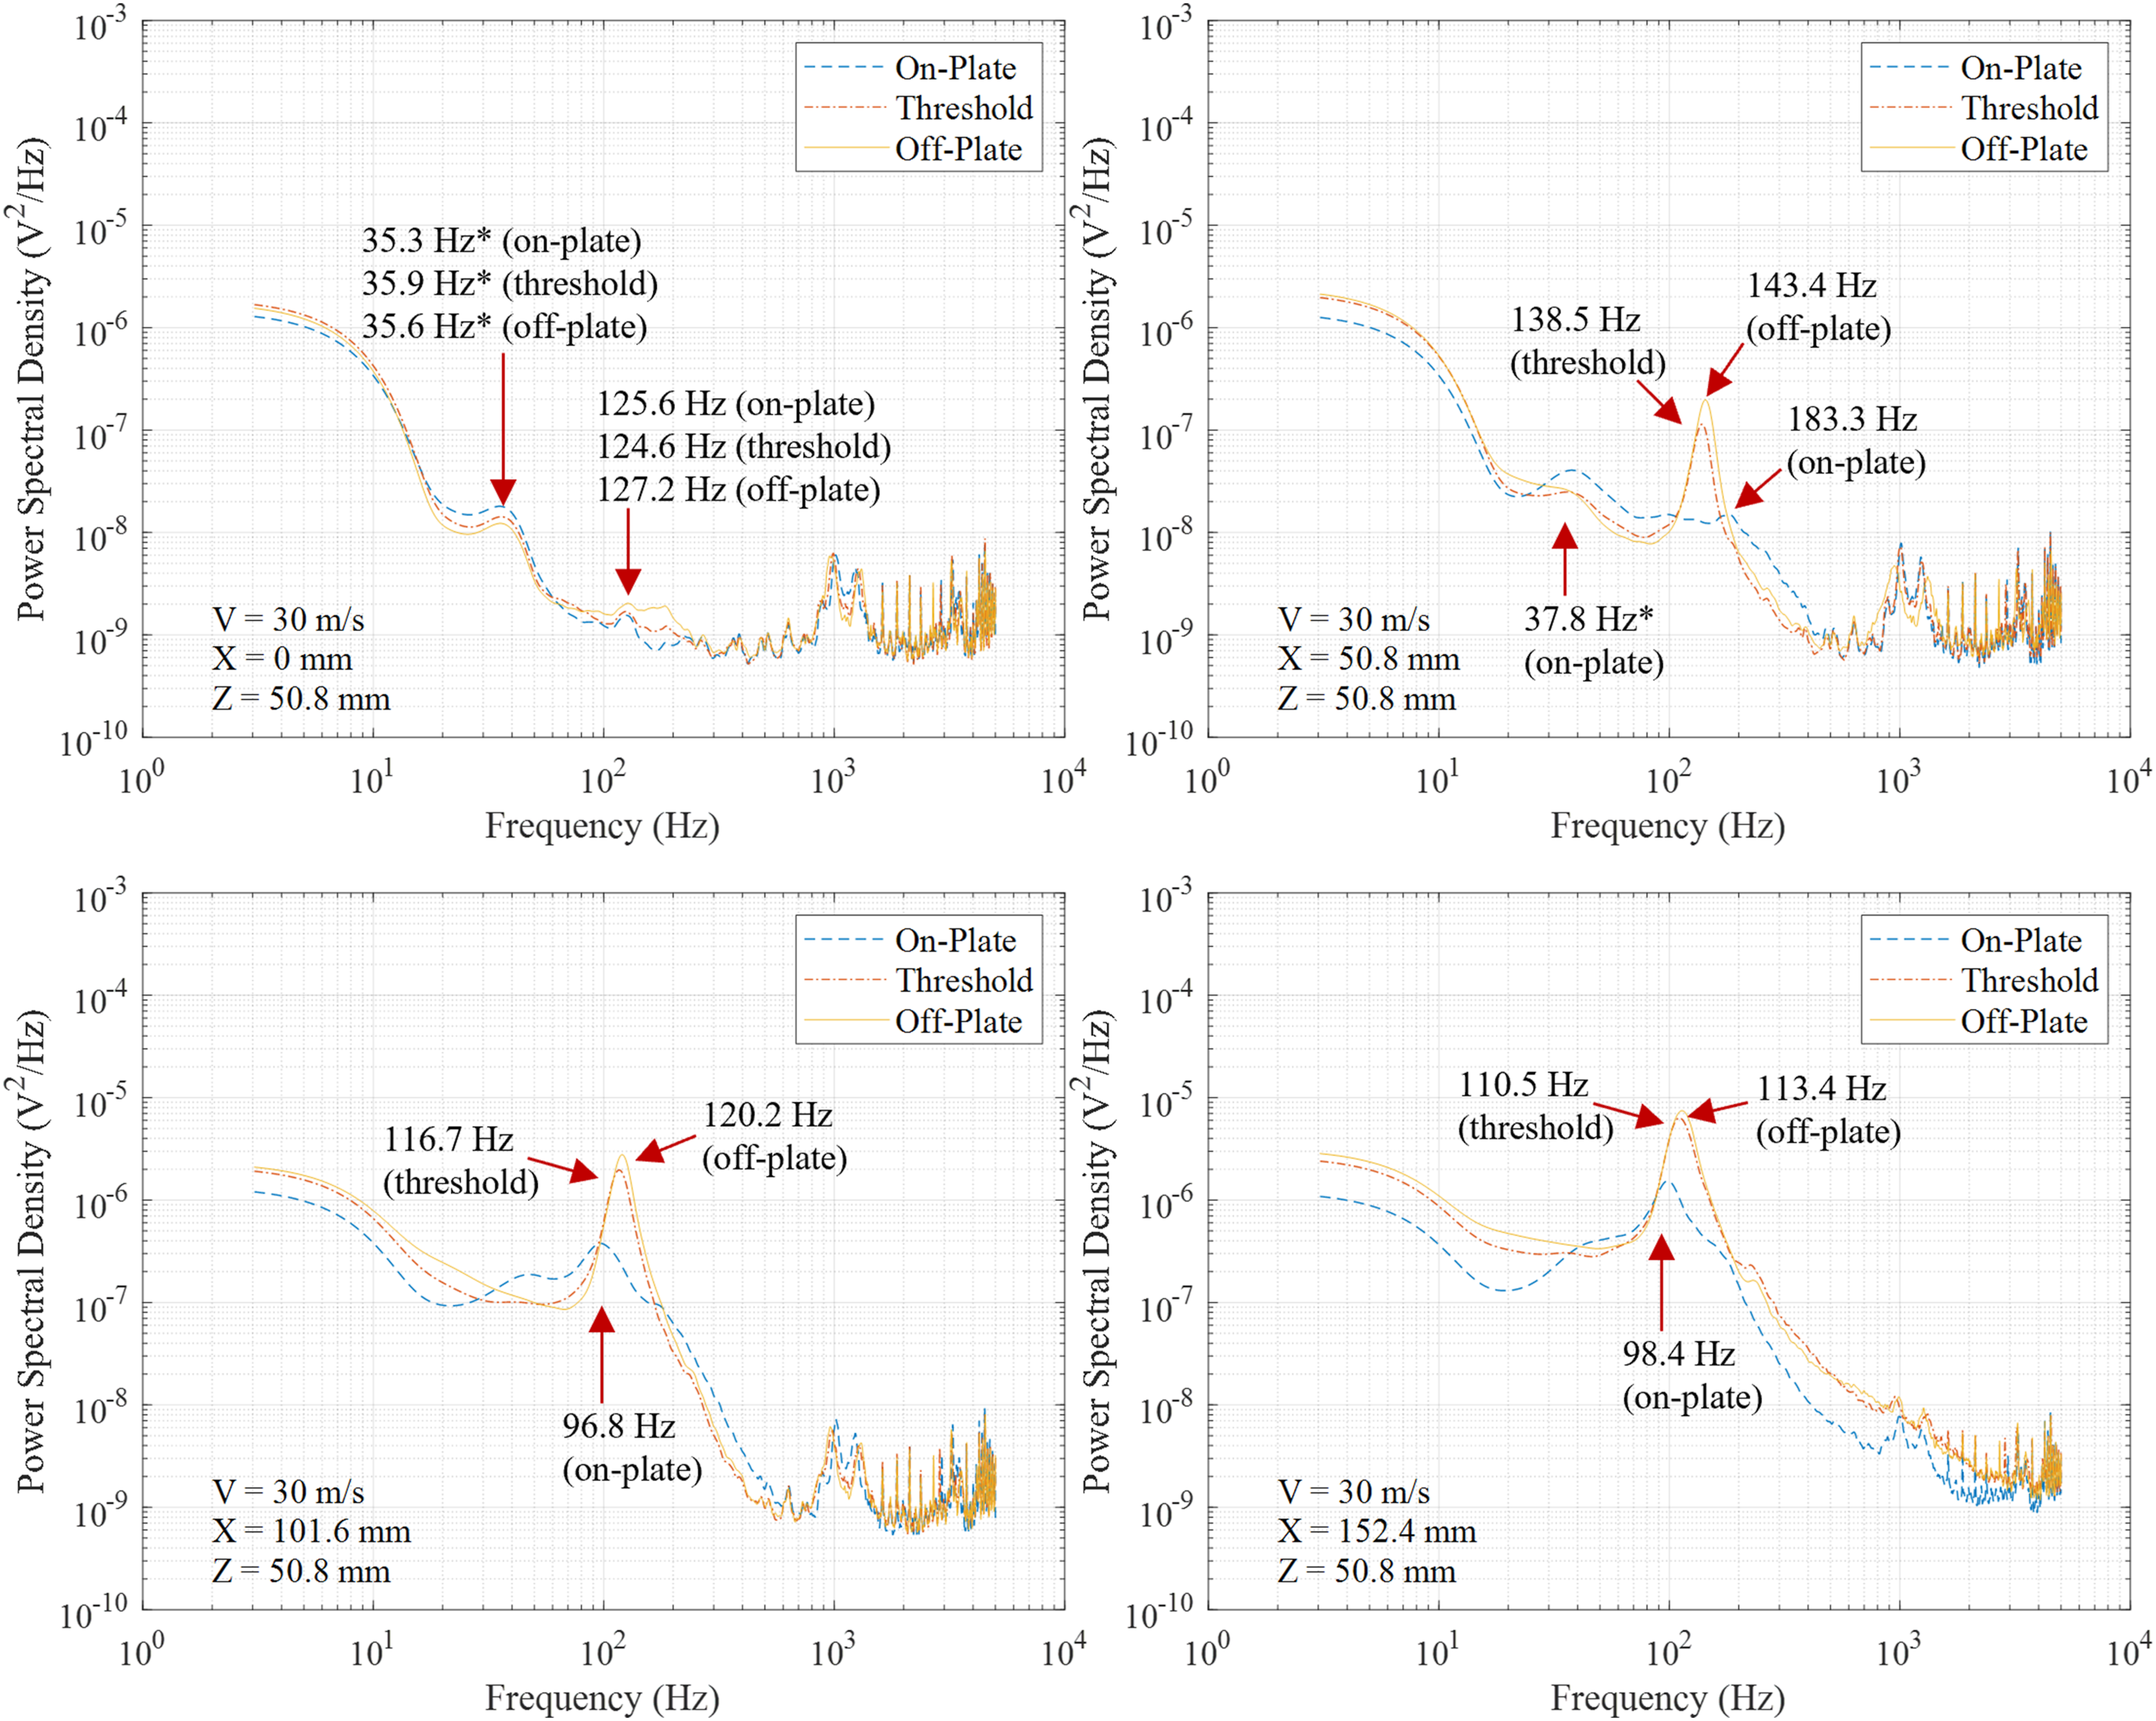
To characterize the EWT and account for any inherent vortex shedding frequencies, a CTA experiment was performed without the experimental structure installed and the results showed peaks from 35.0 Hz to 35.8 Hz at all 48 measurement locations. This vortex shedding inherent to the wind tunnel could be caused by an inefficient honeycomb flow straightener. Although unfavorable, this is managed by characterization of the EWT so any prevailing vortex shedding frequencies can be accounted for in the results. Therefore, the PSDs that have peaks resulting from the wind tunnel itself (assumed to be those within 33.0 Hz to 37.8 Hz, inclusive) are identified by asterisks next to their respective frequencies in the PSD subplots. In these cases, the second highest prominence peak within the frequency range of interest is also identified in the PSD subplots.
Apart from the X = 0 mm, Z = 12.7 mm plane, all on-plate measurements have reduced signal energy due to the plate, where the highest prominence on-plate signal peaks are smaller in amplitude than the highest prominence threshold and off-plate signal peaks, independent of any peaks caused by the wind tunnel. Also, except for the X = 50.8 mm, Z = 12.7 mm, X = 0 mm, Z = 50.8 mm, and X = 50.8 mm, Z = 50.8 mm planes, the frequency of the highest prominence peak at the on-plate position is lower than that of the threshold and off-plate positions, independent of any peaks caused by the wind tunnel. Still, for these exceptions the amplitude of the highest prominence on-plate peak is lower than that of the highest prominence threshold and off-plate peaks. At the threshold, apart from the X = 152.4 mm, Z = 12.7 mm plane, the amplitudes of the highest prominence peaks are smaller than the highest prominence peaks of the off-plate positions. In all cases, the frequencies of the highest prominence on-plate peaks are less than the theoretical shedding frequency of 188.7 Hz for the flow over a cylinder given by equation (1). This phenomenon of reduced shedding frequency and Strouhal number due to a splitter plate has been reported in previous works (Anderson and Szewczyk, 1997; Apelt and West, 1975; Jin and Chamorro, 2017). According to Anderson and Szewczyk (1997), for
All PSD peaks (highest prominence and otherwise) within the frequency range of interest were identified, including those caused by the wind tunnel, and the shedding frequencies versus X-positions were plotted for the Z = 12.7 mm and Z = 50.8 mm planes as shown in Figure 11. Note that data points connected by lines indicate the peaks of highest prominence, while data points not connected by lines indicate the peaks of lesser prominence. If a peak that was caused by the wind tunnel was the highest prominence peak in the PSD (indicated by an asterisk in the PSD plots), it is included in Figure 11 as a standalone data point but it is not connected by a line, as the intent is to highlight the peaks with highest prominence caused by the experimental structure. Peak frequencies in the PSDs for a free-stream velocity of 30 m/s. The plotted lines indicate the peak frequencies of highest prominence within the frequency range of interest.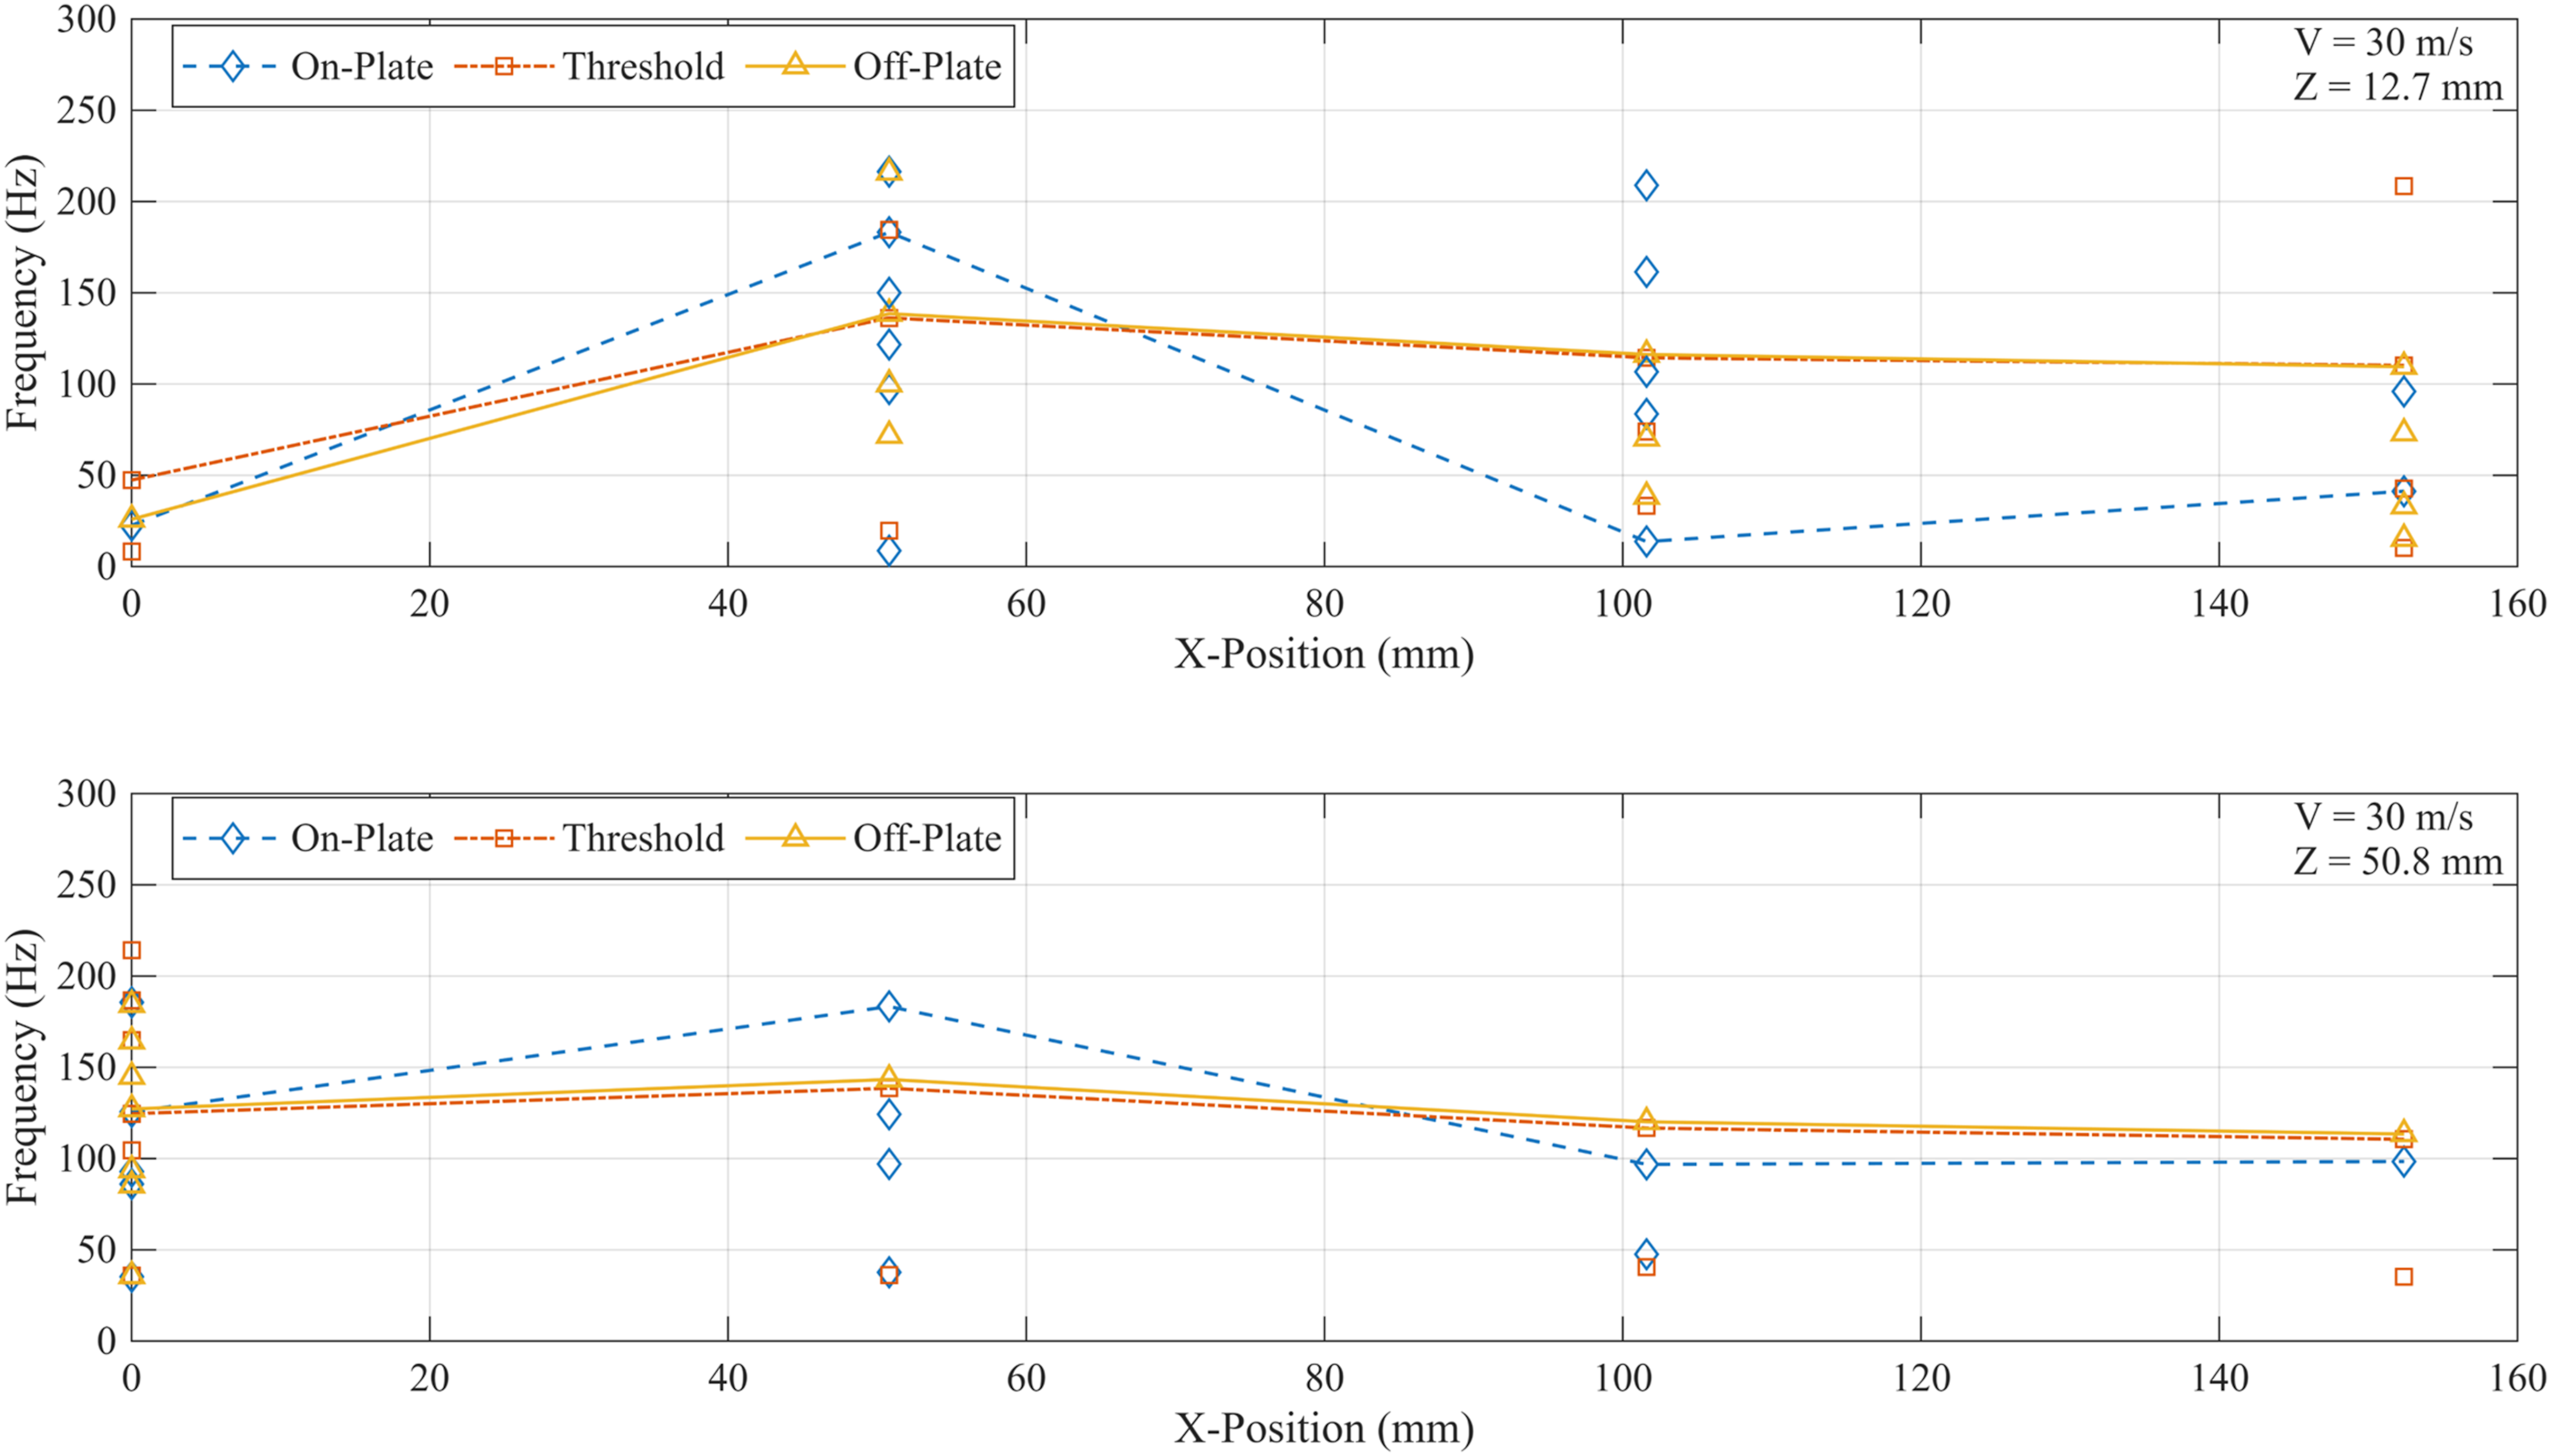
Some observations are as follows. In many cases, the highest prominence peaks are not peaks with the largest shedding frequency within the frequency range of interest (3.0 Hz to 217.0 Hz). The highest prominence peaks of the threshold and off-plate shedding frequencies increase from X = 0 mm to X = 50.8 mm, then decrease at X = 101.6 mm and decrease again at X = 152.4 mm. These results indicate that the highest prominence threshold and off-plate shedding frequencies are at a reduced value closest to the cylinder but then increase to a maximum value at X = 50.8 mm where the vortices have fully formed as air flows over the cylinder. The highest prominence threshold and off-plate shedding frequencies then decrease due to energy loss from drag as the downstream distance increases. The highest prominence peaks of the on-plate shedding frequencies show different behavior. For example, at the Z = 12.7 mm on-plate plane, the shedding frequency of the highest prominence peak shows oscillatory behavior, starting at 22.6 Hz at X = 0 mm, increasing to 183.2 Hz at X = 50.8 mm, decreasing to 13.7 Hz at X = 101.6 mm, and then increasing to 41.3 Hz at X = 152.4 mm. Similarly, at the Z = 50.8 mm on-plate plane, the shedding frequency of the highest prominence peak starts at 125.6 Hz at X = 0 mm, increases to 183.3 Hz at X = 50.8 mm, decreases to 96.8 Hz at X = 101.6 mm, and then increases to 98.4 Hz at X = 152.4 mm. This oscillatory behavior is attributed mainly to the plate, which acts to disrupt the flow and vortices. There are 26 additional peaks in the Z = 12.7 mm plane, of which 10 are on-plate, 8 are threshold, and 8 are off-plate and 22 additional peaks in the Z = 50.8 mm plane, of which 8 are on-plate, 8 are threshold, and 6 are off-plate, indicating that the flow is not stable and that energy is distributed among additional shedding frequencies principally due to the plate. However, in addition to the four peaks caused by the wind tunnel, shear-layer instabilities, three-dimensional wake effects, streamwise vortex interactions, and airflow interference with the hot-wire probe likely contributed to the flow instability.
Identical experiments were performed at free-stream velocities of 20 m/s and 10 m/s, but for brevity, only the plots showing the peak frequencies in the PSDs are provided here in Figures 12 and 13, respectively. For the 20 m/s case shown in Figure 12, the highest prominence peaks are also the peaks with the largest shedding frequency within the frequency range of interest (3.0 Hz to 144.6 Hz) for the Z = 12.7 mm on-plate, threshold, and off-plate positions and the Z = 50.8 mm threshold position. The highest prominence peaks of the threshold and off-plate vortex shedding frequencies increase from X = 0 mm to X = 50.8 mm, then decrease at X = 101.6 mm and decrease further at X = 152.4 mm. These results indicate that the highest prominence threshold and off-plate shedding frequencies are at a reduced value closest to the cylinder but then increase to a maximum value at X = 50.8 mm where the vortices have fully formed due to the flow around the cylinder. The highest prominence threshold and off-plate shedding frequencies then decrease due to energy loss from drag as the downstream distance increases. The highest prominence peaks of the on-plate shedding frequencies show similar behavior for the Z = 50.8 mm plane, but some fluctuating behavior is observed in the on-plate shedding frequencies at the Z = 12.7 mm plane. For example, at the Z = 12.7 mm on-plate plane, the shedding frequency of the highest prominence peak starts at 127.7 Hz at X = 0 mm, decreases to 0 Hz (no shedding) at X = 50.8 mm, increases to 124.2 Hz at X = 101.6 mm, and then decreases to 70.3 Hz at X = 152.4 mm. This oscillatory behavior is a direct result of the FSI between the airflow and the plate, where the shedding frequency is suppressed at the X = 50.8 mm, Z = 12.7 mm on-plate position. There are 6 additional peaks in the Z = 12.7 mm plane, of which 1 is on-plate, 2 are threshold, and 3 are off-plate and 11 additional peaks in the Z = 50.8 mm plane, of which 6 are on-plate, 2 are threshold, and 3 are off-plate, indicating that the flow is more stable than the 30 m/s case. Peak frequencies in the PSDs for a free-stream velocity of 20 m/s. The plotted lines indicate the peak frequencies of highest prominence within the frequency range of interest. Peak frequencies in the PSDs for a free-stream velocity of 10 m/s. The plotted lines indicate the peak frequencies of highest prominence within the frequency range of interest.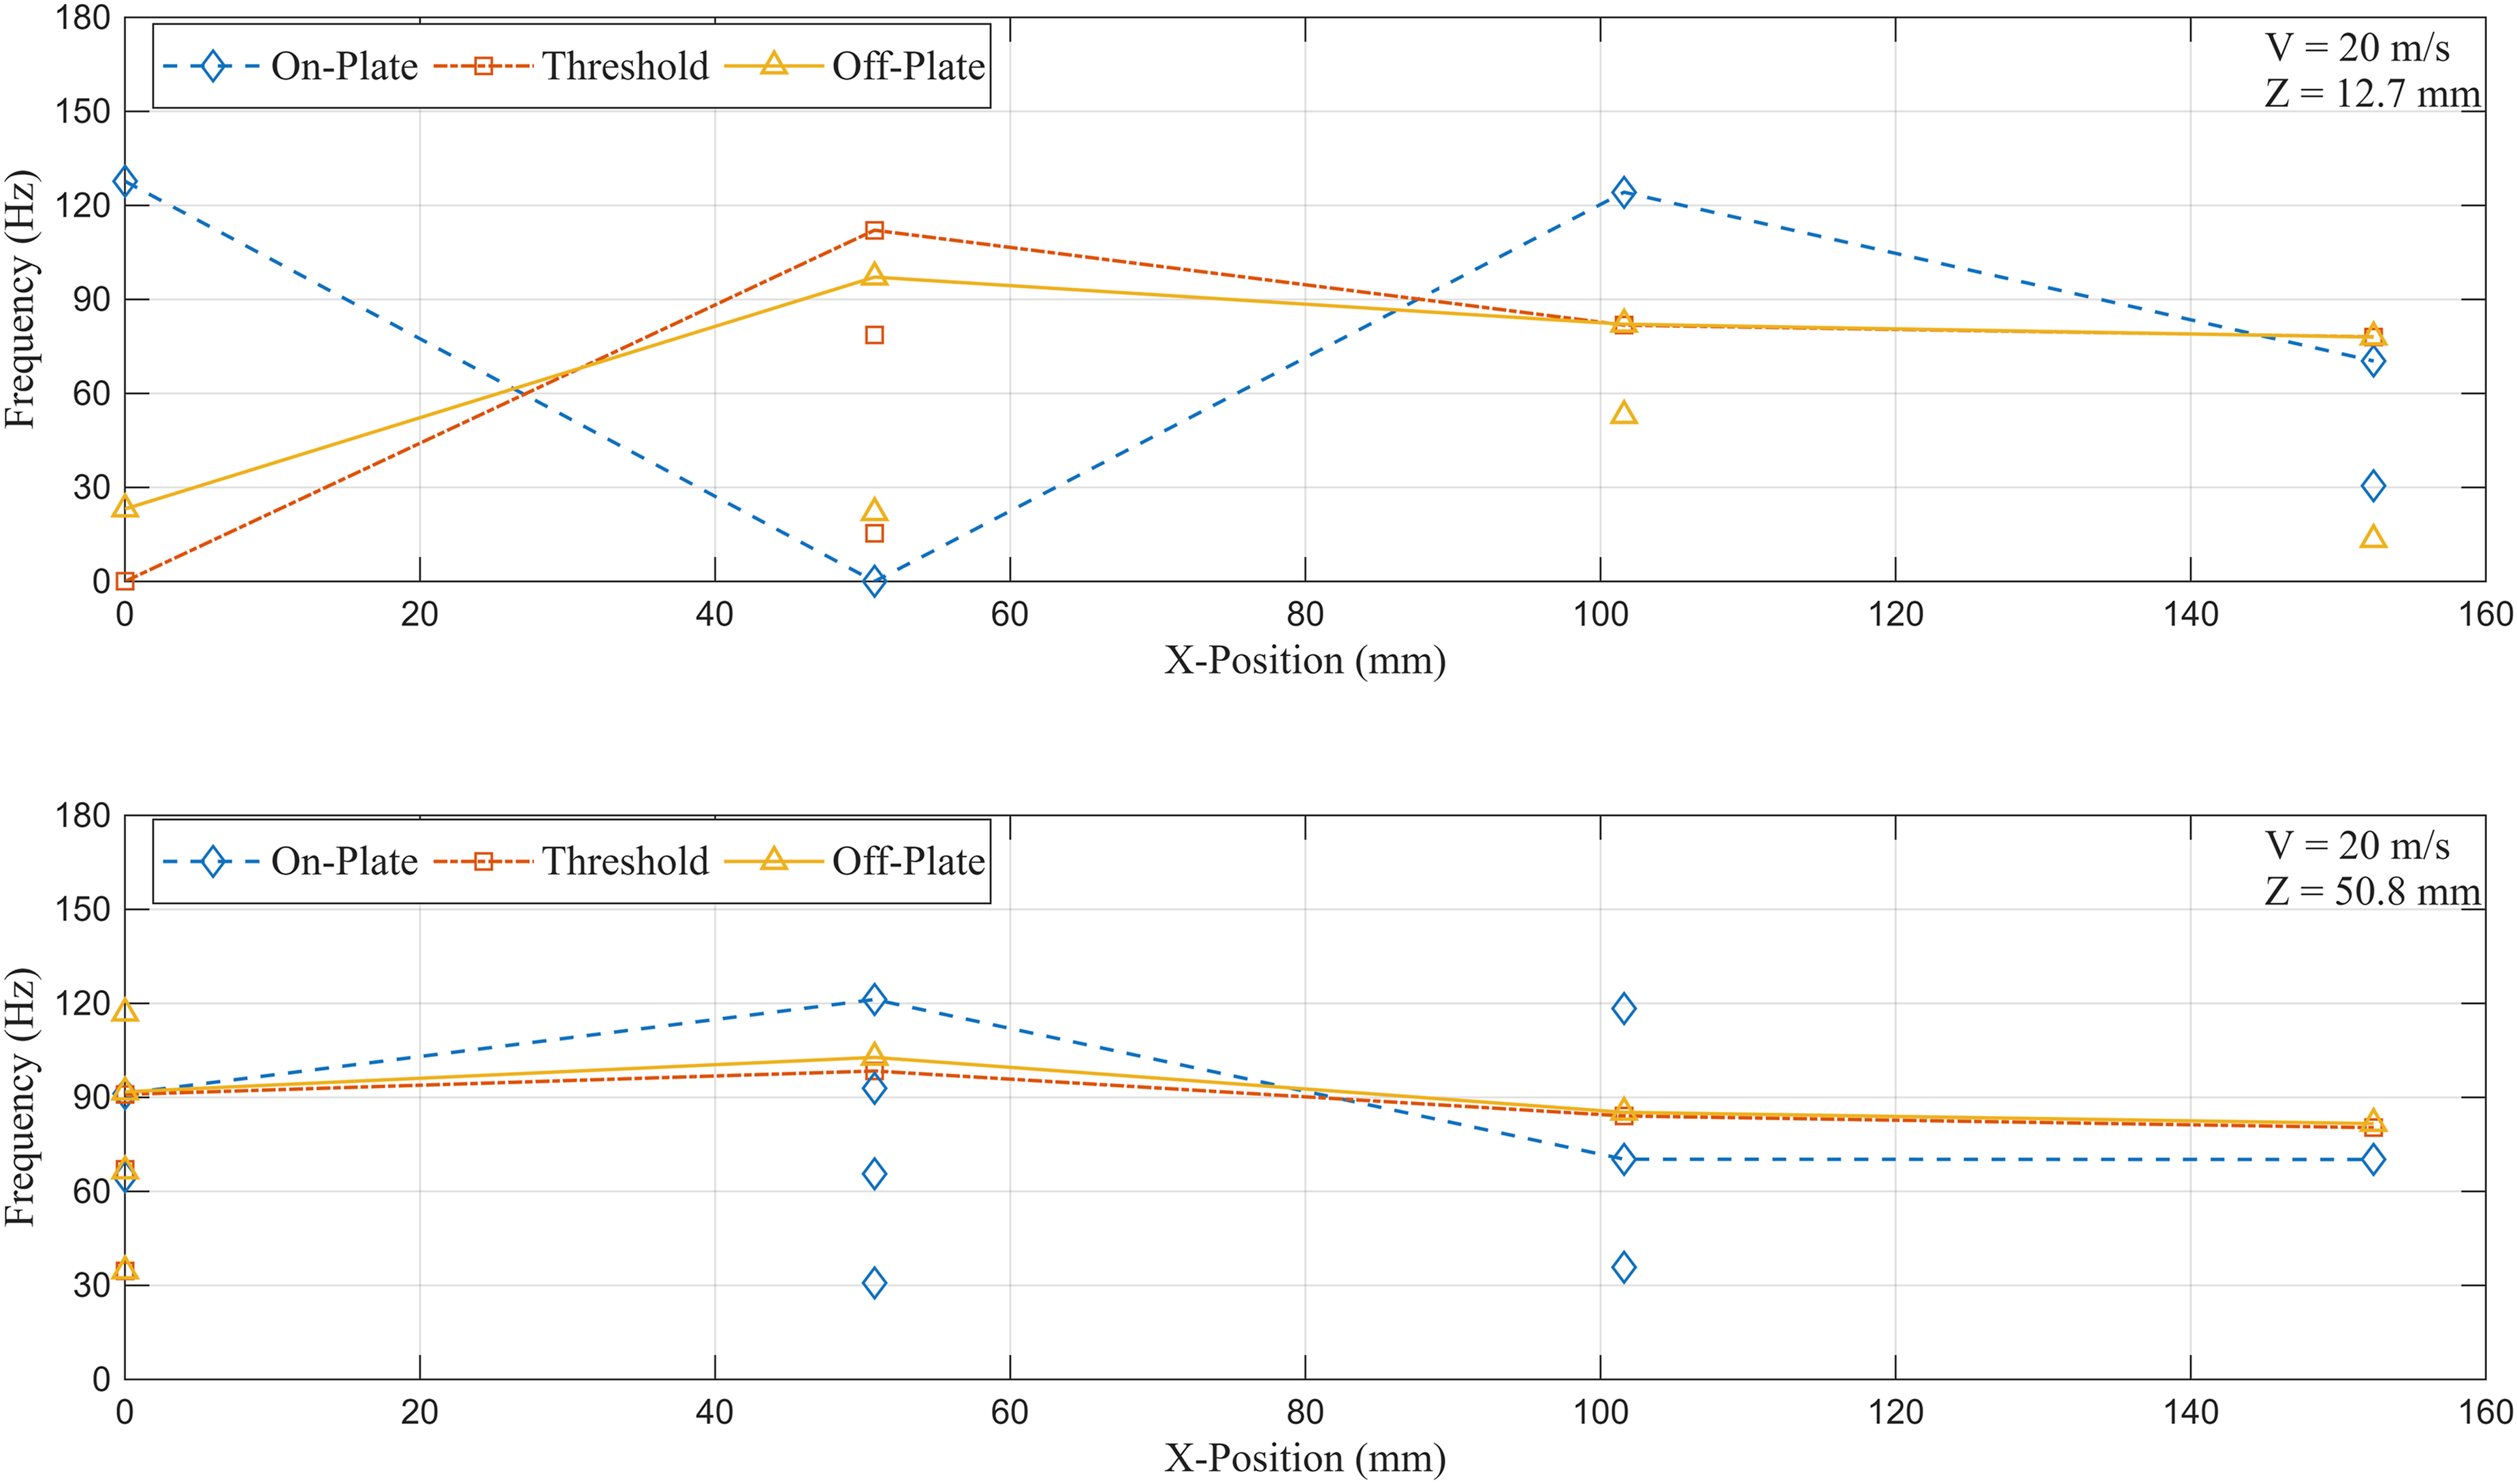
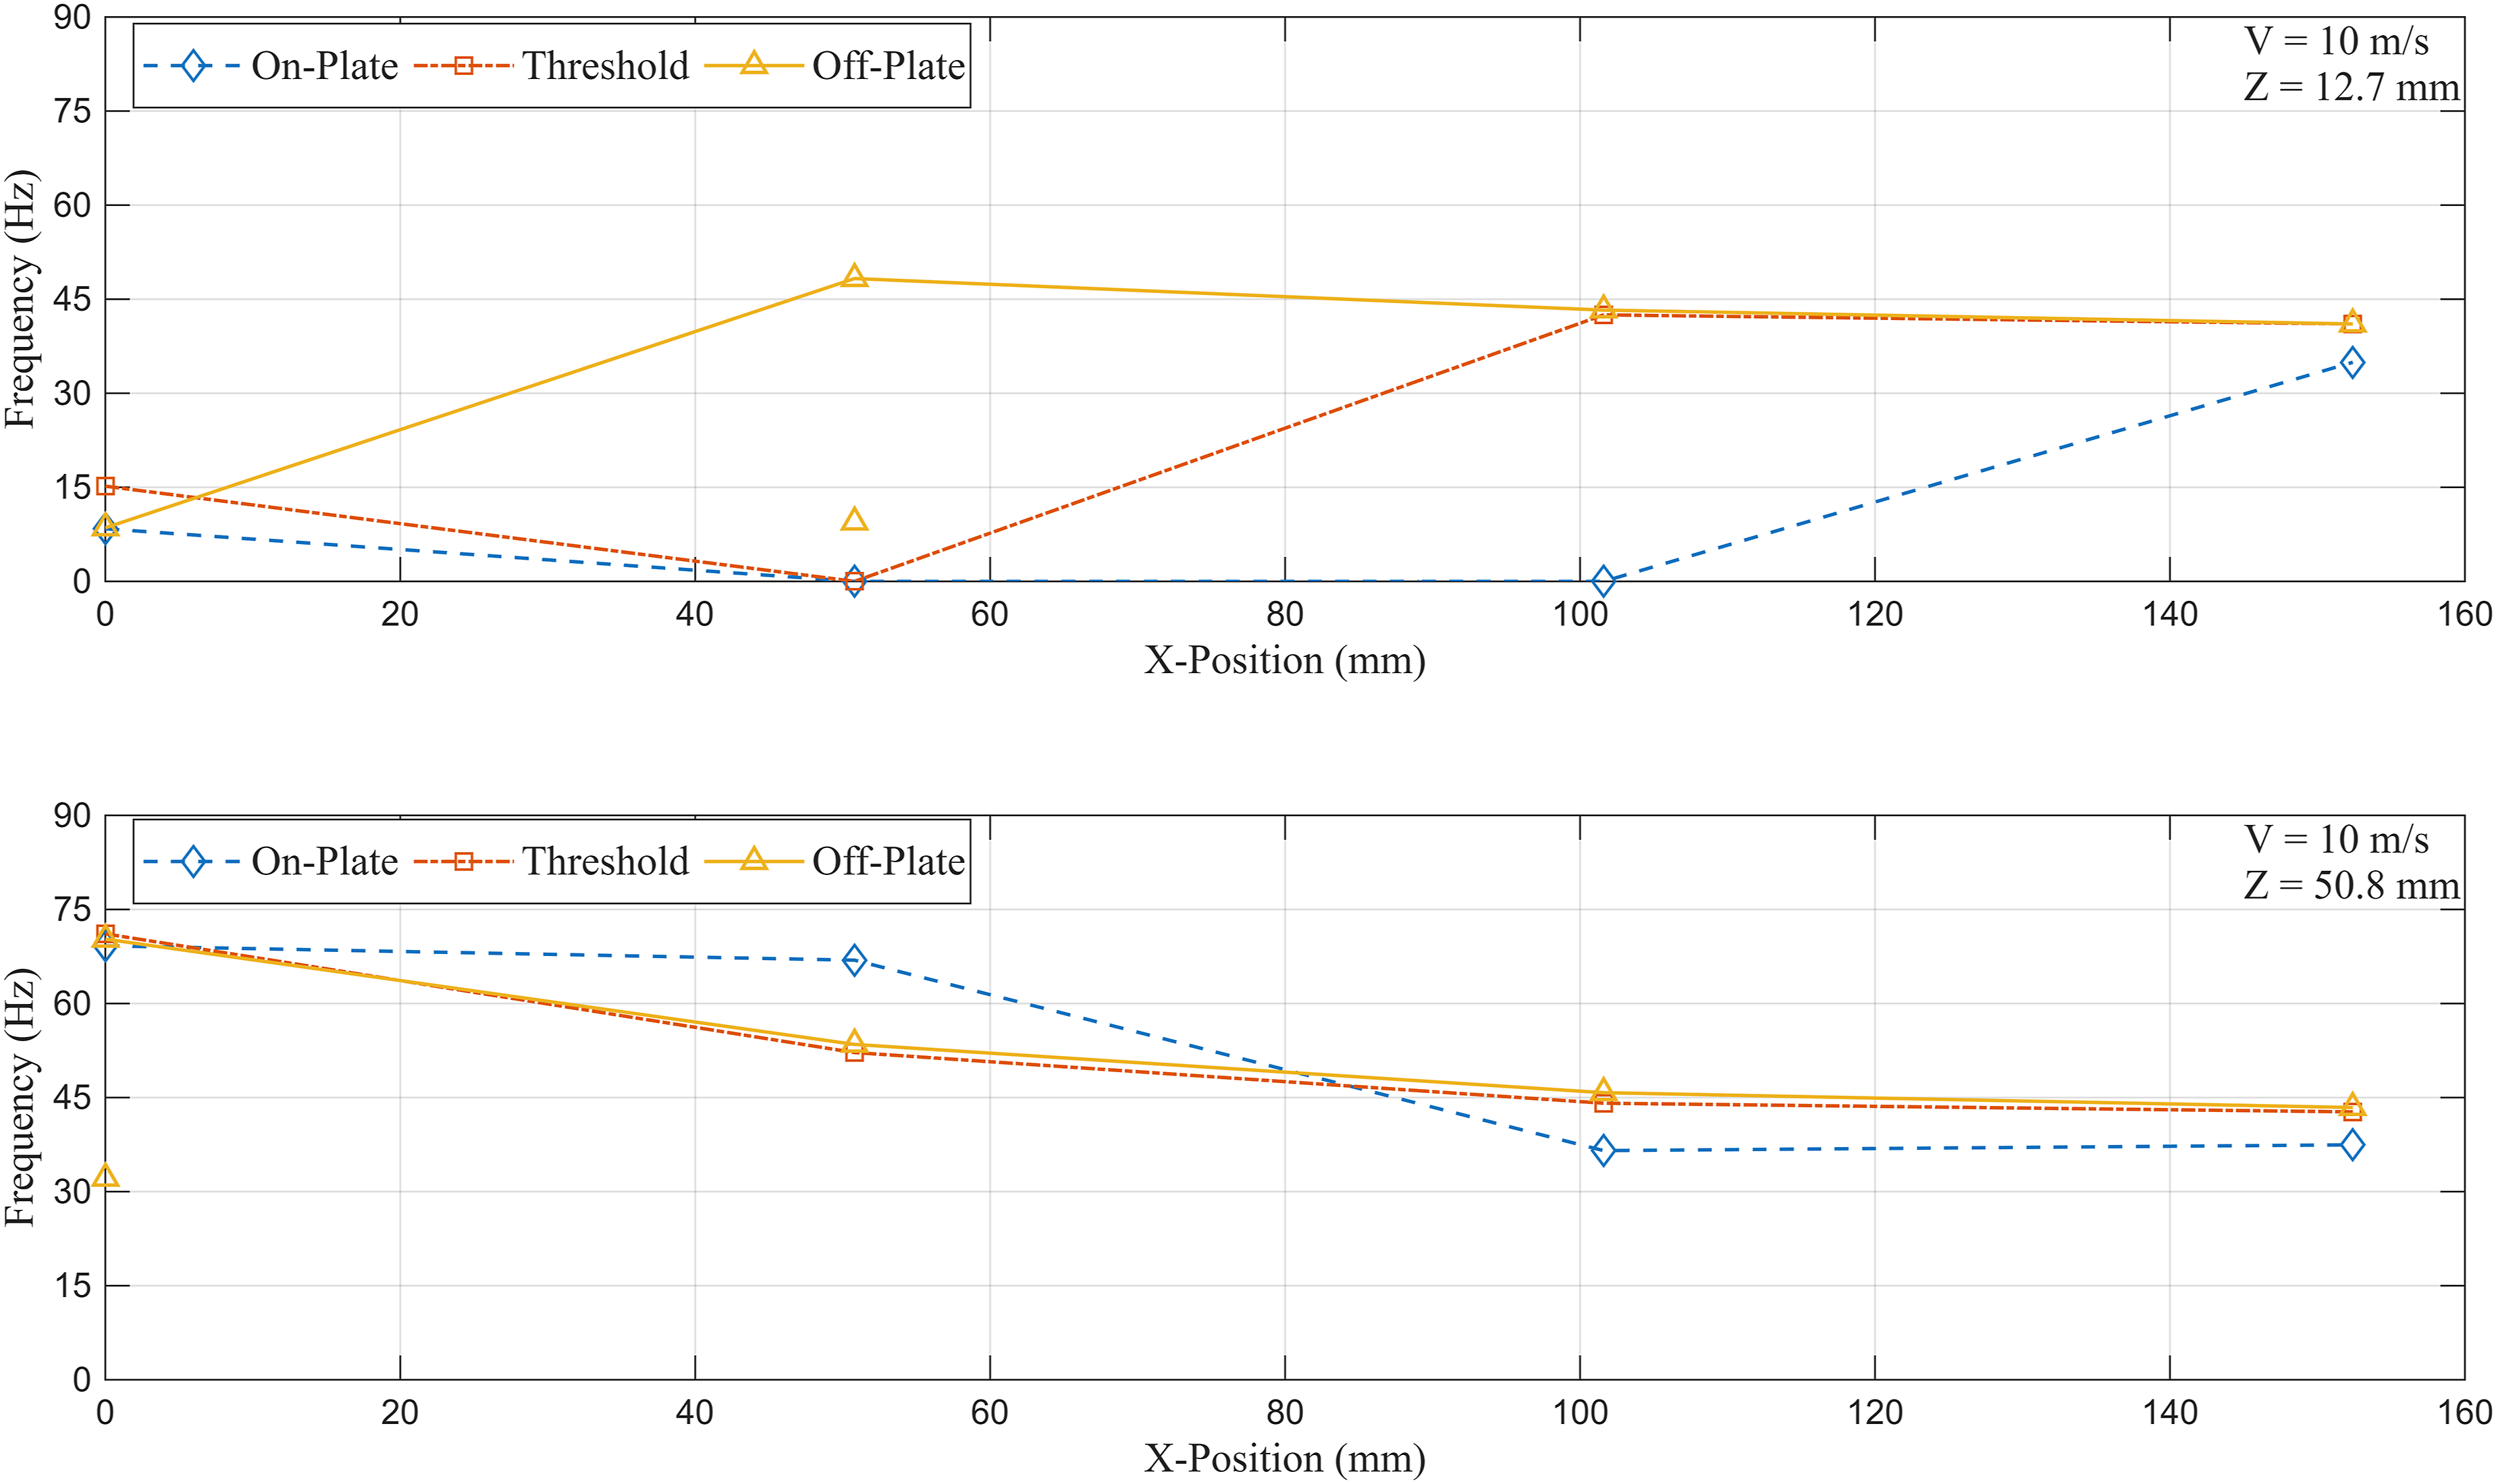
For the 10 m/s case shown in Figure 13, the highest prominence peaks are also the peaks with the largest shedding frequency within the frequency range of interest (3.0 Hz to 72.3 Hz). Interestingly, at the Z = 12.7 mm plane the shedding frequencies of the highest prominence peaks tend to fluctuate for the on-plate, threshold, and off-plate planes as the downstream distance increases. For example, at the threshold plane the shedding frequency of the highest prominence peak starts at 15.2 Hz at X = 0 mm, decreases to 0 Hz (no shedding) at X = 50.8 mm, increases to 42.5 Hz at X = 101.6 mm, and then decreases to 41.0 Hz at X = 152.4 mm. Conversely, at the Z = 50.8 mm plane the shedding frequencies of the highest prominence peaks decrease for the threshold and off-plate planes as the downstream distance increases. For instance, at the threshold plane, the shedding frequency of the highest prominence peak starts at 71.1 Hz at X = 0 mm, decreases to 52.2 Hz at X = 50.8 mm, decreases to 44.1 Hz at X = 101.6 mm, and decreases to 42.7 Hz at X = 152.4 mm. These results indicate that the threshold and off-plate flow is more stable at the Z = 50.8 mm plane where it is further away from the plate and cylinder. Furthermore, the decrease in shedding frequency as the downstream distance increases shows that energy is gradually being lost due to drag. There is only one additional peak in the Z = 12.7 mm plane and one additional peak in the Z = 50.8 mm plane, indicating that the flow is generally stable and that the signal energy is concentrated at a primary vortex shedding frequency for most measurement locations.
3.5. OMA results and analysis
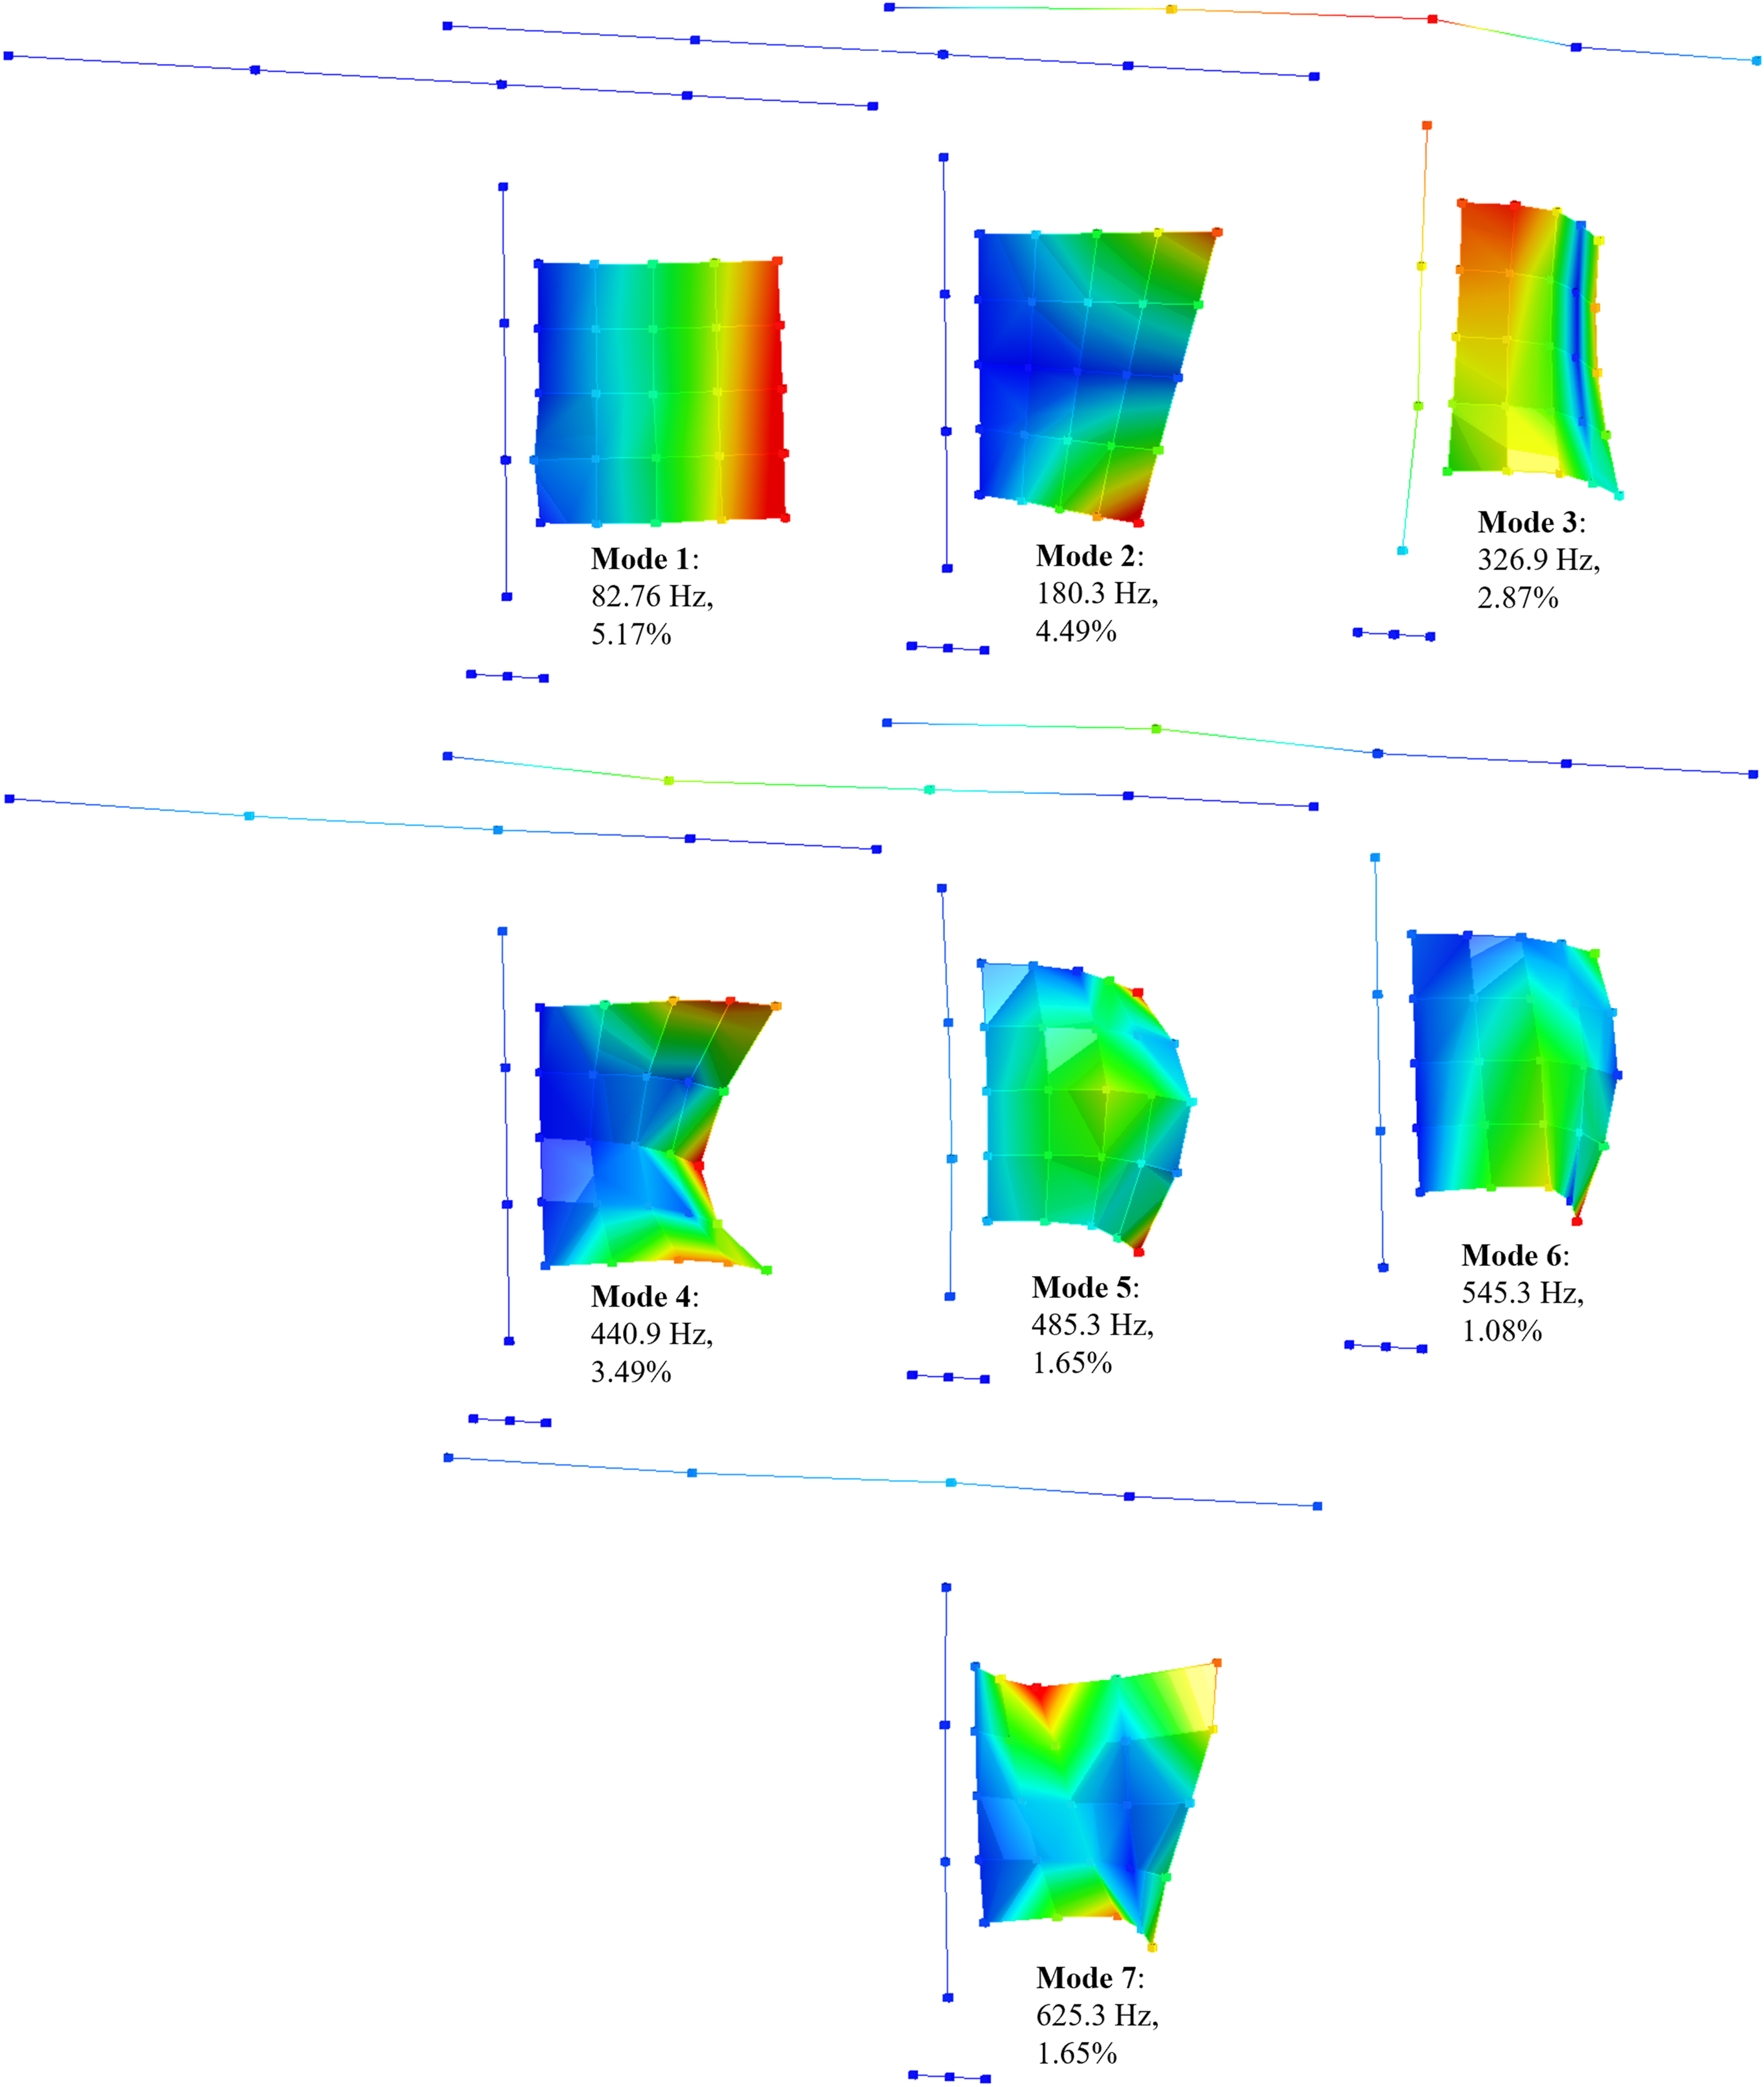
After CTA calibration, 60 s of accelerometer and CTA data were captured at 5.120 kHz. The accelerometer time-history data was loaded, and accelerometer reference locations were selected for computation of the cross-correlation and cross-power functions. A reference accelerometer was selected from the plate, cylinder, and upper and lower mounting brackets to provide full reference coverage of the experimental structure. Next, the cross-power functions were processed by applying 5,120 time lags for a frequency resolution of 1 Hz and an exponential window of 1% to reduce leakage. Using the PolyMAX algorithm, the cross-power functions were curve fitted to identify the structure’s modal parameters, and the first seven stable modes were selected within a frequency band of 0–700 Hz, as shown in Figures 14 and 15. Resulting OMA spectrum from modal curve fitting for an EWT free-stream velocity of 30 m/s. First seven operational mode shapes and their corresponding frequency and damping values for an EWT free-stream velocity of 30 m/s.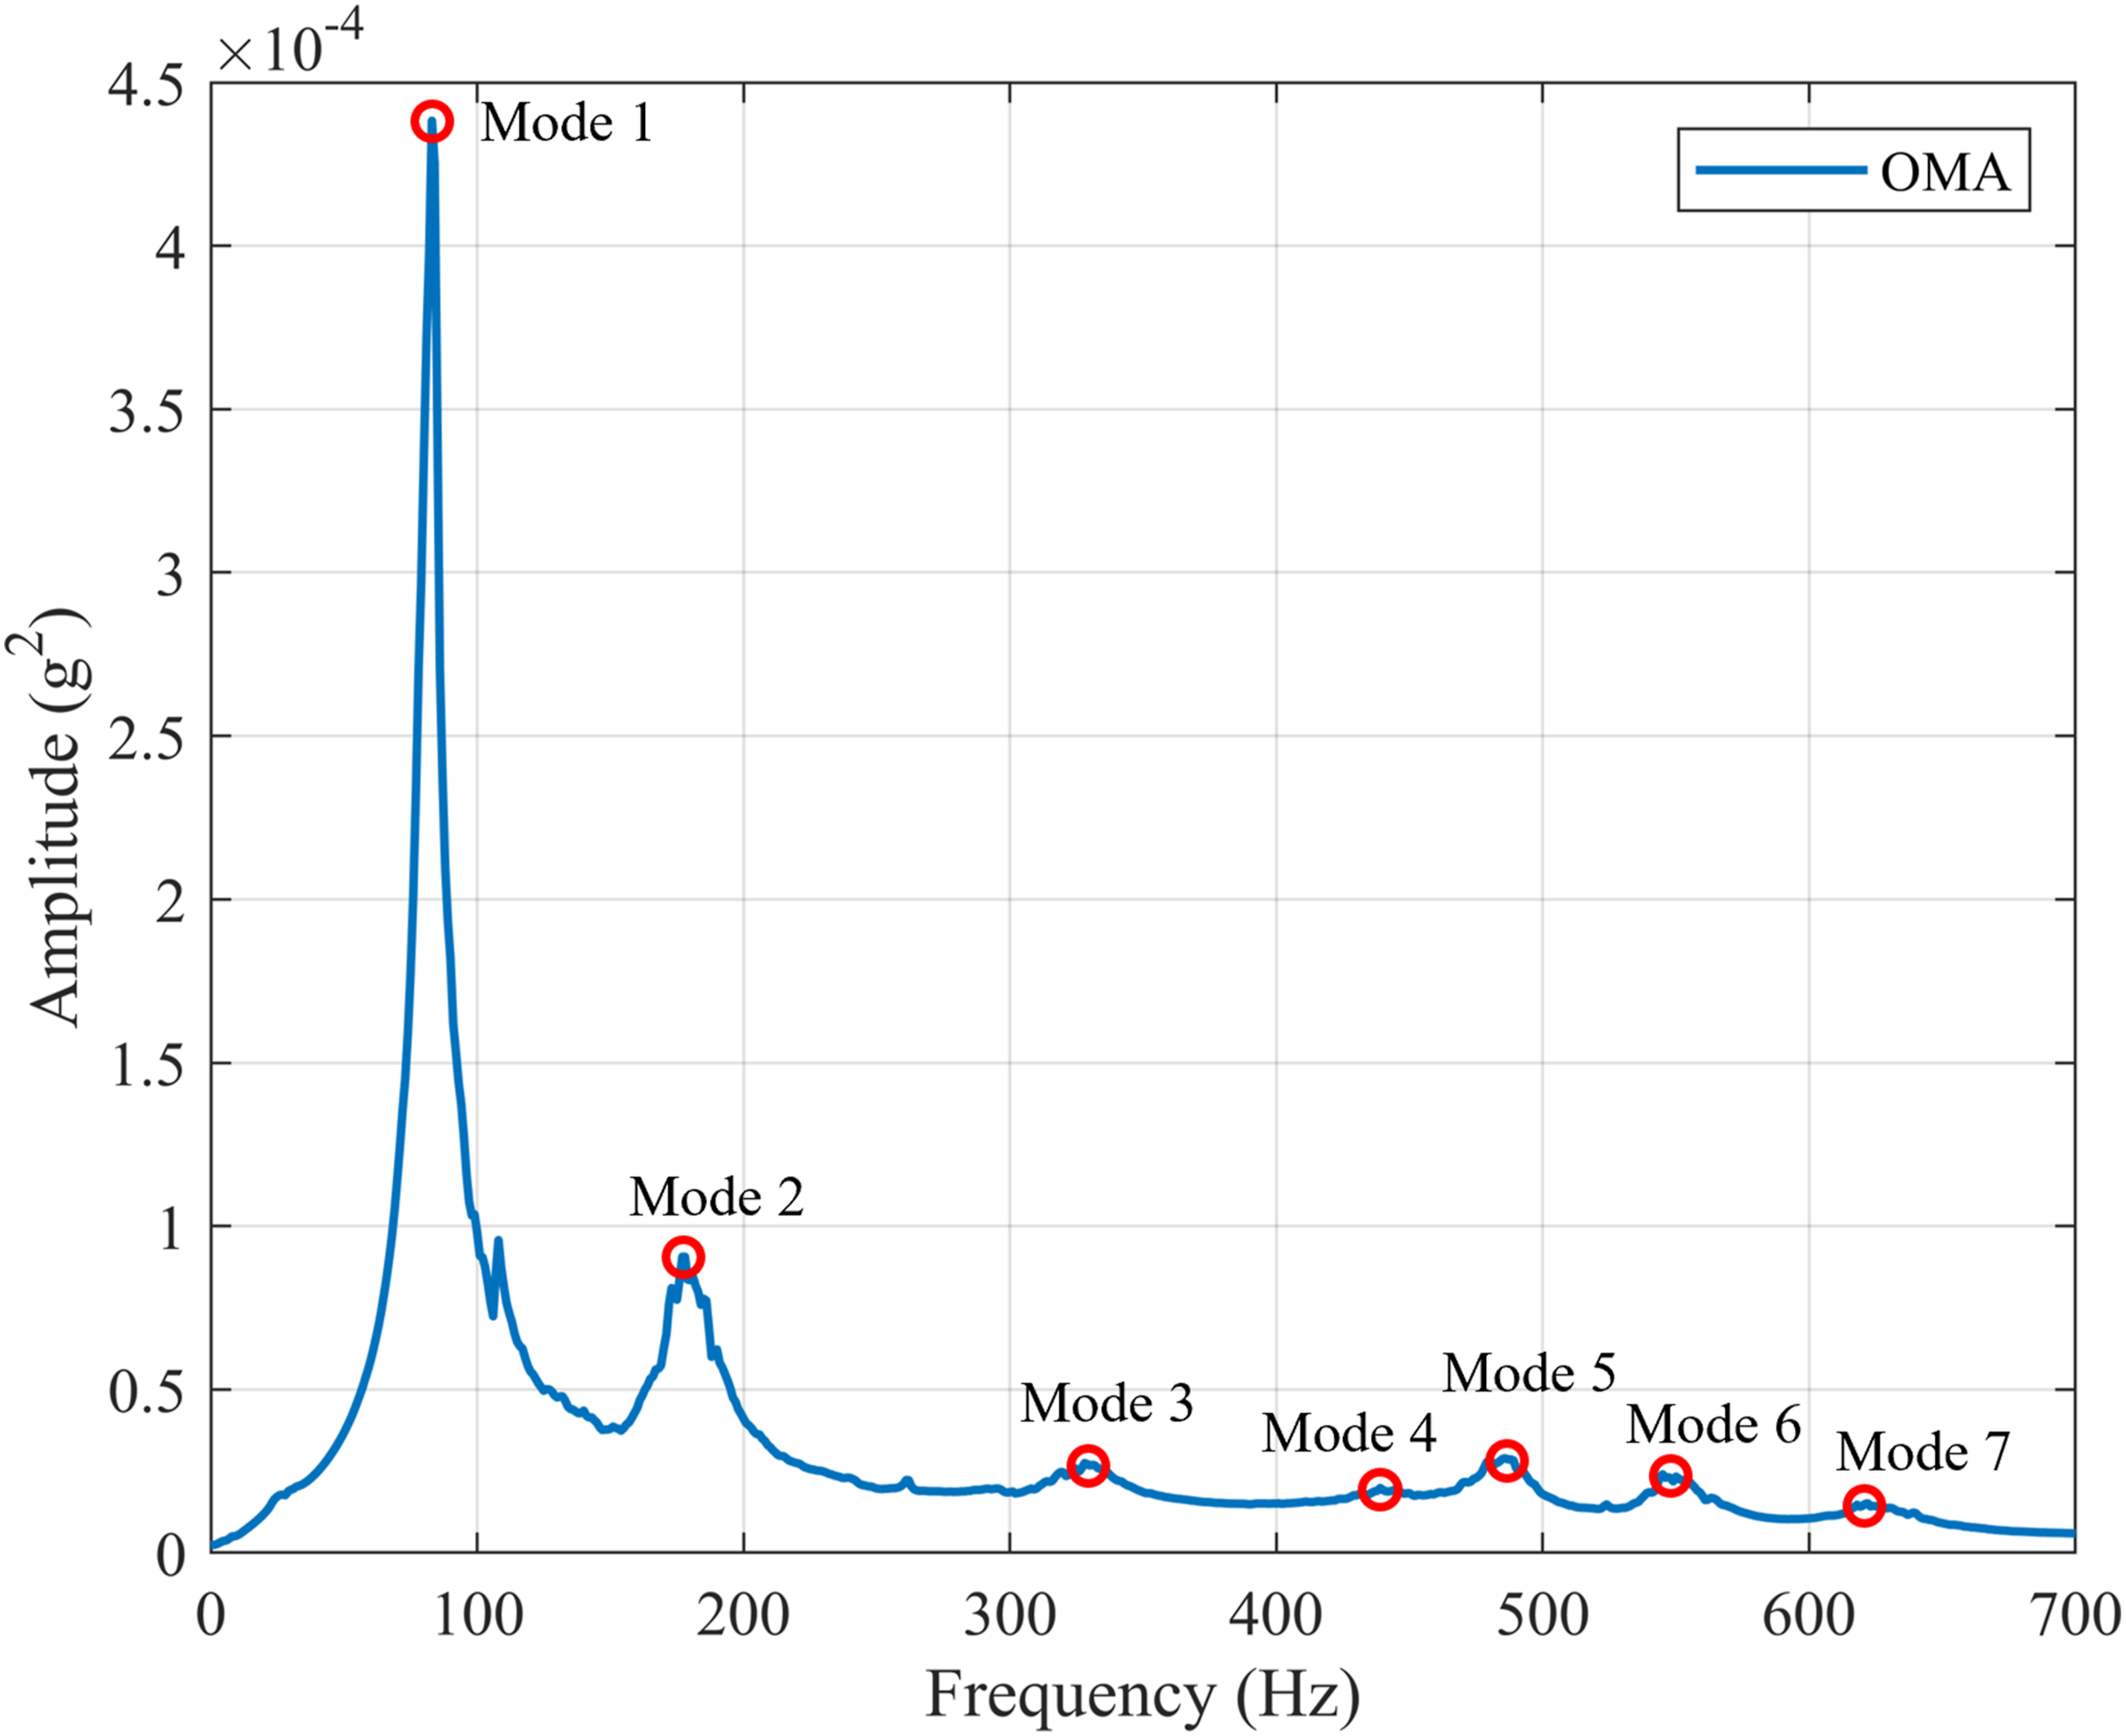
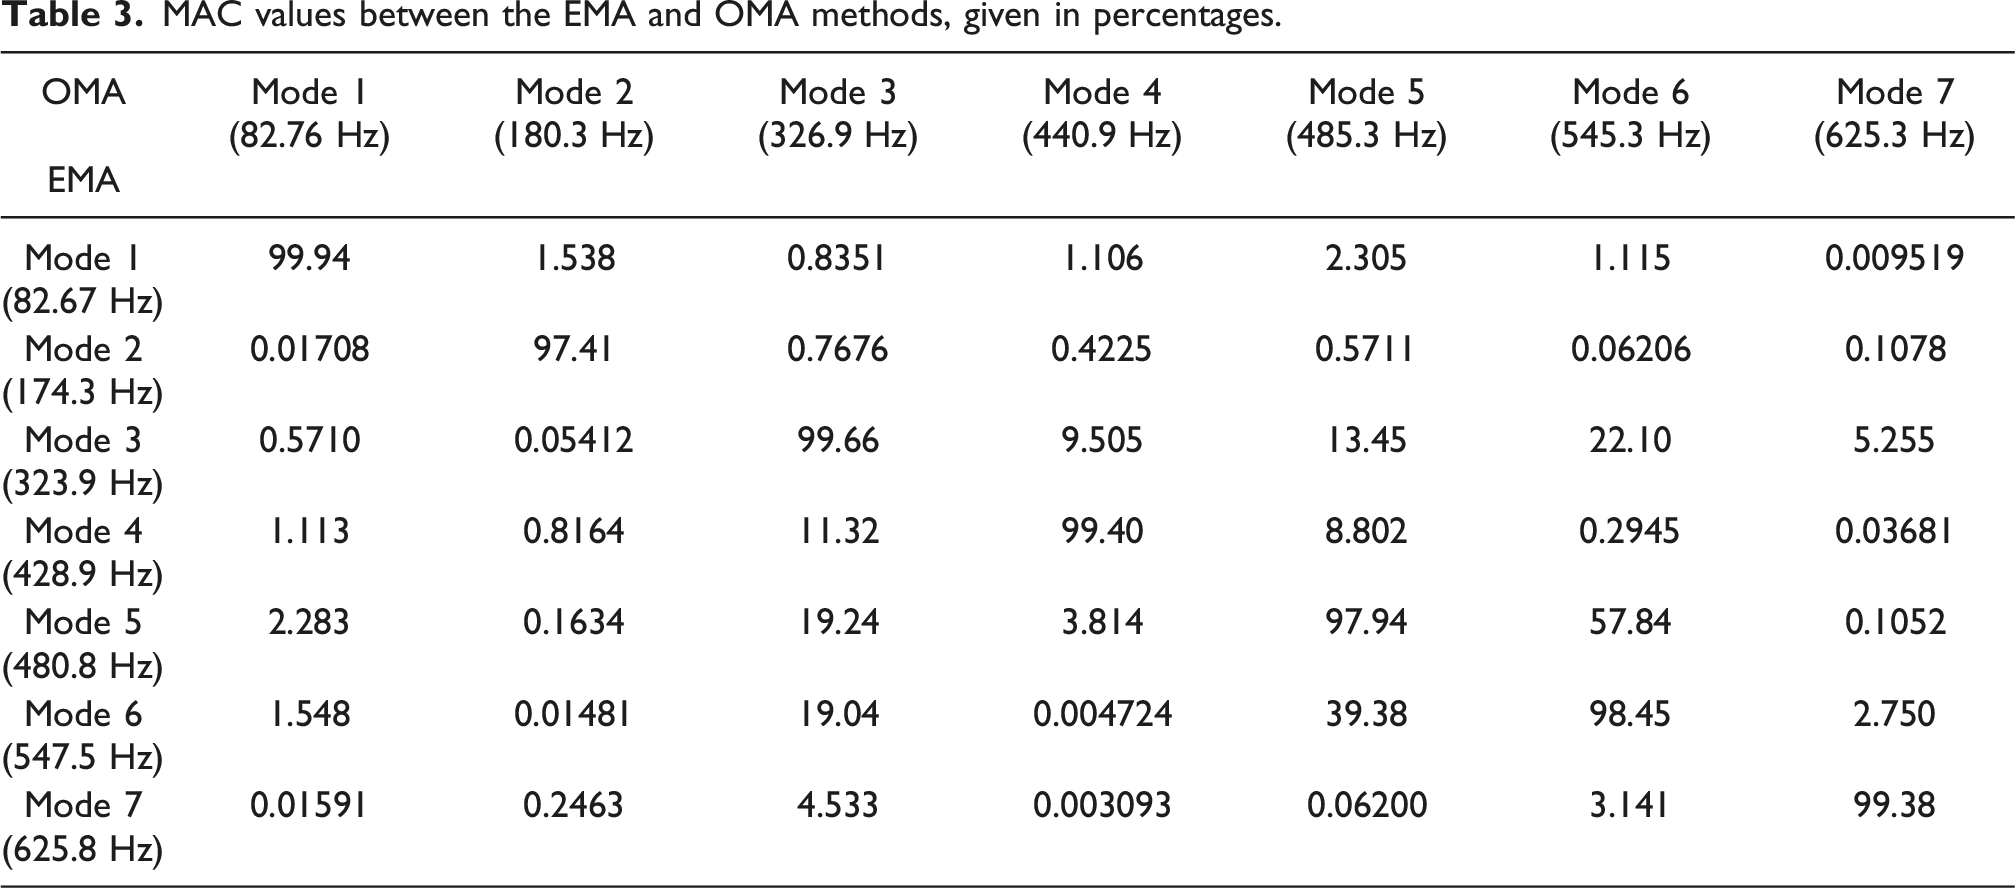
MAC values between the EMA and OMA methods, given in percentages.
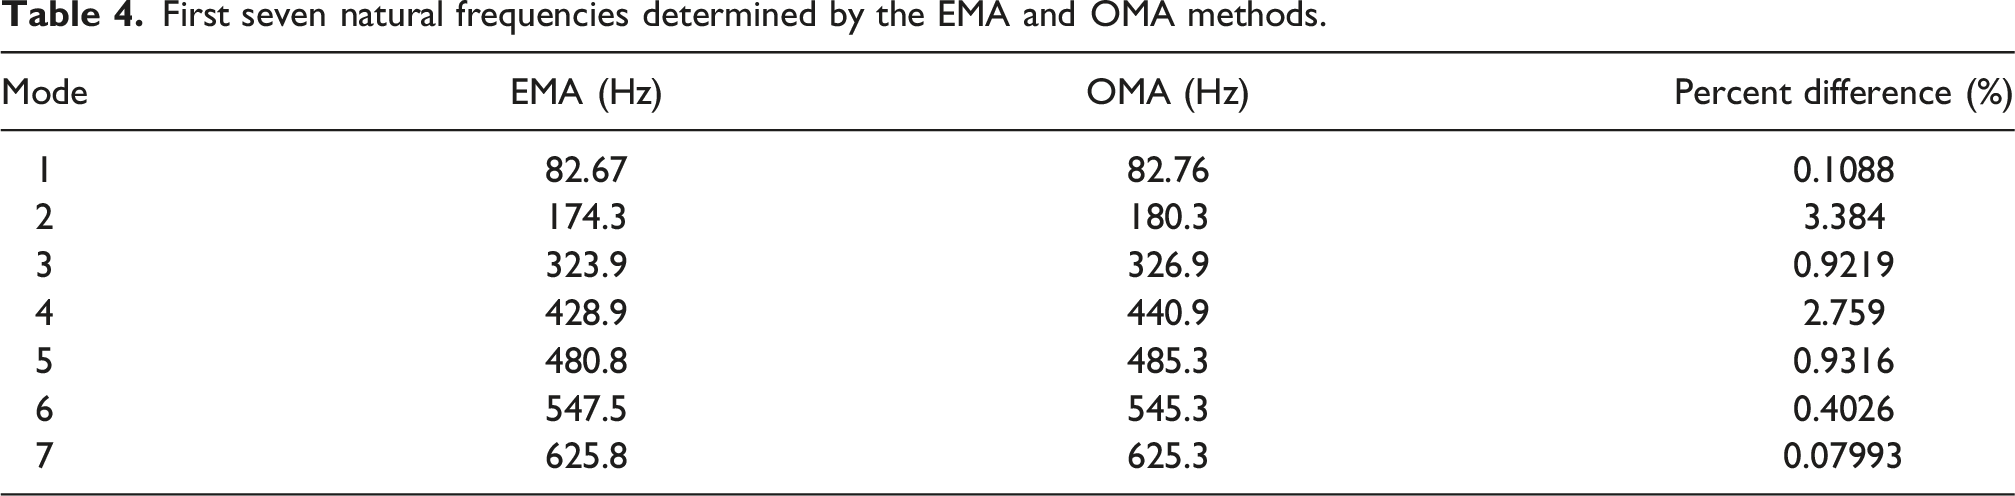
First seven natural frequencies determined by the EMA and OMA methods.
Airflow excitation data from the hot-wire probe at X = 152.4 mm, Y = 0 mm, Z = 50.8 mm, and accelerometer response data at point 15 (Figure 1) were used to compute the transfer function from the input to the output by dividing the crosspower of the input and output by the autopower of the input (Figure 16(a)). These specific measurement locations were selected as two points in close proximity to one another to capture a potential relationship between the excitation and response. The largest peak occurs at 82 Hz, corresponding to the first natural frequency of the structure. The coherence function provides a measure of the correlation between the excitation and response signals (Fu and He, 2001), where a value close to one indicates that the two signals are closely related and a value close to zero indicates that the two signals are unrelated. The coherence function identifies a partial correlation (approximately 60% or greater) between the excitation and point 15 response from approximately 57-174 Hz (Figure 16(b)). These results suggest that the vortex shedding at X = 152.4 mm, Y = 0 mm, Z = 50.8 mm contributes approximately 60% of its signal power to the point 15 vibration response from 57-174 Hz. Any nonlinearities between the input and output as well as any signal noise have reduced the coherence from a value of 100%. Additional excitation and response measurement locations could be explored in future work to understand how this correlation changes with shifting measurement locations. (a) Transfer function and (b) coherence.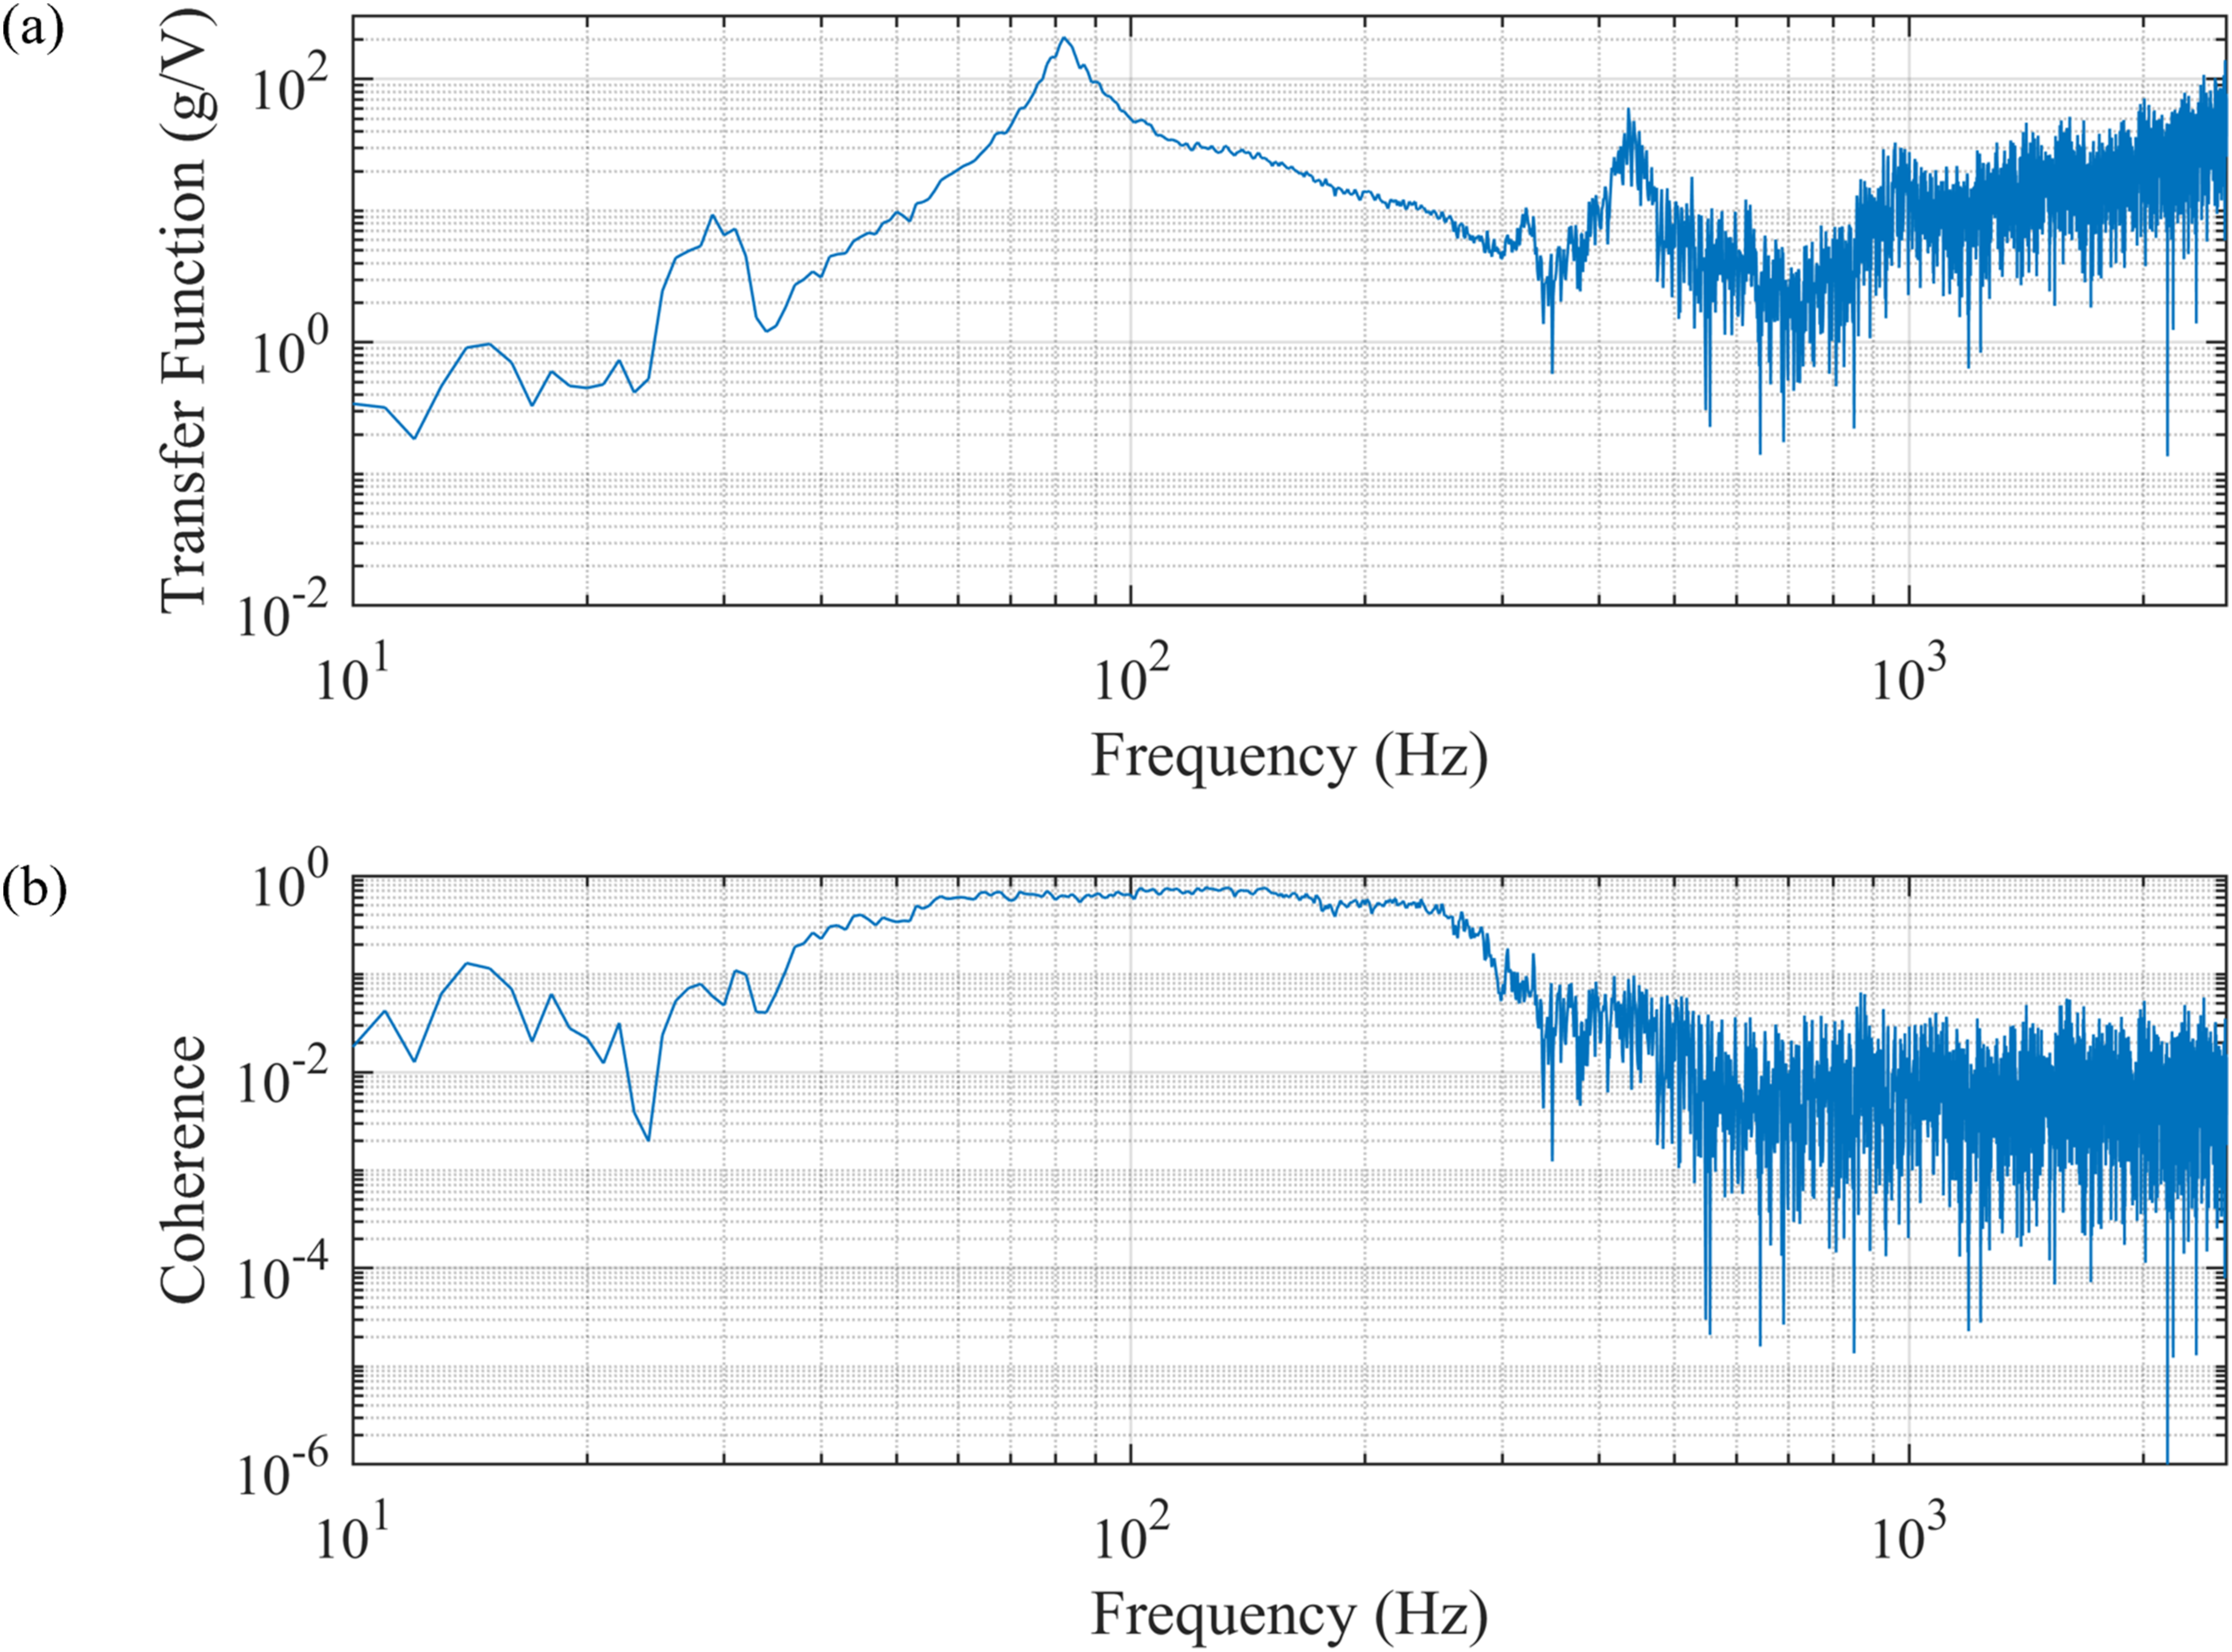
4. Conclusion
An experimental structure consisting of a plate fixed to a cylinder with upper and lower mounting brackets was mounted in an EWT and its modal response was characterized. The setup was introduced and an EMA was performed using a single hammer impact location with 37 response accelerometers. The first seven modes were identified using the PolyMAX algorithm within a frequency band of 0–700 Hz, and the results were shown to validate the FEA modal analysis simulation. The CTA setup and calibration procedure were introduced, and a CTA experiment was performed at a free-stream velocity of 30 m/s. The data allowed for visualization of the mean velocity and turbulence intensity around the cylinder and plate, and a frequency domain analysis identified the shedding frequencies. At most measurement locations, the highest prominence on-plate shedding frequencies were less than the highest prominence off-plate shedding frequencies due to the plate’s interference with the forming vortex. In all cases, the highest prominence off-plate shedding frequencies were less than the theoretical frequencies, due to the distribution of energy across multiple frequencies. All PSD peaks were identified and plotted and trends in the data were discussed. Plots showing the peak frequencies in the PSDs for the 20 m/s and 10 m/s cases were also presented and discussed. An OMA was performed at a free-stream velocity of 30 m/s, and the mode shapes and natural frequencies were compared to the EMA results. Excellent correlation between the EMA and OMA mode shapes and natural frequencies was observed, highlighting the benefit of collecting all the required response data in a single measurement run by using the appropriate number of accelerometers, provided that mass loading is accounted for in the analysis. Finally, the transfer function and coherence function identified a partial correlation between the airflow excitation and the point 15 response from approximately 57–174 Hz.
In addition to the results presented in this work, this study describes novel experimental FSI measurement techniques for combining vibration and airflow velocity measurements, including modal analysis and vortex shedding characterization. Such data is required in the design process for aerospace and civil structures, maritime applications, and flow control problems to validate engineering numerical models. The use of CTA hot-wire sensors allows for high spatial and temporal resolution needed for understanding the flow characteristics and vortex shedding frequencies at specific locations around a structure. For example, in flow control applications, modifications to the structure can be made, such as with the addition of splitter plates, to alter the vortex shedding characteristics. Flow measurements may be taken while simultaneous modal analysis is performed to ensure those structural modifications have not unfavorably shifted the natural frequencies. This approach of simultaneous vibration and airflow velocity measurement can reduce development and test time.
Footnotes
Acknowledgments
The authors would like to thank Dr. Zheng Li and Morgan State University for their support in allowing use of the AEROLAB EWT. The authors would also like to thank Siemens for loaning the SCADAS Recorder and accelerometers required to perform this research.
Funding
The authors received no financial support for the research, authorship, and/or publication of this article.
Declaration of conflicting interests
The authors declared no potential conflicts of interest with respect to the research, authorship, and/or publication of this article.
Data Availability Statement
Available upon request.