
Abstract
To investigate the operational safety and derailment boundaries of high-speed trains under strong gust conditions, a high-speed vehicle-rail coupling dynamic derailment model is developed, incorporating the effects of gusts. In this model, the high-speed vehicle is modeled as a multi-rigid body system with 35 degrees of freedom, and the dynamic wind field employs the double-exponential dynamic gust model as specified in the Chinese railway industry standard TB/T3503.5-2023. The aerodynamic loads surrounding the vehicle are simplified into a centralized force system acting on the car body, based on wind tunnel test results of the CN-III high-speed train standard model and aerodynamic coefficients derived. The normal and creep-slip forces between wheels and rails are calculated using Hertz nonlinear elastic contact theory and Kalker linear creep-slip theory, with concurrent nonlinear corrections applied. The numerical simulations explore the dynamic responses, derailment mechanisms, and key influencing factors of high-speed vehicles under strong gusts in depth. The study establishes derailment/safety domains for high-speed vehicles, considering multiple key factors and derailment assessment criteria, providing theoretical support for the safety management of high-speed trains in gusty environments.
Keywords
1. Introduction
Strong gusts of wind represent a significant natural hazard to the safety of high-speed train operations. In recent years, such gusts have resulted in numerous severe train derailments (Fujii et al., 1999; Ge and Jiang, 2009; Montenegro et al., 2022; Tamura 2009). As the global high-speed railway network rapidly expands, the likelihood of high-speed trains encountering strong gusts during transit increases, particularly in coastal and desert regions known for windy conditions. When exposed to strong gusts, the aerodynamics performance of high-speed trains rapidly deteriorates, and the pronounced crosswind effects may lead to derailments, overturns, and casualties, incurring incalculable losses (Du et al., 2022; Gallagher et al., 2018; Yang et al., 2022; Yao et al., 2022).
Zhou et al. (2023) investigated the aerodynamic behavior of high-speed trains during acceleration under crosswind conditions employing an Improved Delayed Separation Vortex Simulation (IDDES) approach. This study analyzed the spatiotemporal evolution of surface vortices and pressure distribution across the train body. Findings suggest that higher acceleration rates markedly enhance the maximum aerodynamic lateral force and aerodynamic rolling moment coefficient on the locomotive, intensifying the lateral vibration impacts. Luo et al. (2023) examined the unsteady aerodynamic characteristics of high-speed trains at tunnel entry under similar conditions, focusing on the altered flow structure surrounding the train. The investigation revealed significant asymmetry in both flow and pressure fields under strong crosswind, leading to complex dynamic responses, particularly in the leading car, which poses the most significant risk to operational safety. Liu et al. (2018) observed that during high-speed train operation, increased gust acceleration significantly heightened the risk of rolling motion of the train body, posing a severe threat to operational safety. Thomas et al. (2010a, 2010b, 2015) employed a spatial linear wind model and computational fluid dynamics simulations to compute the aerodynamic load when a train exits a tunnel. Their experiments demonstrated that the time series of wheel unloading ratios surged to higher levels under maximum lateral aerodynamic load, significantly exceeding those under stable wind conditions. Niu et al. (2022) investigated the impact of windbreak walls along railway lines on the steady-state aerodynamics characteristics of high-speed trains in crosswind scenarios, including flow field dynamics around the train. Their findings indicated that windbreak walls, whether on one or both sides, substantially altered the unsteady aerodynamics characteristics when operating against headwinds, with single-sided barriers more effectively damping aerodynamic fluctuations. Sun et al. (2018) developed an aerodynamics model for high-speed trains traversing sections of track with wind barrier damage and used numerical simulations to calculate the aerodynamic loads on the train under various operational conditions. Their research indicated a significant alteration in the crosswind response of high-speed trains due to gusts stemming from wind barrier damage. Kikuchi and Suzuki (2015) examined the impact of aerodynamic coefficients on the safety against train overturning in uniform crosswinds and provided the corresponding Critical Wind Curve (CWC). Liu et al. (2019, 2020) investigated the dynamic responses of high-speed trains to unstable winds caused by local structures along the operational line and discovered that these responses were substantially greater than those under stable wind conditions. They introduced a Dynamic Amplification Factor (DAF) to thoroughly assess the dynamic amplification effect on trains exiting tunnels and in tornadoes, and calculated the CWC for high-speed trains in gusts due to local structural variances or damage. Subsequently, Zhang et al. (2023) proposed a straightforward method using Multi Body System Dynamics Simulation (MBS) to evaluate the unstable winds affecting high-speed trains due to local structures, incorporating DAF. Yan et al. (2018) developed Probabilistic Critical Wind Speed Curves (PCWCs) to assess the risk of train overturning under stochastic conditions such as turbulent winds and track irregularities. In recent years, P A Montenegro et al. have conducted a systematic study on the operational safety of trains crossing different bridges under complex winds, and pioneered a practical method based on a discrete gust model, and established a nonlinear dynamic interaction wind-train-rail-bridge model, which enables the assessment of train speed limit values in a crosswind environment (Montenegro et al., 2019, 2020a; Olmos et al., 2025).
Currently, with the enhancement of the speed of the new generation of high-speed trains and the adoption of lightweight design technology for train bodies (Andersson et al., 2004), the aerodynamic lateral forces acting on the train body in gust environments have increased significantly. Concurrently, the stability contributed by the mass of the train has rapidly diminished, thereby increasing the sensitivity of train operation safety to crosswind and overturning risks (Heleno et al., 2021; Liu et al., 2022; Wang et al., 2020, 2022). Consequently, this article investigates the typical “hat-shaped” gust model that might be encountered during the operation of high-speed trains. It establishes a dynamic derailment model of train-track coupling under the influence of gusts and comprehensively analyzes the dynamic response, derailment mechanism, and key influencing factors of high-speed vehicles under strong gusts by solving the corresponding CWC of multiple operating conditions. It provides a safe speed threshold for high-speed trains at 400 km/h that considers multiple key influencing factors and derailment evaluation criteria.
The innovation of this paper lies in that it is the first time that the paper proposes to construct the train aerodynamic force and moment load as a function of time under dynamic gust environment based on the results of six-way aerodynamic force and moment coefficient of high-speed train wind tunnel test or dynamic mode test or numerical simulation under different side deflection angles. And then through the interpolation method to solve the train aerodynamic load under any spatiotemporal state (any moment, any wind angle, any speed), the train in the gust of wind under the action of the operation of the derailment boundary determination has a very good applicability. Meanwhile, by comparing with the empirical values or measured boundary values of relevant standards, it is found to have a good correspondence, which further verifies the feasibility of the thesis method.
This paper is structured as follows: Section 2 presents the development of a simulation model for train derailment under gust conditions, incorporating three subsystems: the vehicle-track coupling model, the dynamic gust model, and the aerodynamic load model. Section 3 employs six evaluation criteria—wheel-rail vertical force, wheel-rail lateral force, wheelset lateral force, derailment coefficient, wheel unloading ratio, and overturning coefficient—to analyze and compute the dynamic responses, derailment mechanisms, influencing factors, and safety zones of vehicles under gust influences. Section 4 quantifies the derailment risk and safety zones for high-speed trains, accounting for the combined effects of vehicle speed, wind speed, and wind angle. Section 5 concludes with the findings of the study.
2. Simulation model of train derailment under gust
Based on the kinetic theory of vehicle-rail coupling, a dynamic derailment calculation model for high-speed train and rail interaction under strong gusts has been developed. This model comprises three subsystems: the vehicle-rail coupling model, the dynamic gust model, and the aerodynamic load model (Xu and Zhai, 2018; You et al., 2018).
2.1. Vehicle-track coupling model
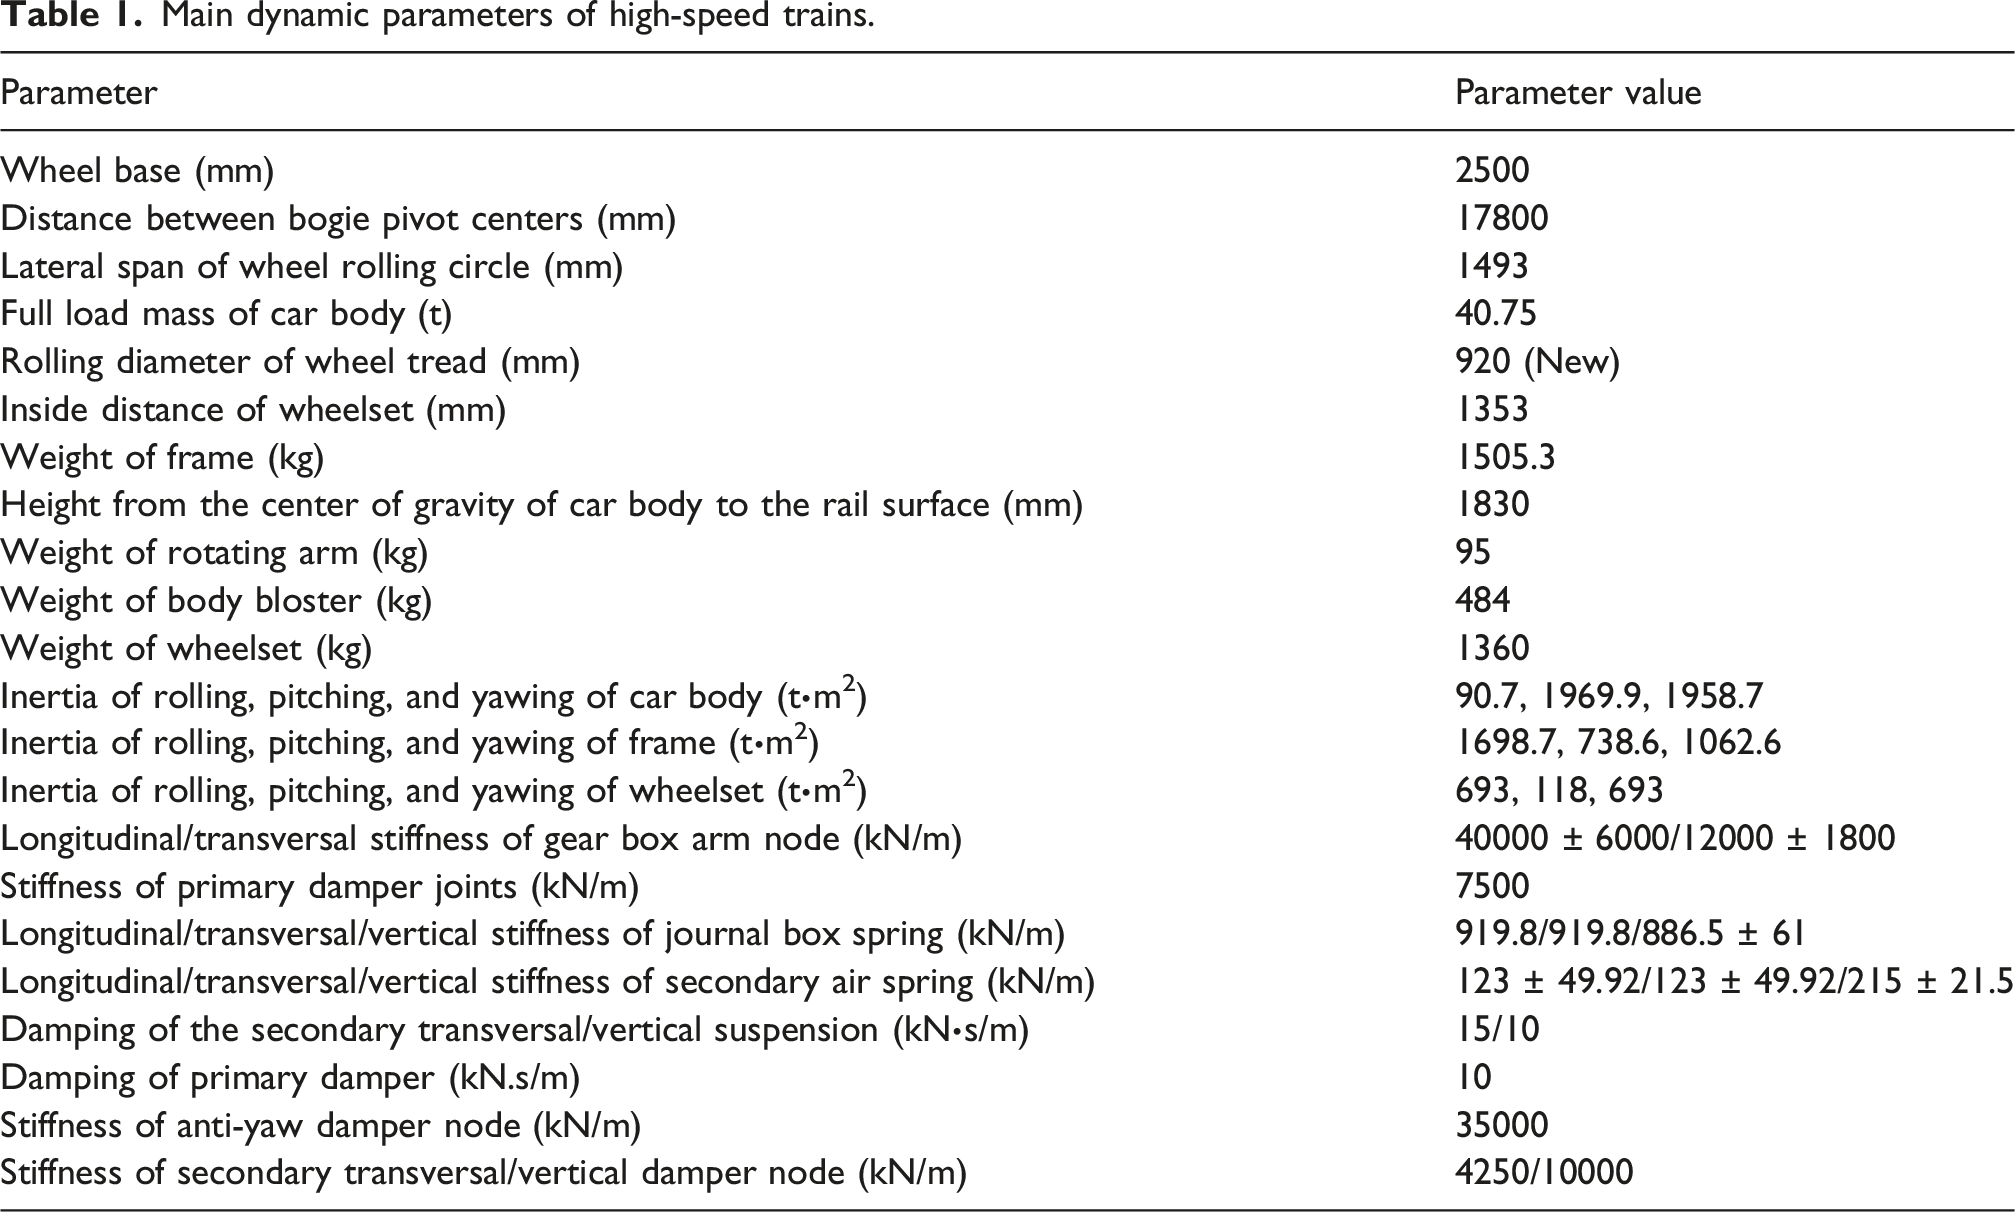
The vehicle/track coupling model is depicted in Figure 1. Within the vehicle model, components such as the car body, bogie, and wheelset are treated as rigid bodies. The developed modeling framework incorporates dynamics in five principal directions: lateral, vertical, roll, pitch, and yaw, resulting in a multi-rigid-body vehicle system with a total of 35 degrees of freedom. In this configuration, the car body is connected to the bogie frames by means of a secondary suspension system, and the wheelsets are coupled to the bogies through a primary suspension arrangement. The model also explicitly integrates nonlinear representations of key components, including the lateral dampers, anti-yaw dampers, and lateral bump stops (Montenegro et al., 2020b; Olmos and Astiz, 2018). The main dynamic parameters of the high-speed train are listed in Table 1. Vehicle/rail coupling model under pneumatic loading. Main dynamic parameters of high-speed trains.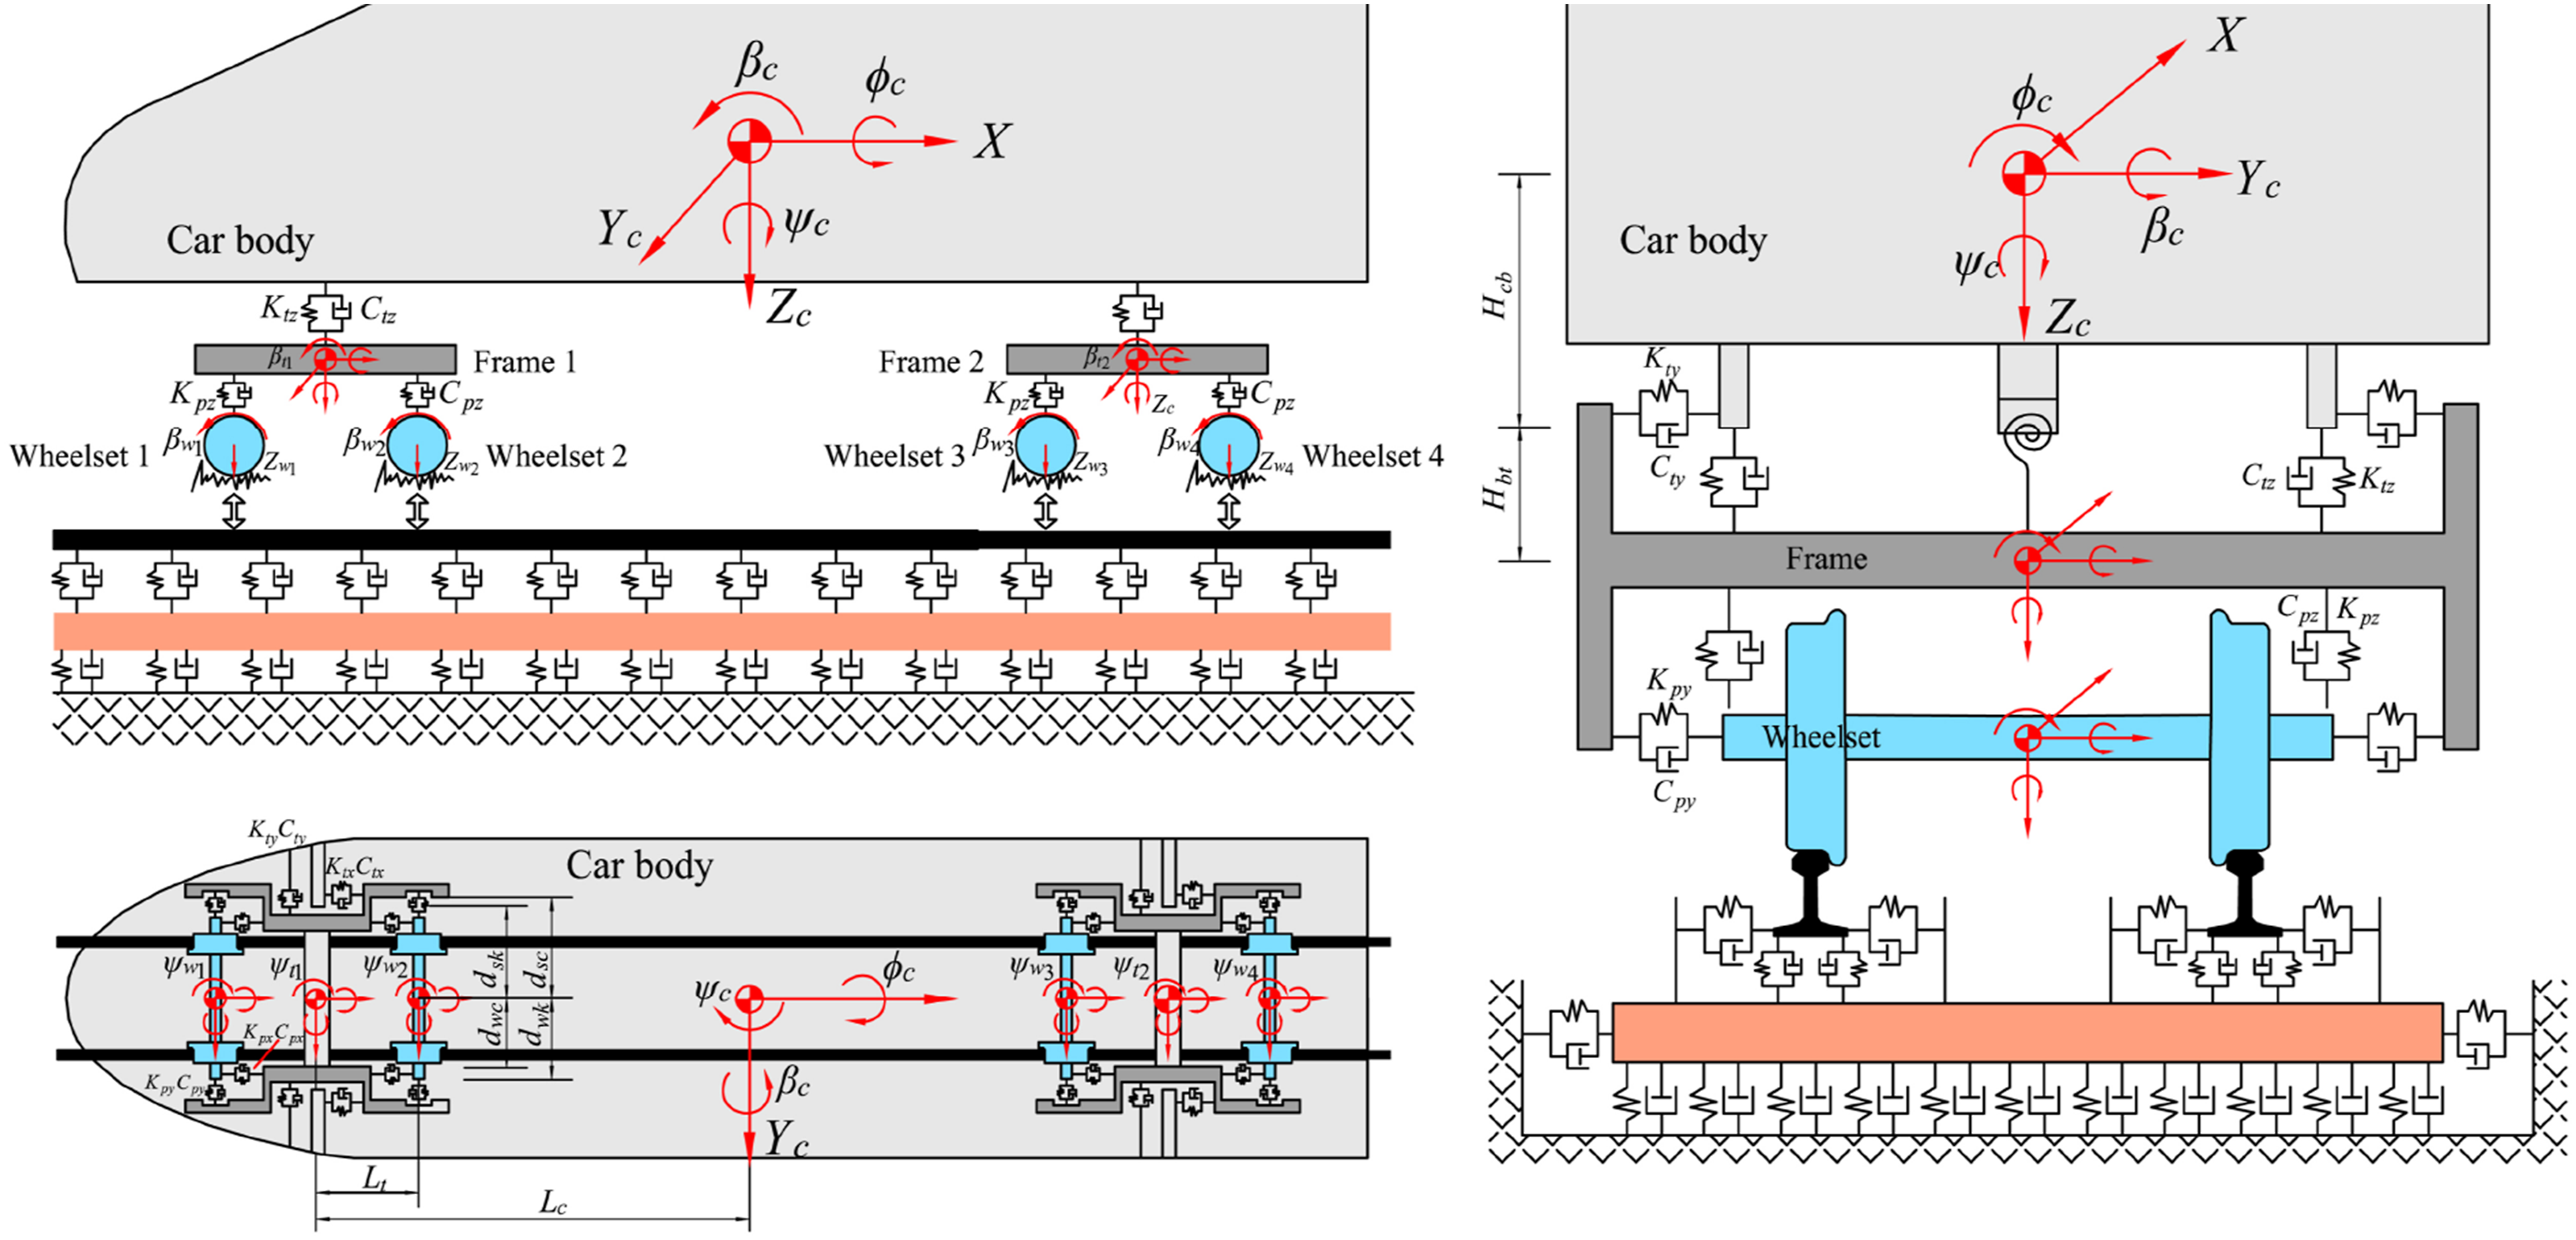
The track system employs a three-layer mass-spring-damper ballasted track model, considering the rails, sleepers, and subgrade as rigid mass blocks. The interactions among these components are simulated using a spring-damper model, while the continuity of the subgrade is modeled through the shear force between subgrade blocks. The wheelset tread “S1002G” and 60 kg/m rail are utilized for compatibility. The simulation model of the track is a straight line, and the impact of track irregularity excitation on train operation safety under gusty wind conditions is validated using the track spectra measured in this study.
The wheel-rail creep phenomenon is fundamentally nonlinear in nature. The normal contact force between the wheel and rail is calculated using Hertz’s nonlinear elastic contact theory, which describes the local deformation at the interface. In contrast, the tangential creep force is initially evaluated based on Kalker’s linear creep theory and subsequently refined through nonlinear correction methods to account for large creepage conditions.
2.2. Dynamic gust model
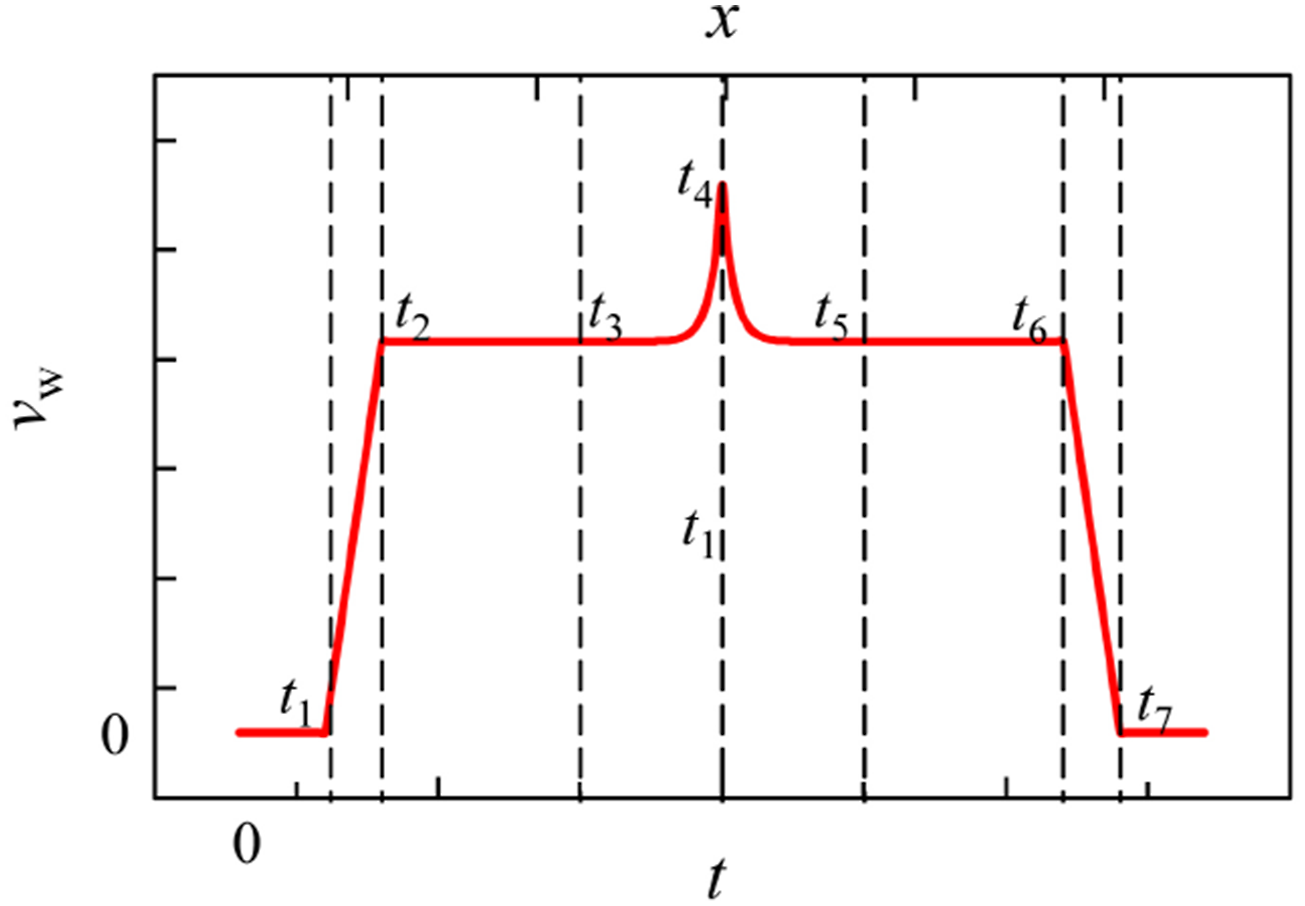
The dynamic wind field is represented using the “hat-type” gust model, as stipulated by the China Railway Industry Standard (TB/T3503.5, 2023). This model is characterized by its spatial distribution, which can be effectively transformed into a temporal distribution when the train travels at a uniform velocity. The computation of both spatial and temporal distributions in this gust model entails determining the time constant and the longitudinal and lateral wind speeds relative to the track (EN 14067-6, 2018; Montenegro et al., 2021).
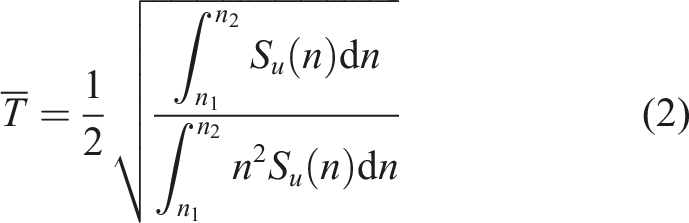
The time constant T is derived using the following equation, based on the power spectral density of the longitudinal component:
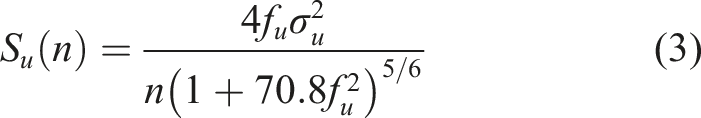
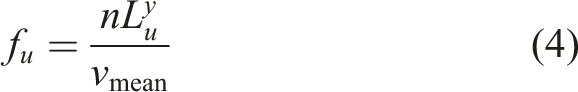
The longitudinal wind speed 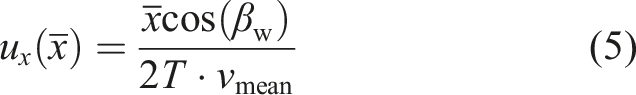
The correlation of gusts in the frequency domain is typically represented by the coherence function. Wind tunnel tests and field measurements have demonstrated that this function follows an exponential decay curve, that is,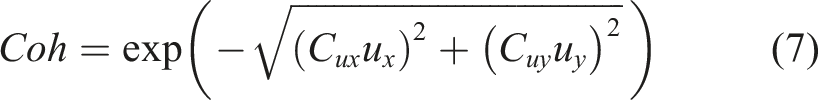
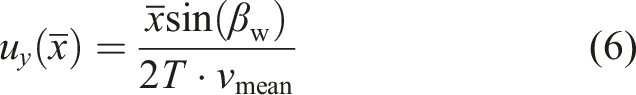
The dynamic gust wind speed, 

Corresponding to the wind speed distributed along the direction of the track line is
The minimum wind speed in the gust model asymptotically approaches the mean wind speed, Characteristics of spatial and temporal distribution of hat gust.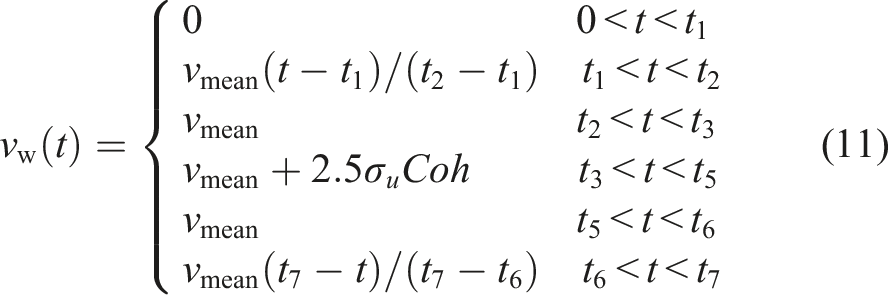
2.3. Aerodynamic load modeling
Under the influence of strong gusts, the surface pressure distribution on the car body is influenced by the shape and height of the vehicle, resulting in a non-uniform distribution (Xie and Wang, 2026). For calculating Schematic diagram of wind load force: (a) Side wind force and vector relationship; (b) Curvilinear relationship of 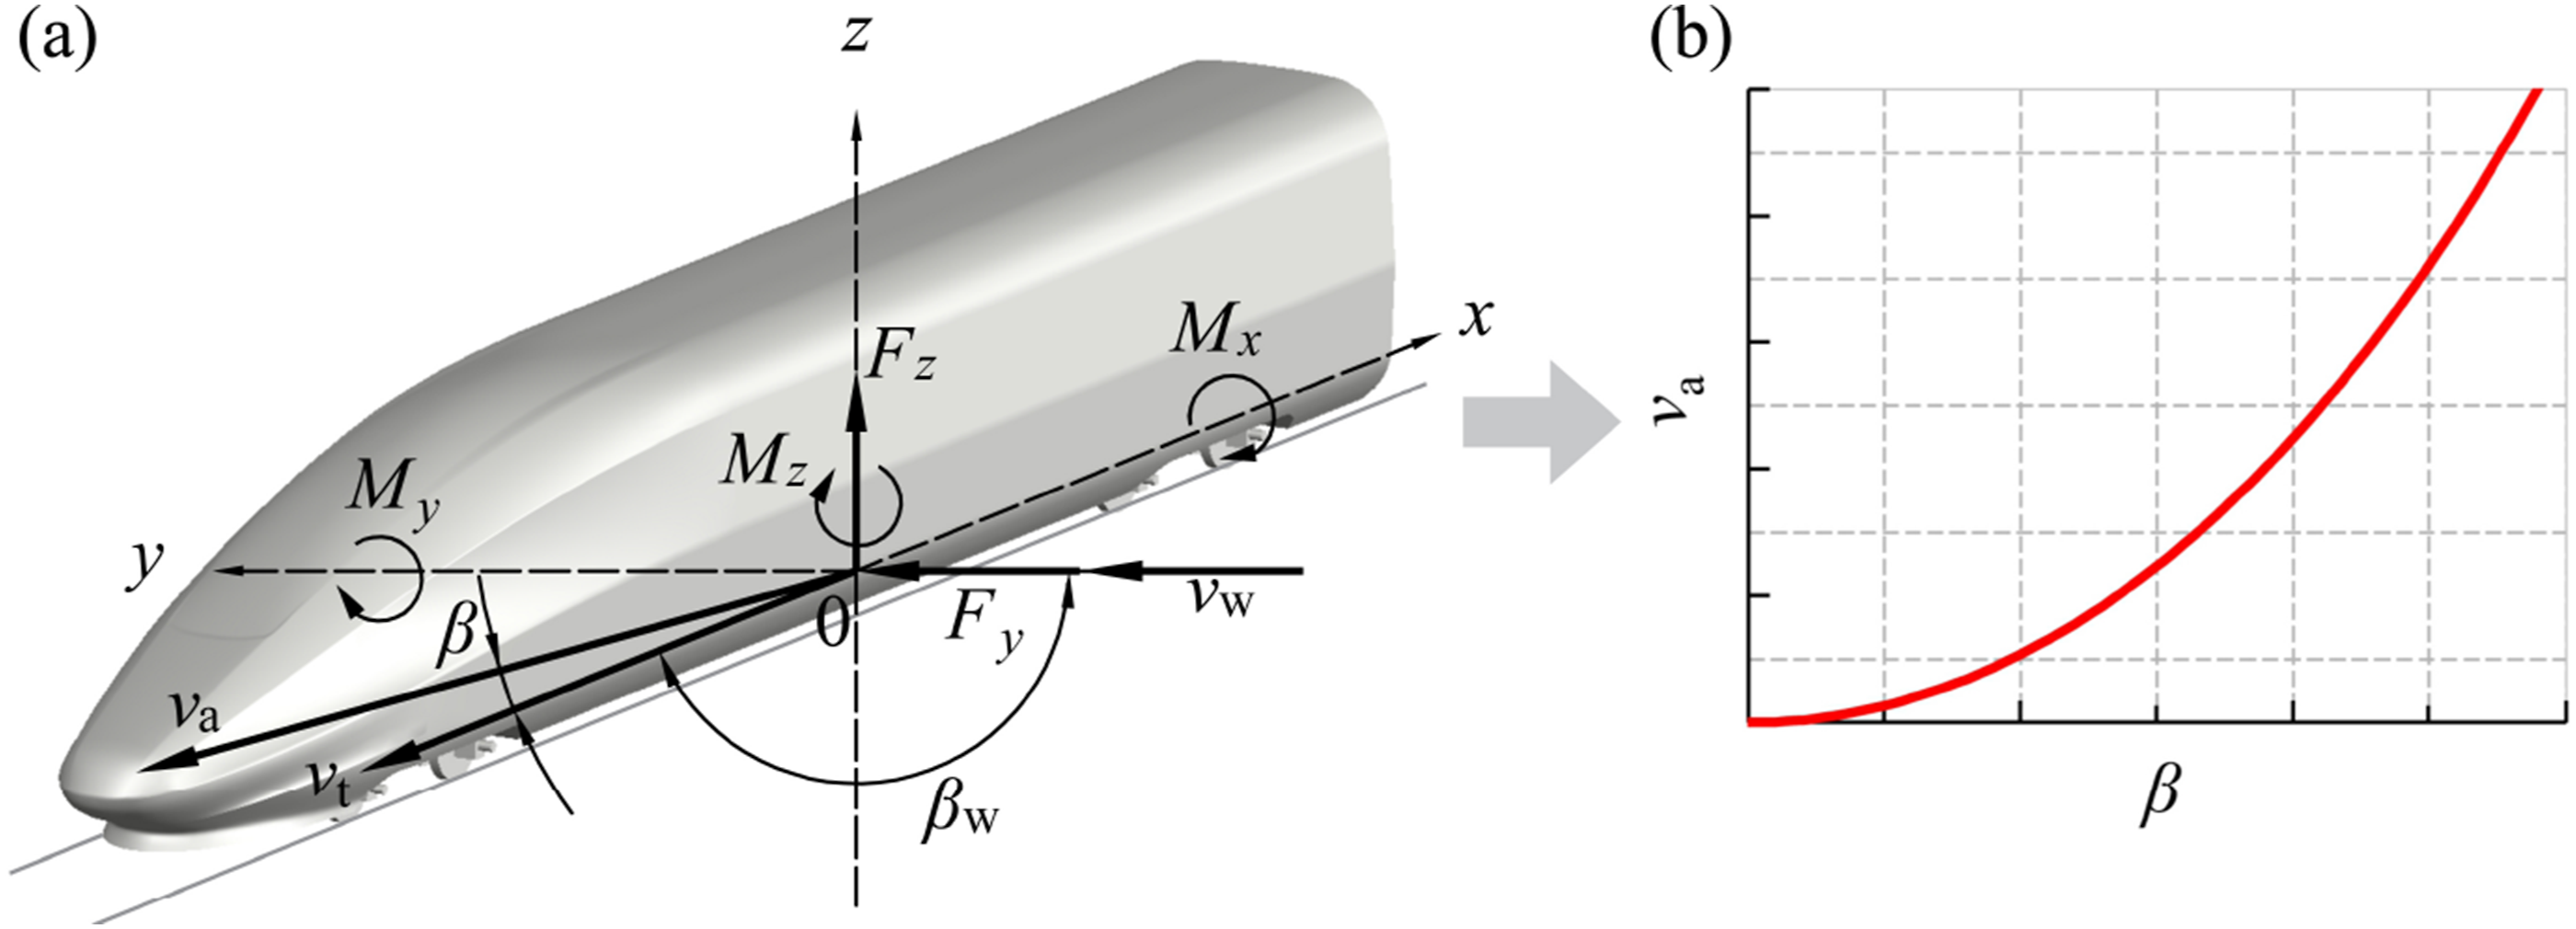
The aerodynamic loads acting on the vehicle during operation are influenced by air density, the maximum cross-sectional area of the train, the aerodynamic coefficient of the train, and the synthesized wind speed. The aerodynamic loads and moments are, respectively, given as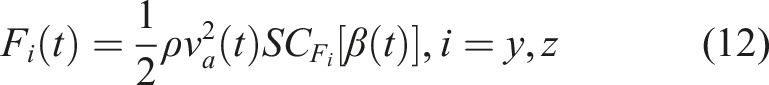
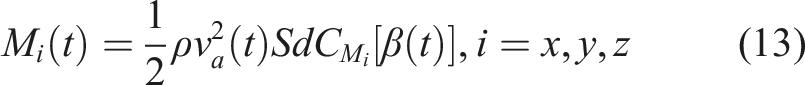
As shown in Figure 3(a), the vector relationship among the yaw angle, wind speed, vehicle speed, and wind angle is governed by equations (14) ∼ (15). Figure 3(b) illustrates the variation of the synthetic wind speed 
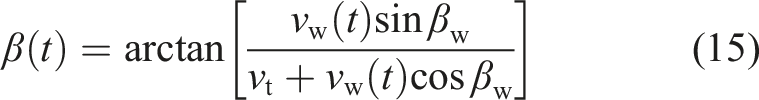
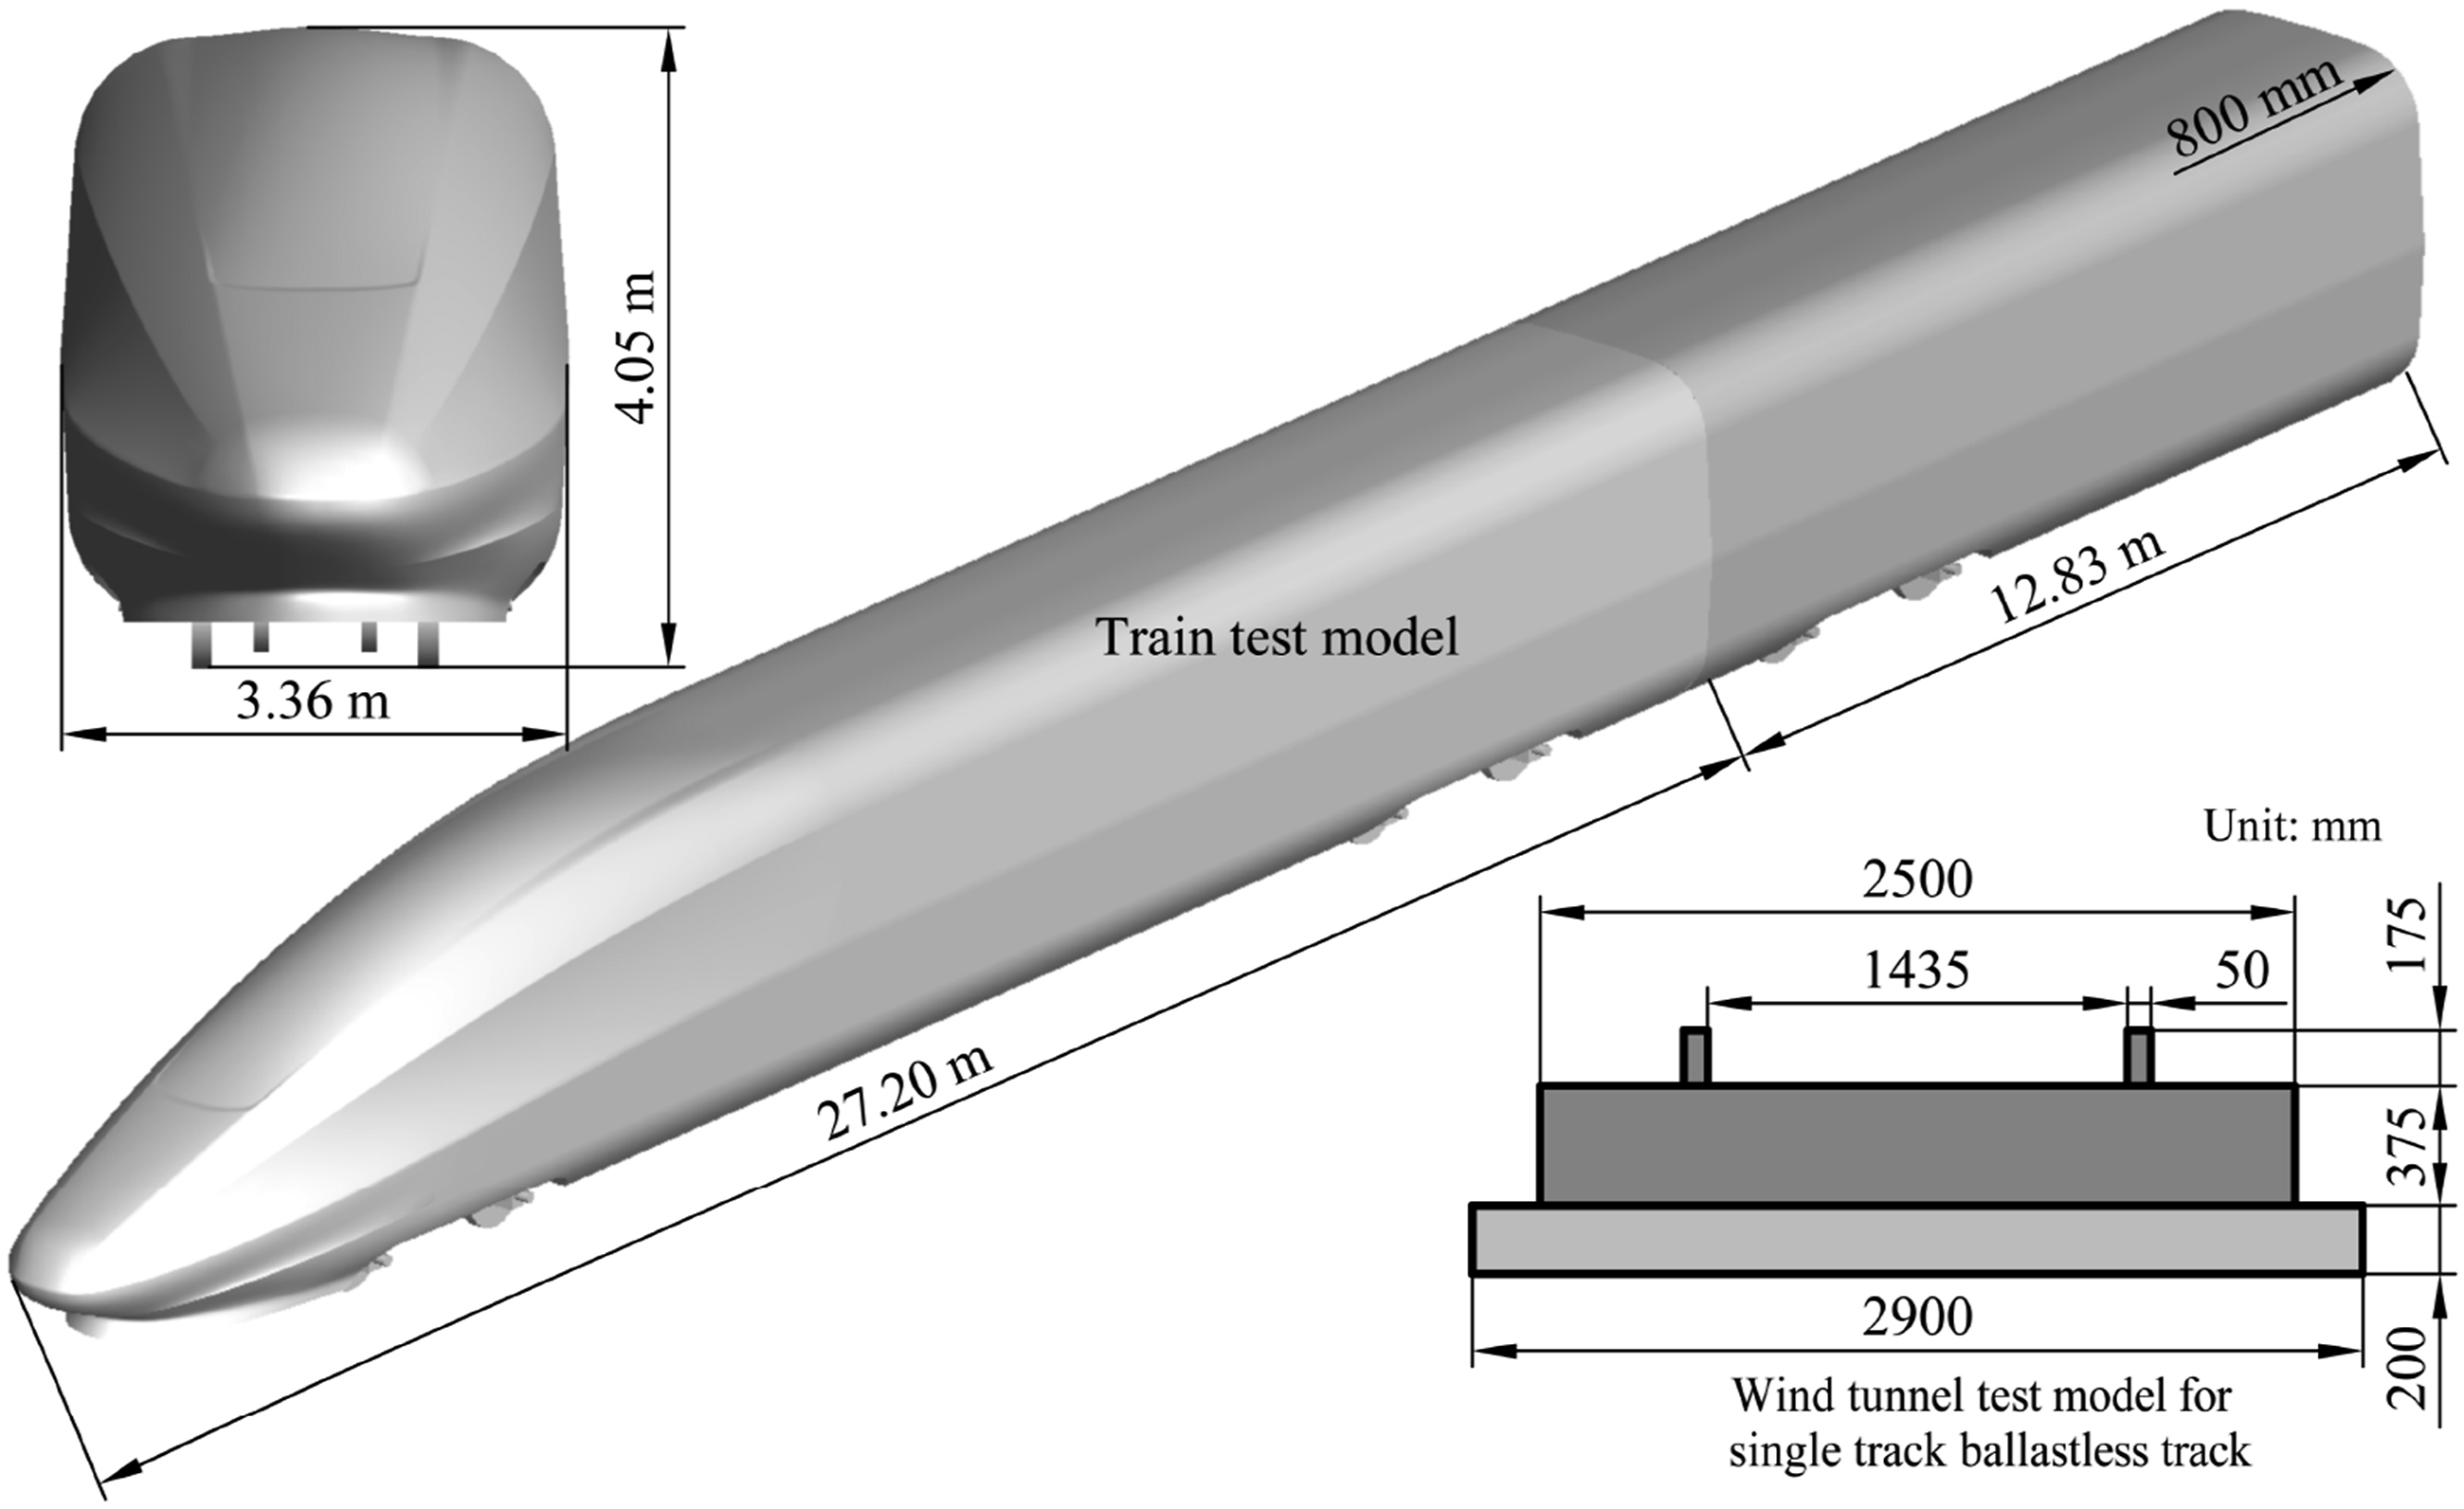
The aerodynamic coefficients from the CN-III standard model wind tunnel test, conducted in accordance with TB/T 3503.5 (2023), are utilized in calculations as depicted in Figure 4. The wind tunnel tests were conducted in the 8 m × 6 m FL-13 wind tunnel of the China Aerodynamic Research and Development Centre (CARDC), in which the axial static pressure gradient of the FL-13 wind tunnel is −0.0001 m-1, the maximum velocity is 100 m/s, and the turbulence is less than 0.1%. The model chosen for the tests was a 1/8 scale model, in which the aerodynamic coefficients measured in Figure 4 were measured at a wind speed of 45 m/s (Li 2023). The wind tunnel test model comprises a leading car and a half-section auxiliary car body, which are least stable under side wind conditions, and employs a single-track ballastless track configuration. The geometry of the test train and track is shown in Figure 5. Wind tunnel test: (a) aerodynamic coefficient curve; (b) wind tunnel test platform and arrangement. Wind tunnel test model.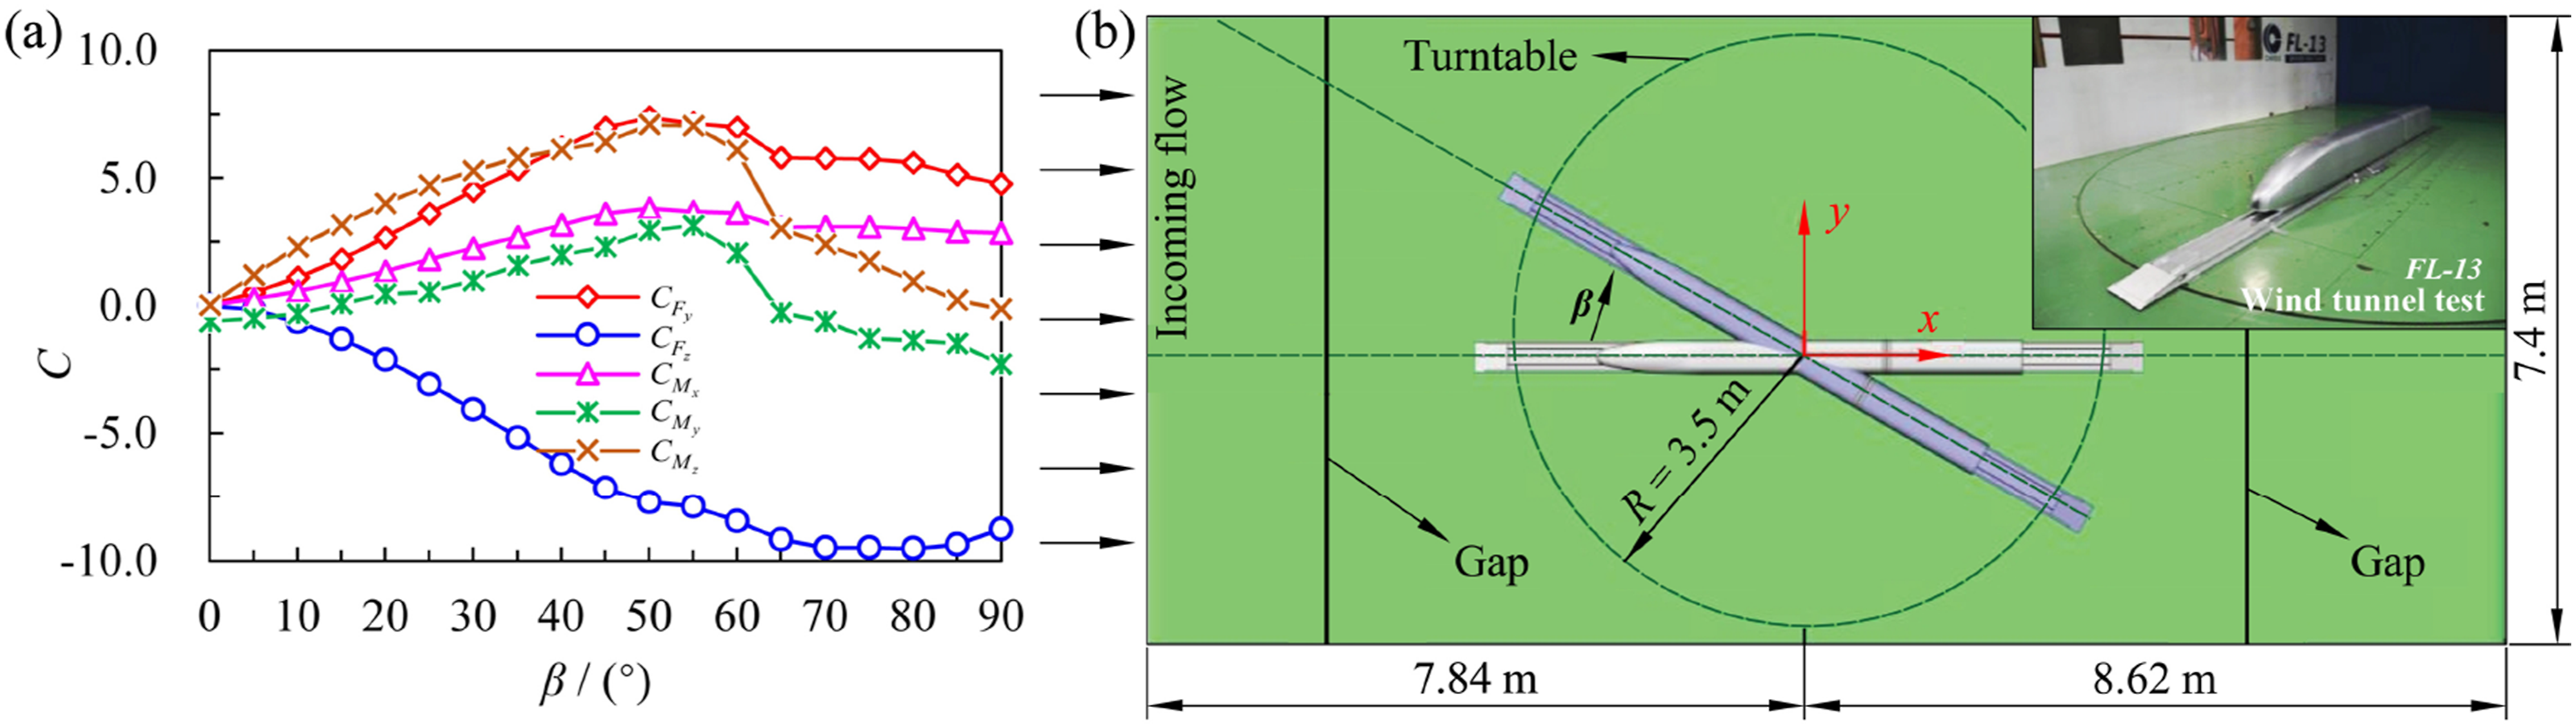
For the subsequent analysis in the paper, the aerodynamic load coefficients 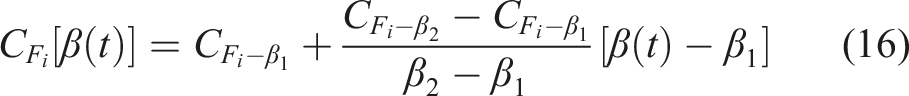
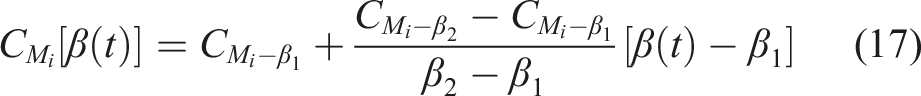
For instance, with Aerodynamic load curve (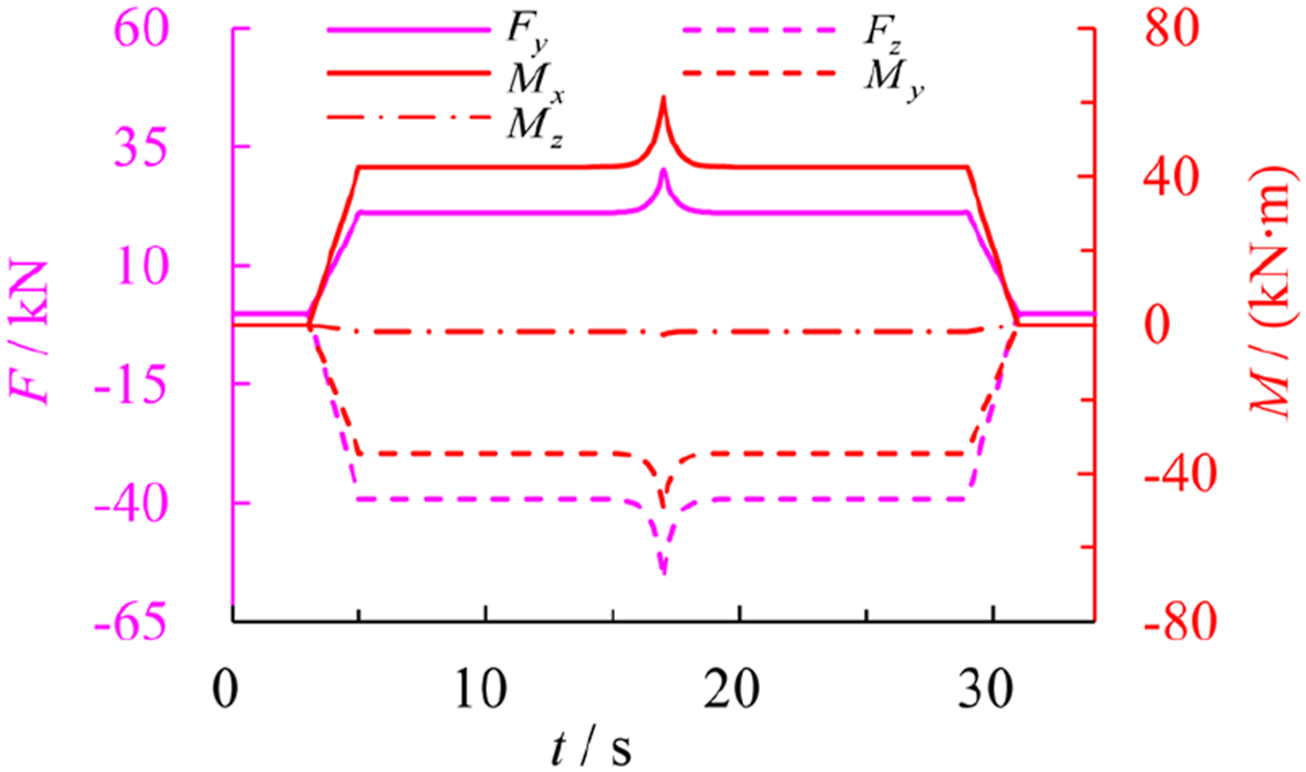
3. Simulation of high-speed train operation under gusty winds
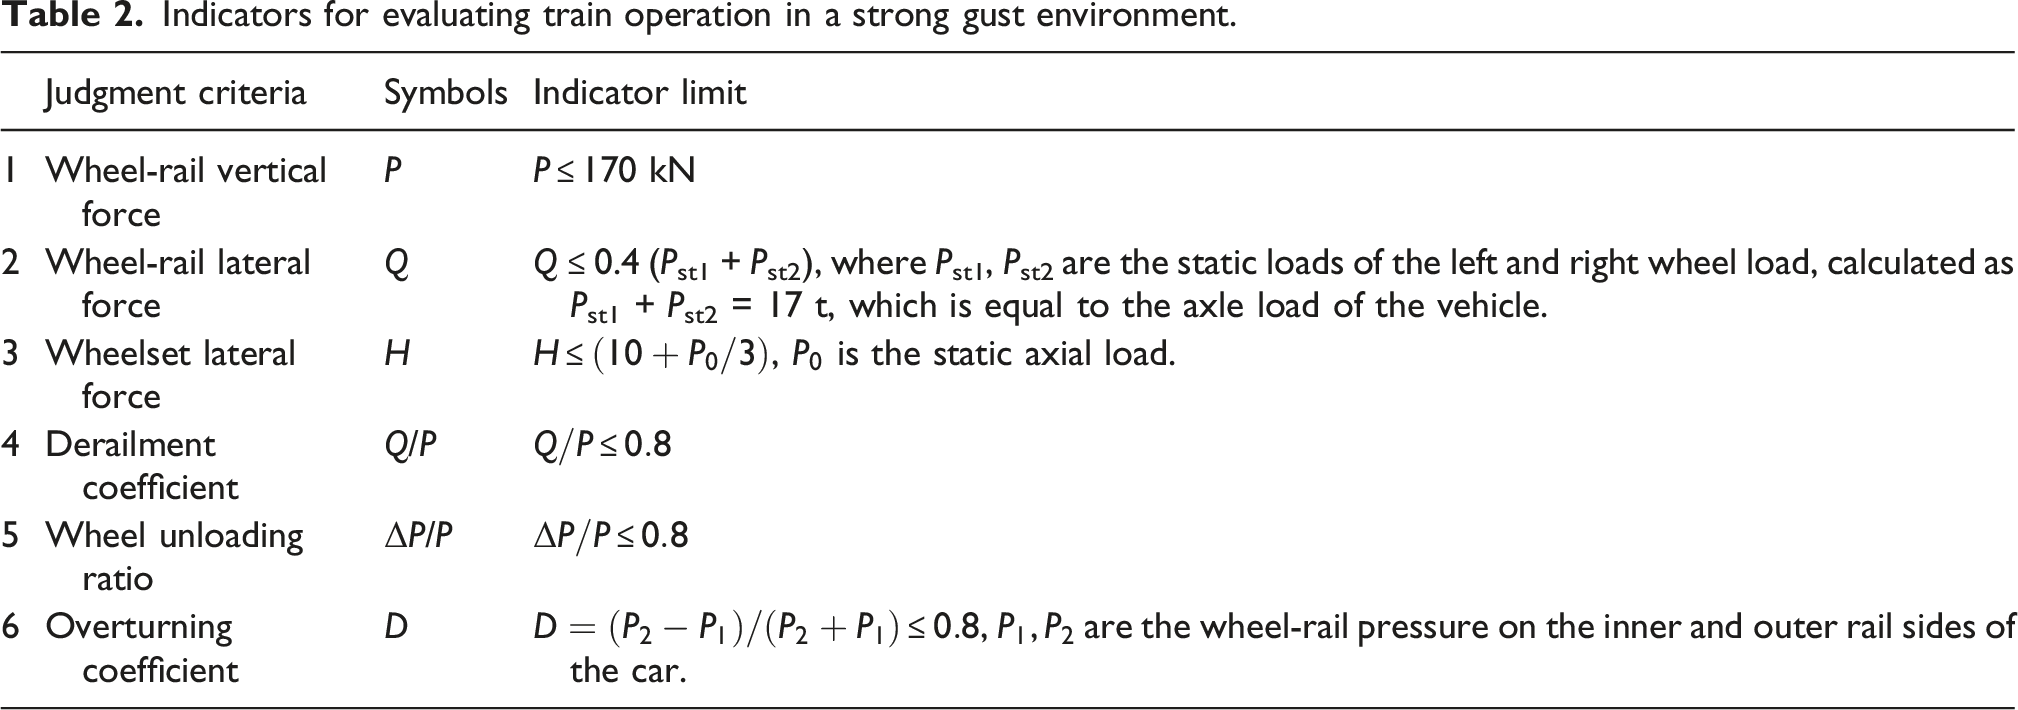
3.1. High-speed train operation safety judgment guidelines
Indicators for evaluating train operation in a strong gust environment.
3.2. Simulation calculation and result analysis
3.2.1. Impact of irregular track on train operating safety
Track irregularities, due to deviations in geometric parameters from an ideal smooth state, is a primary excitation source during train operations, exerting substantial forces between the wheel and rail. This is a principal source of various vibrations in train components and directly impacts the operational smoothness and safety. To examine the effects of track irregularity excitation on train safety under gust conditions, referring to the measured track random irregularities data of a Chinese high-speed railway with a design speed of 350 km/m, the power spectral density is shown in Figure 7(a), and the simulation calculation is based on the equivalent algorithm of the power spectral density in the frequency domain, which results in the time samples in different wavelength ranges, as shown in Figure 7(b). Simulations were performed with parameters Sample data on measured track irregularities: (a) railway track irregularities power spectral density, (b) vertical and lateral irregularities. Variation curve of safety limit index of vehicle operation considering track irregularities (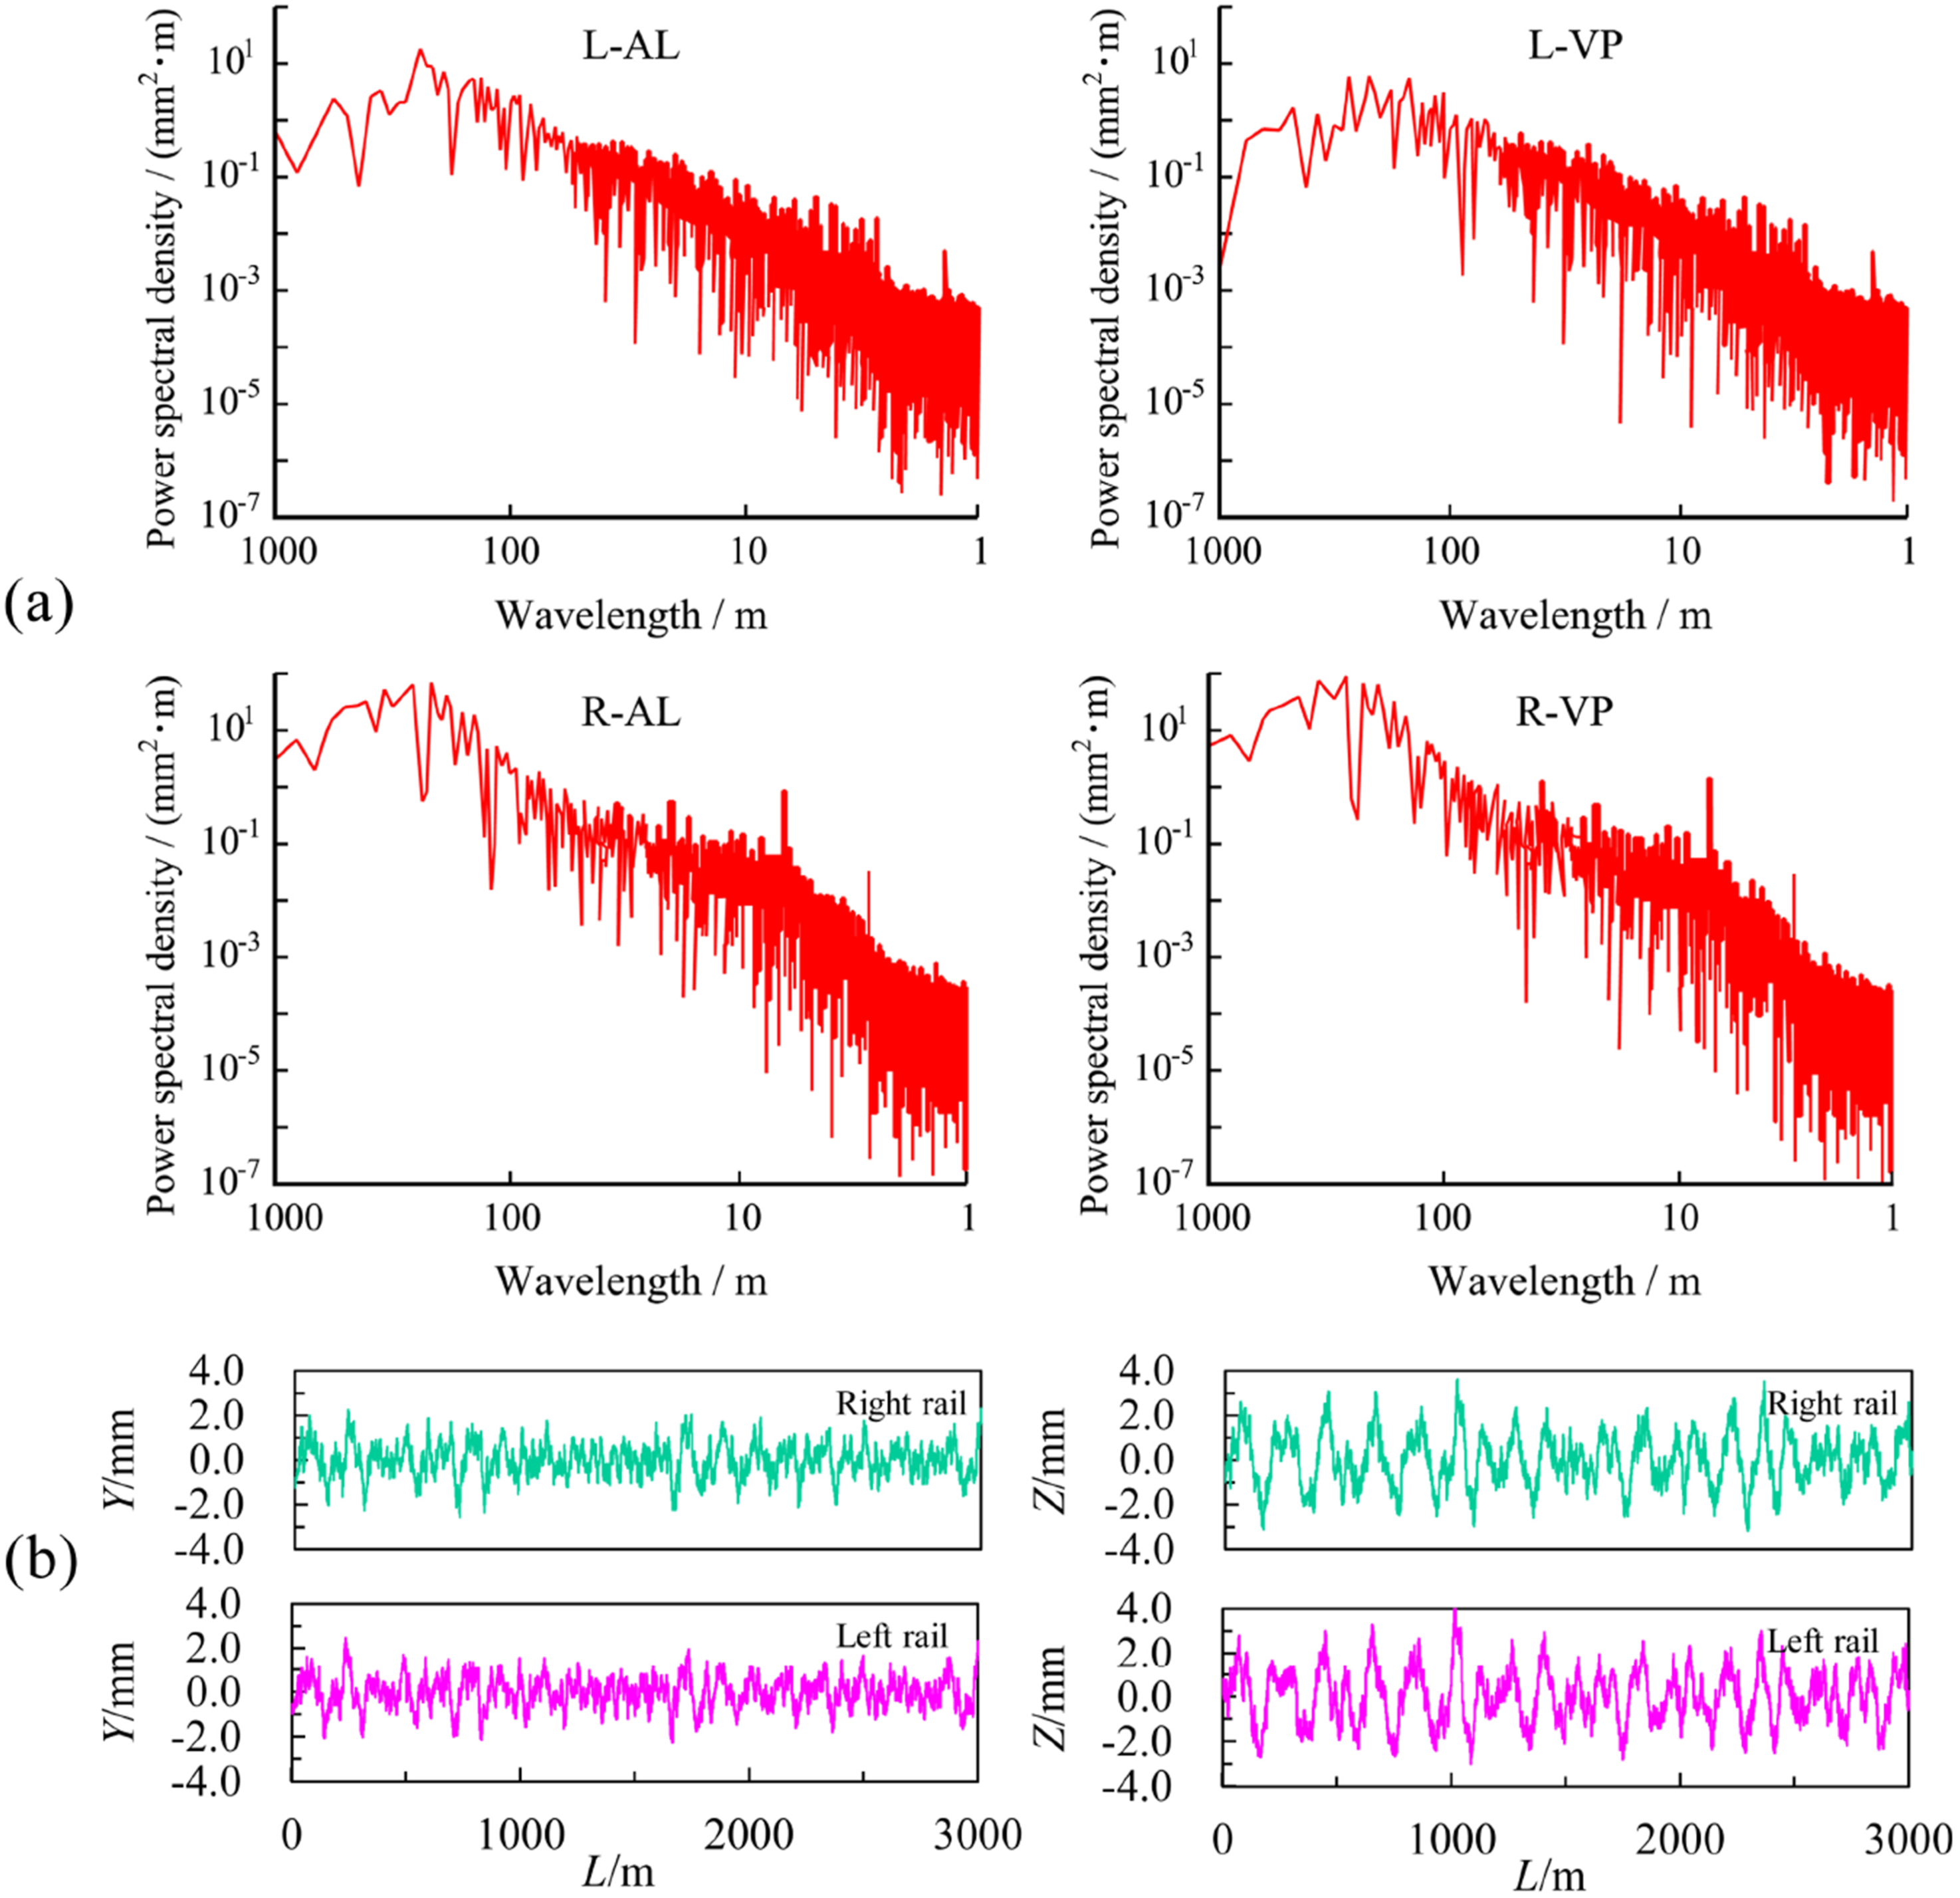
3.2.2. Analysis of the most dangerous wheelset under gust
To investigate the operational safety of trains under strong gusts of wind, it is essential to analyze the motion of each wheelset under wind loading. This involves identifying the wheelset associated with the first derailment of the vehicle over time as gust loading occurs, based on various derailment criteria. Subsequently, the operational safety domain of the vehicle can be determined using the safety limit value index. As illustrated in Figure 1, equilibrium equations for the longitudinal, transverse, and vertical forces acting on wheelsets 1, 2, 3, and 4 are established. These equations are derived from the relative displacements and accelerations of each component within the vehicle system. Additionally, the equations of motion for each wheelset are formulated using D’Alembert’s principle alongside the equilibrium equations of forces, resulting in the following differential equations:
Lateral vibration: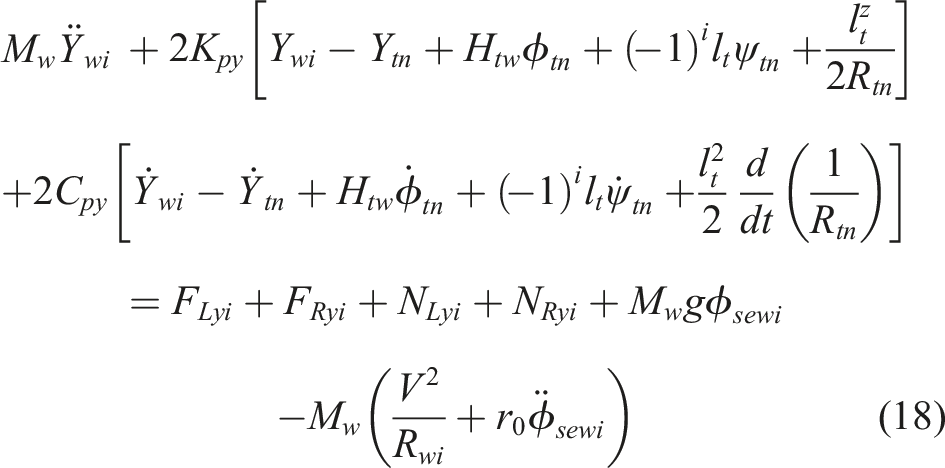
Bouncing: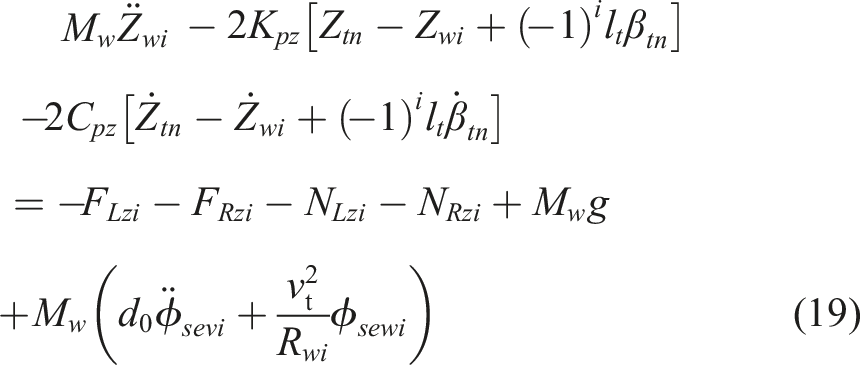
Rolling: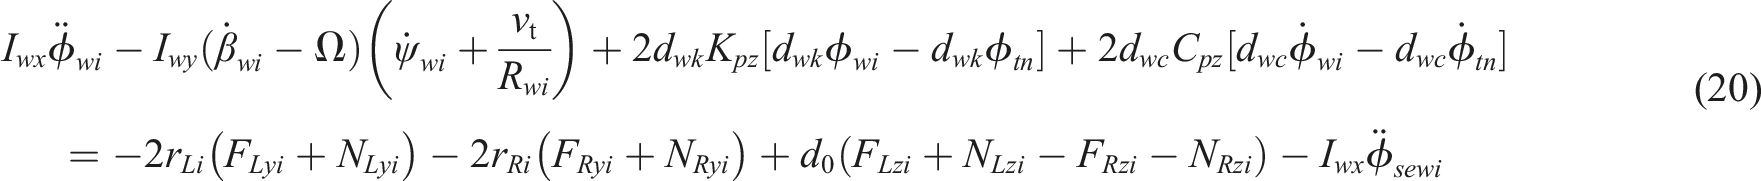
Pitching: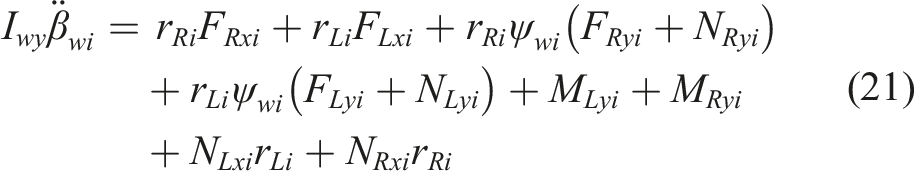
Yawing: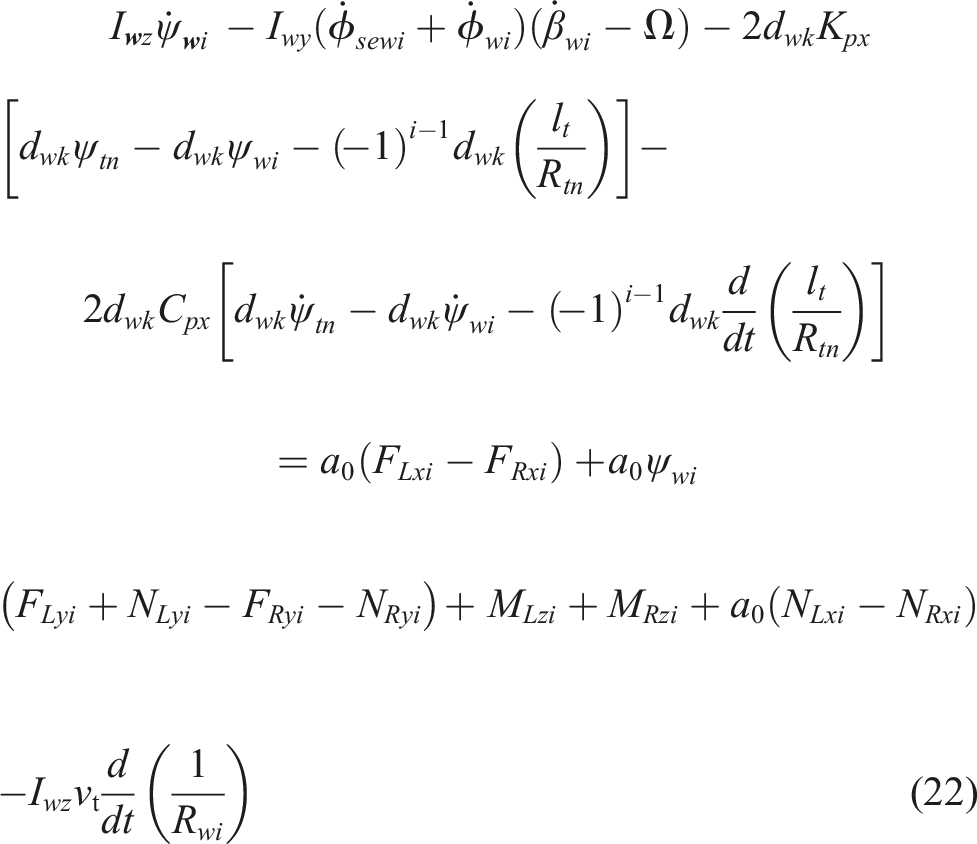
When Variation curves of the indicators of safety limits for vehicle operation (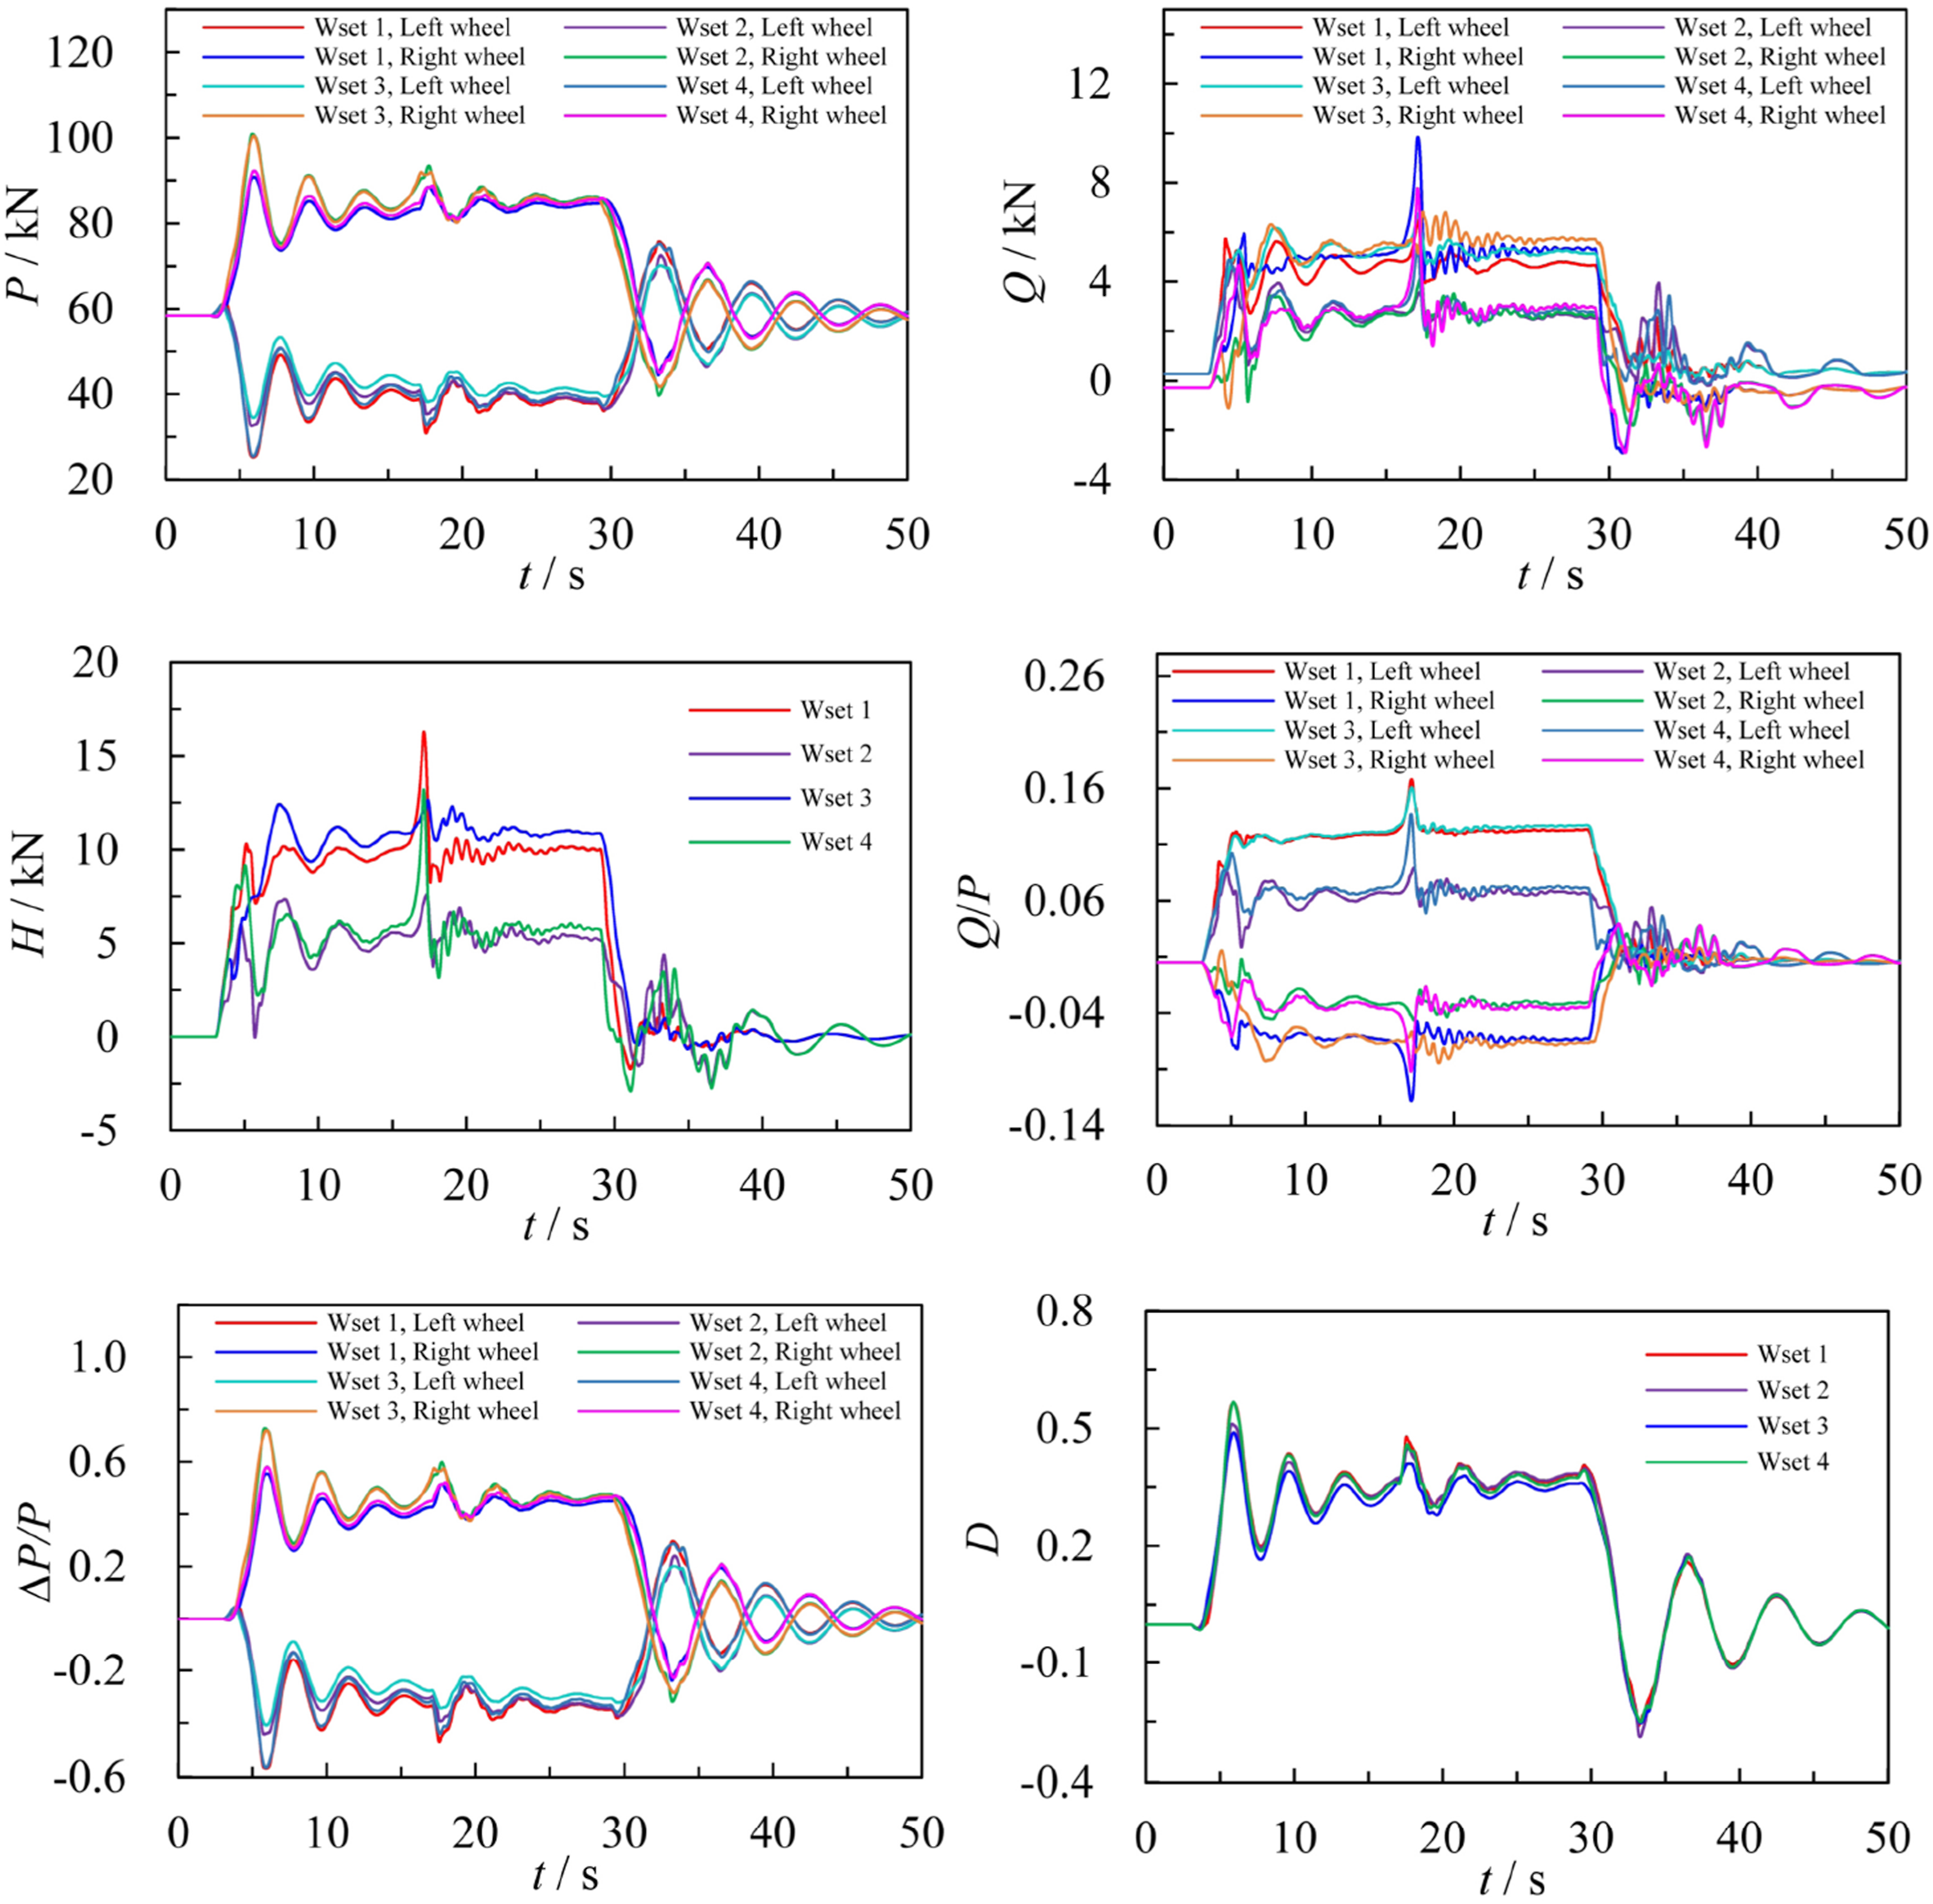
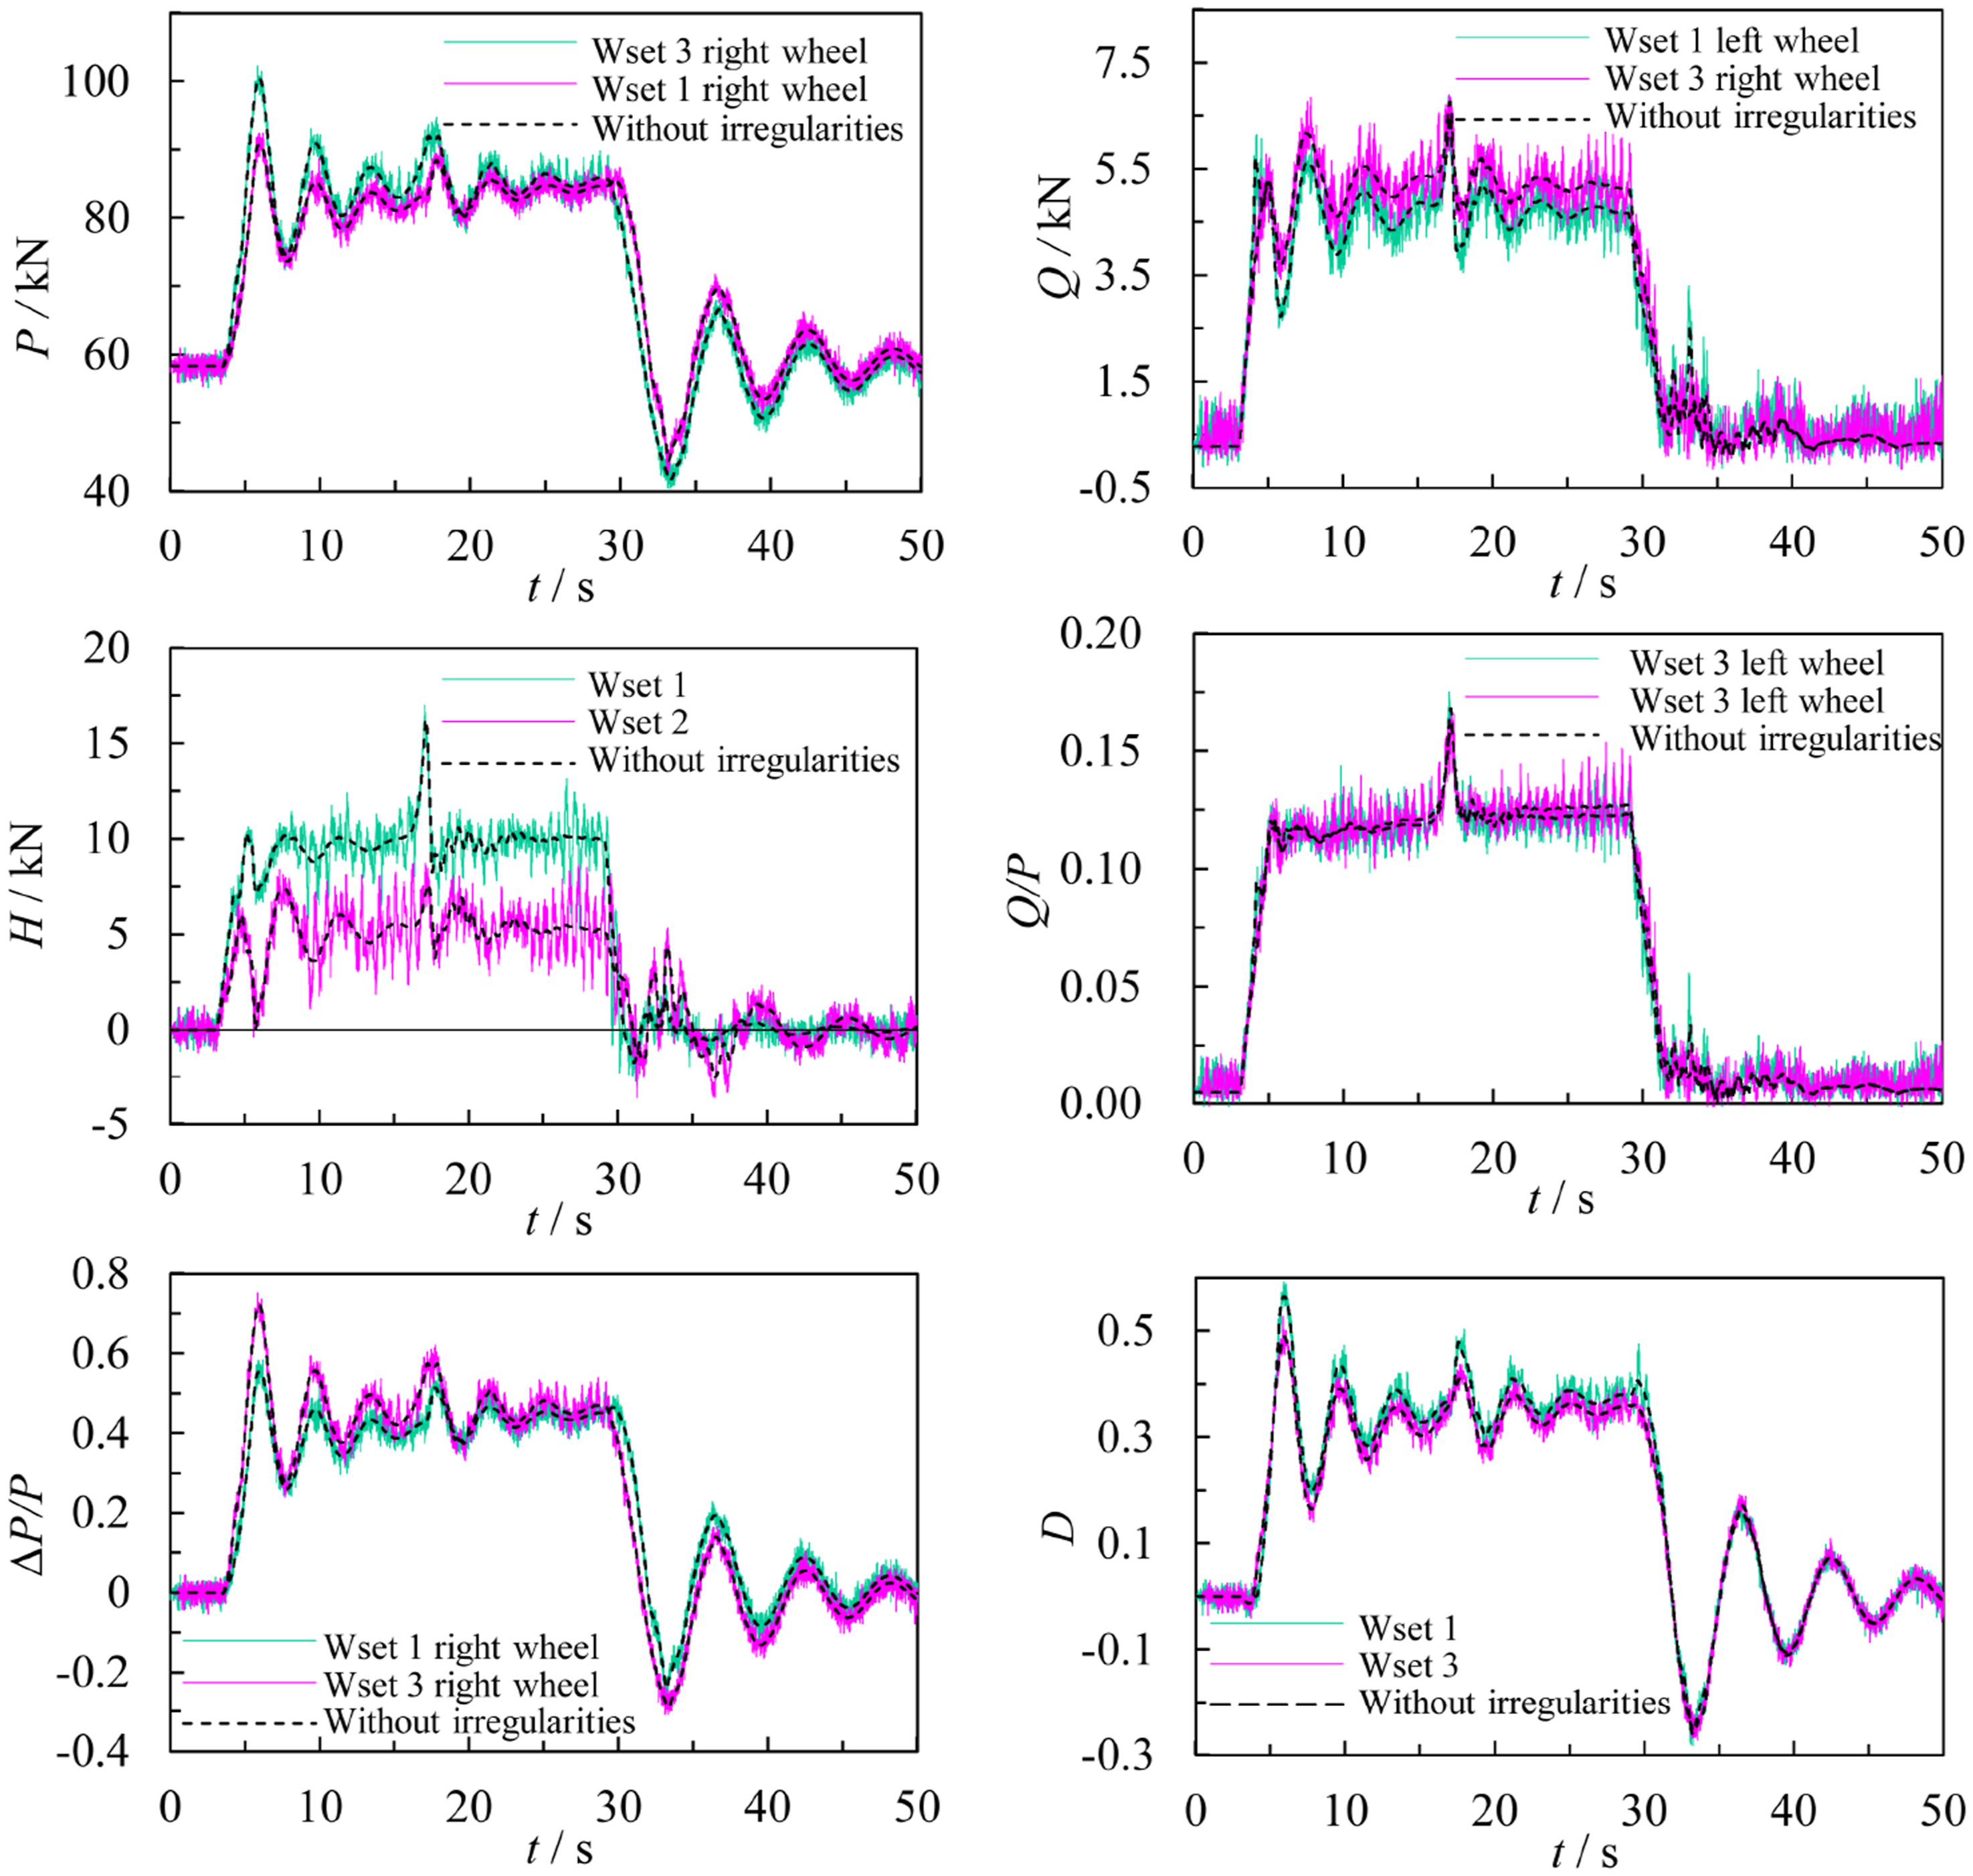
From P, it can be observed that under gust load conditions, the wheel-rail vertical force on the leeward side of the vehicle increases, while a symmetrical reduction in load occurs on the windward side. The wheel-rail vertical force loading amplitude is most significantly affected by the gust load on both the leeward side of the two-position wheelset and the leeward side of the three-position wheelset. The trends of these two changes are essentially similar. On the windward side, the one-wheeled wheelset and the four-wheeled wheelset experience the most significant reduction in wheel-rail vertical force. This vertical force is the primary load contributing to dynamic impacts between the wheel and rail. In terms of line load, it must not exceed the limit value of 170 kN. A comprehensive comparison of the three wheelsets on the leeward side is selected as a safety limit indicator for evaluating the wheel-rail vertical force P.
From Q can be observed that the leeward side of a wheelset experiences significant changes in the transverse force due to gust loads, with the most pronounced amplitude occurring in the wheel-rail lateral force. The peak value of this force is the highest observed. Excessive lateral force on the wheelset may result in fastener breakage, track irregularities, and rail rotation, potentially leading to train derailment. Generally, 40% of the axle weight is considered the limit for the wheel-rail lateral force. Therefore, a comprehensive comparison of the leeward side of a wheelset is employed to assess the safety limit of the wheel-rail lateral force Q index.
From H, it is evident that the average wheelset lateral force for both one wheelset and three wheelsets of the vehicle experiencing gust load changes is the highest. Additionally, the transient loading phenomenon of wheelset lateral force is most pronounced for one wheelset and four wheelsets under maximum gust wind speeds. Excessive wheelset lateral force is a primary contributor to track displacement, dynamic instability of seamless tracks, and rail expansion. Therefore, a comprehensive comparison supports the selection of one wheelset as a benchmark for assessing the safety limit value indicators of the wheelset lateral force. H.
From Q/P, it is evident that the derailment risk for wheelsets one and three is significantly greater than that for wheelsets two and four. During the peak gust average wind speed stage, the average derailment coefficient for the windward side of wheelsets one and three increases by 54.6% compared to wheelsets two and four. The derailment coefficient, defined as the ratio of wheel-rail lateral force to vertical force, is assessed based on the conditions of wheel climbing and jumping, establishing a safety limit. A comprehensive evaluation selects the windward side of a wheelset as the index for the derailment coefficient Q/H safety limit.
From ΔP/P, the wheel unloading ratio of the wheelsets on the leeward side of the vehicle is slightly larger than that of the corresponding wheelsets on the windward side. Specifically, the wheel unloading ratios of the two- and three-position wheelsets on the leeward side are marginally greater than those of the one- and four-position wheelsets, while the one- and four-position wheelsets on the windward side exhibit slightly larger ratios than the two- and three-position wheelsets. The wheel load shedding rate is derived from the equilibrium condition of the vertical and lateral forces of the wheel when H = 0. This rate, in conjunction with the derailment coefficient, is utilized to assess the safety of vehicle operation. The three-position wheelsets on the leeward side are designated as the safety limit index for evaluating the derailment coefficient ΔP/P in the comprehensive comparison.
From D, it can be observed that the overturning coefficients of wheelsets 1 to 4 exhibit a consistent trend with the loading and unloading of gusts. The overturning coefficient is employed to assess the likelihood of the vehicle overturning to one side under the most unfavorable combinations of lateral force, centrifugal force, and the inertial forces associated with transverse vibration. The vehicle reaches a critical overturning state when the wheel load on one side is reduced to zero. To evaluate the safety limits of a wheelset, the overturning coefficient D is utilized in conjunction with several other criteria. This approach enables the identification of the most critical wheelsets, with one wheelset selected as the safety limit index for evaluating the overturning coefficient D in a comprehensive and comparative manner.
3.2.3. Impact of gust wind speed on train operation safety
In section 3.2.2, the most dangerous wheelsets prone to derailment under gust effects are identified, and the impact of gust wind speed on train operational safety is examined in detail. For Variation curves of the indicators of safety limits of vehicle operation corresponding to different wind speeds (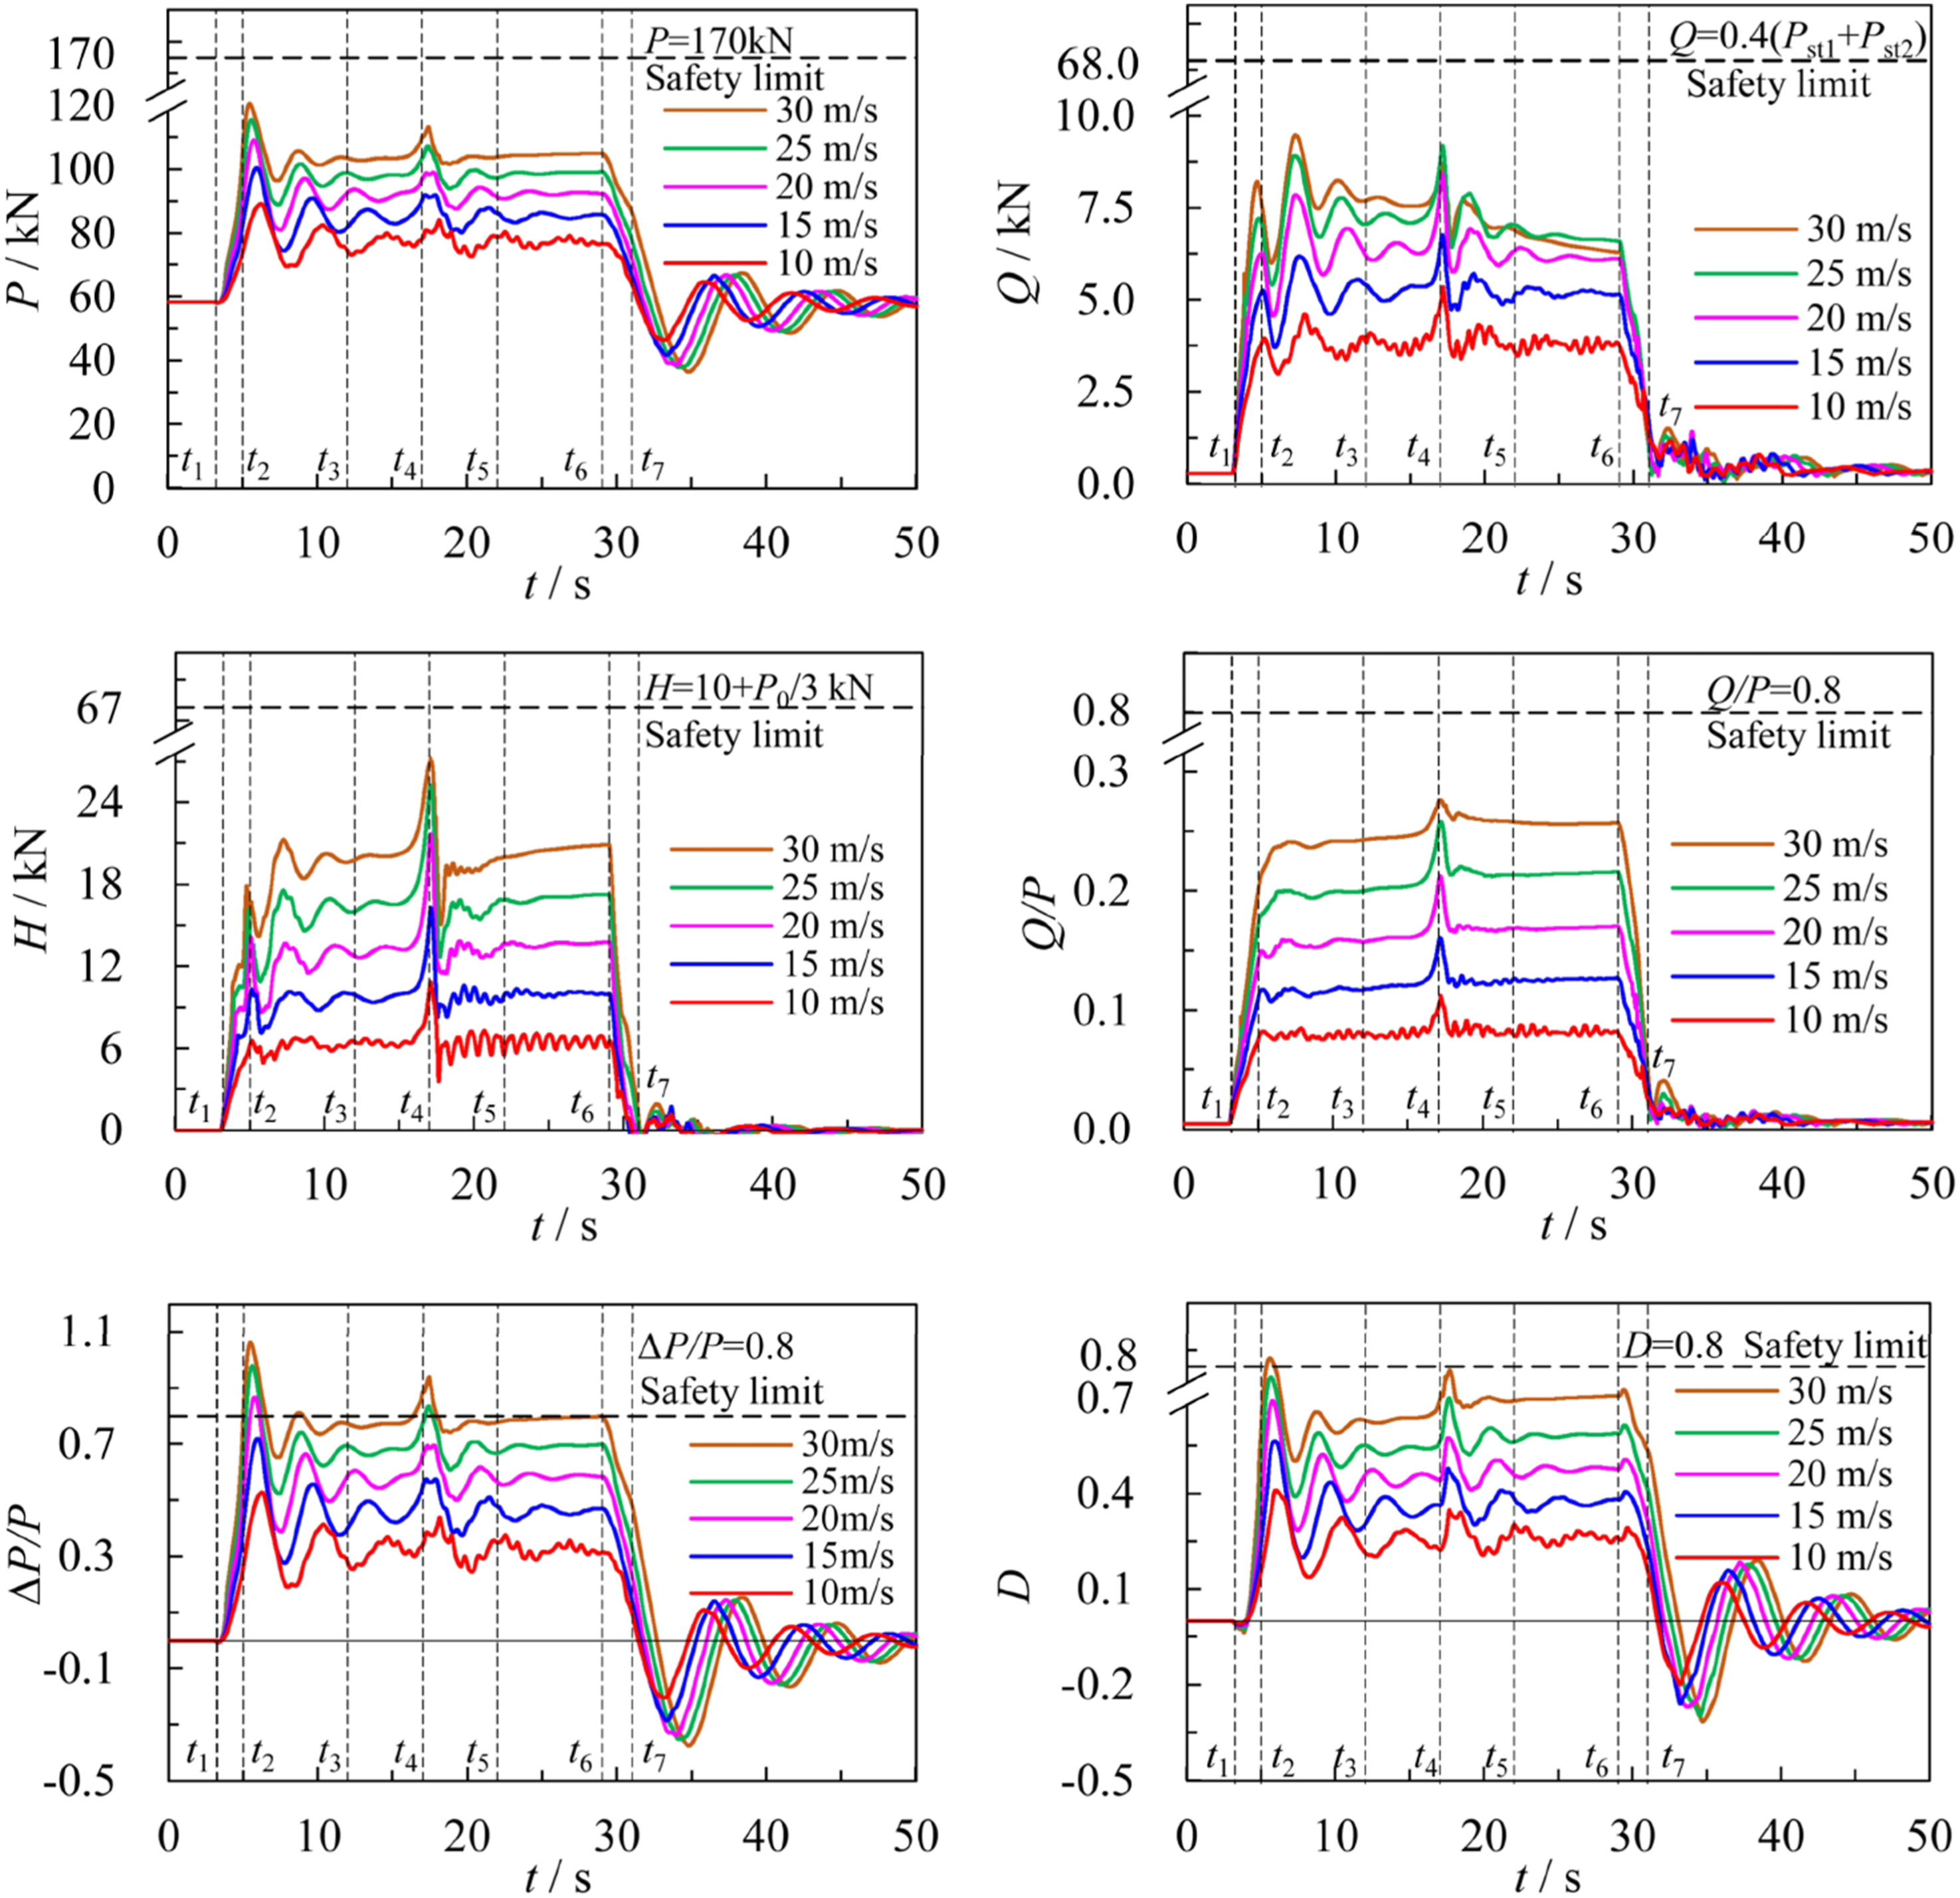
From Figure 10, it is evident that gusts lead to a reduction in wheel load on the windward side of the vehicle, while causing an increase in wheel load on the leeward side. Furthermore, the train derailment safety evaluation indices P, Q, H, Q/P, ΔP/P, and D all exhibit an increase with the enlargement of the local curvature range, corresponding to the changes in the amplitude of oscillations as these indices gradually weaken. The initial point at which P, ΔP/P, and D exceed the safety limit under gust conditions corresponds to the moment t2, whereas the first point where H, Q, and Q/P surpass the safety limit is observed at moment t4.
When the vehicle initially enters the gust wind field, parameters P, Q, Q/P, ΔP/P, and D exhibit a linear increase as time progresses from t1 to t2. At a certain point during t1 to t2, H shows a step change. In the stabilization phase from t2 to t3, which corresponds to the mean wind speed of the gust, P and ΔP/P reach a maximum peak at t2 due to a sudden linear increase in wind load, followed by fluctuations and gradual decay. Local peaks of Q and H occur between t2 and t3, while fluctuations in D remain relatively small during this interval. In the following phases, t3 and t4, the nonlinear increases in P, Q, H, Q/P, ΔP/P, and D result from the exponential rise of wind gusts, reaching their peak values. This peak corresponds to the maximum values of H and Q/P, as well as the second peaks of P, Q, ΔP/P, and D. The second peak of P, Q, ΔP/P, and D aligns with the maximum values of H and Q/P. From t4 onward, the sudden change in system acceleration due to increased wind speed leads to fluctuations and attenuation of all parameters, which gradually stabilize during the intervals of t5 to t6. The decay rates of P, ΔP/P, and D during t2 to t3 increase with rising mean wind speed
Combined with Figure 1, the differential equations governing the transverse motion and side-roll motion of the car body are established, as presented in equations (23) ∼ (24). The trends of the vehicle body lateral displacement Dynamic response of the car body under gust (

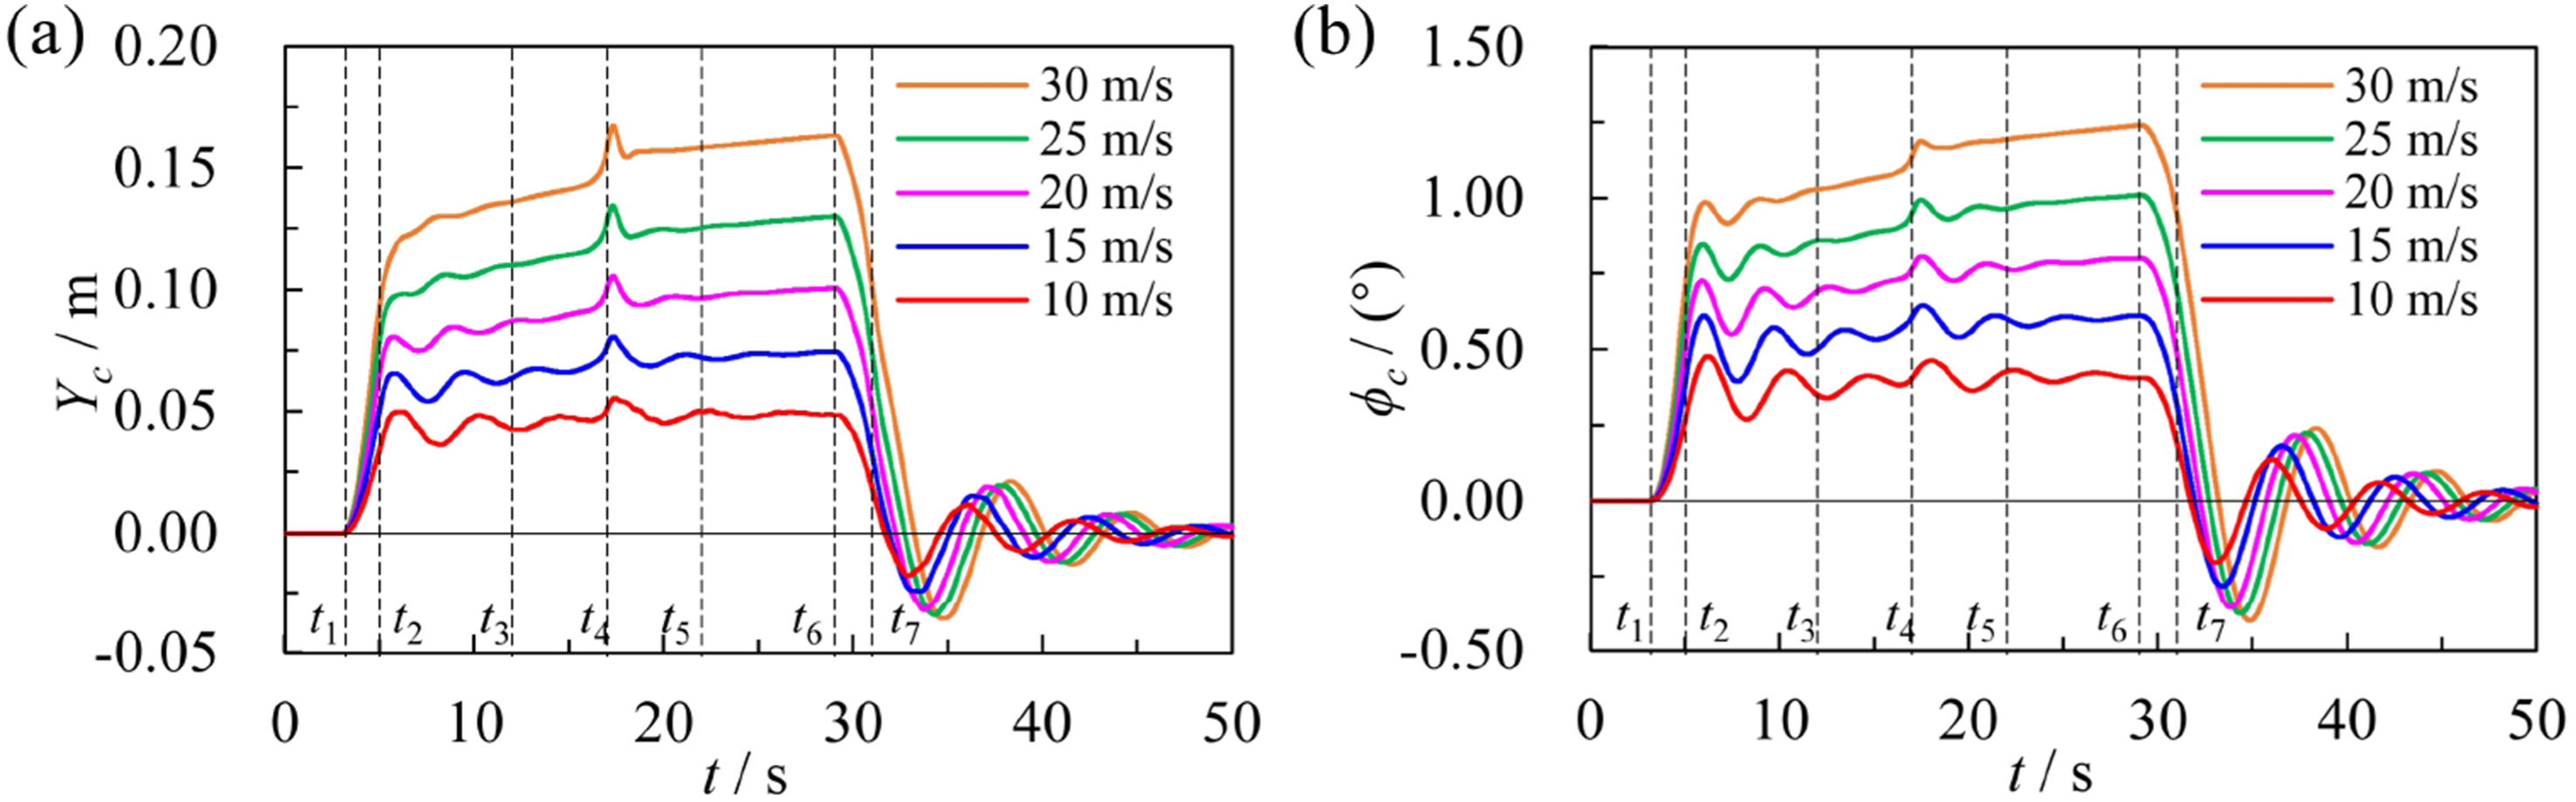
The primary parameter influencing a vehicle’s resistance to overturning is the secondary suspension rolling stiffness. When the air spring is deflated, the emergency rubber spring stiffness, which is significantly greater than that of the air spring, enhances the vehicle’s ability to resist side-roll. As illustrated in Figure 11, the variation patterns of
3.2.4. Impact of train speed on operational safety
Under the conditions established in Section 3.2.2, which identifies the most dangerous derailment wheelsets subjected to gusts, and the corresponding spatial and temporal states of gusts that yield the maximum values for each safety limit index discussed in Section 3.2.3, the influence of train speed on operational safety is examined in detail. For maximum wind speed of “hat gust” Variation curve of vehicle operation safety limit index with vehicle speed (βw = 90°): (a) P; (b) Q; (c) H; (d) Q/P; (e) ΔP/P; (f) D.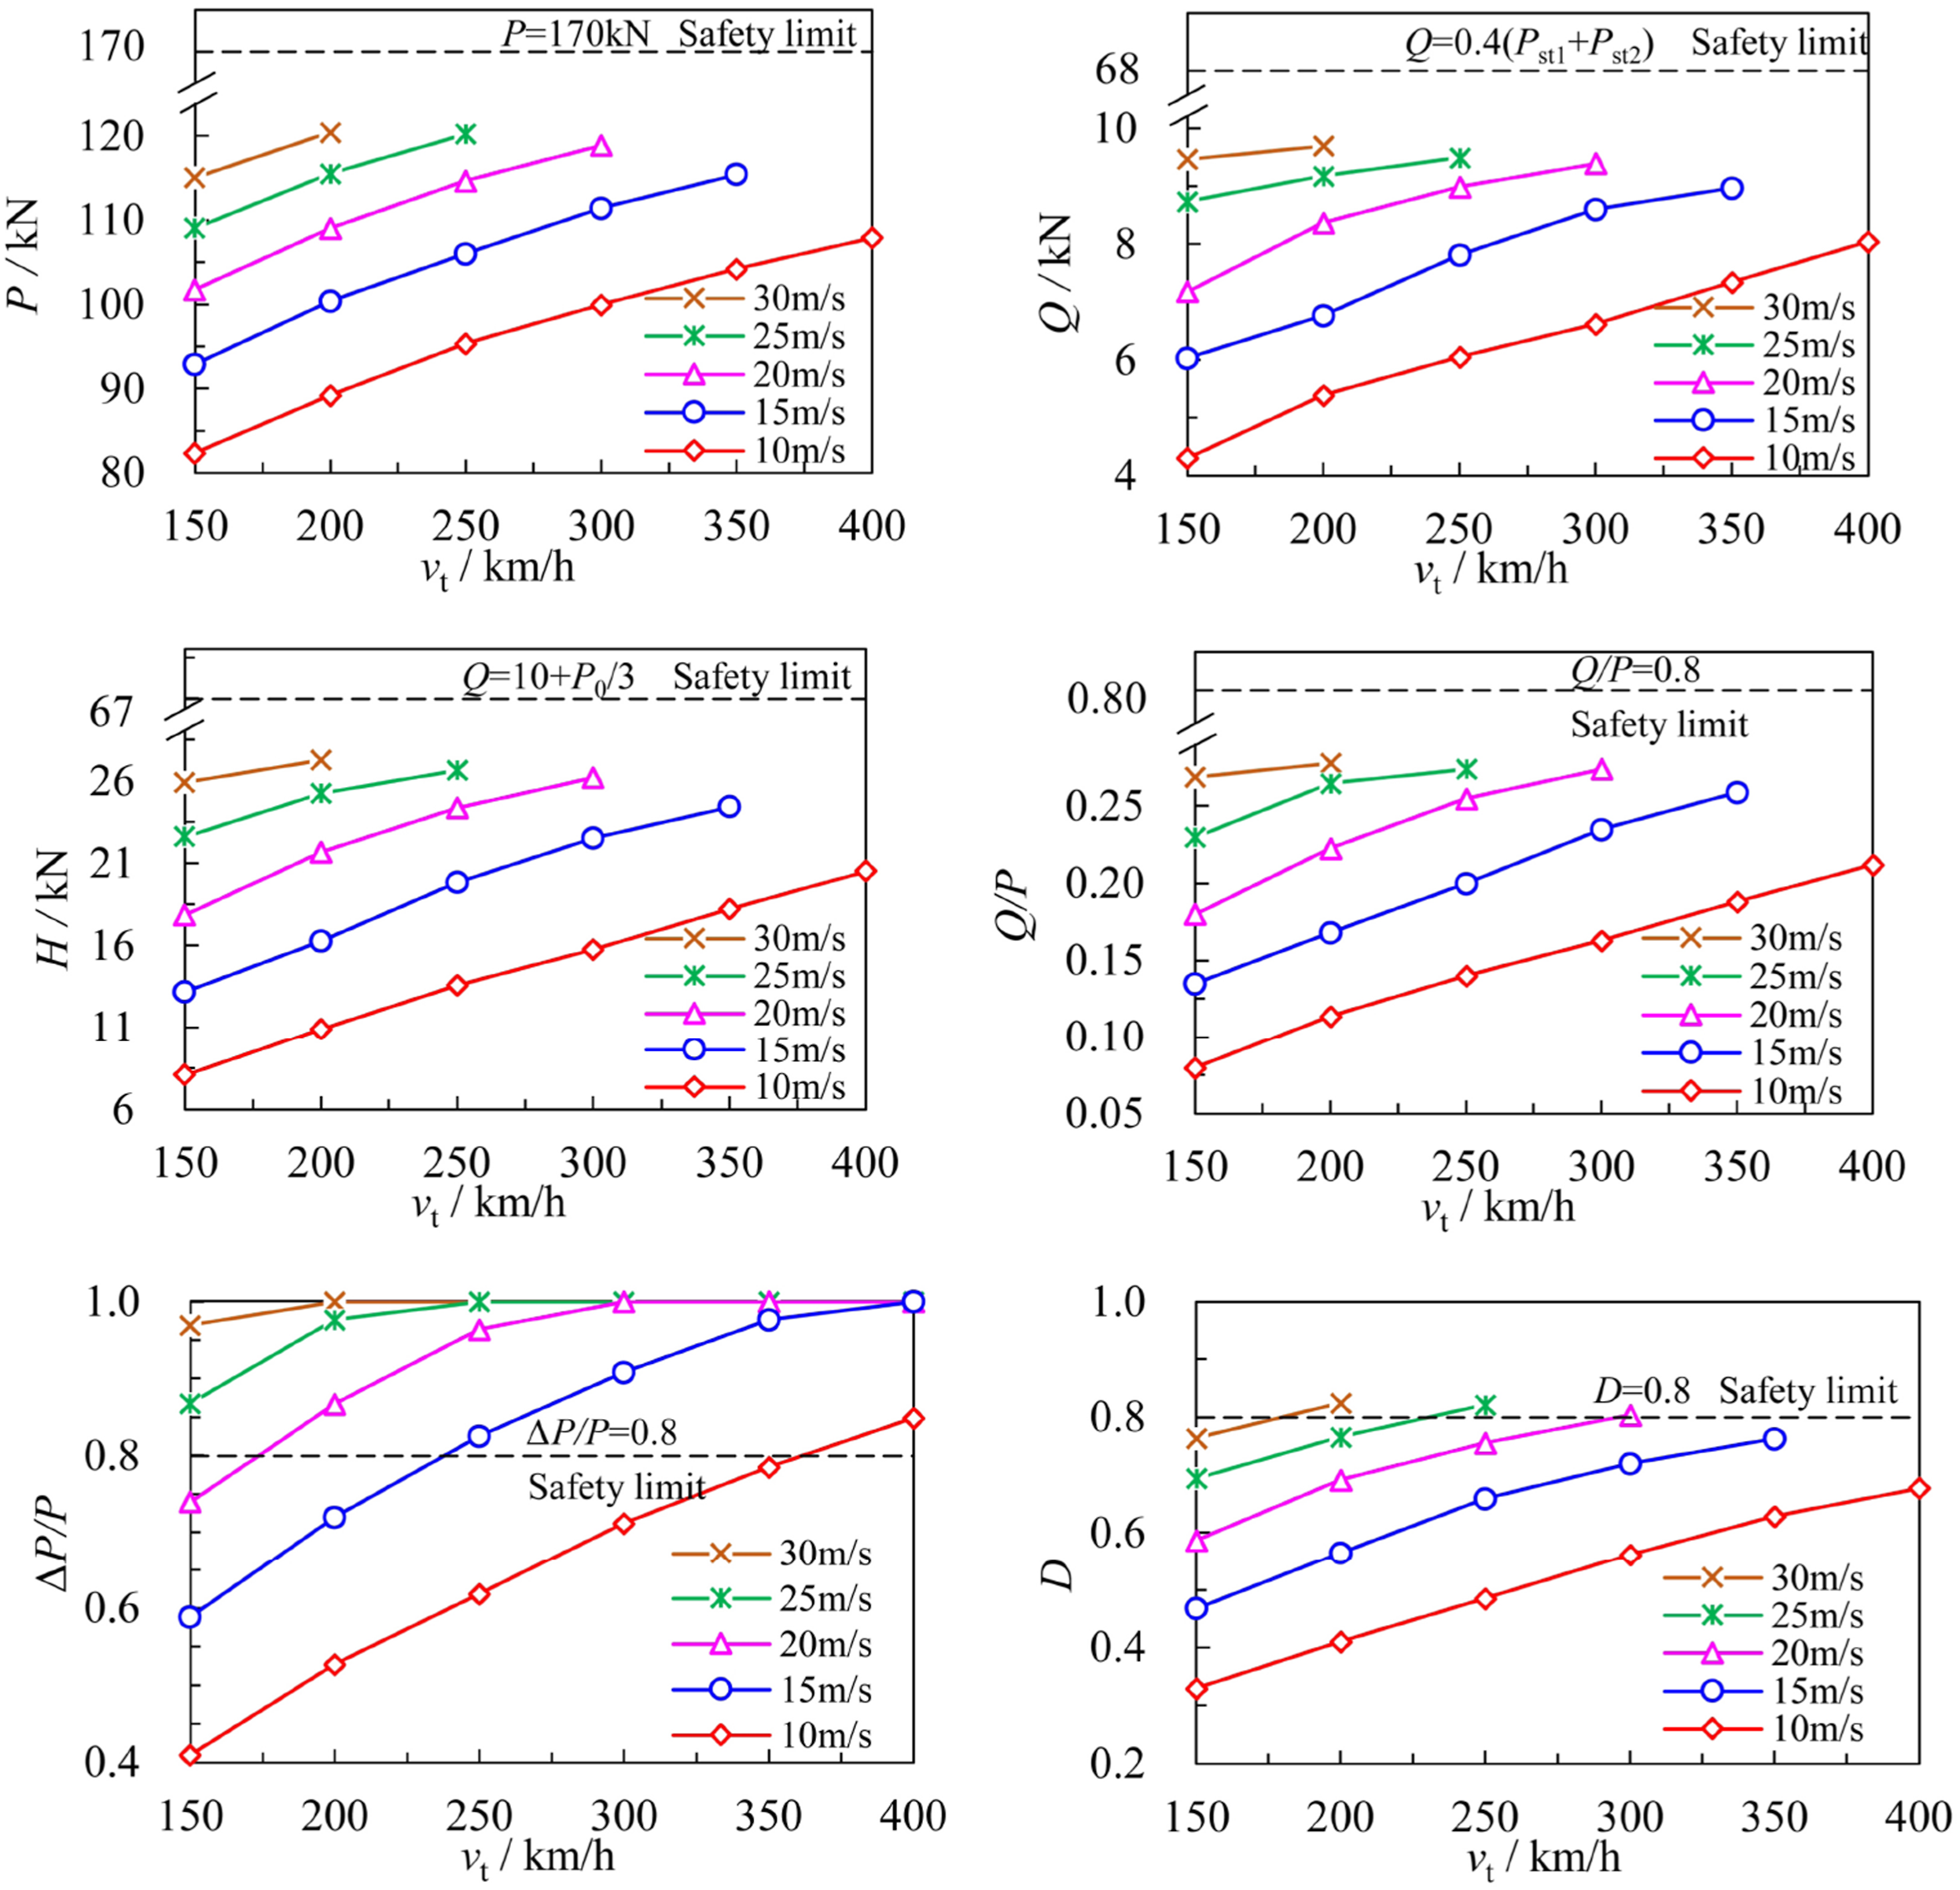
As shown in Figure 12, the train derailment safety evaluation indexes P, Q, H, Q/P, ΔP/P, and D all increase linearly with the increase of vt; similarly, the increase of vw(t) results in a rapid escalation of derailment indexes. In the operating speed range of 400 km/h, as vt increases, ΔP/P and D are the first indicators to exceed the operating safety limits. At a fixed speed, there exists a critical speed that causes ΔP/P and D to surpass the safety limit values. When vmax > 25 m/s and vt > 200 km/h, ΔP/P > 1 indicates that wheel-rail contact separation occurs; when vmax > 20 m/s and vt > 300 km/h, D > 0.8 suggests that the windward side of the vehicle approaches a critical safety state regarding wheel weight reduction. In contrast, P, Q, H, and Q/P remain significantly below their safety limit index values. Therefore, ΔP/P and D are selected as the derailment safety criteria for high-speed train vehicle operation under gust conditions.
3.2.5. Impact of wind angle on train operation safety
In section 3.2.2, the effects of clear gusts of wind on the derailment risk of the most critical wheelsets are examined. Section 3.2.3 identifies the maximum values of each safety limit index corresponding to the gust’s space-time state. Section 3.2.4 analyzes the characteristics of gusts under the operational safety criteria for high-speed trains, providing an in-depth investigation of how the wind angle affects train operation safety. When considering the “hat gust” with a maximum wind speed of Variation curve of vehicle operation safety limit index with wind angle: (a) ΔP/P; (b) D.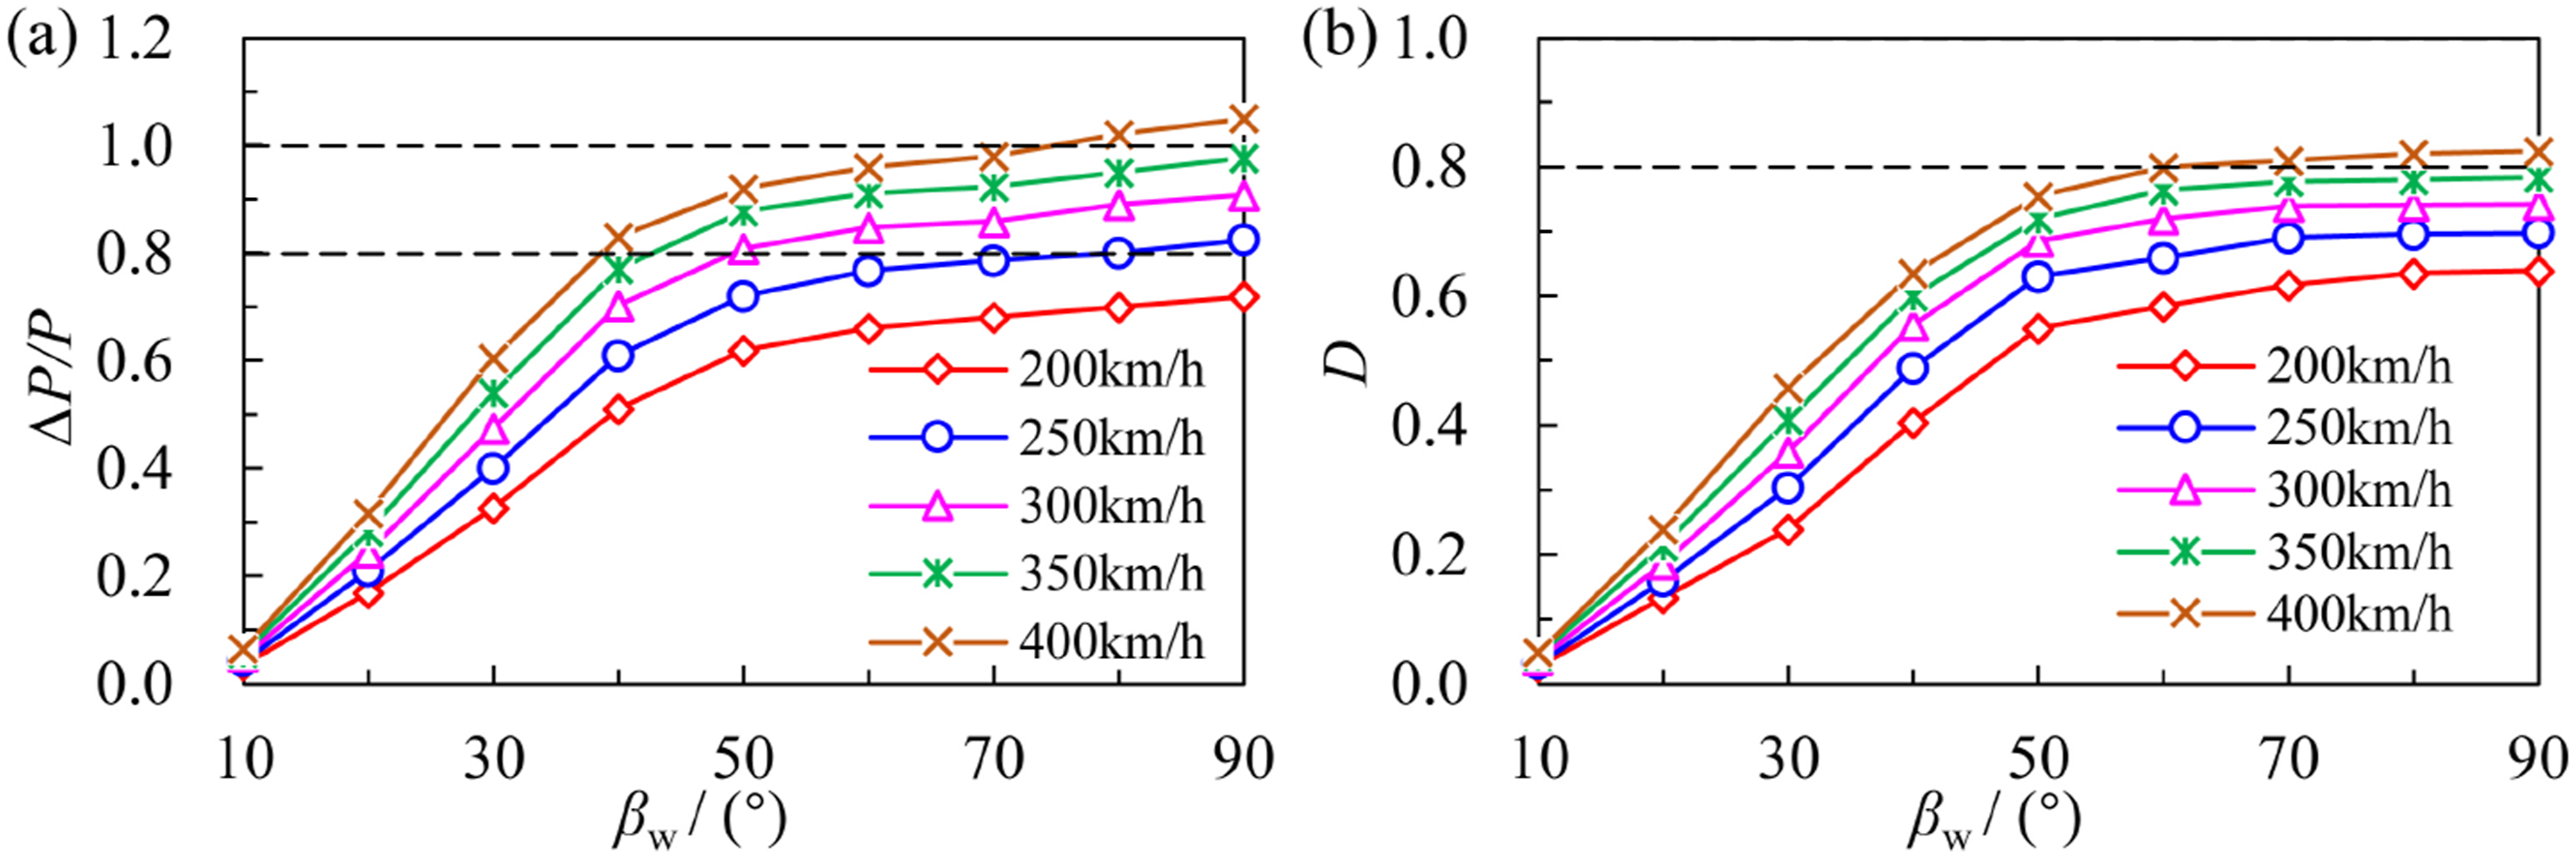
As shown in Figure 13, both ΔP/P and D exhibit an increasing trend as their values rise. In comparison to the vt > 300 km/h operation speed stage, the changes in the growth rates of ΔP/P and D are more pronounced in the vt < 300 km/h speed class range. In the range of 10° ∼ 90°, the influence of r on ΔP/P and D gradually increases although the growth rate declines. The maximum growth rate occurs at wind angles between 35° and 45°; when βw reaches the maximum in the range of 75°–90°, ΔP/P and D reach the maximum, which is a great threat to the safe operation of the vehicle and can easily lead to the derailment of the vehicle. It is important to note that the vehicle operation safety index is not symmetric about
4. Safe speed threshold for train operation under gust action
Sections 3.2.2∼3.2.5 analyze the impact of gusts on vehicle operational safety by examining dynamic response, derailment mechanisms, and influence laws. These sections elucidate the safety implications in gusty conditions; however, they do not provide quantitative guidance for actual vehicle operation. In this section, the safety criteria for train operation in gusts are established using the critical values of two derailment evaluation indices: ΔP/P and D. The analysis assesses whether the derailment index values exceed the thresholds under various combinations of vehicle speed and wind speed at βw = 90°. This evaluation determines the safety of vehicle operation and provides the critical values for safe operation, including permissible vehicle speeds and wind speeds.
Figure 14 presents the critical wind speed curves established by ΔP/P and D corresponding to the safety limits when the most unfavorable wind angle βw = 90° and vt varies in the range of 150 to 400 km/h. Specifically, ΔP/P = 1 defines the derailment critical curve, with the area above this curve representing the derailment zone. Conversely, ΔP/P = 0.8 defines the safety-critical curve, with the area below it indicating the safety zone, where normal vehicle operation is possible. The area between the derailment critical curve and the hazardous critical curve constitutes the warning zone, indicating a potential derailment risk. The critical curve for D = 0.8 is closely aligned with the derailment critical curve for ΔP/P = 1. The operational safety domain derived from this derailment evaluation criterion is relatively broad and should be considered alongside other derailment safety evaluation metrics. Vehicle derailment/safety domain for gust with βw = 90°.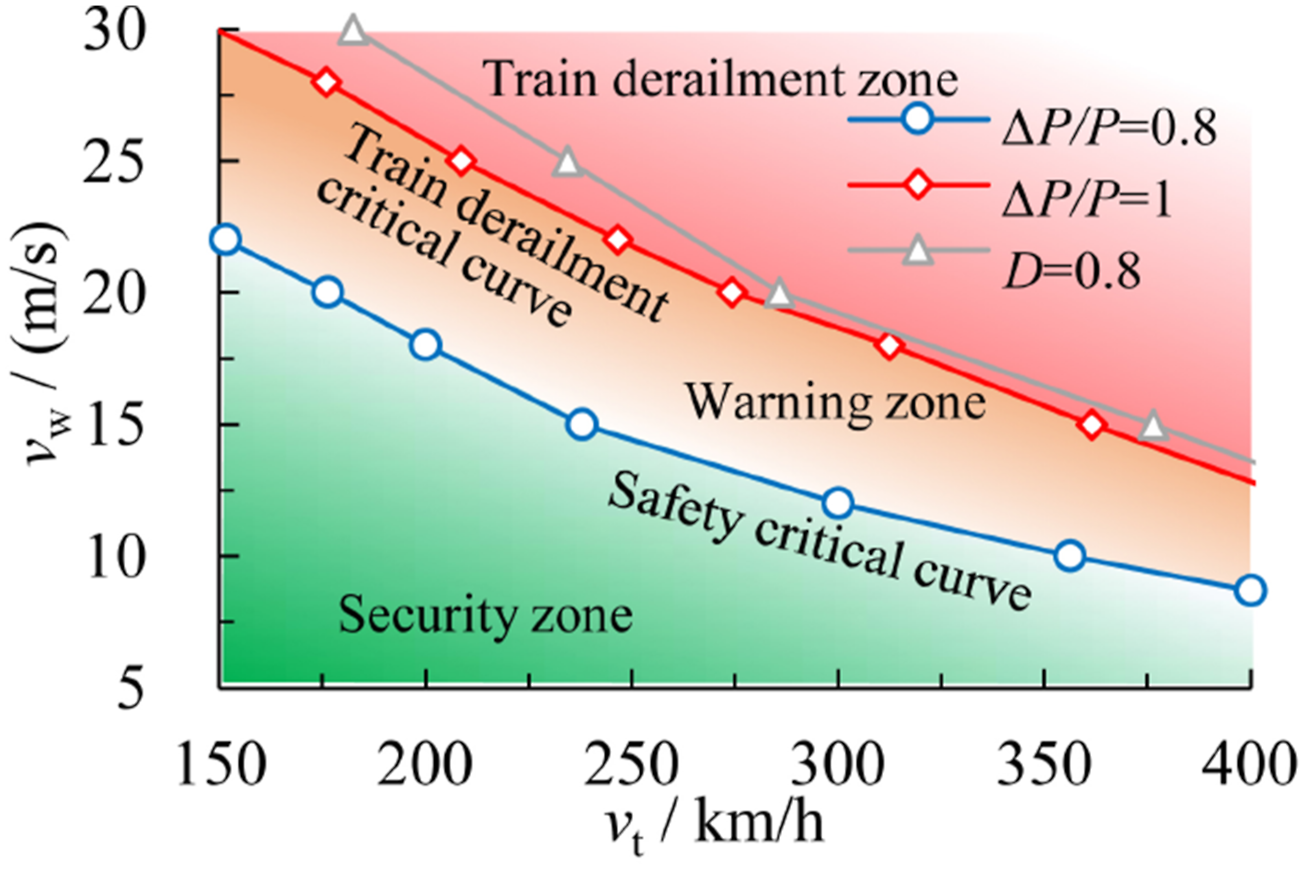
As shown in Figure 14, the lowest point of the safety-critical curve occurs at a wind speed of approximately 10 m/s, indicating that gusts do not significantly threaten the operational safety of high-speed trains. However, when the gust wind speed exceeds 30 m/s, the ratio ΔP/P surpasses the maximum limit, which can lead to vehicle overturning and derailment. In actual operations, through the monitoring of real-time wind speed, combined with the vehicle operation safety threshold determined by the above method, the speed of vehicle operation can be adjusted to ensure vehicle safety.
The gust safety domain depicted in Figure 14 only considers only vehicle speed and wind speed as the primary influencing factors. By incorporating the gust wind angle, we can define the derailment and safety regions of high-speed trains considering the joint effects of vehicle speed, wind speed, and wind angle, as shown in Figure 15. The analysis spans a vehicle speed range of 150 ∼ 400 km/h, the variation range of βw is 10° ∼ 90°, and vw is 0∼80 m/s. Examining the dynamic response of vehicle-rail coupling under strong gusts reveals the critical surfaces for safety and derailment, along with the safety, warning, and derailment regions for the vehicle. The derailment critical surface is established through vehicle dynamic derailment simulations, while the safety-critical surface is determined by the dynamic wheel weight reduction rate. If the values of vehicle speed, wind angle, and wind speed fall below the safety-critical surface, the gusts do not pose a threat to train operation safety. Conversely, if these values lie within the derailment region above the derailment critical surface, strong gusts may lead to derailment of high-speed vehicles. In addition, Figure 15 illustrates the influence patterns of these three critical factors on vehicle derailment safety. When the wind angle between 75° and 90°, the critical wind speed is minimized, indicating that at this angle, the wind has the most significant impact on vehicle operational safety. Furthermore, as vehicle speed increases, the critical wind speed decreases, suggesting that higher speeds elevate the risk associated with vehicle operation. Vehicle derailment/safety domains for gust.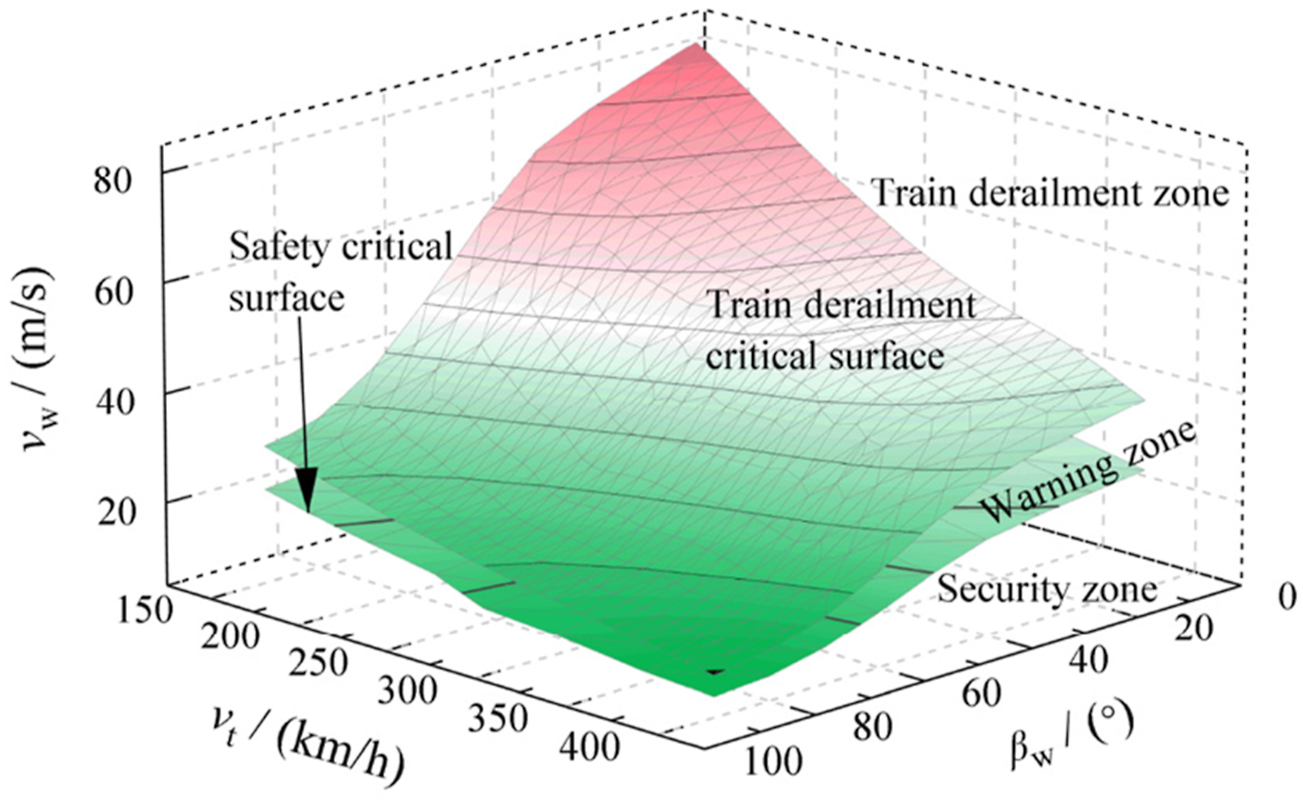
5. Conclusion
A dynamic derailment model for high-speed vehicle/rail coupling is established in a strong gust environment. Based on numerical calculations, this study analyzes the dynamic response, derailment mechanism, influencing factors, and derailment safety domain of high-speed vehicles operating on linear ballasted rail under the impact of strong gusts. The results indicate that strong gusts significantly threaten the operational safety of high-speed trains. Furthermore, vehicle speed, wind speed, and wind direction angle notably affect the derailment safety of high-speed trains in gust environment.
The vertical force exerted by the wheel and rail on the leeward side of the vehicle experiences an increase under gust loads, while a symmetrically varying load shedding phenomenon occurs on the windward side. This results in an intensified transverse force on the wheel axle, significantly increasing the wheel weight shedding rate and the overturning coefficient for both one-place and three-place wheelsets on the windward side. The safety evaluation indices for train derailment show a linear increase with rising gust wind speeds. The first instance of exceeding safety limit values for wheel-rail vertical force, wheel weight reduction rate, and overturning coefficient occurs when gust wind speed reaches its maximum. In contrast, the initial breach of safety limits for axle transverse force, wheel-rail transverse force, and the derailment coefficient corresponds to an exponential increase in gust wind speed. As wind speed increases, the wheel load shedding rate and overturning coefficient are the first to surpass operational safety limits, serving as criteria for assessing derailment safety in high-speed train operations under gust conditions. Both the wheel weight loss rate and the overturning coefficient show an upward trend with increasing wind angle, indicating a rising derailment risk. When the wind angle in the range of 75° ∼ 90°, the train derailment possibility is the largest.
The derailment critical and derailment-safe operation areas proposed in this paper, which consider multiple influencing factors and derailment safety criteria, provide quantitative guidance for the design of high-speed vehicles and the safety management of high-speed trains in gusty environments. The results of the study indicate that real-time monitoring of wind speed during train operation can enhance safety by allowing for a reduction in operating speed. Additionally, a statistical analysis of the perennial wind field conditions at the construction site can be conducted during the early stages of railroad development. This analysis can inform decisions to avoid routes with strong wind fields and aim to adjust the wind angle. Alternatively, the construction of windbreak walls can modify the wind field and mitigate wind speed.
Footnotes
Funding
The authors disclosed receipt of the following financial support for the research, authorship, and/or publication of this article: This work was supported by the National Natural Science Foundation of China (Grant number 72061022), China; Key R&D Program Project of Gansu Province (Grant number 23YFGA0040), China.
Declaration of conflicting interests
The authors declared no potential conflicts of interest with respect to the research, authorship, and/or publication of this article.