
Abstract
Trapezoidal sleepers exhibit better vibration reduction performance compared to ordinary track bed structures. However, the longitudinal vibration transmission law of these sleepers remains unclear, hindering the interpretation of abnormal phenomena and further structural optimization. This paper designs a full-scale model of a trapezoidal sleeper, applies impact loads using a hammer, and collects vibration responses at multiple points to analyze the longitudinal vibration attenuation law of the trapezoidal sleeper. Results show that during longitudinal vibration transmission, the vibration response duration of each structure gradually increases. For the peak and RMS values of vibration acceleration per unit distance, the response reduction amplitude of the track slab and ground is greater than that of the rail, and the corresponding reduction occurs earlier for both. The power spectral density of the trapezoidal sleeper gradually decreases from the center of the slab to the ends, with vibration amplification occurring at the 1/4 position and the ends. Strengthening the end constraints and optimizing the spacing of the vibration damping pads are necessary to achieve uniform vibration attenuation.
Keywords
1. Introduction
Because urban rail transit trains may pass through sensitive building clusters such as hospitals and residential areas, vibration and noise pollution problems can occur (Luo et al., 2021). To address this issue, various track vibration reduction measures have been adopted in urban rail transit, including rail vibration reduction, fastener vibration reduction, and sleeper and ballast bed vibration reduction (Han et al., 2025a, 2025b; Shi et al., 2024; Zhu et al., 2025). Among these, trapezoidal sleepers have excellent vibration reduction performance and are widely used, but they also have some problems in use, such as local vibration amplification affecting passenger comfort. Existing research mainly focuses on the vertical vibration characteristics of trapezoidal sleeper tracks. For example, Ge and Wang (2017) and Liu et al. (2020) conducted field measurements on the vibration reduction characteristics of trapezoidal sleepers under operating conditions of 120 km/h and 80 km/h, respectively. The measuring points were all arranged on the same cross section to analyze the vibration attenuation law from the rail to the tunnel wall. Zeng et al. (2021) used the finite element software ANSYS to simulate the impact of a falling axle from a height of 0.01–0.05 m on a conventional track bed, medium-damping fasteners, trapezoidal sleepers, and steel spring floating slabs. By analyzing the vertical vibration response and dynamic stress transfer rate, they concluded that trapezoidal sleepers amplify the vibration response transmitted from the rail to the track bed slab, but effectively reduce the vibration transmitted from the track bed slab to the tunnel wall, thereby achieving a vibration reduction effect. Due to the fact that the vibration data for the vertical vibration transmission study were collected from the same cross section, while the trapezoidal sleeper structure is not completely uniform along the longitudinal direction but exhibits periodic characteristics, it is difficult to explain the phenomenon of local vibration amplification only from the vertical perspective. Therefore, it is necessary to investigate the longitudinal vibration transmission characteristics of the trapezoidal sleeper track. Furthermore, based on existing research on the structural parameters of trapezoidal sleepers (He et al., 2022; Jiang et al., 2021; Li et al., 2022; Li and Yang, 2011), the structure has been optimized, and further experimental research can be carried out.
This paper conducted full-scale experiment, applying impact loads with a hammer. Based on the symmetry and reciprocity of the trapezoidal sleeper, multiple vibration points were picked up along the longitudinal direction of the track structure. The longitudinal transmission law of the trapezoidal sleeper vibration was then analyzed; reasonably explaining the local and end vibration amplification phenomenon of trapezoidal sleepers in engineering practice, and corresponding solutions were proposed.
2. Experimental model and scheme
The full-scale test model of trapezoidal sleeper mainly includes three parts: rail (60 kg/m), spring clip type II fastener system (Wang and Cheng, 2017), and trapezoidal sleeper. The trapezoidal sleeper measures 5900 mm × 2300 mm, with a single-sided longitudinal beam width of 580 mm and a thickness of 185 mm. The rail length is slightly longer than the trapezoidal sleeper, at 7000 mm. The bottom of the trapezoidal sleeper is equipped with vibration damping pads, 25 mm thick and 200 mm wide, arranged at equal intervals of 1200 mm, as shown in Figure 1. Schematic diagram of the spacing of vibration damping pads for trapezoidal sleeper.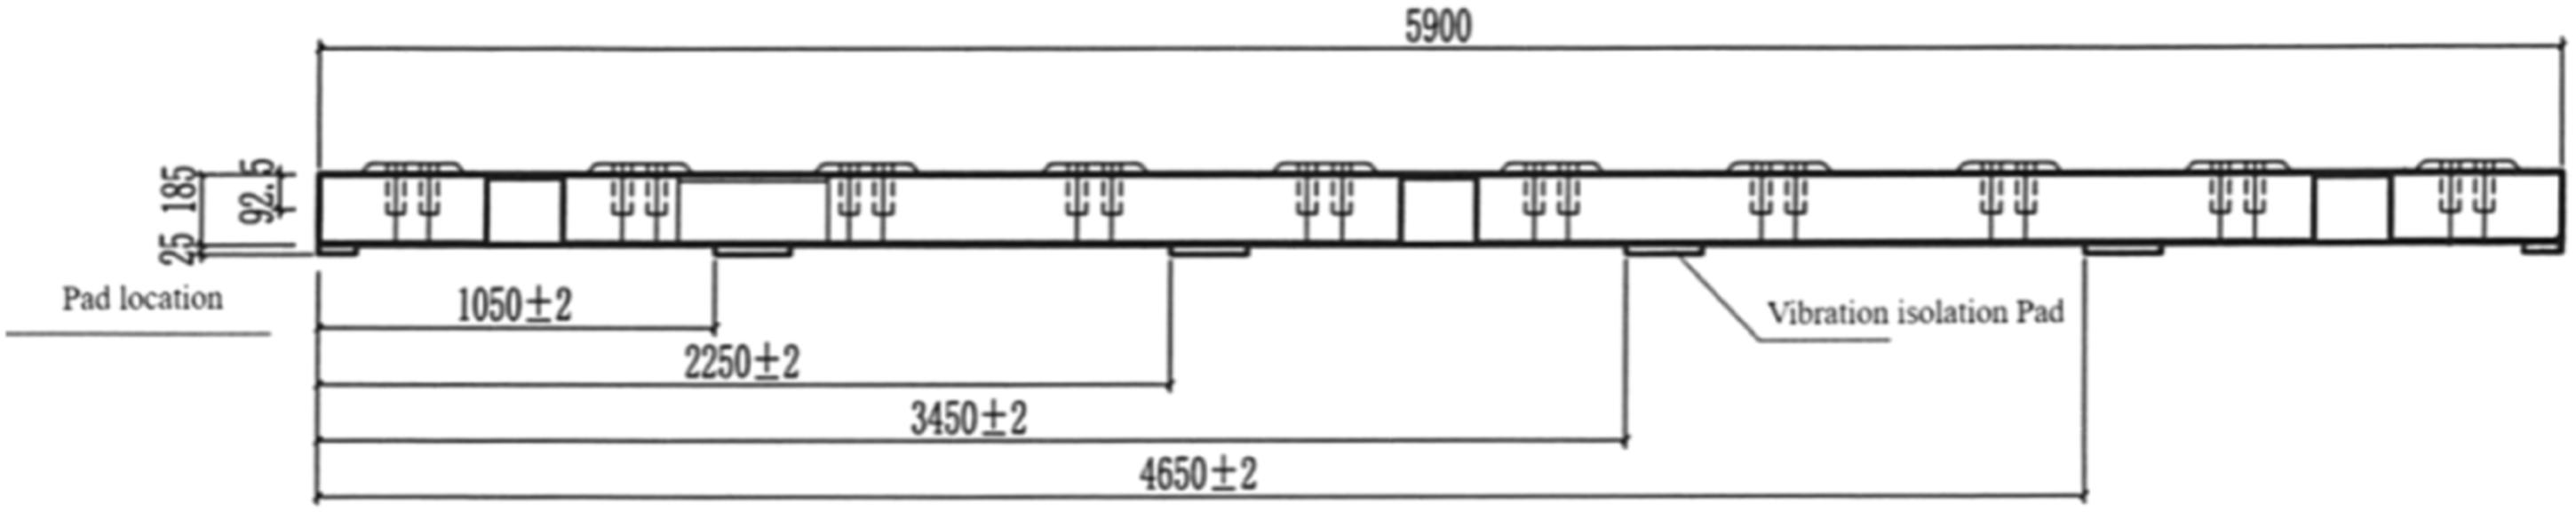
In the actual operation of subway trains, the wheel–rail force generated by wheel–rail contact is the root cause of the vibration of the sub-rail foundation. A hammer is used to strike the rails, inputting an impact load into the track system (Jones et al., 2006). The vibration of the trapezoidal sleeper system exhibits symmetry, periodicity, and reciprocity. Therefore, a quarter section of the entire trapezoidal sleeper can be selected as the research object to explore the longitudinal transmission law of vibration in the trapezoidal sleeper. A total of 18 accelerometers are arranged on the trapezoidal sleeper track, as shown in Figure 2. Among them, the rail vibration acceleration sensors are arranged perpendicular to the rail bottom and are numbered 1, 4, 7, 10, 13, and 16, respectively. The vibration acceleration sensors of the trapezoidal sleeper longitudinal beam are arranged perpendicular to the edge of the longitudinal beam, and are numbered 2, 5, 8, 11, 14, and 17, respectively. The ground vibration acceleration sensors are arranged perpendicular to the ground and 20 cm away from the side of the trapezoidal sleepers. Their numbers are 3, 6, 9, 12, 15, and 18, respectively. The constraints considered in this study mainly originate from the boundary connection conditions of the track structure under actual service conditions, including the connections and support conditions among the rail and fasteners, trapezoidal sleeper and track slab, as well as the track structure and foundation. Test plan layout: (a) Schematic diagram of the layout of track acceleration sensors for trapezoidal sleeper, (b) Test site diagram.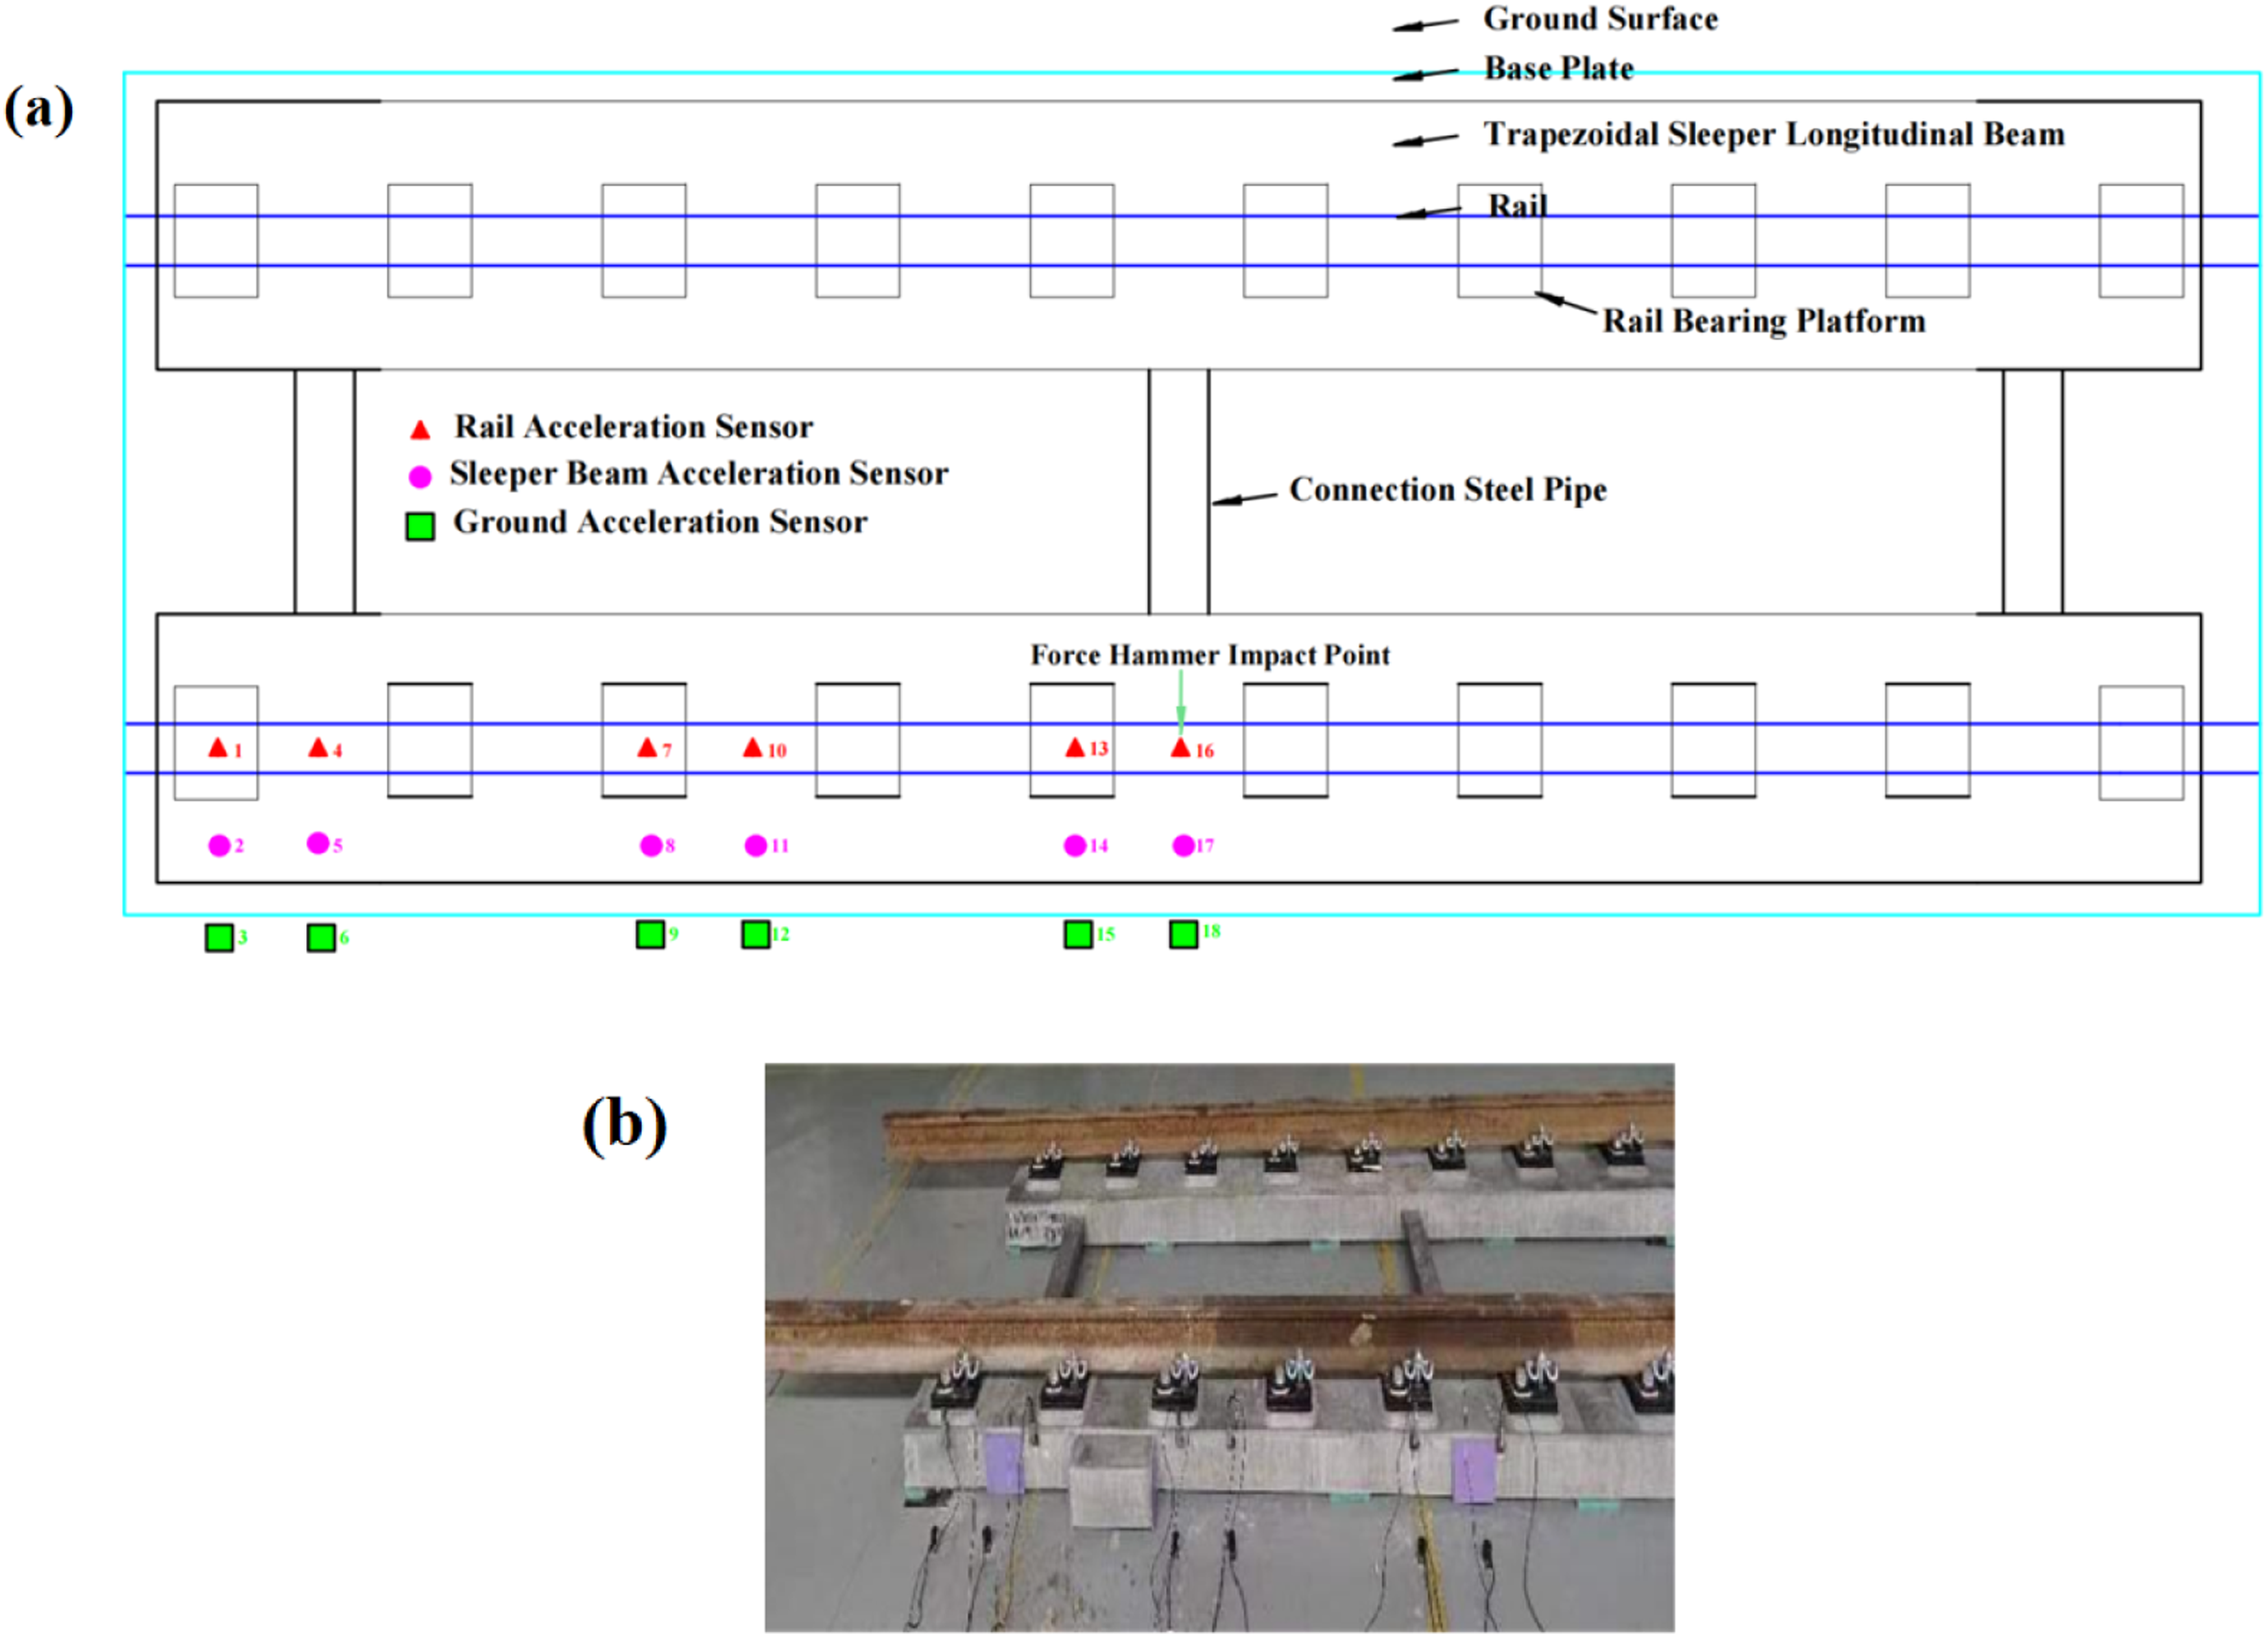
The force hammer used in the test is the INV9314 test force rod of the Oriental Institute with a range of 100 kN. It is an IEPE (ICP) output force rod suitable for the excitation of large- and medium-sized structures. The force hammer integrates the force sensor and the hammer head. The hammer head is divided into three types: rubber, nylon, and aluminum. Due to the large mass of the trapezoidal sleeper, an aluminum hammer head is used for excitation. The excitation energy of the hammer signal is relatively stable below 1100 Hz and gradually decreases above 1100 Hz, although some high-frequency components remain. The test data is collected using the DH5981 acquisition instrument system to collect the force signal and vibration acceleration response signal of each track structure. Regarding the range of the acceleration sensor, the rail uses an acceleration sensor with a range of 500 g and a sensitivity of 9.37468∼10.4958 Mv/g. The acceleration sensor used in the trapezoidal sleeper longitudinal beam and track plate has a range of 25∼50 g and a sensitivity of 193∼217 Mv/g. The acceleration sensor used on the ground has a range of 0.5 g and a sensitivity of 9761∼10285 Mv/g. Before each excitation, five pre-hammering and balance clearing operations were performed to eliminate the influence of vibration residual waves and ensure the validity and reliability of the data.
3. Test evaluation index
3.1. Time domain evaluation index
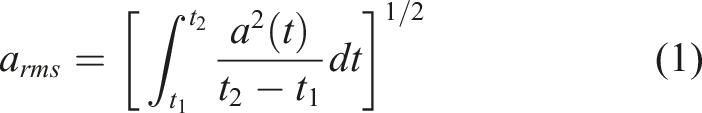
In the time domain, the analysis indicators of vibration acceleration include acceleration peak value, effective value, and vibration response duration (Zhang et al., 2024). Peak value is the most intuitive indicator of the amplitude of physical quantities of vibration. Effective value (root-mean-square value, RMS) is an indicator for evaluating the average vibration energy over a period of time. By calculating equation (1), the effective value of vibration acceleration in the time period t1∼t2 can be obtained
The vibration response duration mainly refers to the time from the peak response to the stable decay stage. It is a temporal parameter used to characterize the response decay process of each track structure.
3.2. Frequency domain evaluation index
In the frequency domain, the vibration acceleration time domain signals of the longitudinal rails, track plates, and ground positions of the trapezoidal sleepers are converted to the corresponding frequencies, and then the law of the longitudinal transmission of the vibration of the trapezoidal sleepers in the frequency range is analyzed. The evaluation indicators of vibration acceleration in the frequency domain are mainly power spectrum density (PSD), acceleration frequency transform (FFT) and Z vibration level (VLz) attenuation.
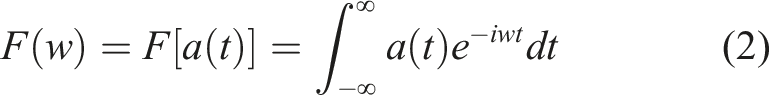
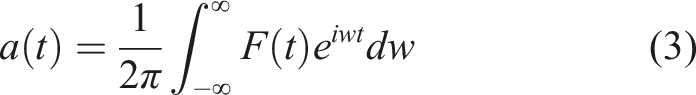
In the subway vibration problem, the vibration analysis of the low frequency band is very important. The one-third octave band is based on the octave band, and the frequency band is further refined. Two frequencies are inserted between the two upper and lower limit frequencies that are one octave apart, so that the ratio of the four frequencies becomes 1:21/3:22/3:2 (Huang et al., 2023; Wang and Hui, 2019). The original time domain signal of the vibration acceleration is subjected to the corresponding forward Fourier transform through equation (2) to obtain the frequency domain function of the vibration quantity at the corresponding frequency. Then, according to the center frequency value specified in the subway vibration, the corresponding vibration data is subjected to the inverse Fourier operation through equation (3) at the corresponding center frequency to obtain the effective value in the corresponding center frequency range. The calculation of the 1/3 octave band can reflect the average vibration energy of each track structure in the corresponding center frequency range
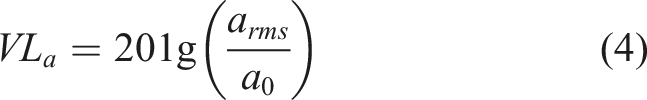
The vibration level of acceleration can be calculated by equation (4)
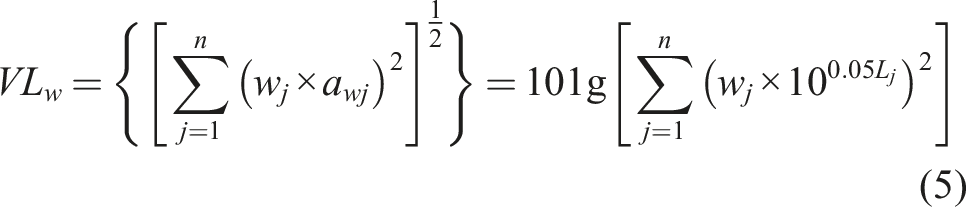
In the vibration analysis process, the environment, human comfort and other indicators must be fully considered, and the acceleration level should be processed according to the weighting factor at the corresponding center frequency specified in the standard (International Organization for Standardization, 1997). The weighted acceleration level can be obtained by calculating equation (5)
Power spectral density (PSD) describes the distribution law of vibration energy spectrum corresponding to different frequencies within the frequency analysis range. Through the analysis of power spectral density, the distribution law of vibration energy spectral density at different positions of each part of the track structure can be obtained. There are many methods to estimate power spectral density. This paper uses the classic periodogram method to estimate the power spectral density of track structure vibration.
The measured acceleration time domain data is composed of a series of discrete data points, which are subjected to the corresponding Fourier transform and calculated as shown in equation (6)
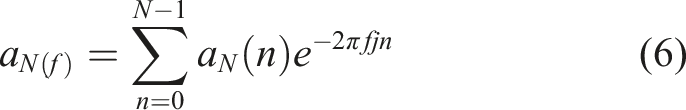
Then the corresponding discrete acceleration frequency domain data are squared and averaged to obtain the corresponding power spectrum. The calculation process is shown in equation (7)
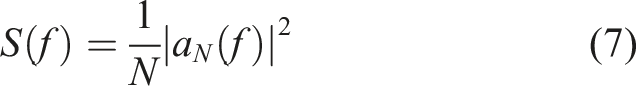
By dividing the calculated power spectrum function by the acquisition frequency of the acceleration data, the PSD of the vibration acceleration can be obtained. The calculation process is shown in equation (8)
4. The longitudinal vibration attenuation law of trapezoidal sleeper track
4.1. Time domain analysis
4.1.1. Vibration decay time analysis
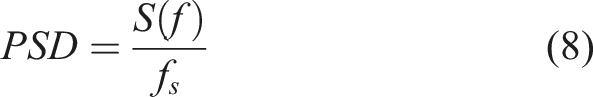
The vibration acceleration attenuation time history curves of rails, track plates, and ground at different longitudinal positions of the trapezoidal sleeper are shown in Figures 3–5. Time history of acceleration of rail. Time history of acceleration of track plate. Time history of acceleration of ground.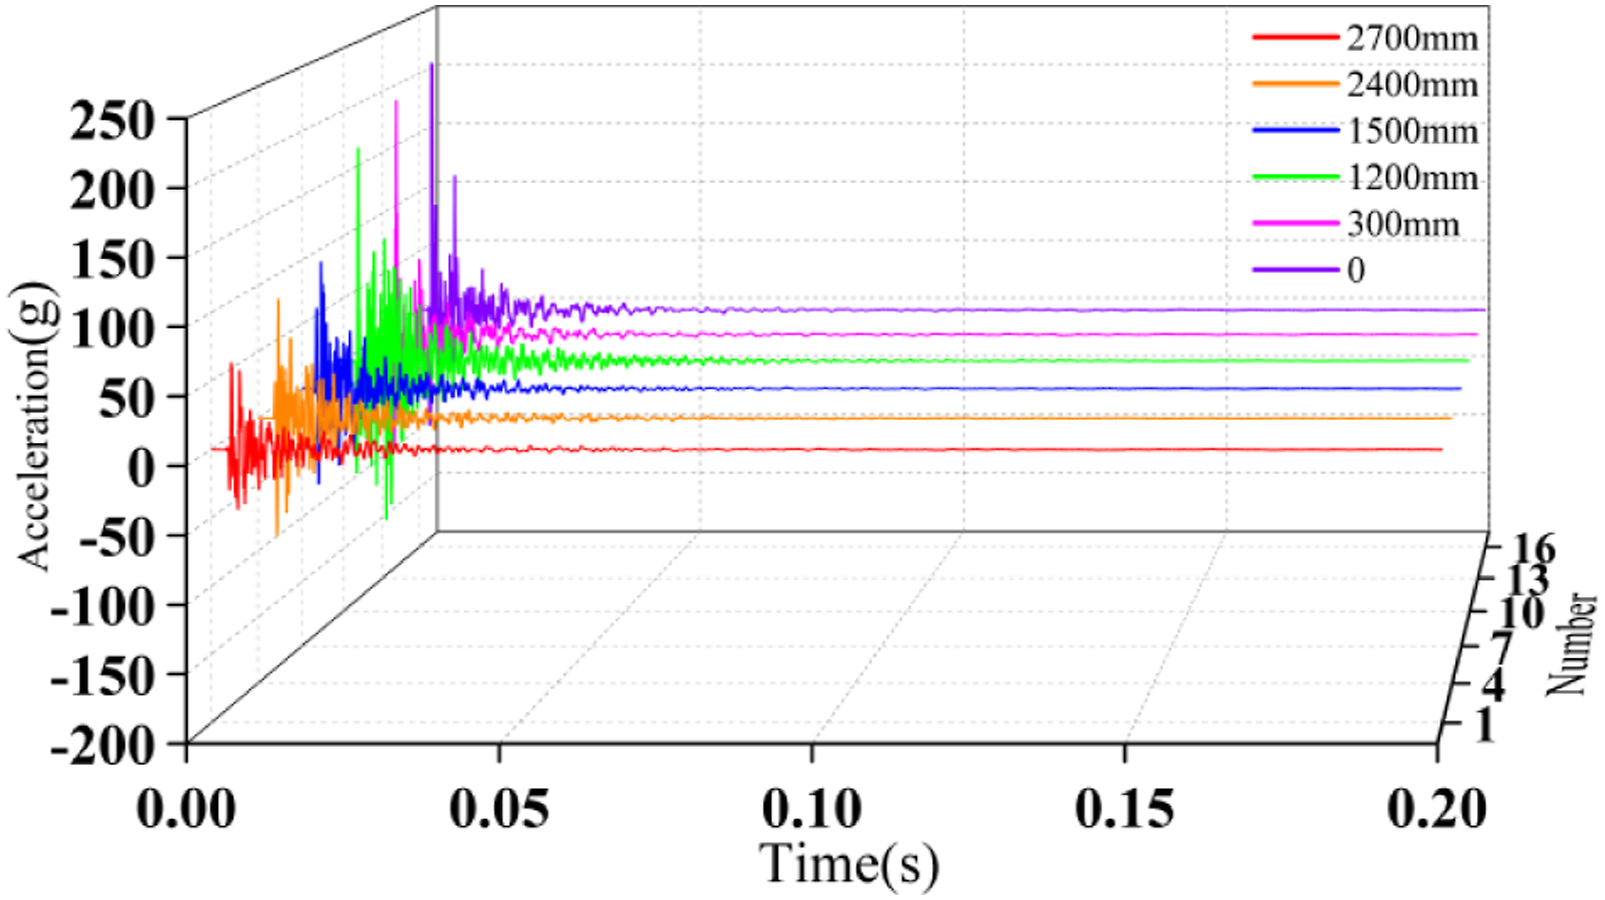
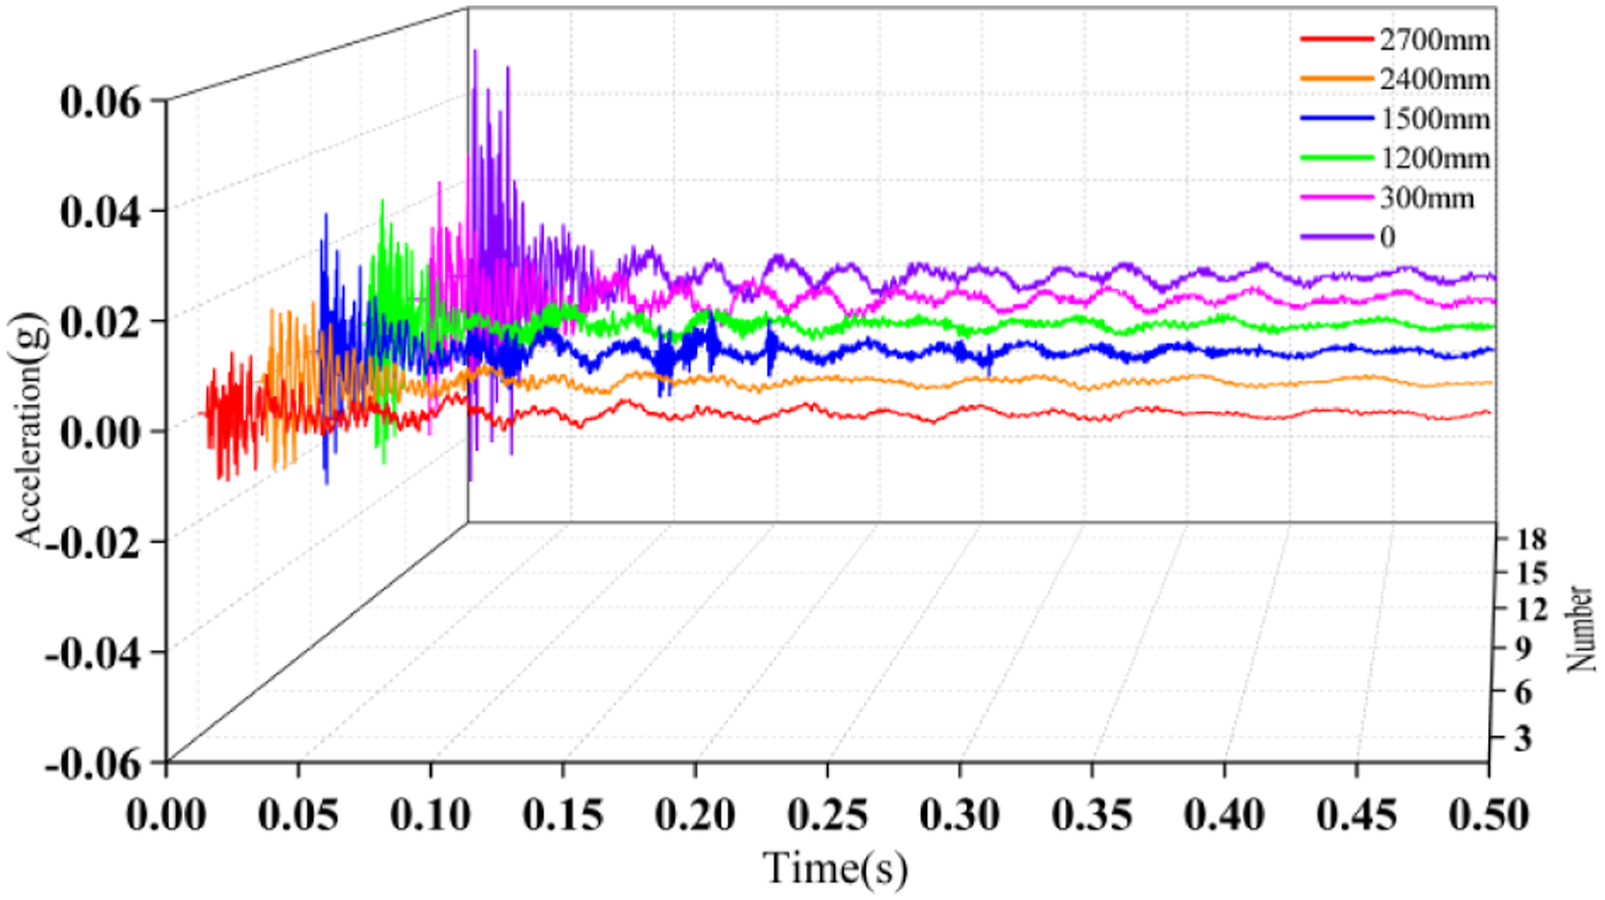
The distances 0, 300, 1200, 1500, 2400, and 2700 mm in Figure 3 represent the distances between the corresponding acceleration sensors of the rail, track slab, and ground and the impact point of the hammer, respectively. As shown in Figure 3, with increasing propagation distance, the peak acceleration response of the rail decreases significantly, showing a steep decrease trend. The response duration is relatively short, and the major vibration response is completed within approximately 0.05 s. The peak response decreases from 209.01 g at 0 mm to 63.54 g at 2700 mm, corresponding to an average peak variation gradient of 0.05 g/mm. As shown in Figure 4, the peak response variation of the track slab is smaller than that of the rail, and the response duration is approximately 0.15 s. The average peak variation gradient from acceleration sensor No. 17 to No. 2 on the track slab is approximately 6E−03 g/mm. As shown in Figure 5, the ground response exhibits the longest response duration, approximately 0.3 s, together with the smallest peak variation gradient, approximately 2E−05 g/mm. The peak variation gradients of the rail, track slab, and ground progressively decrease in magnitude, with the ground being approximately three orders of magnitude lower than the rail. It should be noted that the peak variation gradient discussed here represents the absolute variation of response peaks per unit distance rather than the intrinsic damping capability of the material itself. The smaller peak variation gradient and longer response duration observed in the ground are mainly related to differences in initial response amplitudes, frequency composition, and wave propagation characteristics among different media.
4.1.2. Vibration effective value and peak value analysis
The effective value and peak value results of the rails, track plates, and ground of the trapezoidal sleeper are shown in Figures 6–8. Peak value and effective value of longitudinal vibration of rail. Peak value and effective value of longitudinal vibration of track plate. Peak value and effective value of longitudinal vibration of ground.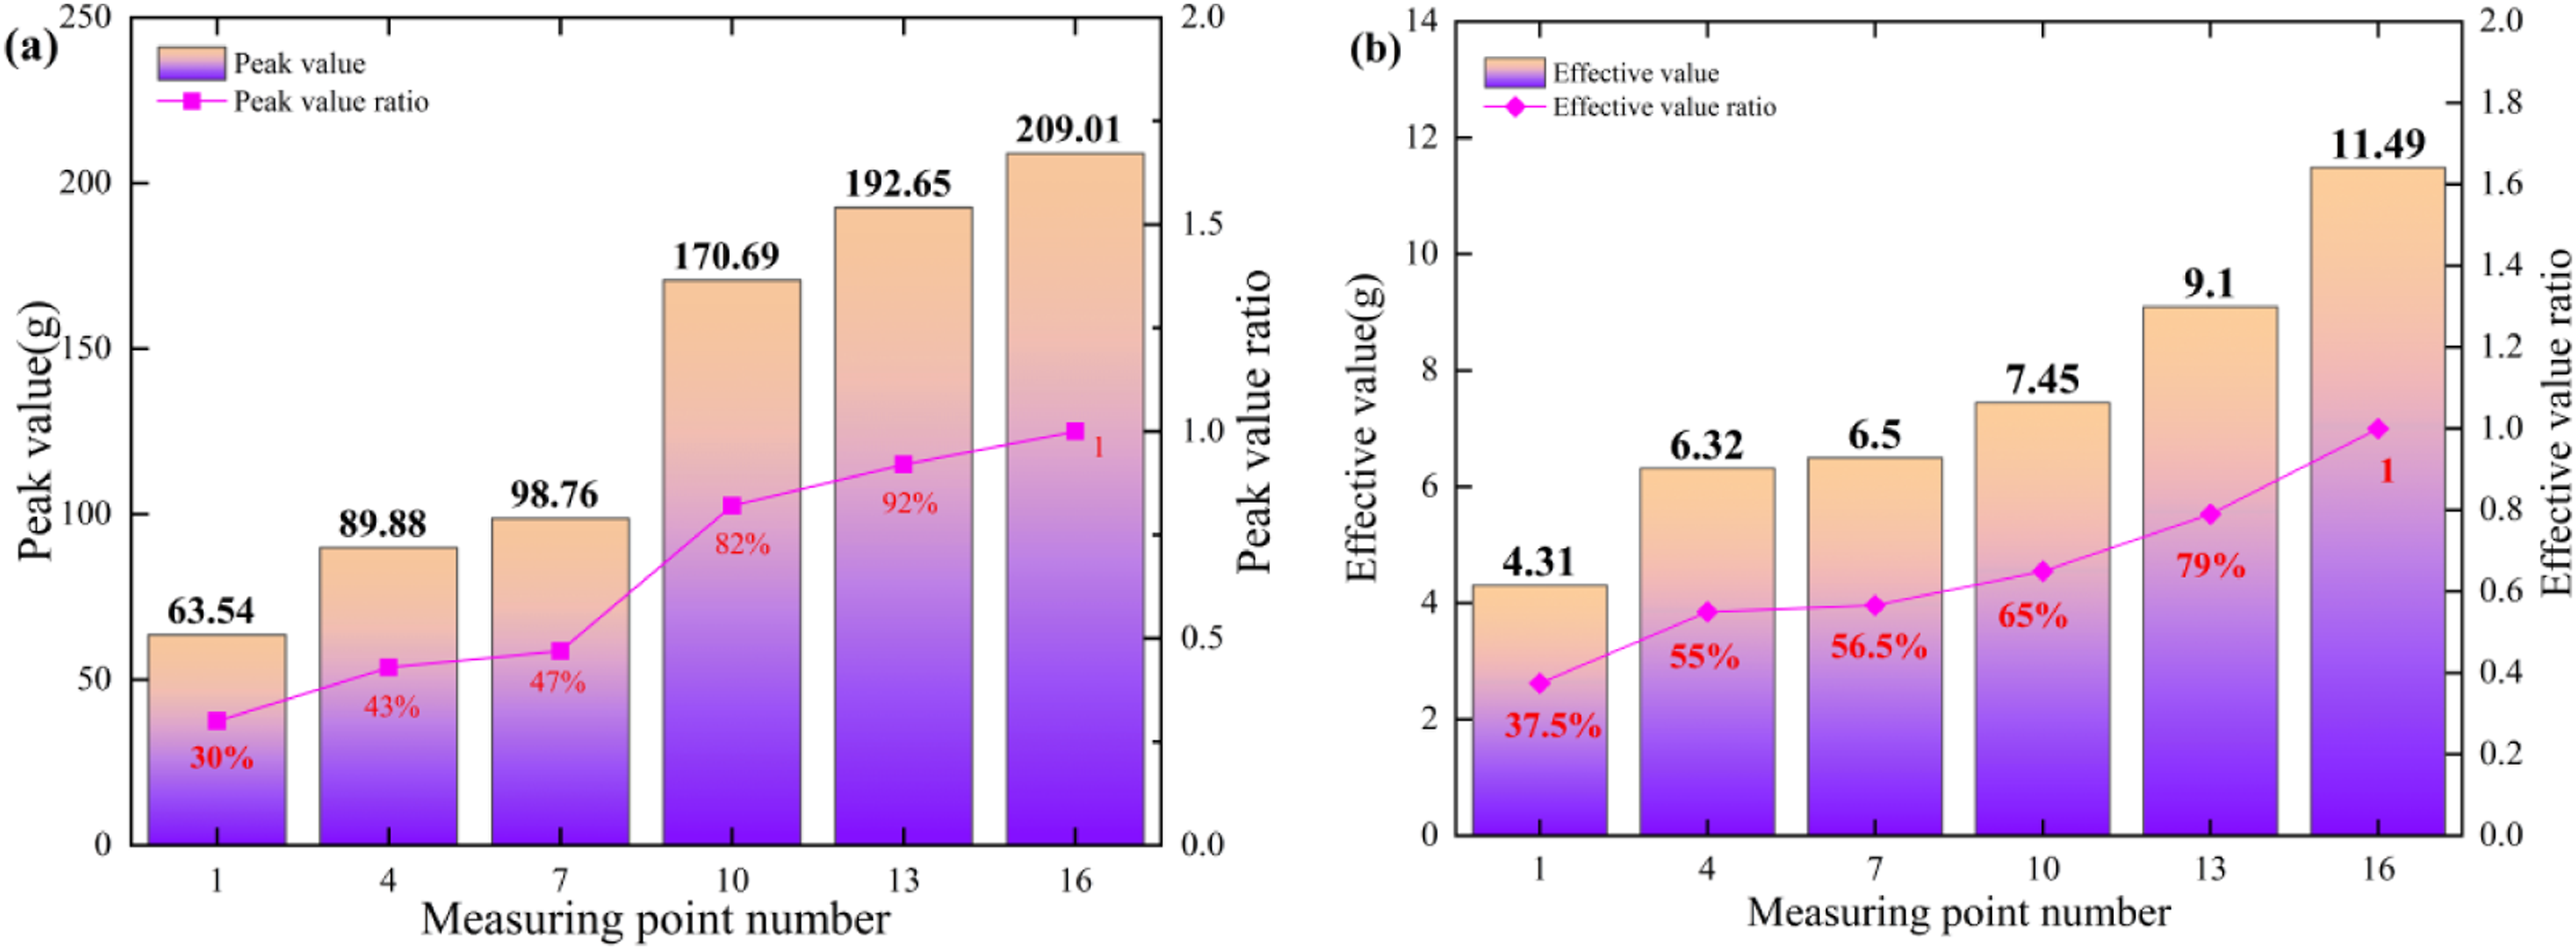
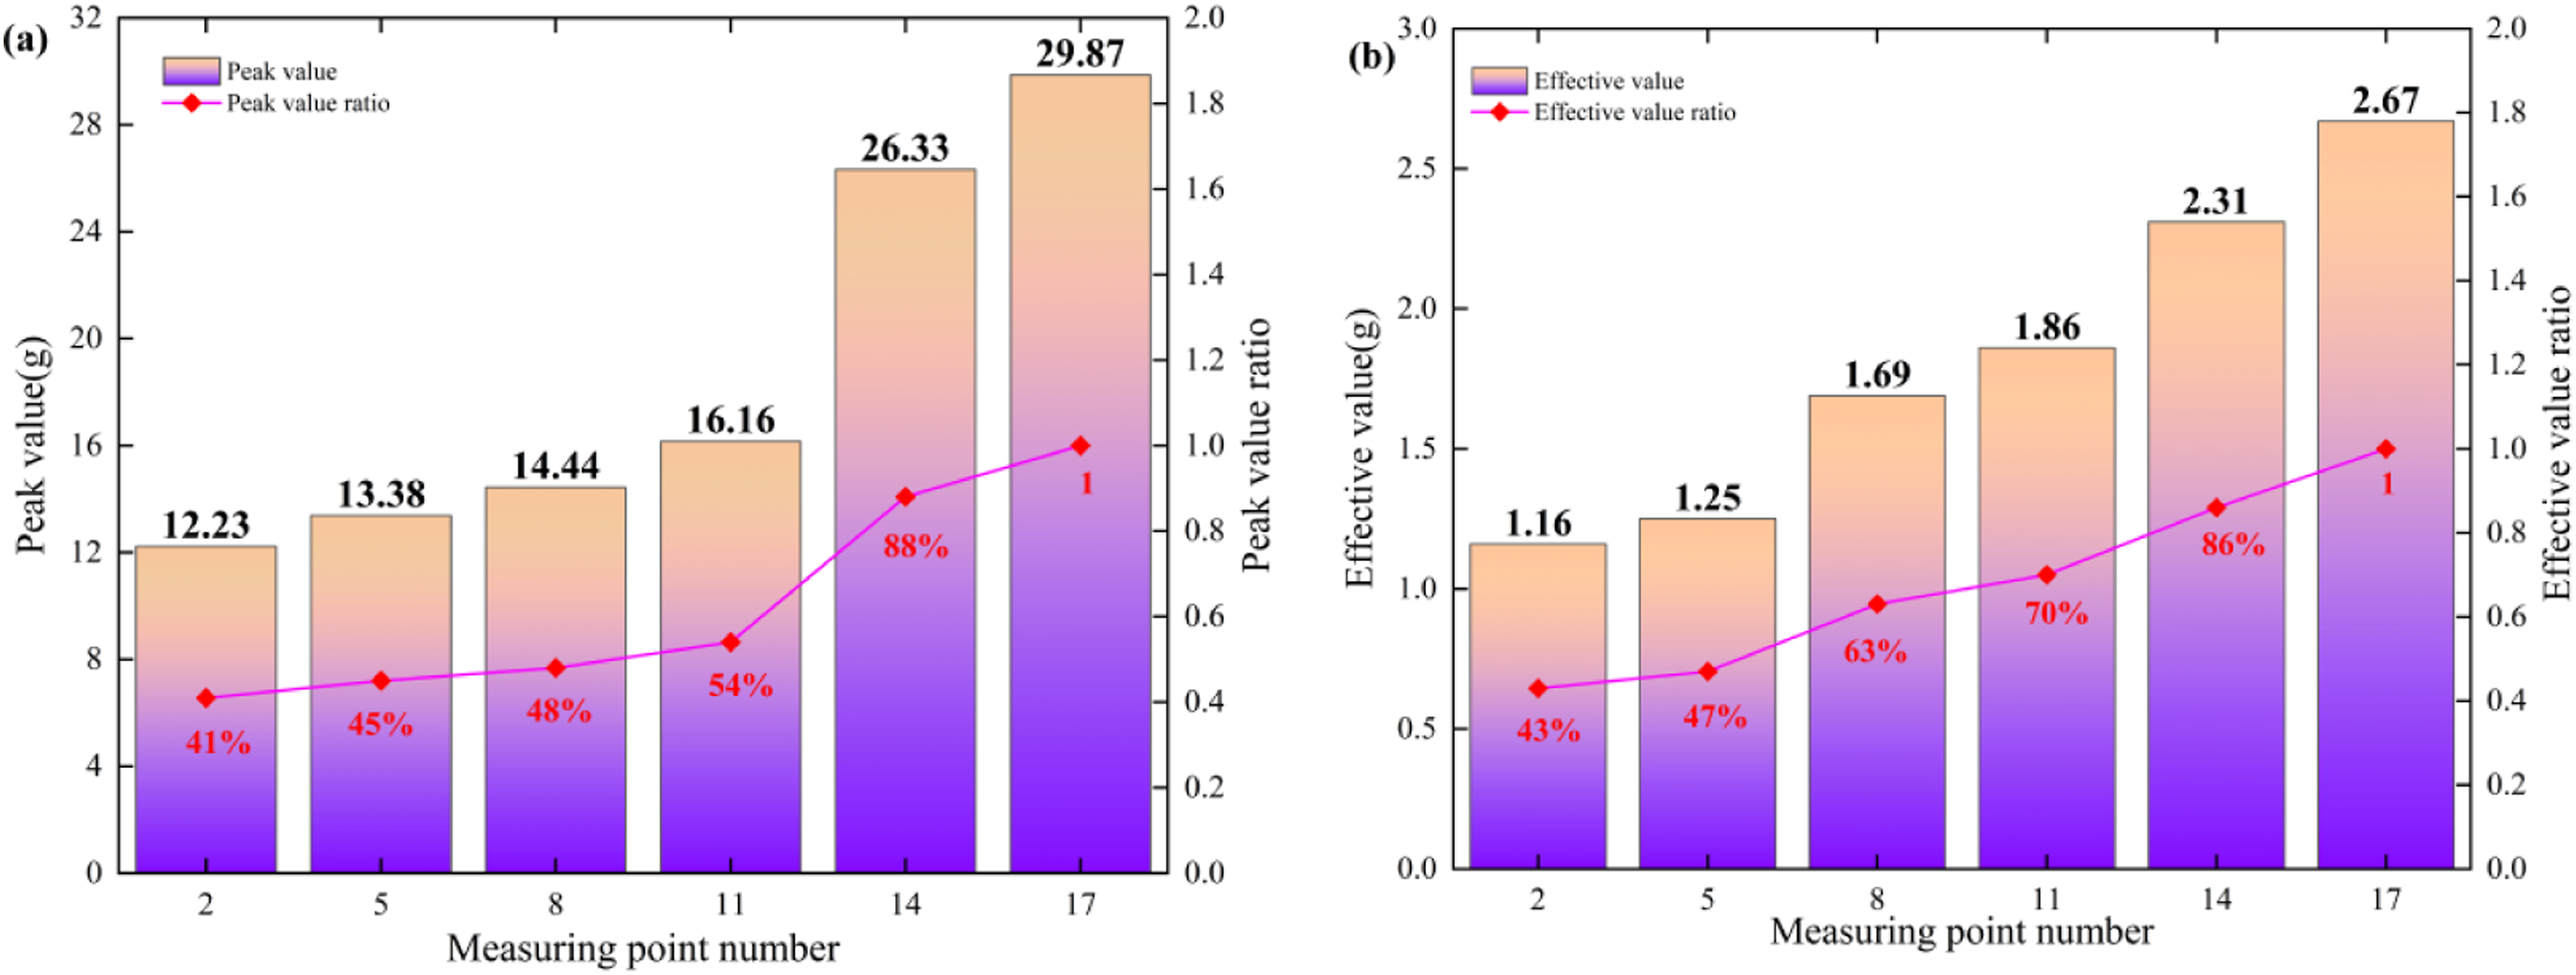
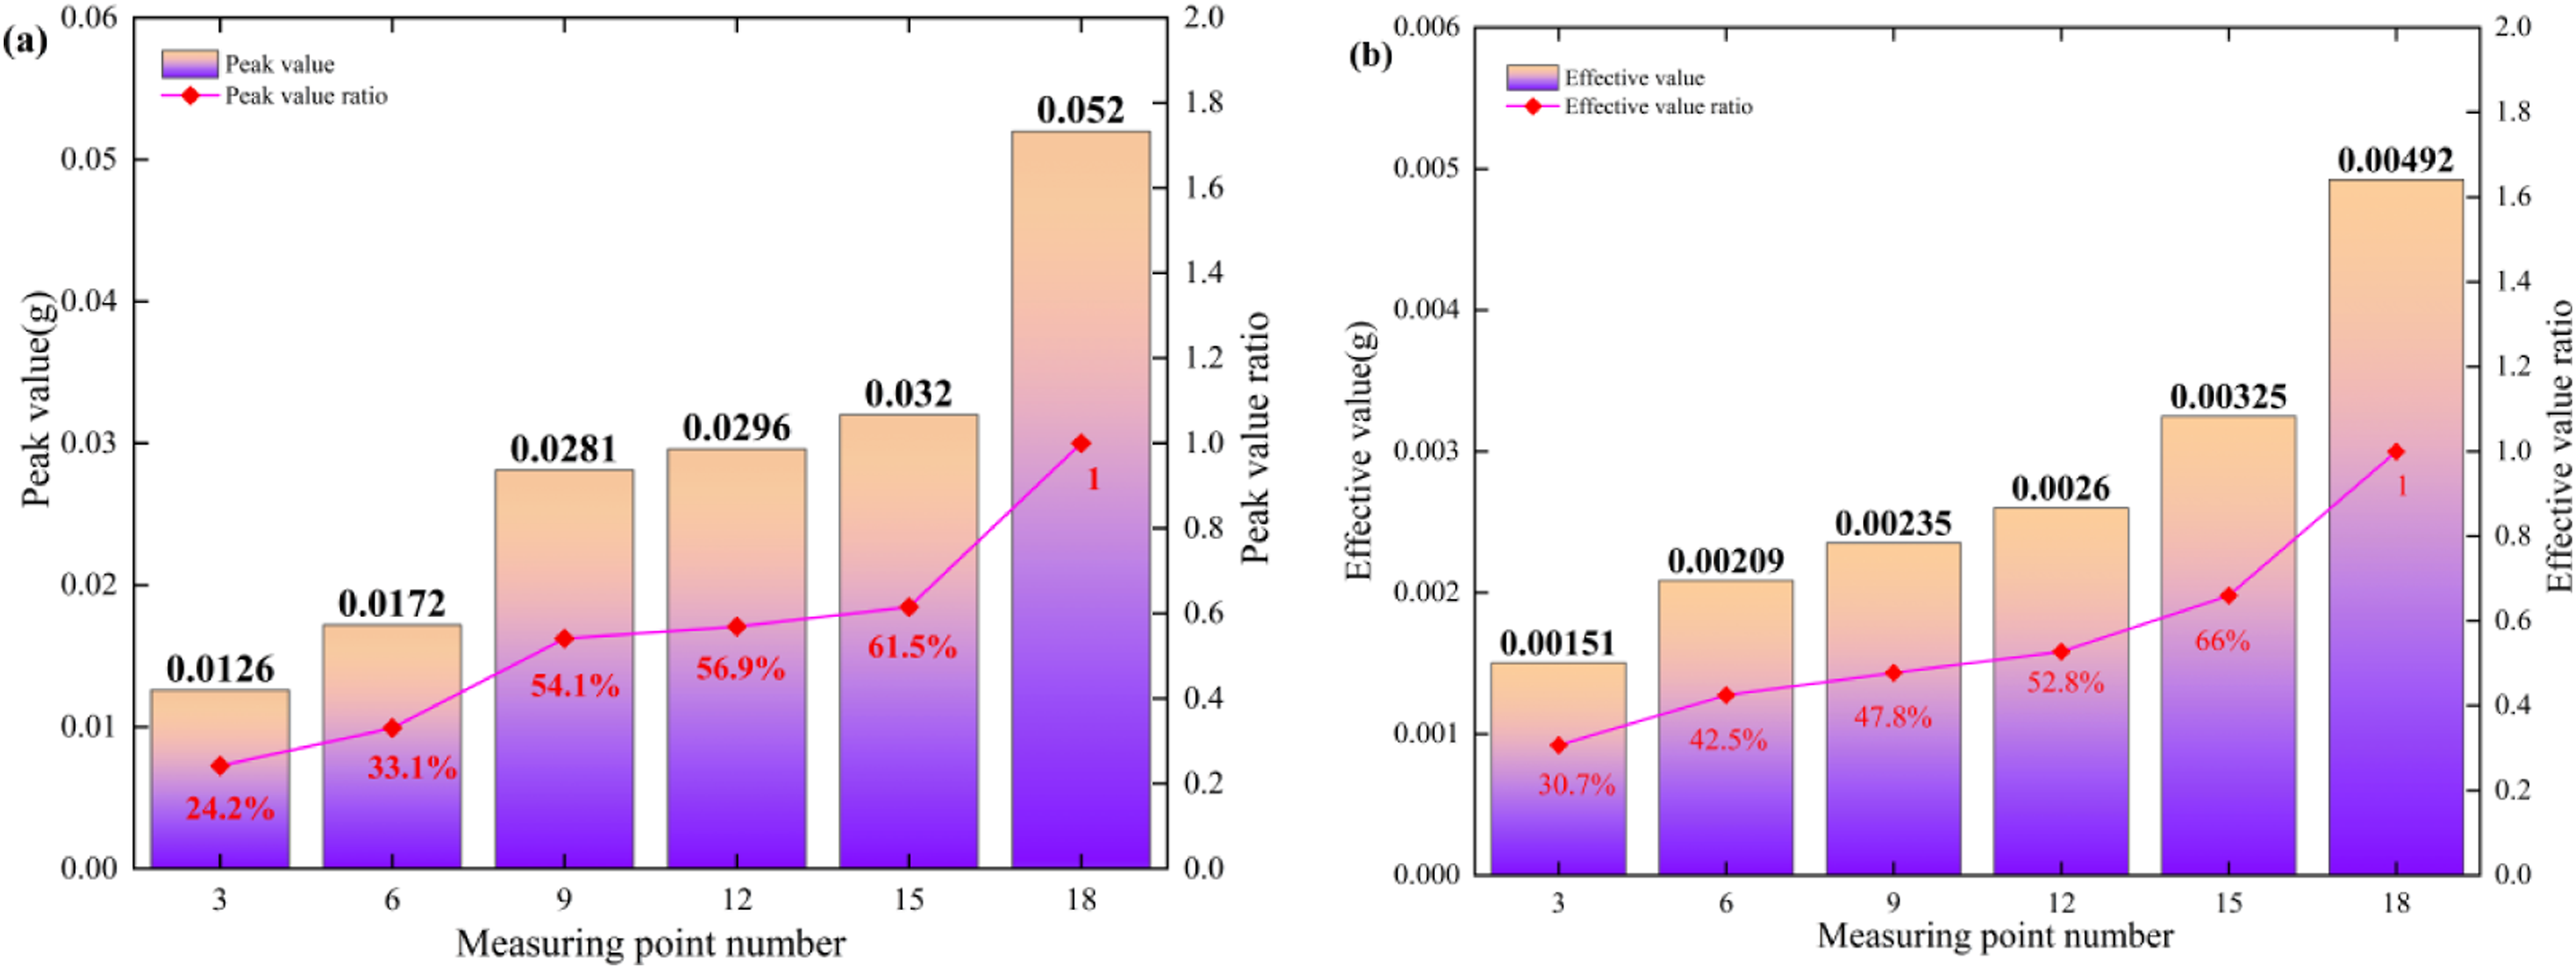
The peak value and RMS value ratios in Figures 6–8 are defined as the ratios of the corresponding peak values and RMS values at each measuring point to those at the hammering point. As the distance between each measuring point and the hammering point increases, the peak values and RMS values of the vibration acceleration responses of different track structures gradually decrease and exhibit different variation characteristics. As shown in Figure 6, the peak value and RMS value of the rail vibration acceleration exhibit the largest response reduction when transmitted to the third fastener position (1500 mm). Compared with the vibration response at the hammering point, the peak value decreases by 53%, while the RMS value decreases by 43.5%. This is because the rail, as a metallic structure, possesses strong vibration transmission capability, resulting in relatively stable longitudinal propagation characteristics. As shown in Figure 7, the peak value and RMS value of the track slab vibration response exhibit the largest reduction at the 2.5th fastener position (1200 mm), where the peak value decreases by 46% and the RMS value decreases by 30%. Compared with the rail response, the vibration response duration of the track slab is longer. This is because the track slab is made of concrete material, and its vibration response is influenced by the fastener system, rail vibration, and structural coupling effects, resulting in more significant response reduction characteristics. Therefore, the reduction of the track slab vibration response is greater than that of the rail, and the corresponding reduction occurs 300 mm earlier. As shown in Figure 8, the ground vibration response exhibits the largest reduction in peak value and RMS value. When the vibration propagates to the first fastener position (300 mm), the peak value and RMS value decrease by 38.5% and 34%, respectively. This indicates that although the ground response duration is relatively long, the response reduction is significant. This is because vibration transmission from the rail to the ground requires a certain propagation process, resulting in the longest ground response duration. Meanwhile, the vibration responses are continuously reduced by the rail, fastener system, track slab, and vibration damping pad, causing the peak value and RMS value of the ground response to decrease significantly at the first fastener position.
4.2. Frequency domain analysis
4.2.1. Frequency transform (FFT) analysis
The corresponding Fourier transform (FFT) is performed on the time domain signals of the rails, track plates, and ground vibration acceleration at different longitudinal positions of the trapezoidal sleeper. The frequency domain transmission mechanism of the vibration of the trapezoidal sleeper at different longitudinal positions is analyzed, and the vibration acceleration frequency domain curves at different distances are obtained, as shown in Figures 9–11. The different frequency ranges are adopted to more clearly present the dominant response characteristics of each structure. Frequency domain curves of vibration acceleration of rail. Frequency domain curves of vibration acceleration of track plate. Frequency domain curves of vibration acceleration of ground.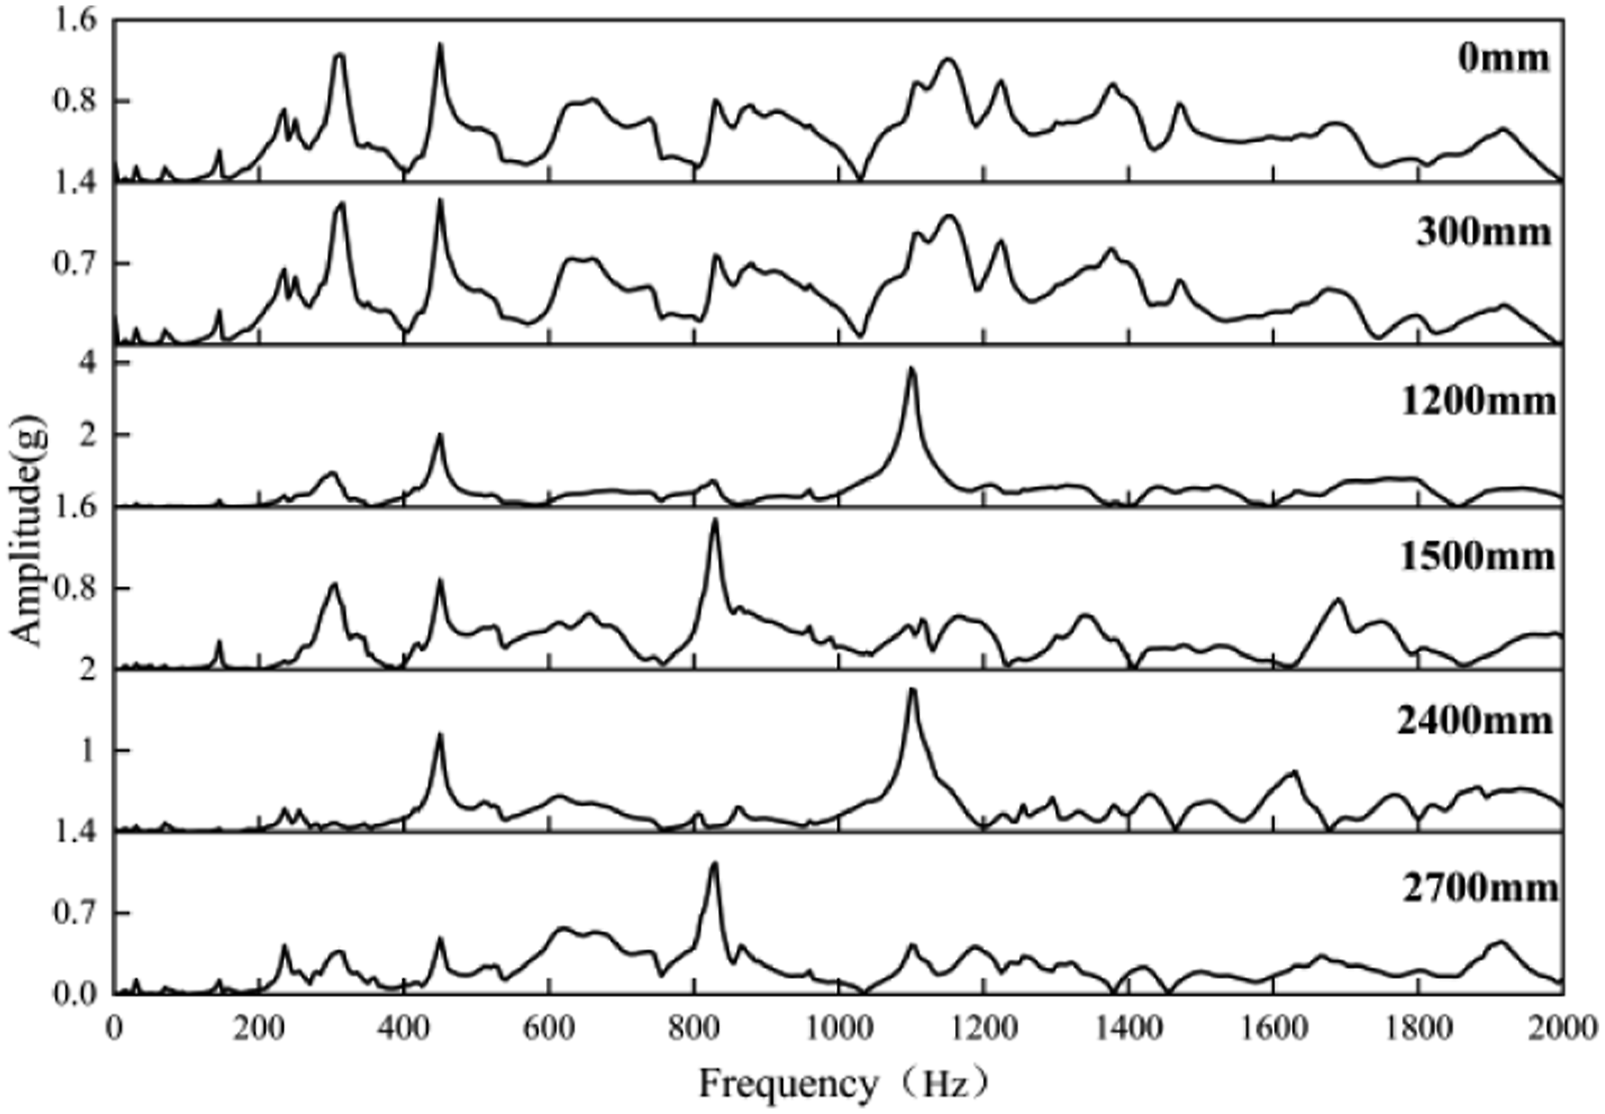
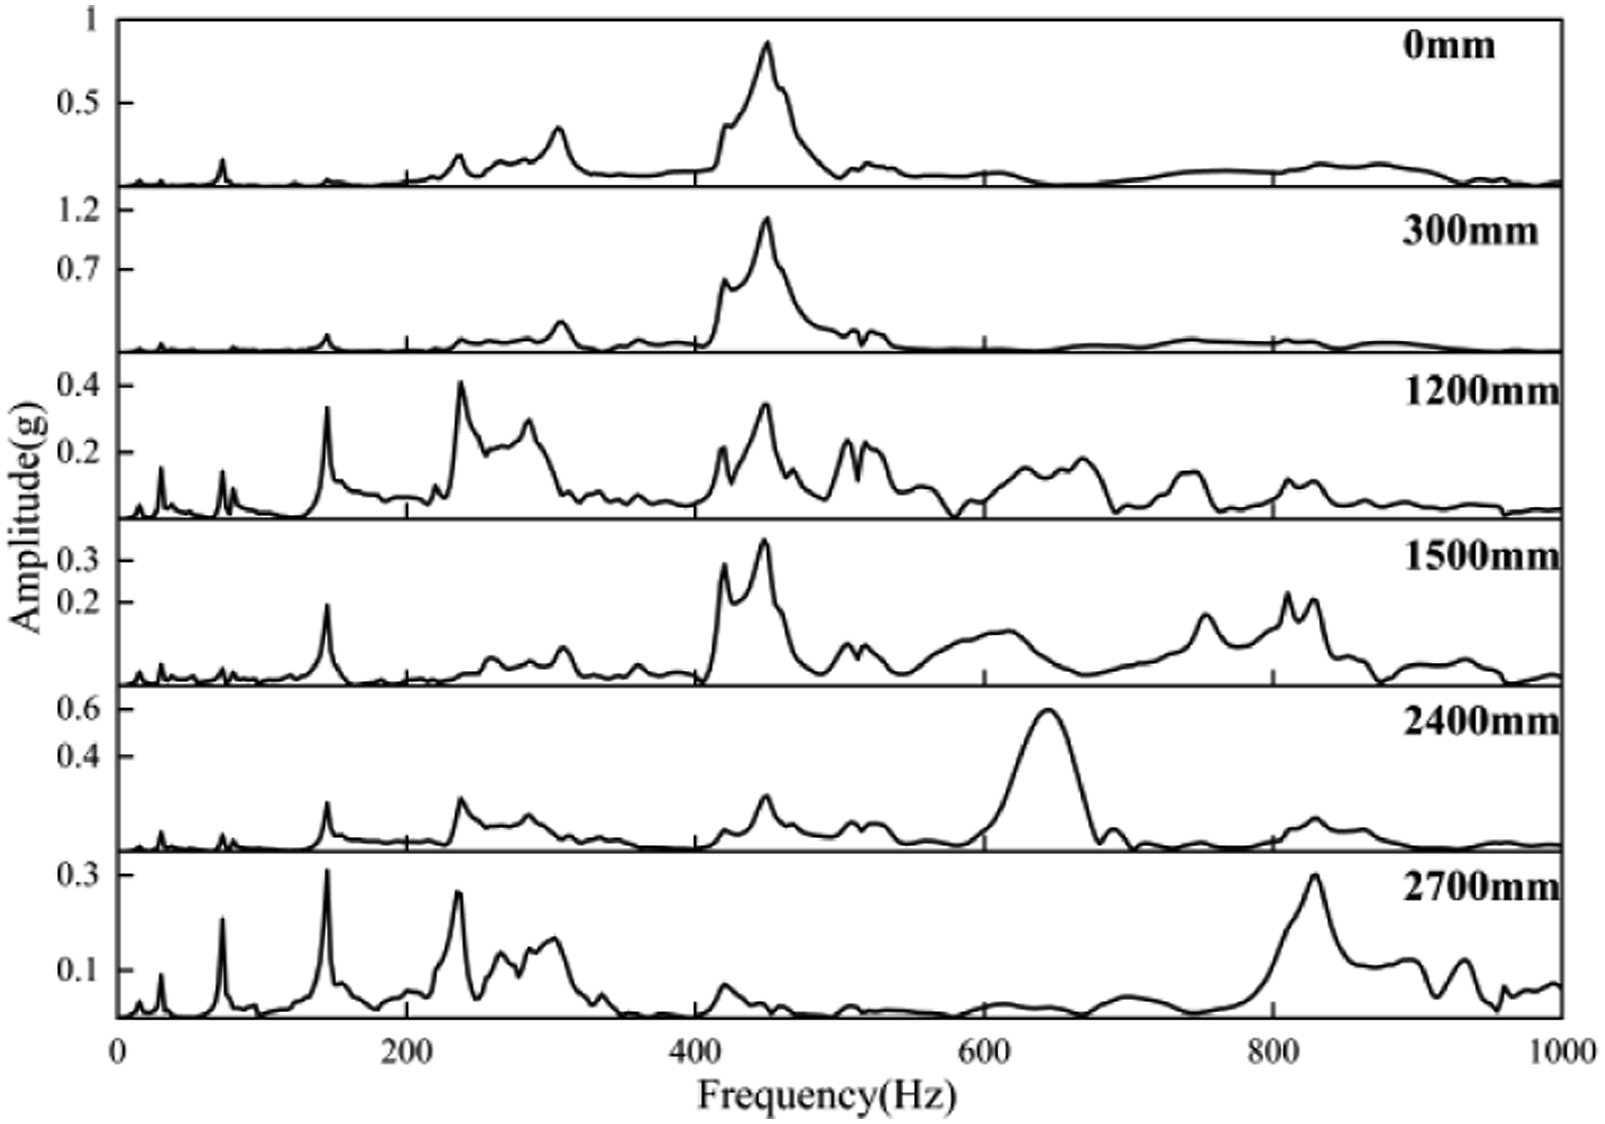
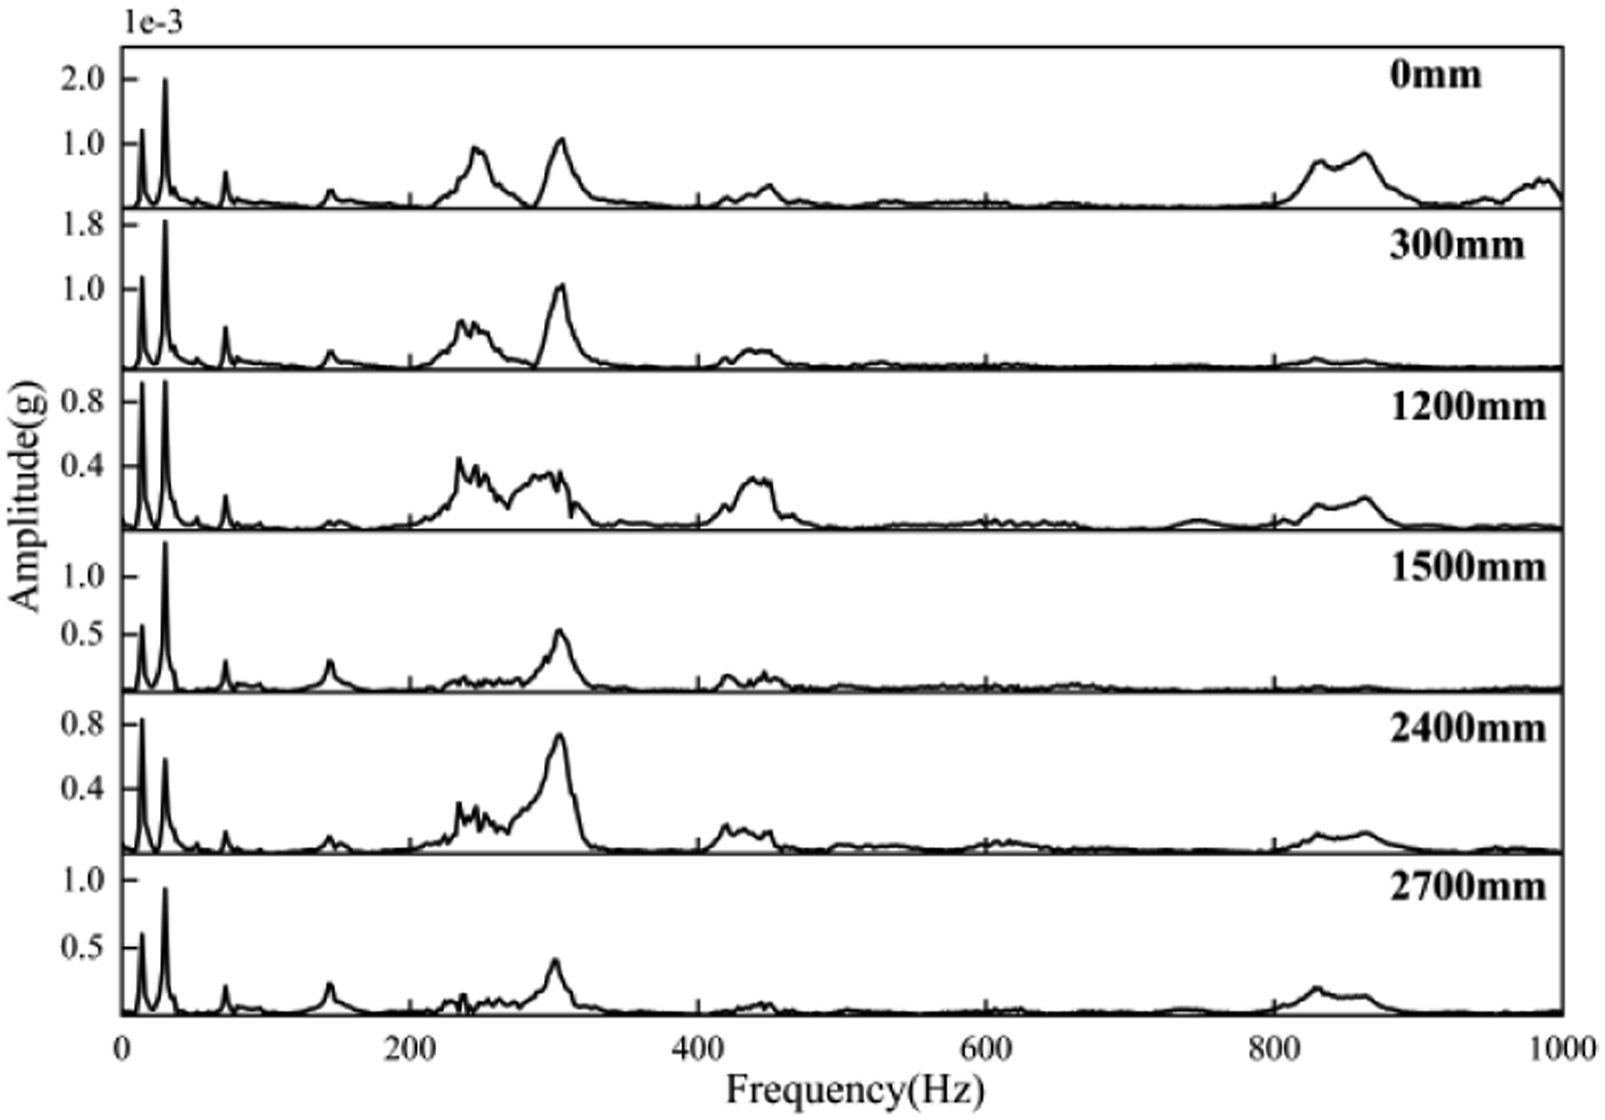
As shown in Figure 9, within the distance range of 0–300 mm, the frequency-domain distribution of the rail vibration acceleration is relatively dense and contains multiple peaks, which gradually evolve into a single dominant peak during propagation. During the vibration transmission process from 1.2 m to 2.7 m, the high-frequency vibration components decrease rapidly. The dominant frequency of the acceleration response changes from 1099.78 Hz at 1.2 m to 829.84 Hz at 1.5 m, and then increases to 1099.78 Hz at 2.4 m, showing a regular variation characteristic during propagation. Due to the insufficient constraint at the rail ends of the trapezoidal sleeper slab, local high-frequency vibration responses occur near the slab end, which are strongly affected by longitudinal vibration transmission. As shown in Figures 10 and 11, because the vibration responses of the track slab and ground are influenced by both vertical and longitudinal vibrations of the track system, the vibration components within the corresponding frequency ranges gradually decrease with increasing distance. The vibration components of the track slab gradually decrease within the frequency range of 400–600 Hz, while the low-frequency components within 0–200 Hz gradually become dominant. Local vibration peaks occur at 644.92 Hz at 2.4 m and 829.94 Hz at 2.7 m near the slab end. These results indicate that high-frequency vibration components gradually decrease during propagation, whereas low-frequency components gradually become dominant. In addition, local vibration amplification occurs near the slab end due to boundary effects and rail vibration responses. With increasing distance, the ground vibration response gradually changes from double peaks to single peaks within the frequency range of 200–400 Hz, and the vibration response magnitude decreases from approximately 1 g near the hammering point to approximately 0.3 g near the slab end. This indicates that during longitudinal vibration propagation, the trapezoidal sleeper vibration damping pad effectively suppresses the coupled influence of rail and track slab vibrations, thereby reducing the ground vibration response during longitudinal propagation and improving the vibration reduction performance of the trapezoidal sleeper system.
4.2.2. Power spectral density (PSD) analysis
The power spectrum density of each measuring point of the trapezoidal sleeper rail, track plate and ground is shown in Figures 12–14. PSD of vibration acceleration of rail. PSD of vibration acceleration of track plate. PSD of vibration acceleration of ground.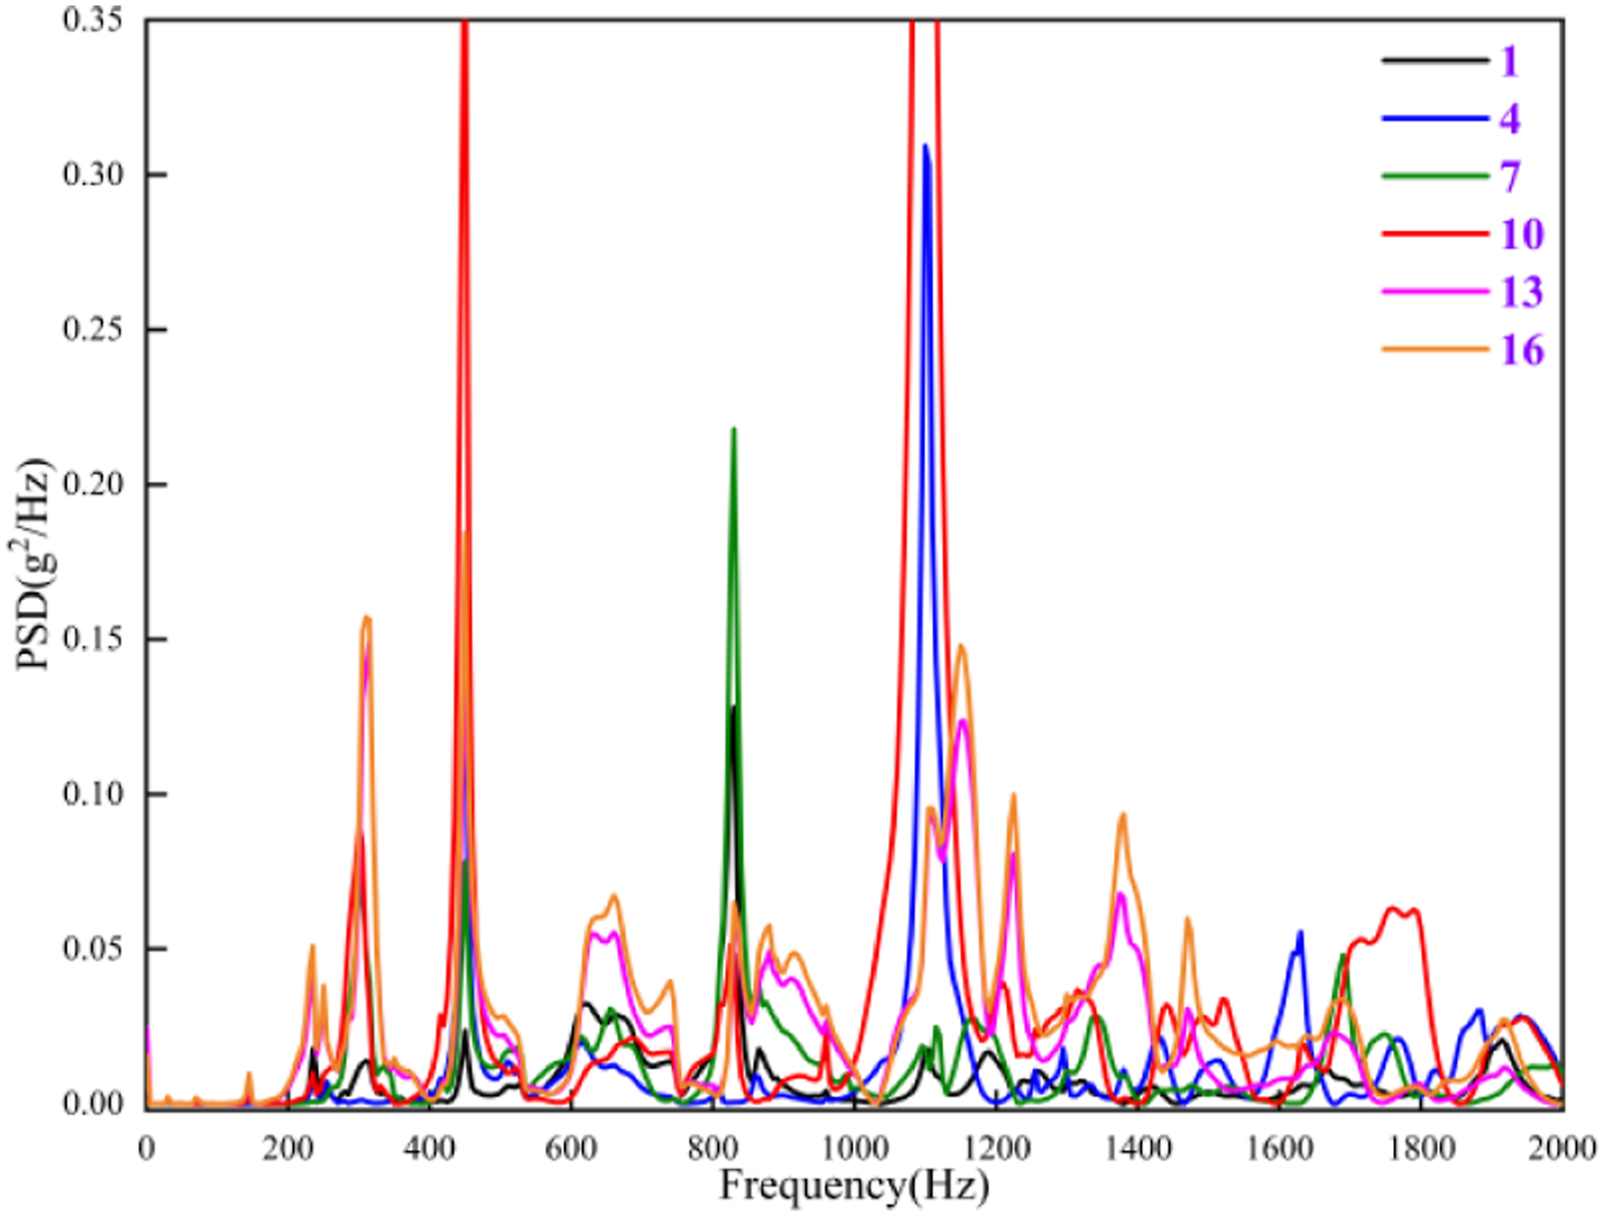

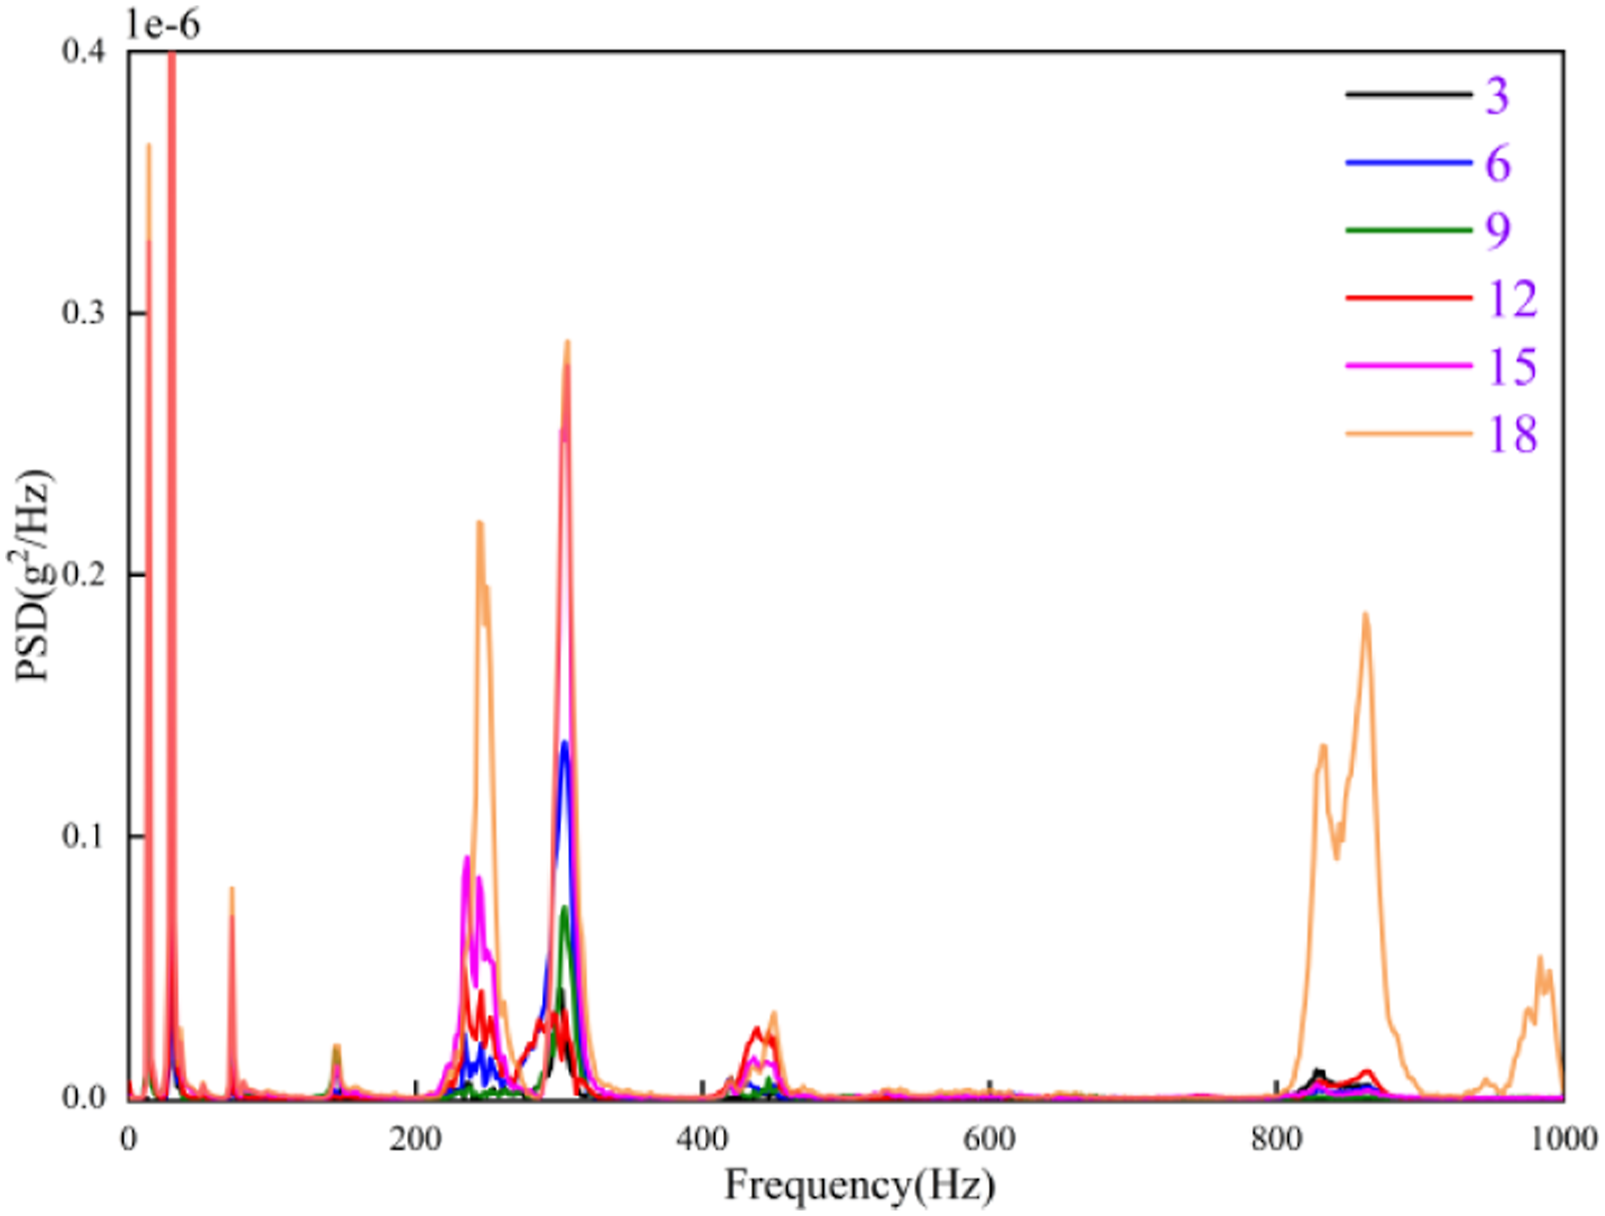
As shown in Figures 12–14, during longitudinal vibration propagation along the trapezoidal sleeper, the rail, track slab, and ground exhibit different vibration response distribution characteristics within different frequency ranges and at different measuring positions. As shown in Figure 12, the peak distribution of the rail power spectral density is relatively dense, and similar distribution patterns are observed at different measuring points along the longitudinal direction, mainly concentrated at 309.94 Hz, 449.91 Hz, 659.81 Hz, 829.84 Hz, and 1099.78 Hz. Except for measuring point No. 10, the peak values of the rail power spectral density gradually decrease with increasing longitudinal propagation distance, which is consistent with the response reduction characteristics of the vibration peak values and RMS values discussed above. This indicates enhanced local vibration responses near the 1/4 position of the slab. As shown in Figure 13, the power spectral density distribution of the track slab is relatively sparse, and the overall vibration response magnitude gradually decreases along the longitudinal direction. The dominant vibration response peaks are mainly distributed at 144.98 Hz, 237.47 Hz, and 449.97 Hz, with the maximum peak occurring at 449.97 Hz at measuring point No. 14. A local vibration response peak appears at 642.42 Hz at measuring point No. 5. This is mainly attributed to insufficient constraints near the slab end, resulting in local vibration amplification. As shown in Figure 14, the power spectral density of the ground is mainly concentrated within the low-frequency range, and the dominant frequencies are mainly distributed at 13.99 Hz, 71.99 Hz, 245.97 Hz, and 305.97 Hz. A local vibration response peak appears at 861.91 Hz at measuring point No. 18. This is because this measuring point is located near the hammering section and is directly affected by the high-frequency impact vibration.
Based on the power spectral density analysis of the rail, track slab, and ground vibration responses of the trapezoidal sleeper system, the following characteristics can be observed: the dominant vibration components gradually shift from high-frequency rail responses to low-frequency ground responses during propagation. Meanwhile, the vibration response magnitude gradually decreases with increasing distance from the vibration source, while local vibration amplification phenomena occur at certain positions. Therefore, during on-site construction and operation, the end constraints of the trapezoidal sleeper system should be strengthened, and the vibration damping pads should be reasonably and uniformly arranged to achieve more uniform vibration response distribution and improved vibration reduction performance.
4.2.3. Z vibration level (VLz) attenuation analysis
The Z vibration level of the rail, track plate, and ground vibration acceleration at the longitudinal position of the trapezoidal sleeper is calculated and analyzed to explore the attenuation law of the vibration level along the longitudinal direction. The Z vibration level of each track structure at different positions in the longitudinal direction of the trapezoidal sleeper is shown in Figure 15. Z vibration level diagram of longitudinal vibration acceleration of each track structure of trapezoidal sleeper.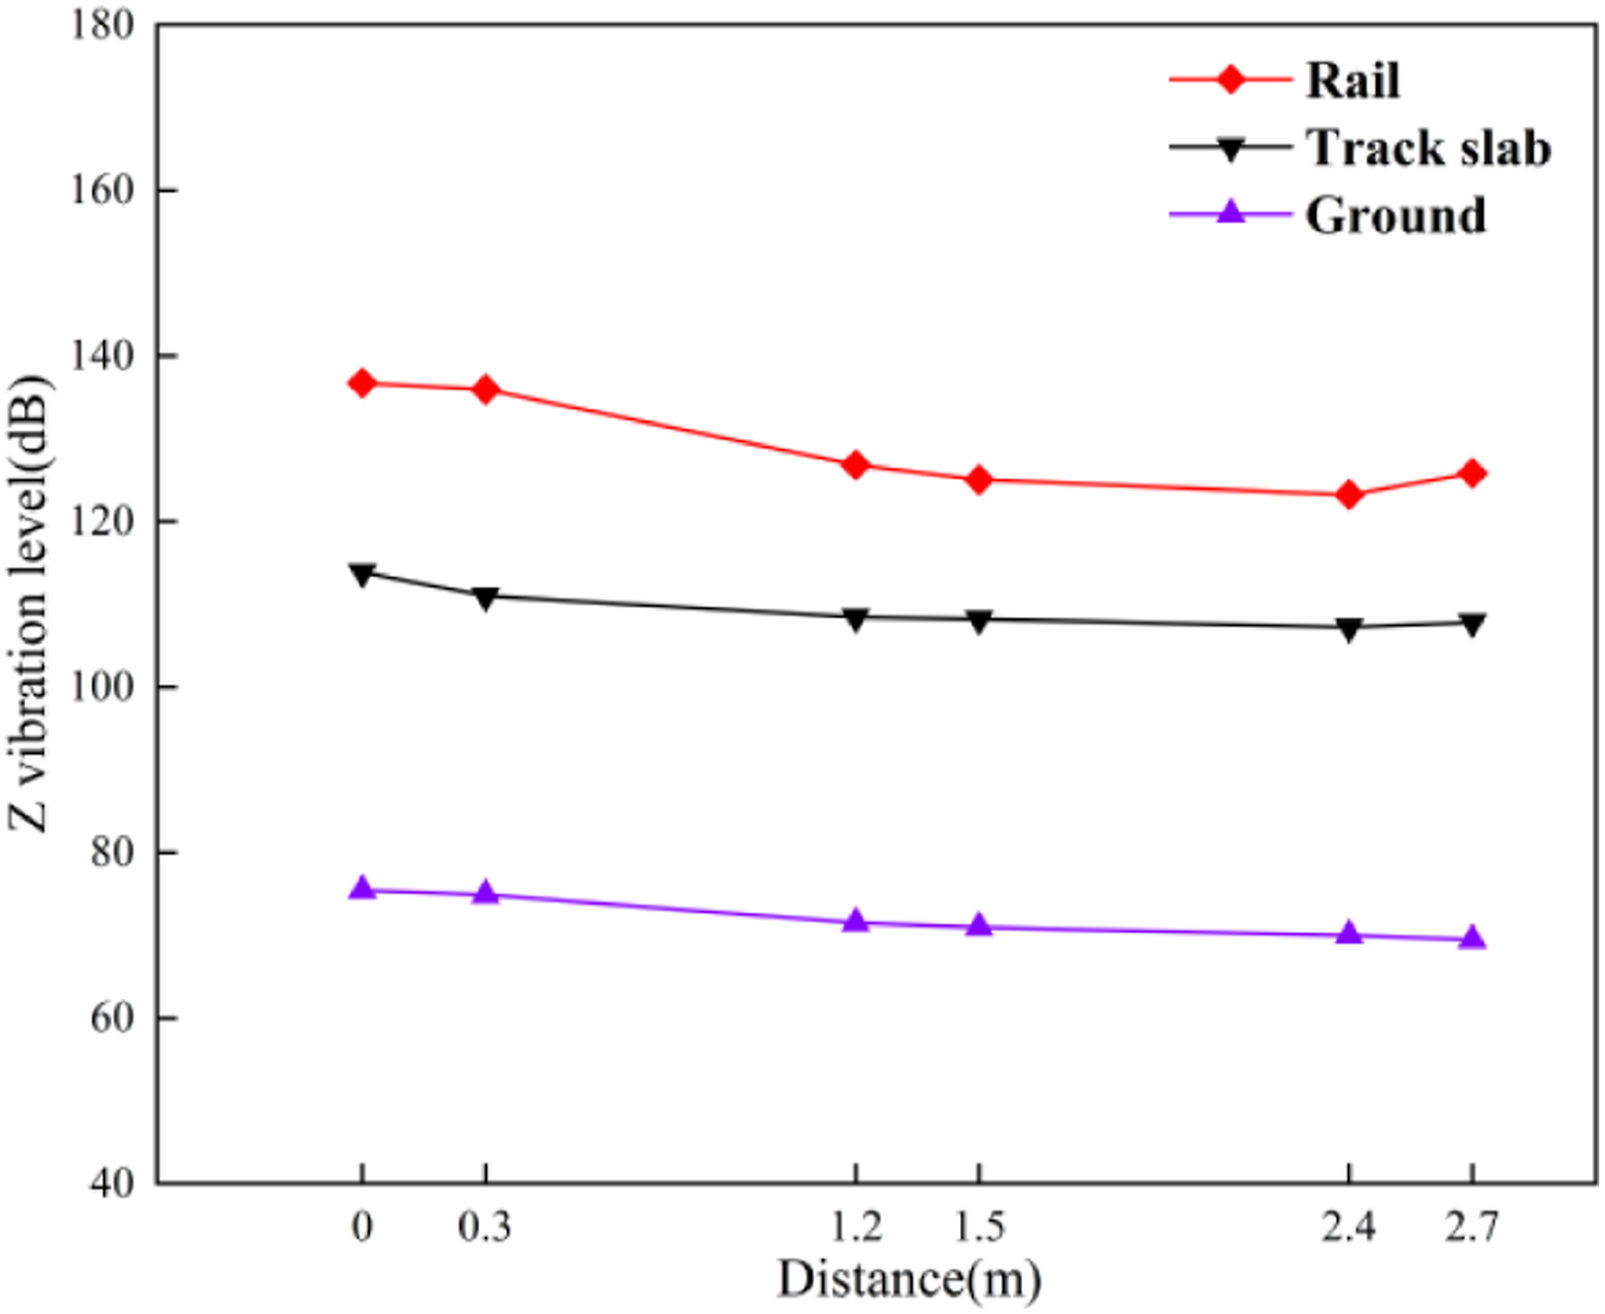
It can be seen from Figure 15 that as the distance from the hammering point increases, the Z vibration levels of the rail, track slab, and ground all show gradually decreasing trends. However, at the position 2.7 m away from the slab end, the Z vibration level increases slightly. This is mainly attributed to the insufficient restraint at the rail end and slab end, resulting in stronger vibration responses near the boundary region. During the longitudinal propagation of vibration along the trapezoidal sleeper, the average reduction gradient of the Z vibration level is 4.03 dB/m for the rail, 2.24 dB/m for the track slab, and 2.21 dB/m for the ground. The average reduction in Z vibration level from the rail to the track slab is 19.5 dB, with the maximum reduction of 24.94 dB occurring at 0.3 m. The average reduction in Z vibration level from the track slab to the ground is 37.37 dB, and the maximum reduction reaches 38.42 dB at the hammering point. Compared with the track slab and ground, the rail exhibits a larger longitudinal reduction gradient of vibration level, whereas the track slab and ground show smaller reduction gradients but longer response propagation characteristics. The reduction in Z vibration level from the track slab to the ground is more significant, indicating that the track slab-ground system plays an important role in the longitudinal vibration reduction process of the trapezoidal sleeper. Therefore, it is necessary to reasonably select the stiffness of the trapezoidal sleeper vibration damping pad and appropriately control the boundary conditions during subway operation to reduce adverse vibration effects.
5. Conclusions
(1) Under hammer pulse excitation, the vibration response duration of each structure gradually increases during the longitudinal vibration propagation of the trapezoidal sleeper. For the peak and RMS values of vibration acceleration per unit distance, the track slab and ground exhibit greater response reduction magnitudes than the rail, and the corresponding reductions occur over shorter propagation distances. (2) During longitudinal vibration propagation, the dominant vibration components of the trapezoidal sleeper gradually shift from high-frequency rail responses to low-frequency ground responses. The power spectral density of the trapezoidal sleeper generally decreases from the center of the slab toward the ends, while local vibration amplification occurs at the 1/4 position and near the slab ends. (3) It is recommended that, during actual design and construction, the end constraints of the trapezoidal sleeper system should be strengthened and the spacing of the vibration damping pads should be reasonably arranged to achieve more uniform vibration response distribution and improved vibration reduction performance.
Footnotes
Funding
The authors disclosed receipt of the following financial support for the research, authorship, and/or publication of this article: This work was supported by the Fundamental Research Funds for the Central Universities of Central South University (2025ZZTS0667), Science and Technology Research and Development Program Project of China railway group limited (2022-Special-14) and Science and Technology Research and Development Program of China State Railway Group Co., Ltd. (L2023G003).
Declaration of conflicting interests
The authors declared no potential conflicts of interest with respect to the research, authorship, and/or publication of this article.