
Abstract
Broken-bar faults in induction motors can degrade performance and compromise reliability. Conventional fault diagnosis methods based on time- and frequency-domain feature extraction require expert knowledge and extensive manual processing, limiting their real-time applicability. This work proposes a framework combining Variational Autoencoders (VAE) and Support Vector Machines (SVM) for automatic fault diagnosis with severity assessment. The VAE extracts informative latent features from high-dimensional vibration signals while performing nonlinear dimensionality reduction. These features are then used to train an SVM to classify normal and broken rotor bar fault severity levels operating modes. The method was validated on a publicly available dataset collected from a 1 HP induction motor under various load and rotor fault conditions. Results demonstrate that the VAE-SVM framework achieves high classification accuracy and reliably discriminates between vibration signal classes across multiple sensor placements under the considered experimental conditions. These results suggest that the proposed approach is a promising framework for automatic fault diagnosis, with potential applications in condition monitoring and predictive maintenance. Further validation under more diverse operating conditions and real industrial environments is required to confirm its robustness and practical applicability.
1. Introduction
Induction motors play a crucial role in powering a wide array of machinery and equipment across industries. Their integration with Industry 4.0 technologies represents a significant advancement in industrial processes, offering enhanced performance, reliability, and efficiency. By incorporating sensors into induction motors, data on various parameters such as temperature, vibration, current, and other relevant signals can be continuously collected. The analysis of this data through Artificial Intelligence (AI) facilitates the detection of patterns, trends, and irregularities, offering insights into potential faults or avenues for refining motor performance.
Time-domain statistical feature extraction, including metrics such as the mean, standard deviation, skewness, and kurtosis, is extensively employed in the analysis of sensor signals. The combination of these temporal statistical features enables the extraction of meaningful information for industrial system monitoring and fault diagnosis. Such features are often incorporated into machine learning models to build accurate and robust condition-monitoring frameworks (Ezziane et al., 2023). In this context, the study reported in Gangsar and Tiwari (2019) investigates the application of a Support Vector Machine for the classification of ten electrical and mechanical motor faults. The method is based on the extraction of fourteen time-domain features, encompassing statistical metrics such as the mean, standard deviation, crest factor, and kurtosis, computed from both current and vibration signals.
Frequency-domain feature extraction represents a powerful approach for fault diagnosis in industrial processes, as it emphasizes variations in the spectral components of measured signals. Such variations are essential for signal analysis and provide insights into fault-related changes occurring in different industrial systems. The distinctive features identified in the frequency domain form the basis of the signal’s frequency signature. Previous studies have combined spectral analysis with machine learning techniques to diagnose motor faults. For instance, rotor bar faults were detected using sideband amplitudes, with decision trees and neural networks achieving accuracies up to 98% (Chisedzi and Muteba, 2023). Similarly, inter-turn short circuits in stator windings were identified from characteristic frequency components using an SVM, achieving 94.7% accuracy (Pandarakone et al., 2016), demonstrating the effectiveness of frequency-domain features for fault diagnosis.
Time- and frequency-domain feature extraction methods are generally coupled with dimensionality reduction techniques, including Principal Component Analysis (PCA) (Marmouch et al., 2017) and Linear Discriminant Analysis (LDA) (Zhou et al., 2021). These methods facilitate selecting the most informative features and correcting potential errors in the estimation of characteristic fault frequency amplitudes.
Owing to rapid advances in deep learning, image-based approaches have attracted considerable attention for fault diagnosis using measured signals. The core concept is to convert measured signals into two-dimensional representations that can be processed by Convolutional Neural Networks (CNNs). CNNs facilitate automatic extraction of informative features from the input signals, leading to substantial improvements in detection and diagnostic accuracy. A variety of image analysis techniques are widely used in industrial fault diagnosis to transform signals into image representations. These include spectrograms (Tami et al., 2024), wavelet scalograms (Hasan et al., 2021), Hilbert–Huang transform scalograms (Du et al., 2022), Gramian Angular Fields (GAFs) (Zhou et al., 2022), Markov Transition Fields (MTFs) (Memariam et al., 2023), and Recurrence Plots (RPs) (Tarek and Sameh, 2024), each providing a unique perspective on the signal’s image characteristics.
Beyond CNN-based approaches, recurrent neural network architectures, such as Long Short-Term Memory (LSTM) and Gated Recurrent Unit (GRU) networks, have been developed to capture temporal dependencies inherent in measured signals, thereby improving robustness under noisy and dynamic operating conditions. A hierarchical LSTM-based deep network was introduced in Yu et al. (2019) for feature learning and fault recognition of rolling bearings. More recently, attention-enhanced LSTM architectures have demonstrated superior fault detection performance compared with conventional LSTM models by enabling selective focus on informative temporal features (Khaniki et al., 2023).In Yahui et al. (2021), a GRU-based framework was proposed to learn representative features from vibration signals, followed by a multilayer perceptron for fault recognition. Aref et al. (2026) introduced a Dual-Attention CNN–GRU framework with Per-Regime Scaling for predictive maintenance and Remaining Useful Life (RUL) prediction, achieving reliable performance on the challenging C-MAPSS FD002 dataset.
Recently, Transformer-based architectures using self-attention mechanisms have been investigated for machinery fault diagnosis, offering advantages in improving feature extraction capabilities from time series data (Yuhong et al., 2022). These models have shown promising results in detecting faults in rotating machinery by capturing long-range relationships in vibration signals (Yandong et al., 2023). In Tang et al. (2022), a Vision Transformer (ViT) model combined with a wavelet transform and a soft voting method was proposed to improve diagnostic accuracy further.
Despite the advantages of conventional feature extraction approaches, they often require extensive domain expertise and result in high-dimensional representations. While deep learning models such as CNNs, LSTMs/GRUs, and Transformers have achieved state-of-the-art performance in fault diagnosis, they typically require substantial computational resources. To overcome these limitations, this work proposes a hybrid framework combining a variational autoencoder with a Support Vector Machine. The VAE automatically extracts informative, low-dimensional features from sensor signals while capturing the underlying data distribution (Spina et al., 2024), reducing the need for manual feature engineering. The SVM, known for its robustness across classification and regression tasks, leverages these features to provide reliable, accurate fault diagnosis. Although alternative kernel-based models, such as Relevance Vector Machines (RVMs), have been explored in the literature and may offer improved computational efficiency, they do not yield significant gains in classification accuracy compared to SVMs (Kuai et al., 2024). This VAE–SVM pipeline, which combines the strengths of generative deep learning with the proven stability of SVM-based models, was validated on a publicly available dataset, achieving high classification accuracy while indicating favorable computational efficiency.
The remainder of this paper is organized as follows. Section 2 presents the experimental database used in this work and describes the experimental workbench characteristics. Section 3 introduces the theoretical background of the proposed method, including Variational Autoencoders and Support Vector Machines. Section 4 reports the experimental results and performance evaluation. Finally, the conclusion and future recommendations are given in Section 5.
2. Database
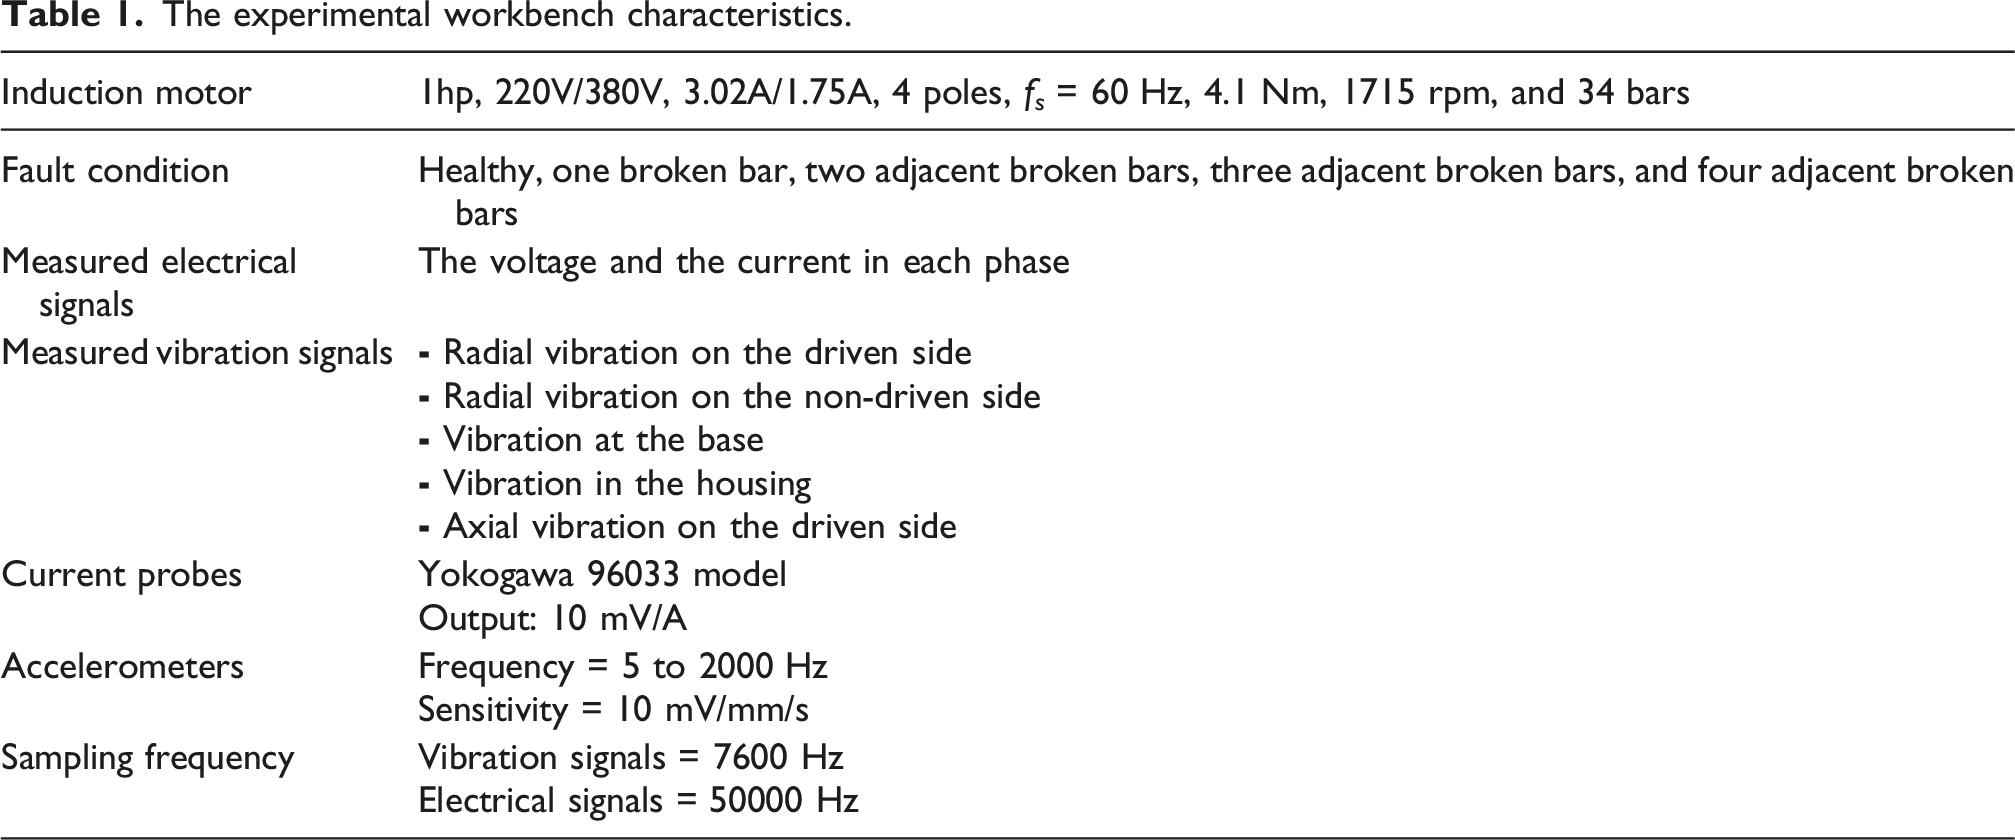
The experimental workbench characteristics.
3. Theoretical background
3.1. Variational autoencoders (VAEs)
Variational autoencoders, introduced by Kingma and Welling (2013), are a class of probabilistic models designed to discover latent, low-dimensional representations in data and serve as a method for dimensionality reduction.
VAEs are a form of autoencoders. Traditional autoencoders consist of an encoder and a decoder network (Figure 1), where the encoder compresses the input data X into a lower-dimensional representation Z (latent space), and the decoder reconstructs the original data from this representation X’. By learning to compress and reconstruct input data, autoencoders can capture essential features in a lower-dimensional space, facilitating tasks such as dimensionality reduction, denoising, and data generation (Kingma and Welling, 2013). The autoencoder architecture.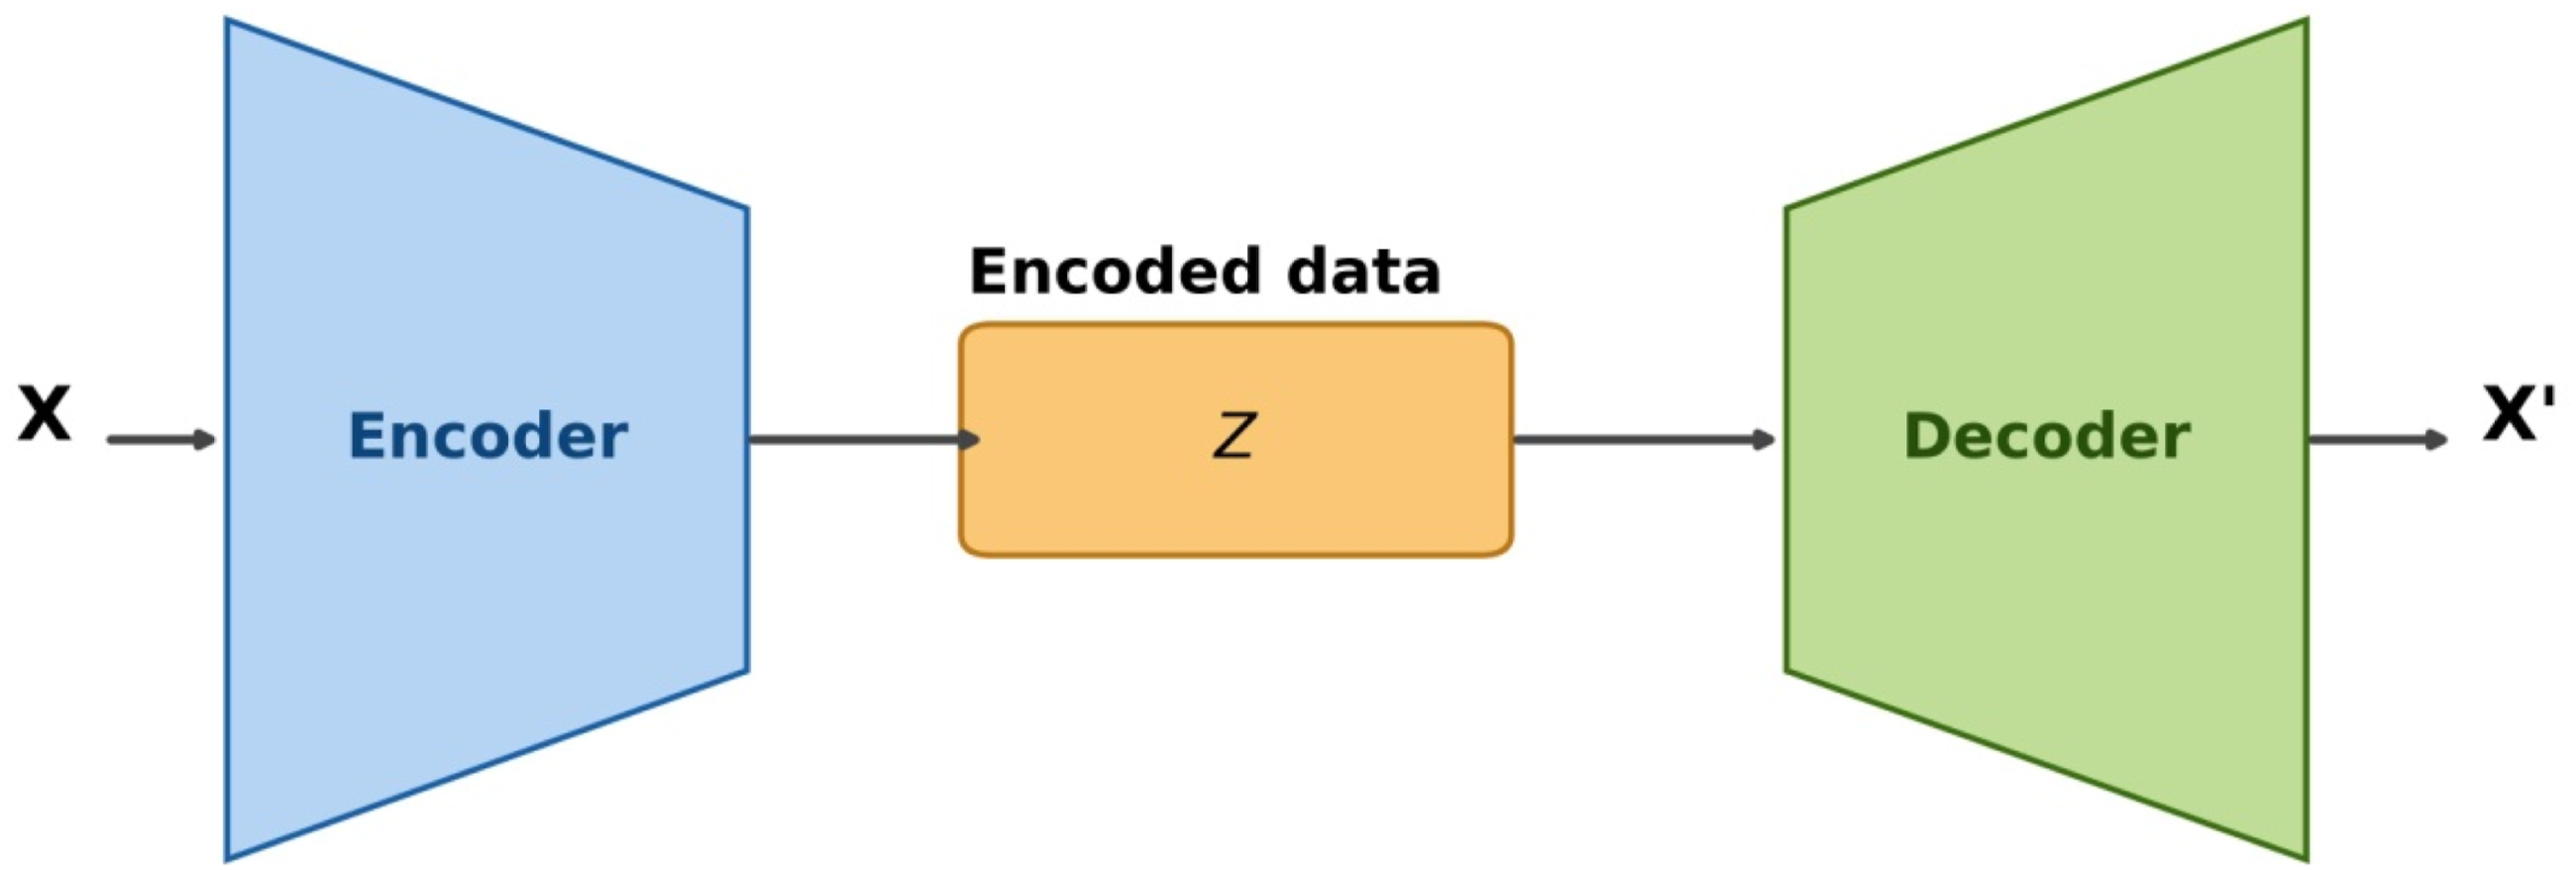
During training, the autoencoder aims to minimize the reconstruction error between the input data and the reconstructed data according to equation (1)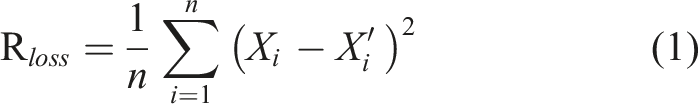
VAEs extend this concept by introducing probabilistic principles into the encoding process. VAEs encode each input as a probability distribution characterized by its mean and variance (Figure 2). This enables VAEs to capture the uncertainty inherent in the data and to generate novel samples that capture the variability in the input distribution (Givnan et al., 2022). The VAEs architecture.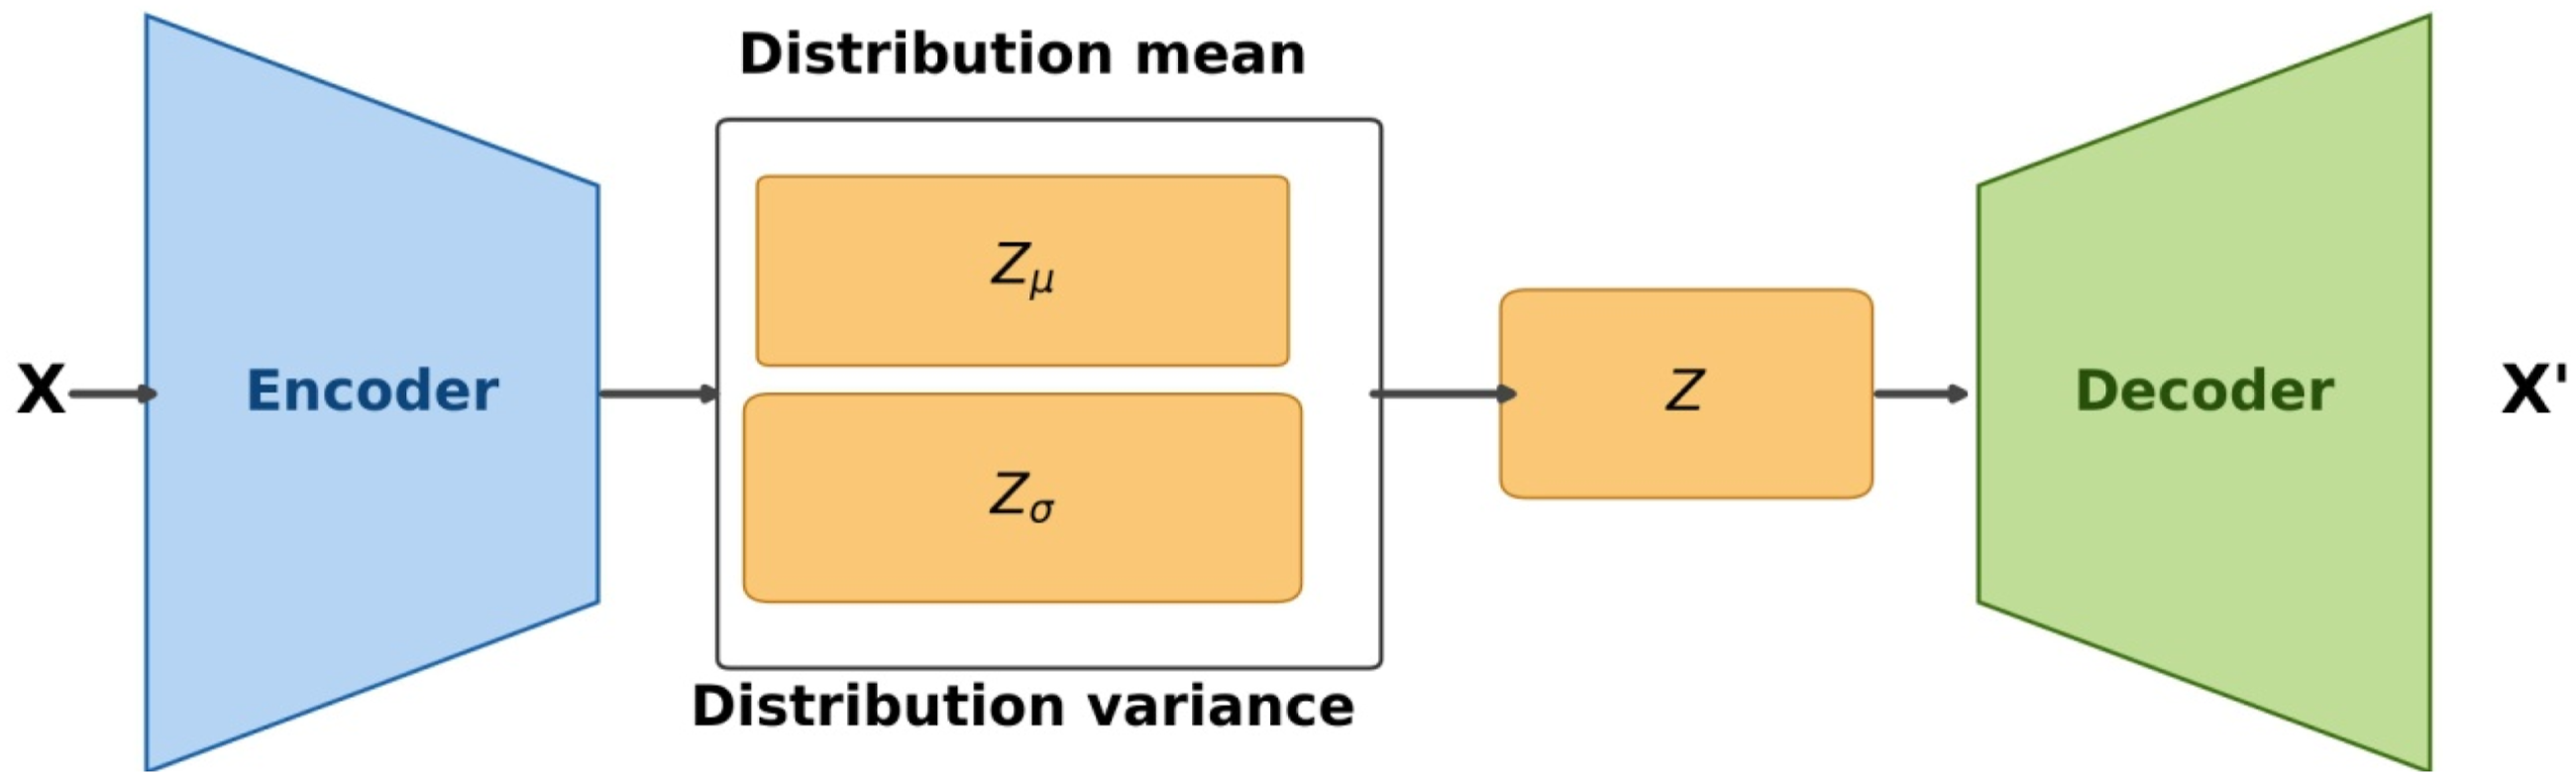
The loss function used to train VAEs typically consists of the sum of two terms: the reconstruction loss and the Kullback–Leibler (KL) divergence between the approximate posterior and the prior distribution over latent variables. The KL divergence term in the VAE loss function serves as a regularizer. It ensures that the distribution of latent variables produced by the encoder closely matches a predefined distribution, typically a standard normal distribution. It is a special case of the Gaussian distribution where the mean is centered at 0 and the variance is 1; then, the KL divergence term can be expressed as (Jakubowski et al., 2022):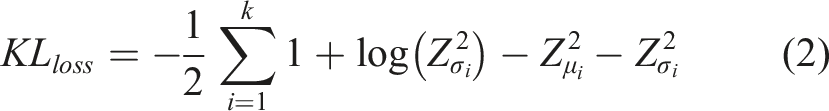
3.2. Support vector machines (SVMs)
Support Vector Machines offer a powerful approach to both linear and nonlinear classification tasks. SVMs are renowned for their excellent generalization performance, making them widely used in various applications where accurate predictions on unseen data are essential. As illustrated in Figure 3, SVMs aim to find the hyperplane that maximizes the margin between classes. By maximizing the margin, SVMs inherently seek the decision boundary that best separates the classes, which often results in better generalization to unseen data. The data points that lie closest to the hyperplane are called support vectors. These are the critical points that define the decision boundary. Optimal hyperplane and support vectors in SVM classification.
For linearly separable data, the hyperplane can be represented by the equation
The margin is the distance between the hyperplane and the nearest data point from either class (support vectors). The optimal hyperplane that separates the classes with the maximum margin while ensuring that all data points are correctly classified can be found by solving the optimization problem (Cortes and Vapnik, 1995):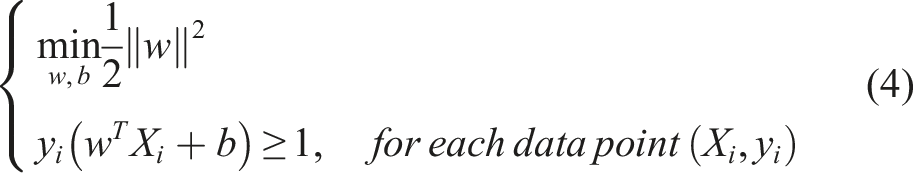
Lagrange duality allows us to transform the primal optimization problem into its dual form. The Lagrangian is then defined as the objective function along with the constraints multiplied by their respective Lagrange multipliers α
i
≥ 0 (Cortes and Vapnik, 1995)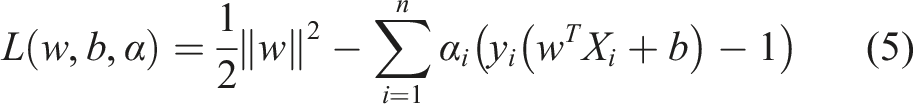
Since practical datasets are rarely perfectly separable, slack variables ξ
i
≥ 0 are introduced to handle non-separable data and improve robustness to noise and outliers. The soft-margin optimization problem becomes: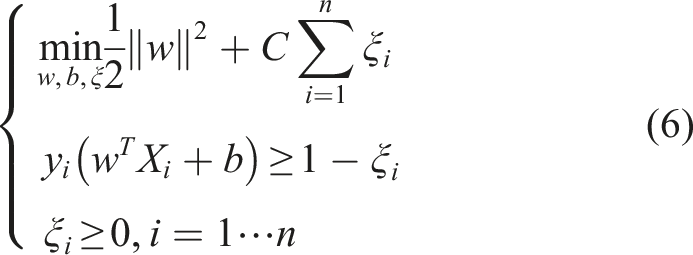
After minimizing the Lagrangian with respect to w and b, the dual formulation is obtained: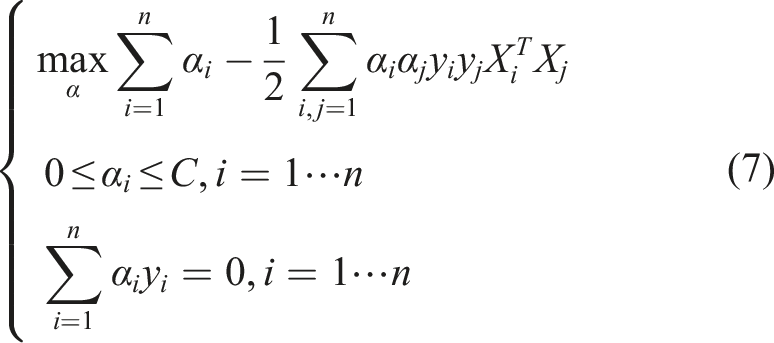
The decision function for classifying a new observation X is given by (Cortes and Vapnik, 1995)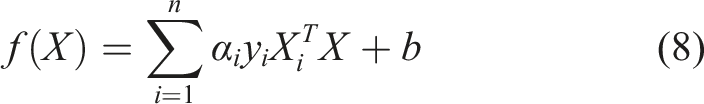
The kernel trick allows SVMs to address nonlinear classification problems by implicitly mapping the input features into a higher-dimensional space where the classes might be linearly separable (Huh, 2015). This allows us to perform linear classification in the higher-dimensional space without explicitly computing the transformed feature vectors. SVMs support various types of kernel functions, such as linear, polynomial, radial basis function, and sigmoid kernels (Chandra and Bedi, 2021). The Radial Basis Function (RBF) kernel, used in this study, is expressed as follows: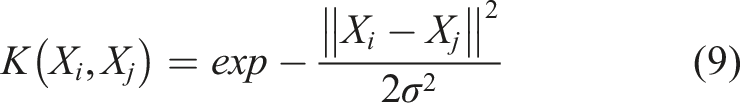
In the context of SVMs with a nonlinear kernel, the final decision function for classification of a new data point X can be expressed as follows (Chandra and Bedi, 2021).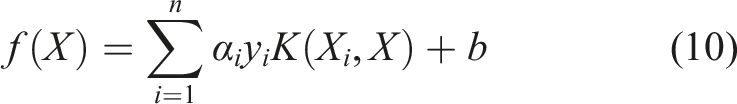
4. Results and evaluation
To evaluate the performance of the proposed approach in determining the severity of a rotor cage fault severity, we extracted a database of 40,000 measurements per sensor using a sliding window of 800 samples from three distinct vibration sensors. For each operating mode, 8000 measurements were collected, comprising 1000 measurements per load level and 100 measurements per experimental repetition. Each load condition includes ten independent experimental trials, from which 100 non-overlapping windows were extracted. The resulting dataset is balanced across both load conditions and fault severities, with all eight load conditions represented, ensuring comprehensive coverage while minimizing redundancy. The assessment relies on vibration data acquired from three strategically positioned accelerometers, placed to capture radial and axial vibrations on the driven side and radial vibrations on the non-driven side of the motor. Data from each sensor were analyzed independently to evaluate the robustness of the proposed approach across different sensor locations and vibration characteristics.
Dataset splitting was performed at the experimental-trial level to prevent data leakage, ensuring that all signal windows (100) originating from the same trial were assigned to the same subset. For each sensor, the 40,000 samples (400 trials) were divided into training (70%: 280 trials, 28,000 samples), validation (15%: 60 trials, 6000 samples), and test (15%: 60 trials, 6000 samples) sets using a stratified partitioning strategy based on fault severity to preserve class distribution across all subsets. Load conditions were not stratified and were randomly distributed at the trial level across the training, validation, and test sets, ensuring experimental-trial independence. This procedure ensures class balance while treating load conditions as an uncontrolled operational variable, enabling a realistic evaluation setting.
The block diagram in Figure 4 provides an overview of the architecture employed in this study. The probability distribution describing the latent-space representation is obtained from a variational dense autoencoder. Variational dense autoencoders are characterized by their utilization of densely connected layers. The encoder network initially accepts the input data. It sequentially processes the data through a series of fully connected layers arranged hierarchically, gradually reducing the input data’s dimensionality. Each neuron in a given layer is connected to every neuron in the subsequent layer, facilitating the extraction of intricate features and patterns from the input. Symmetrically, the decoder network of a dense autoencoder mirrors the architecture of the encoder. VAE-based feature extraction and RBF-SVM for multi-class fault severity classification.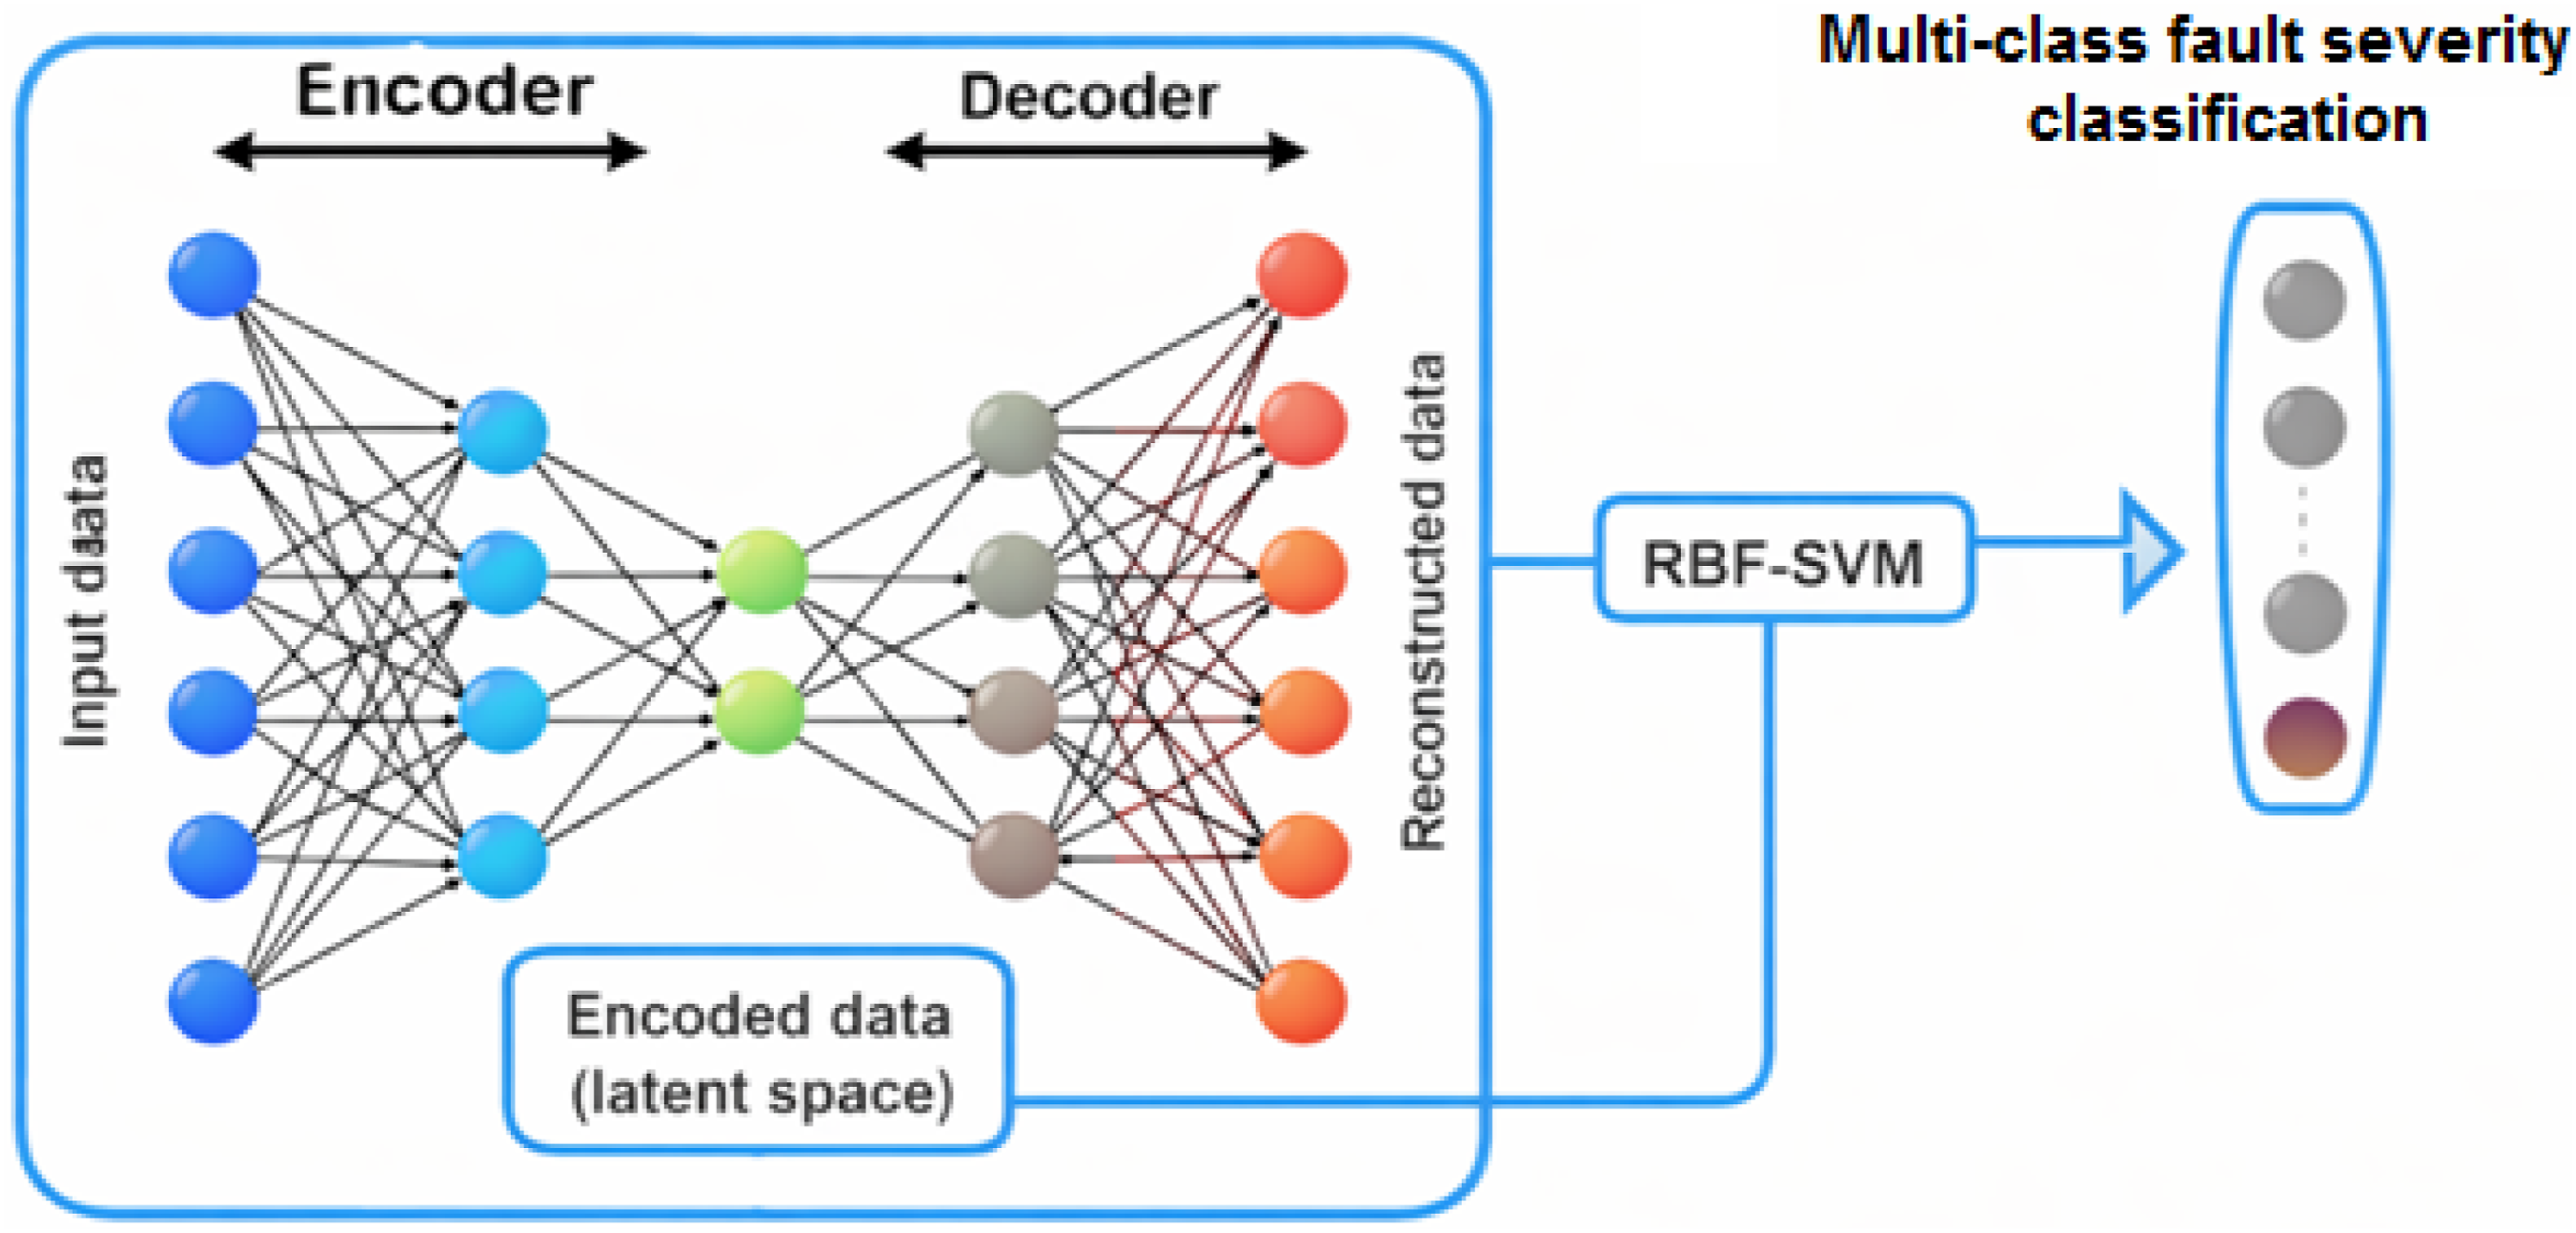
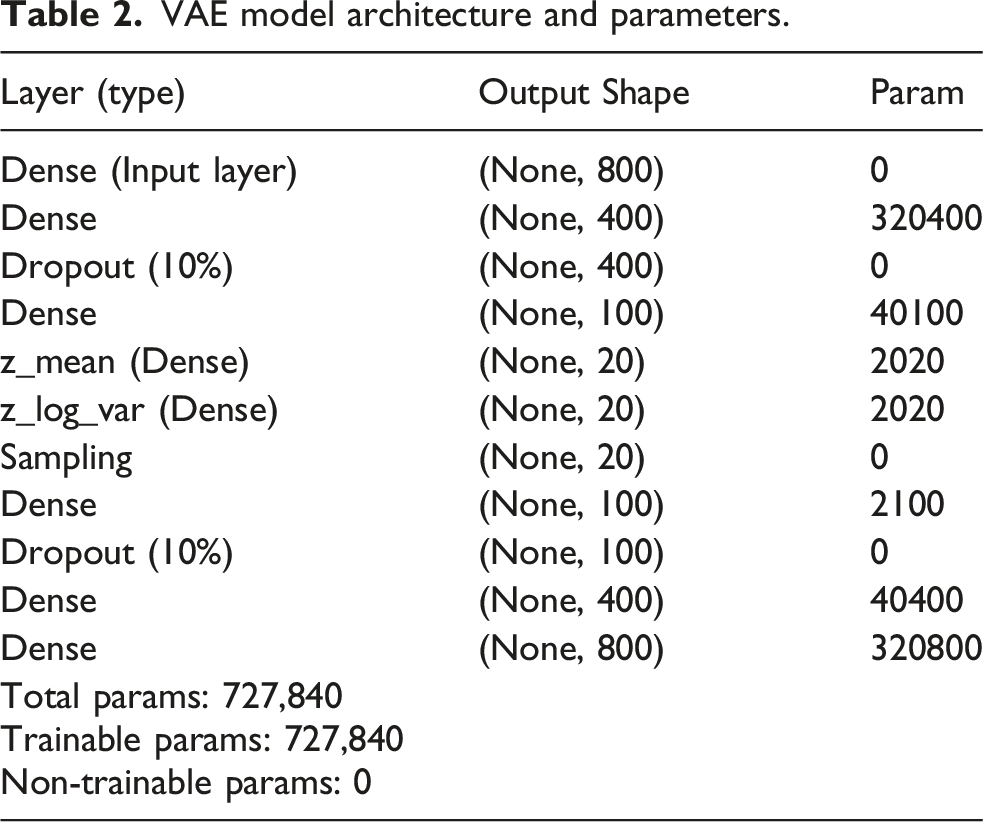
VAE model architecture and parameters.
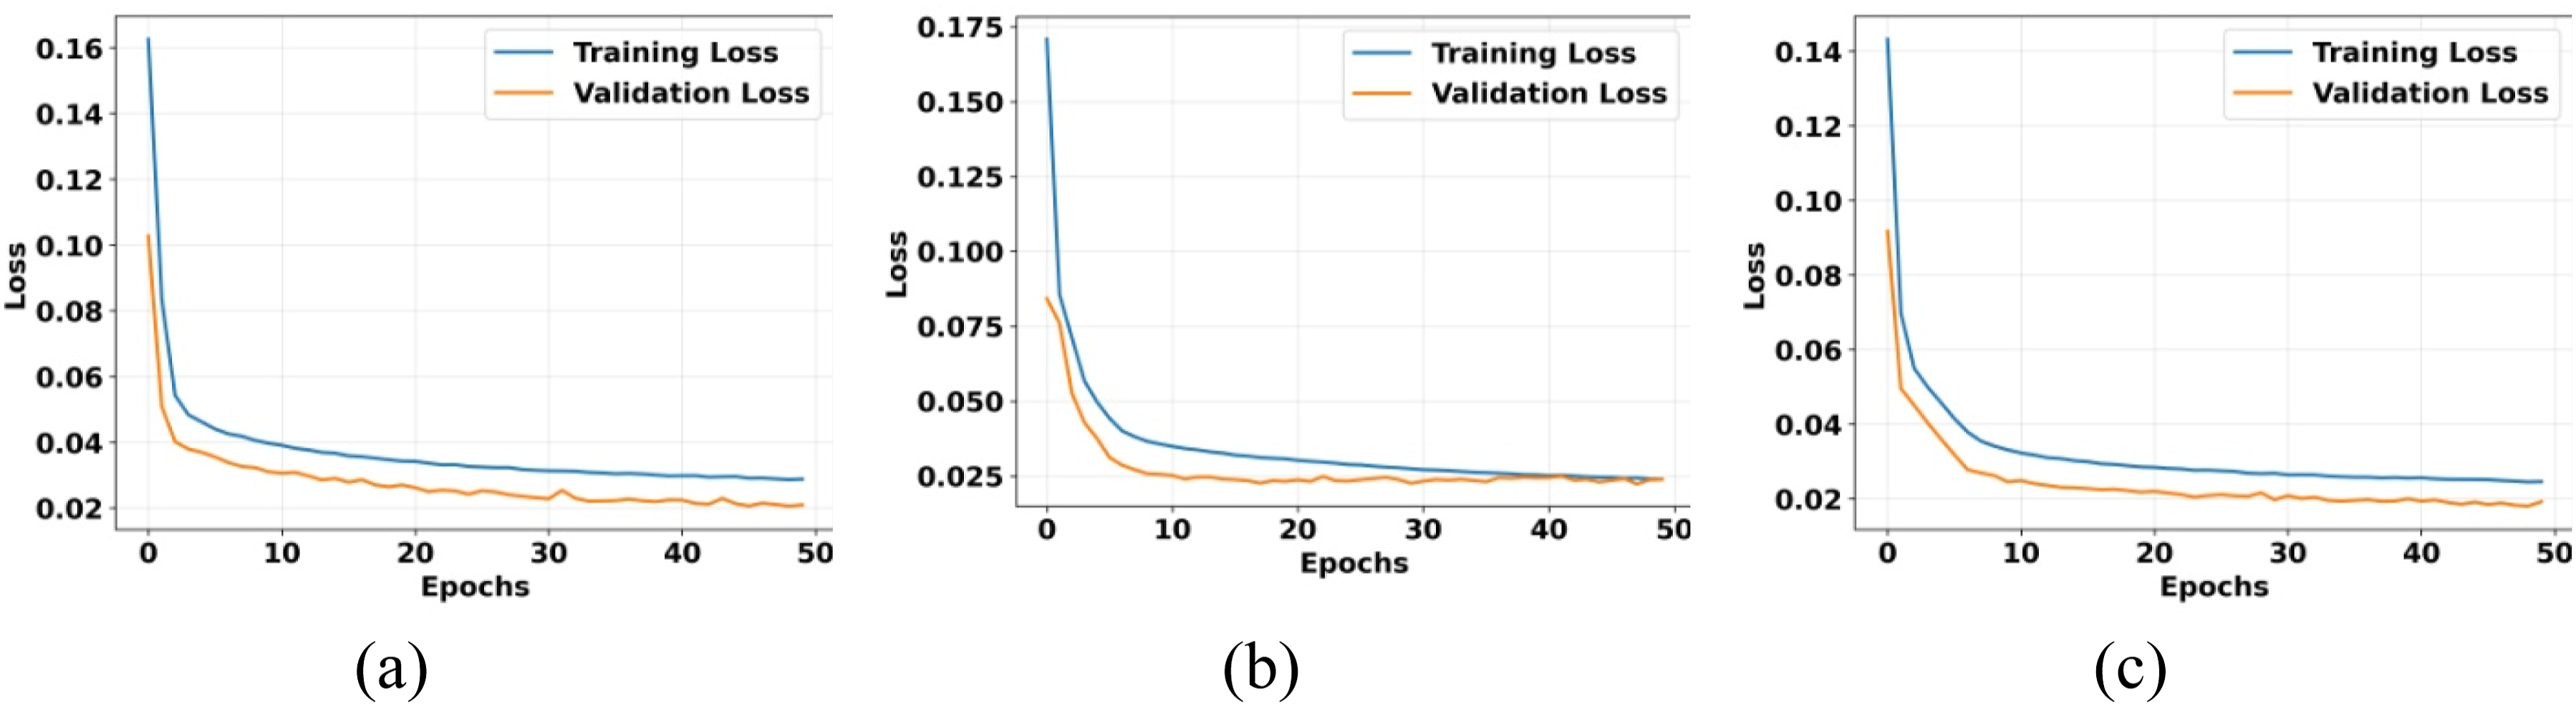
Evolution of the training and validation loss over the training iterations: (a) radial vibrations on the driven side, (b) radial vibrations on the non-driven side, and (c) axial vibrations on the driven side.
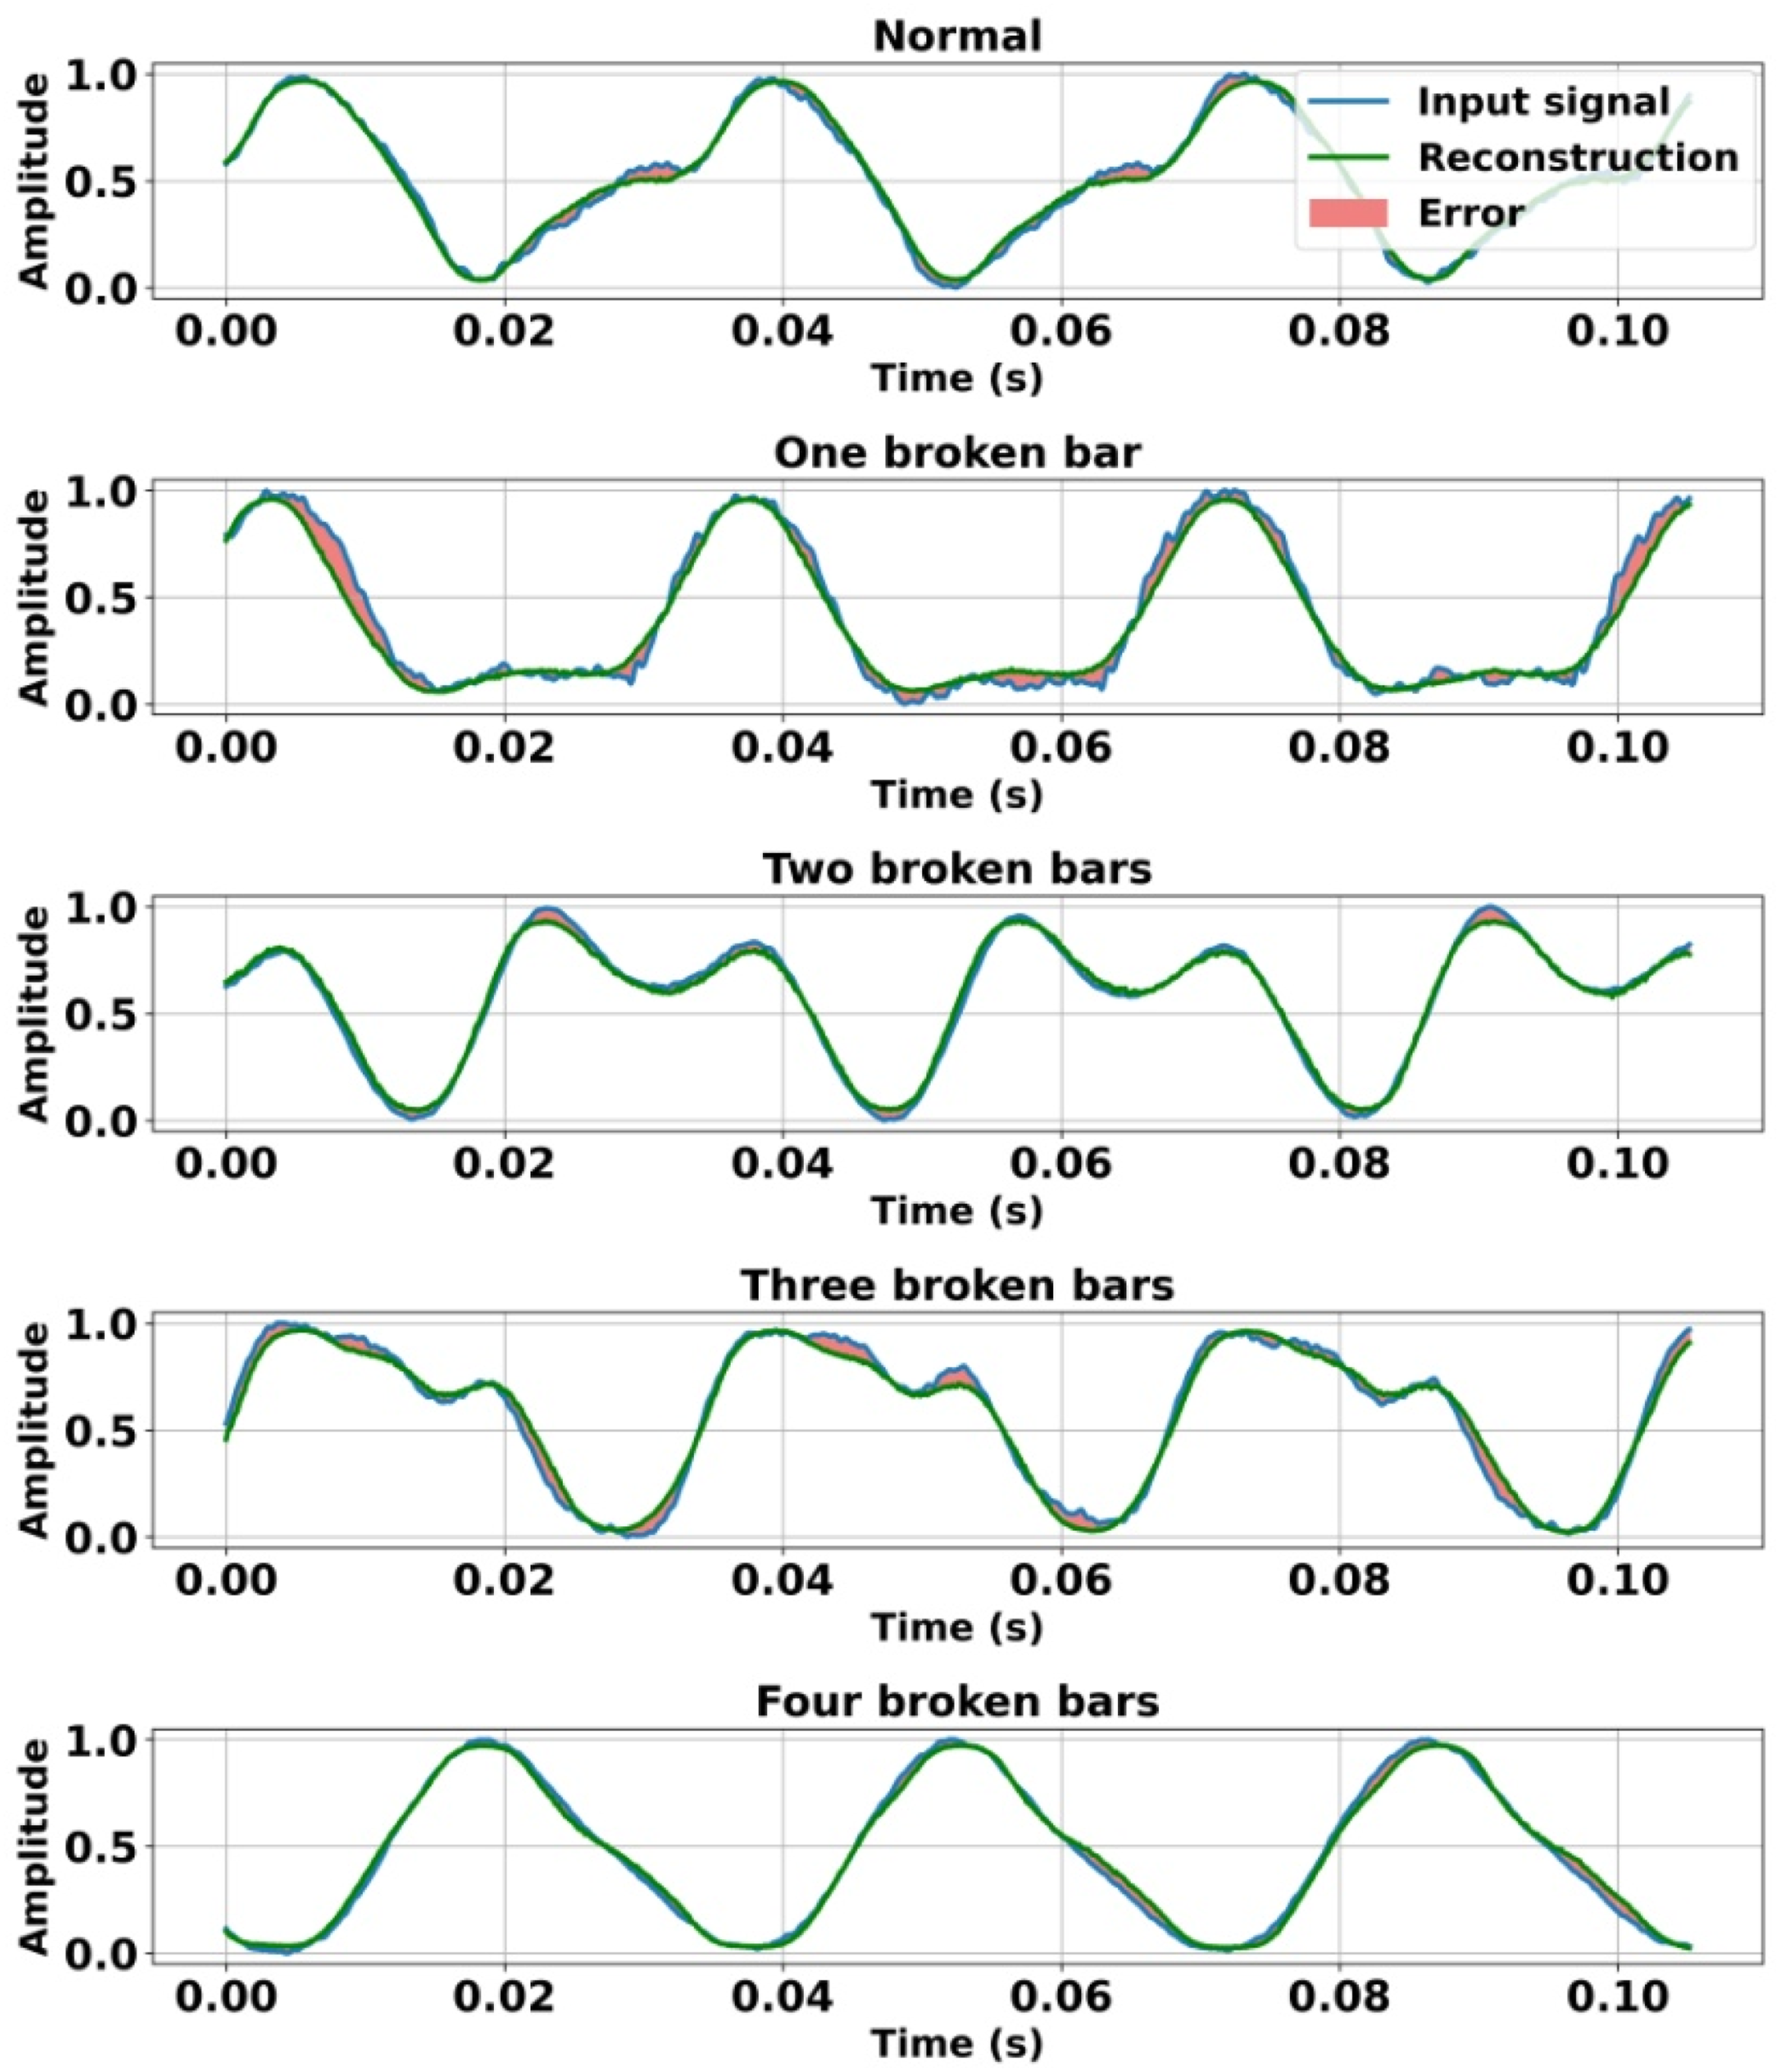
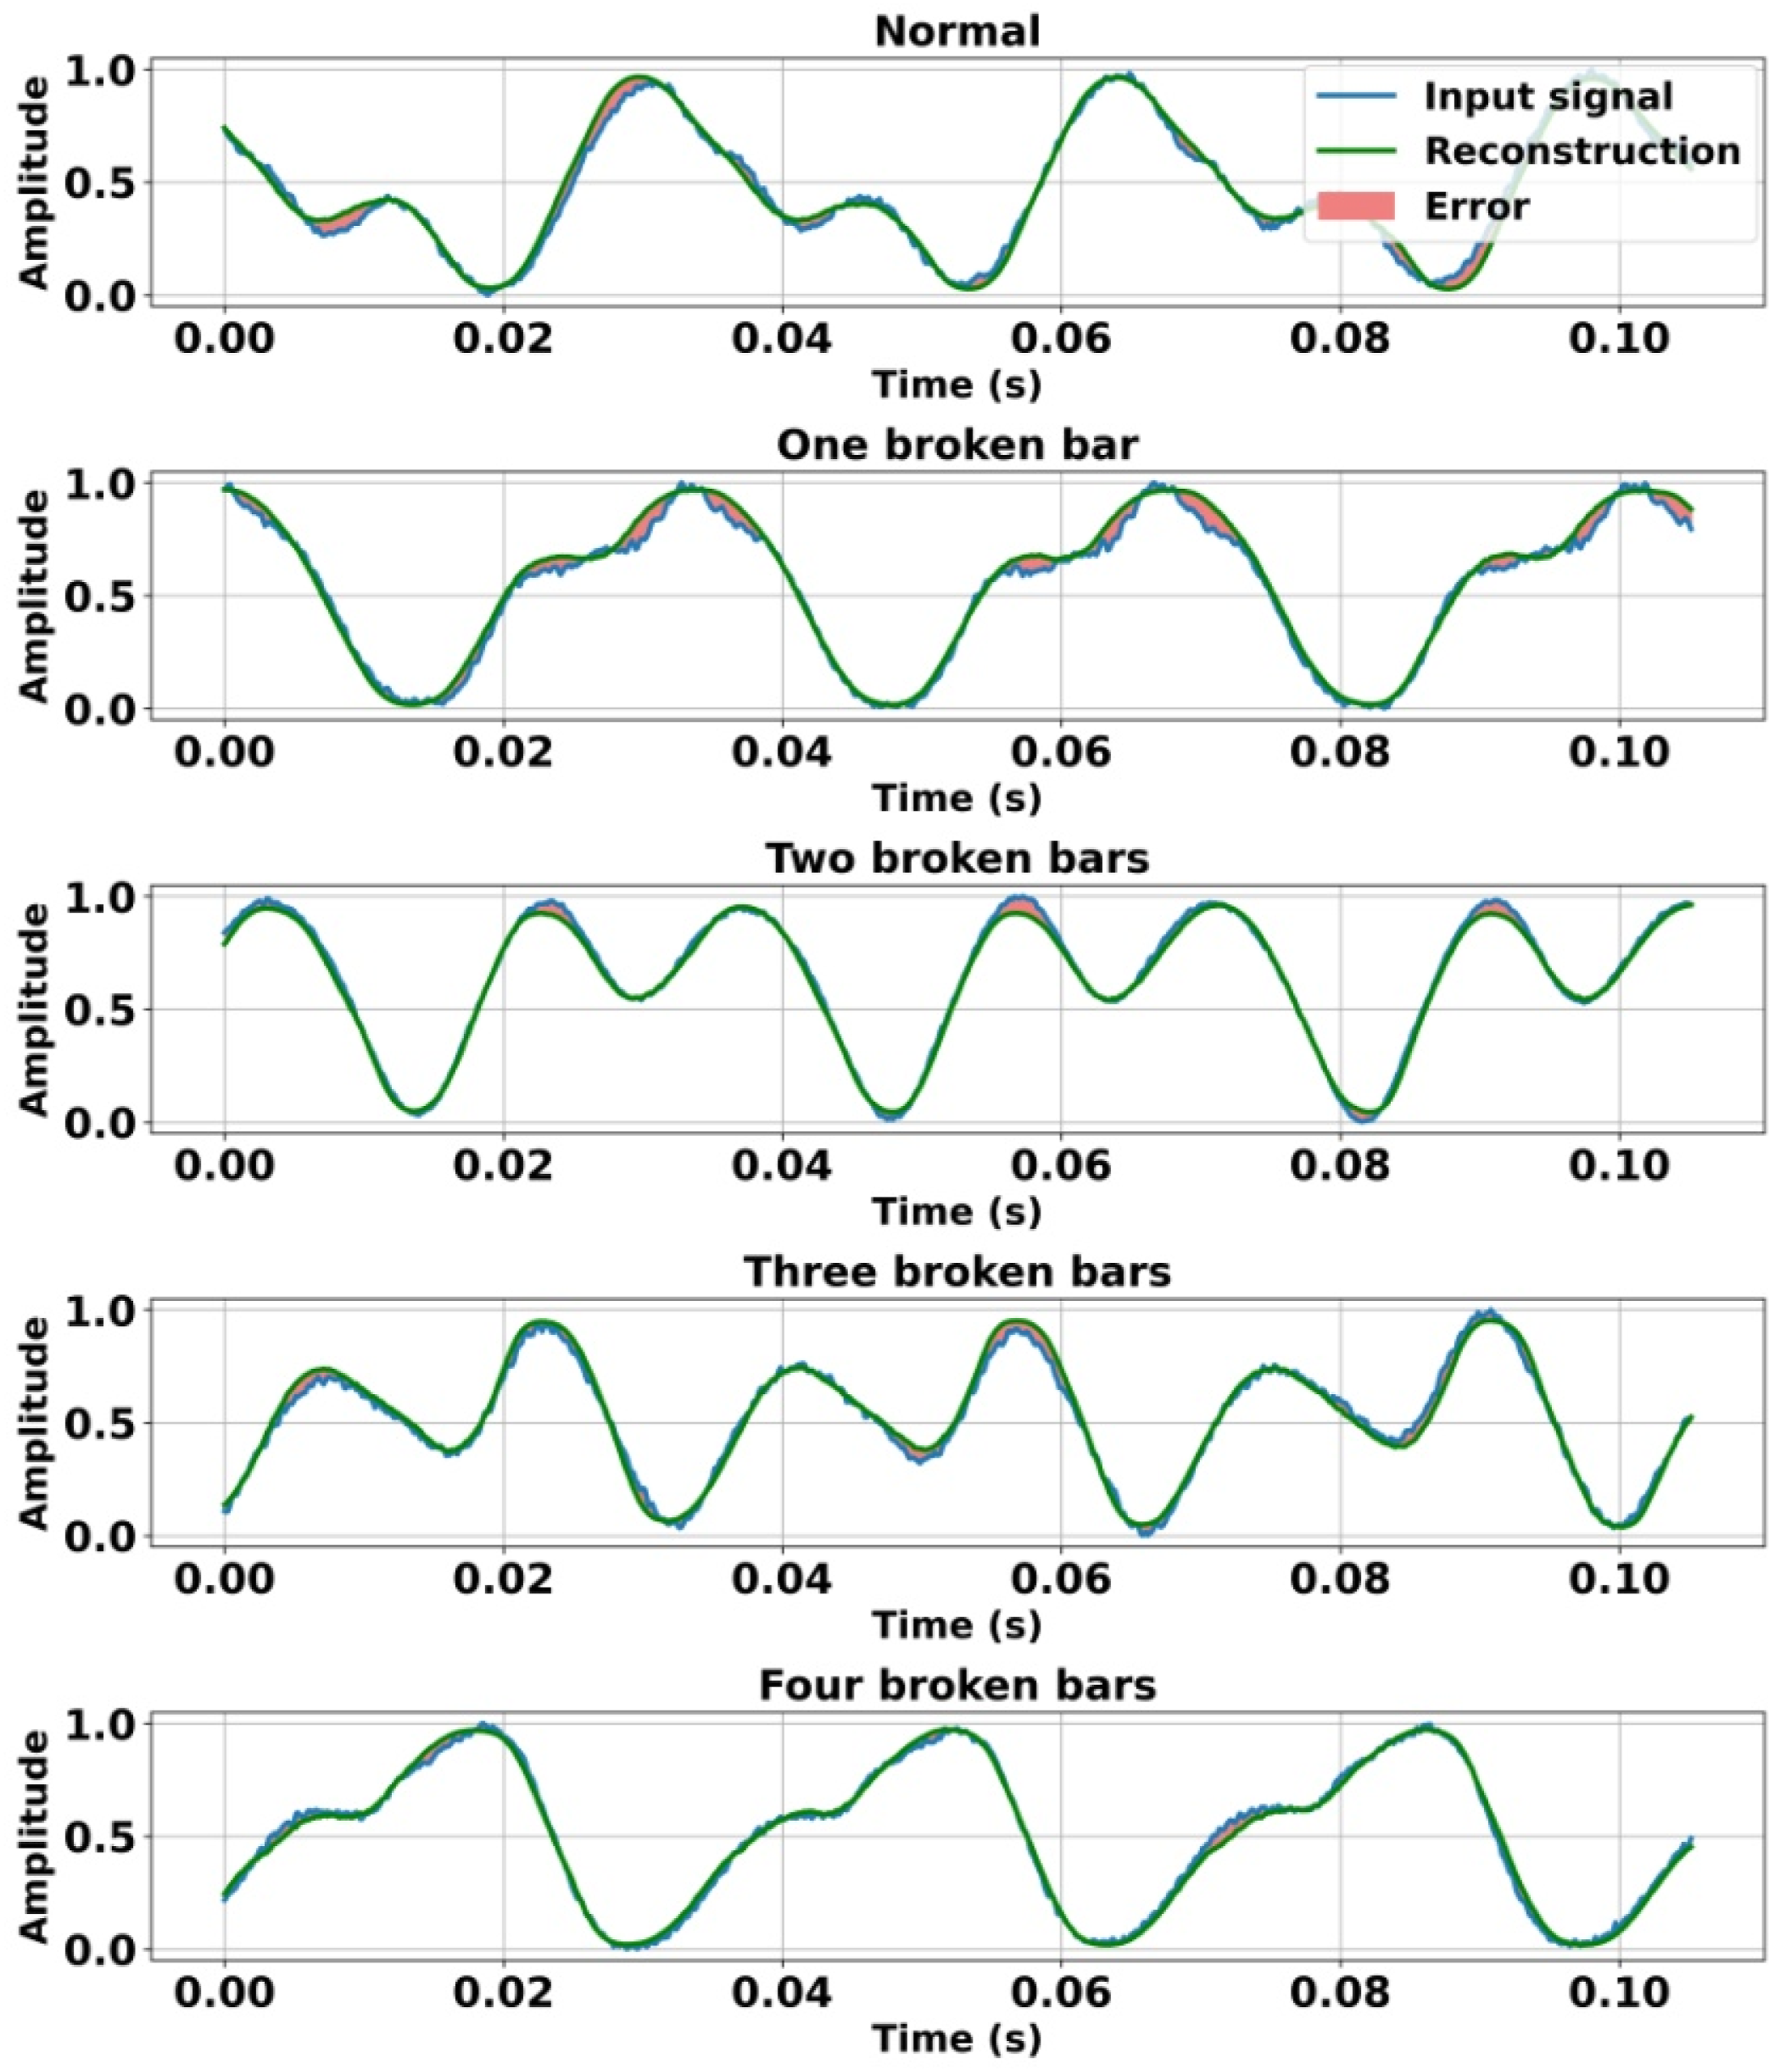
Figures 6–8 illustrate the vibration signals measured under the various operating modes considered, using a 20-dimensional latent space. Each figure superimposes the measured vibration signal and the autoencoder-reconstructed signal, along with the corresponding reconstruction error. This representation provides a clear visual evaluation of the model’s reconstruction capability. Furthermore, the reconstruction error is clearly identified to highlight the differences between the measured signals and their reconstructed equivalents. These visual results confirm that the original data are accurately reproduced across all the operating modes examined. Comparison of normalized radial vibration signals measured on the driven side, the autoencoder-based reconstruction, and the associated reconstruction error under the investigated operating conditions. Comparison of normalized radial vibration signals measured on the non-driven side, the autoencoder-based reconstruction, and the associated reconstruction error under the investigated operating conditions. Comparison of normalized axial vibration signals measured on the driven side, the autoencoder-based reconstruction, and the associated reconstruction error under the investigated operating conditions.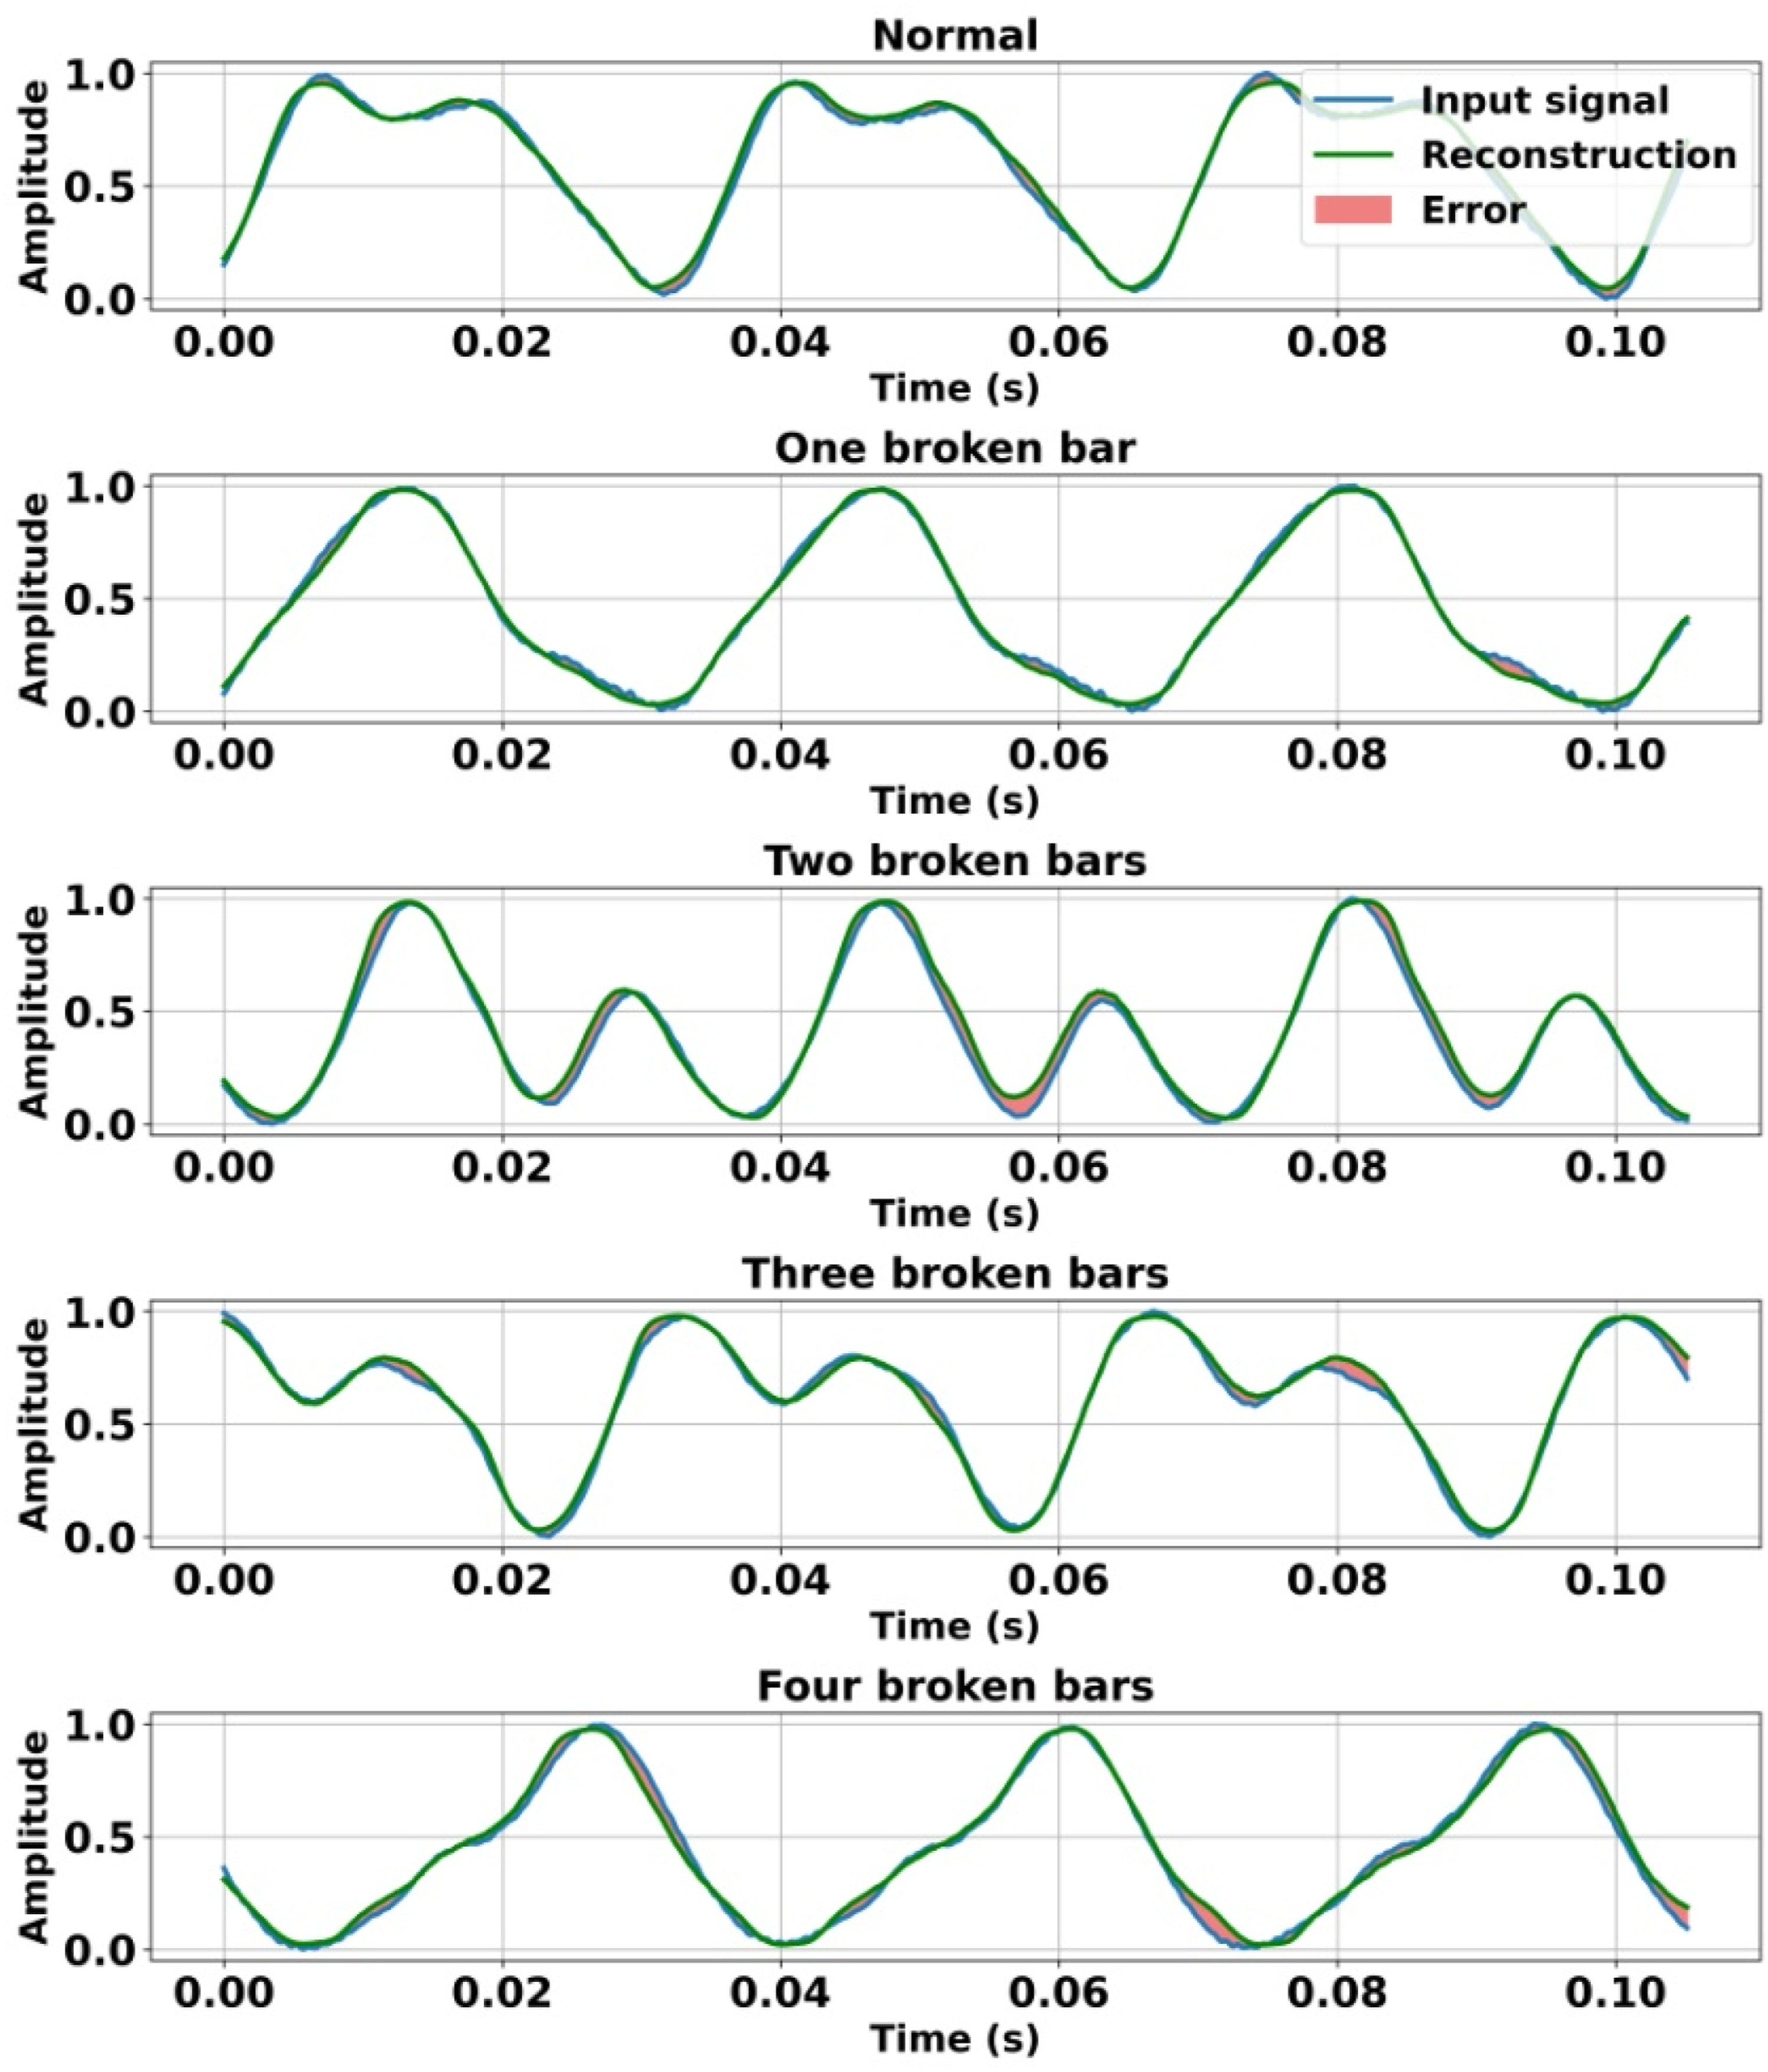
The histograms in Figure 9 illustrate the distribution of reconstruction errors on the test data for a latent space of dimension 20. To provide a more comprehensive assessment of reconstruction performance, several statistical indicators are considered, including the mean, median, and standard deviation of the reconstruction error, as well as the correlation coefficient between the original and reconstructed signals. These metrics provide a comprehensive evaluation of the reconstruction quality by quantifying both the average deviation and the similarity between the reconstructed outputs and the original signals. Overall, the results show that the latent space effectively reflects the underlying structure of the input data, enabling faithful reconstruction of the original signals. This confirms that the learned representation preserves the essential information of the input signals, in accordance with the autoencoder’s objective, thereby justifying the use of the latent space as a compact representation instead of the original high-dimensional data. Histograms of reconstruction errors on the test data: (a) radial vibrations on the driven side, (b) radial vibrations on the non-driven side, and (c) axial vibrations on the driven side.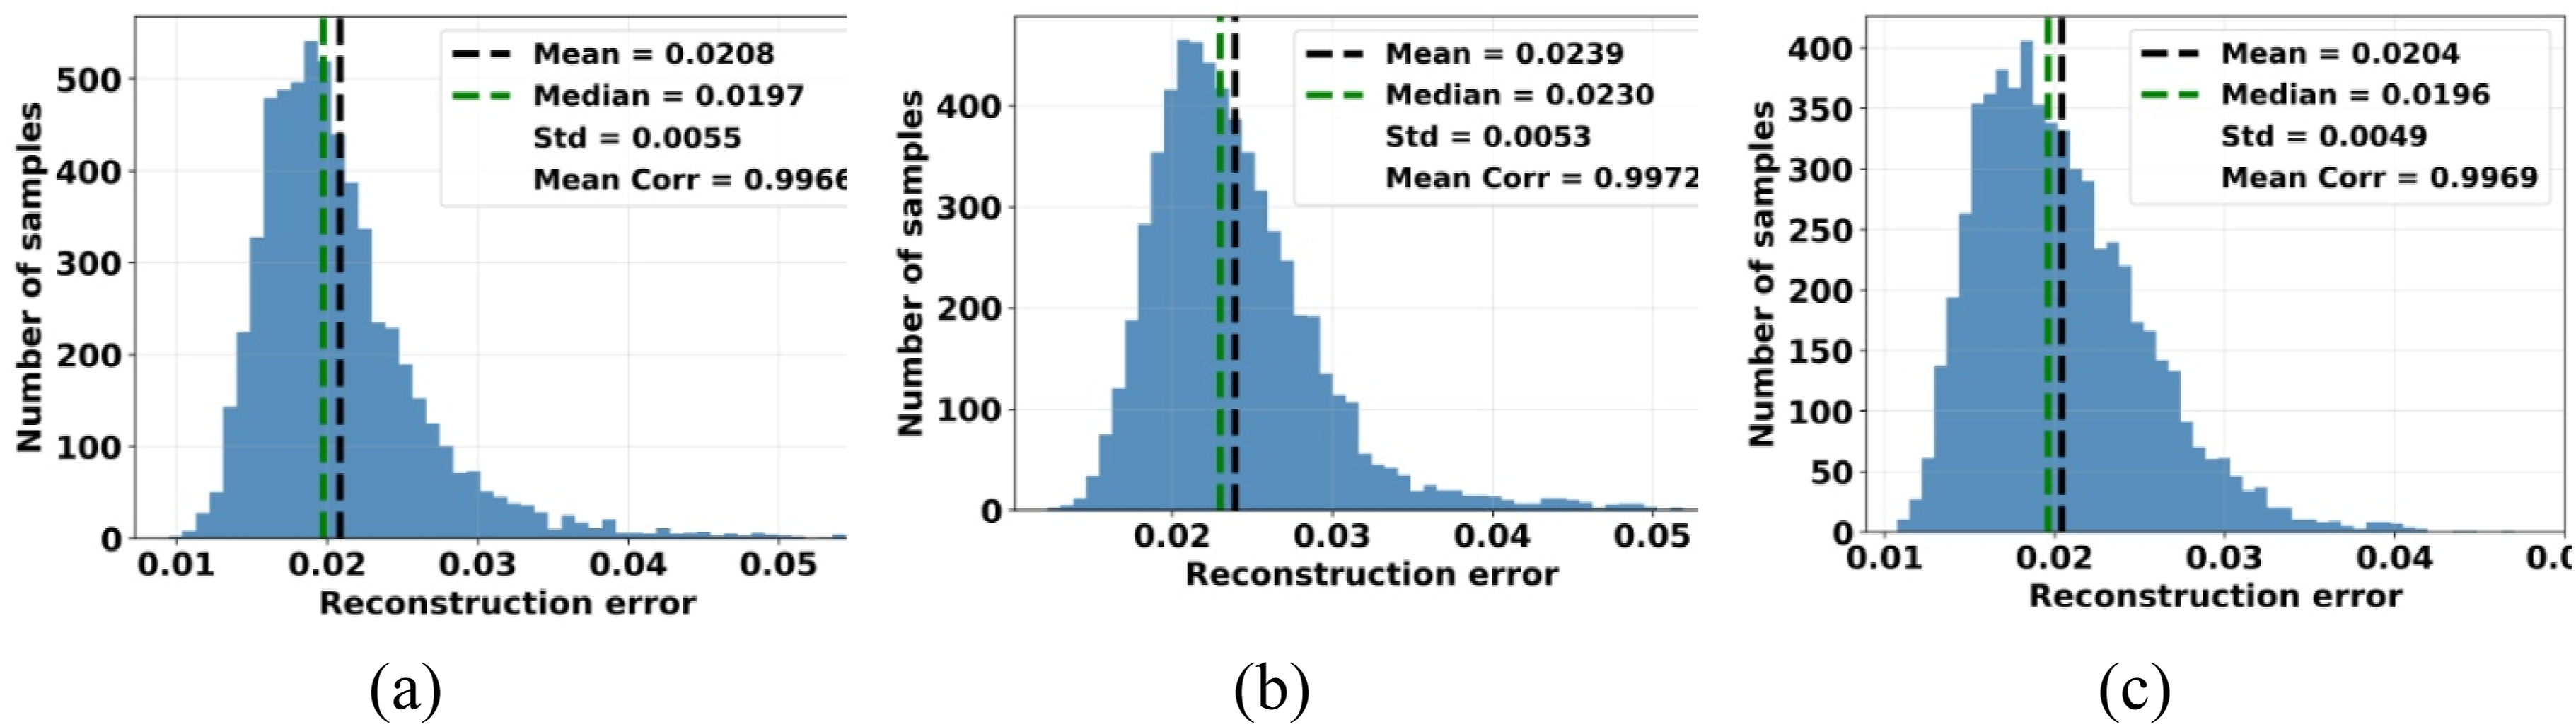
Principal Component Analysis (PCA) is used to analyze the distribution of the encoder’s latent representations. Figure 10 presents the PCA projection of the test data for a 20-dimensional latent space. Each point corresponds to a data sample, while distinct colors indicate different operating modes. The spatial proximity of the points reflects the autoencoder’s learned similarity. The results show that the different operating modes (normal and fault severity levels) can be visually distinguished, demonstrating the autoencoder’s ability to extract meaningful features from the original data during the encoding stage. As the latent representations are not linearly separable, a nonlinear kernel is required for the SVM classifier to achieve effective discrimination between the different operating modes. Principal component analysis (PCA) of the encoded test data: (a) radial vibrations on the driven side, (b) radial vibrations on the non-driven side, and (c) axial vibrations on the driven side.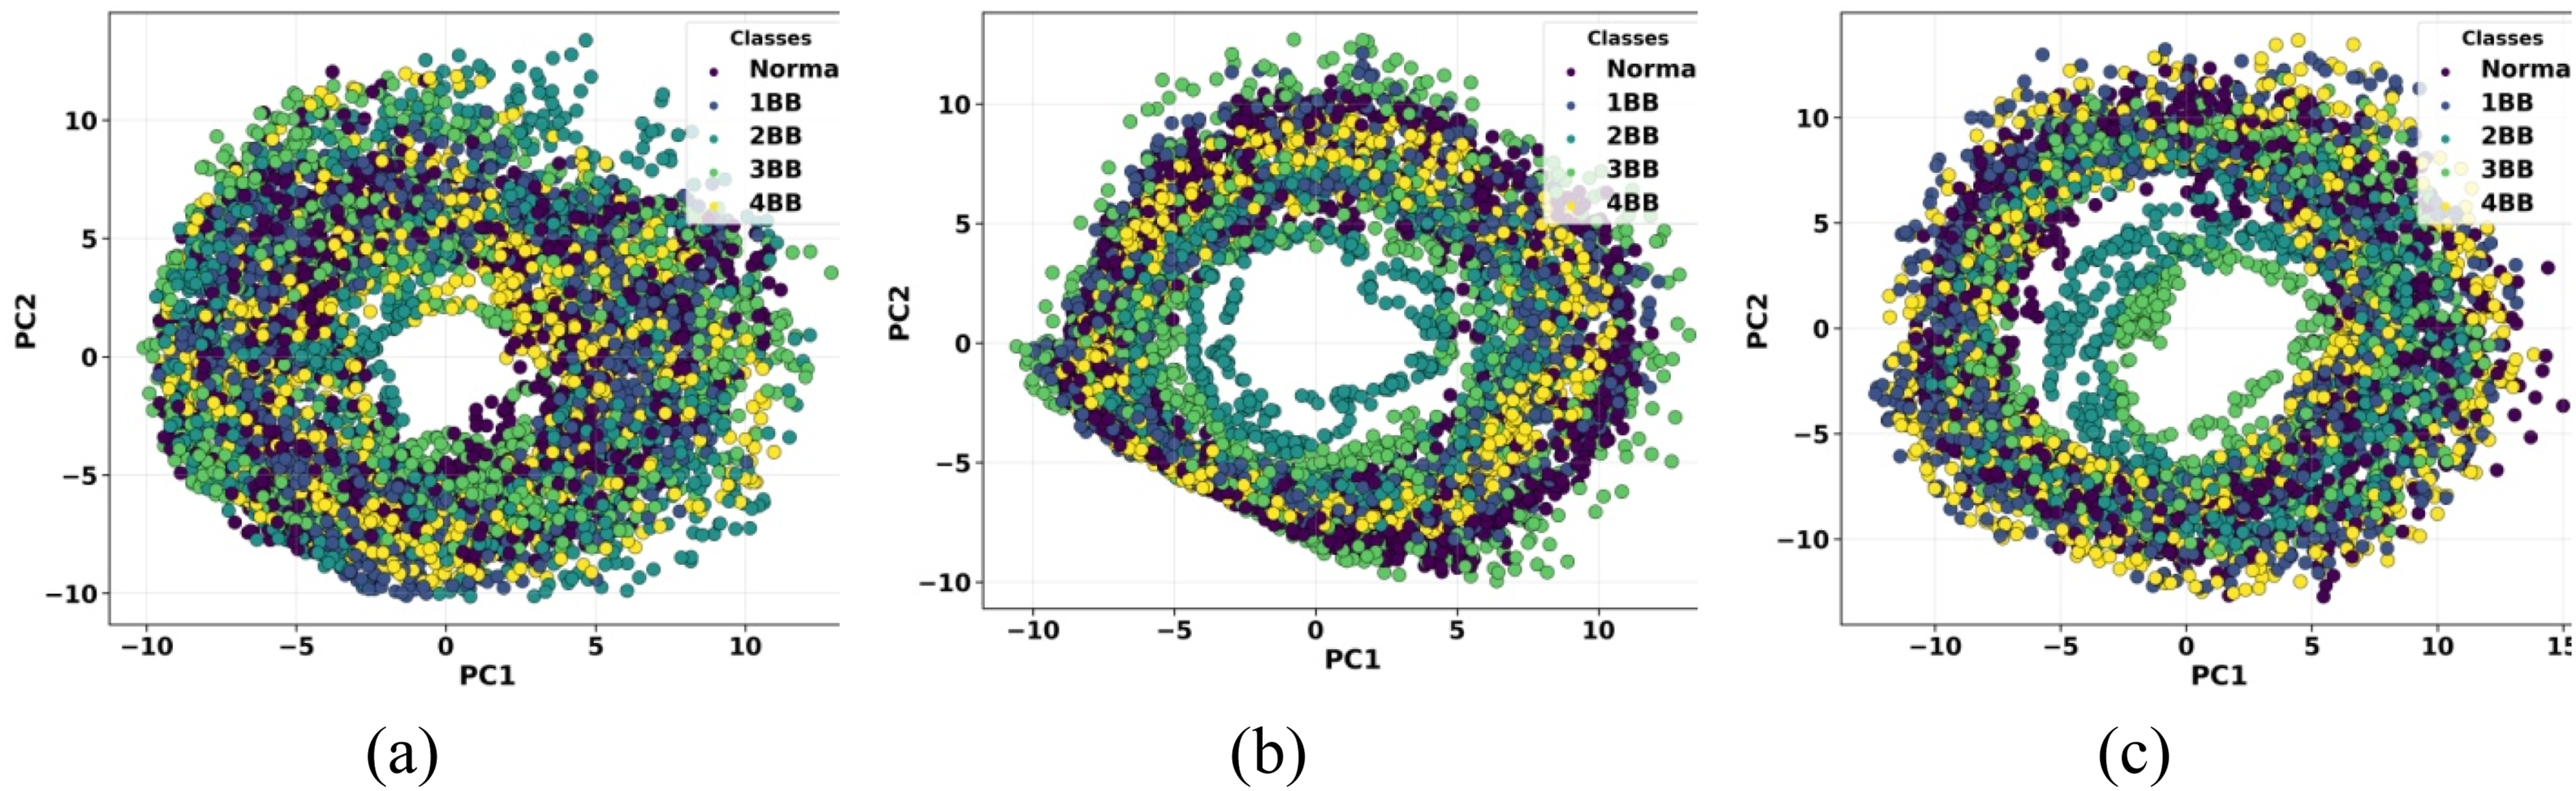
In the final stage, a Support Vector Machine classifier with an RBF kernel is trained using the latent representations as input features and the associated labels as target outputs. The SVM hyperparameters (C = 100, γ = 1/(2σ2) = 0.1) were optimized via cross-validation on the training set. The SVM implementation adopts a one-vs-one (OvO) multi-class approach for the five operating modes. The trained model is then evaluated on unseen test data to assess its classification performance and generalization ability. This evaluation validates the reliability of the SVM classifier trained on latent features extracted by the neural autoencoder.
Accuracy performance of the autoencoder–SVM approach as a function of the latent space dimensionality.
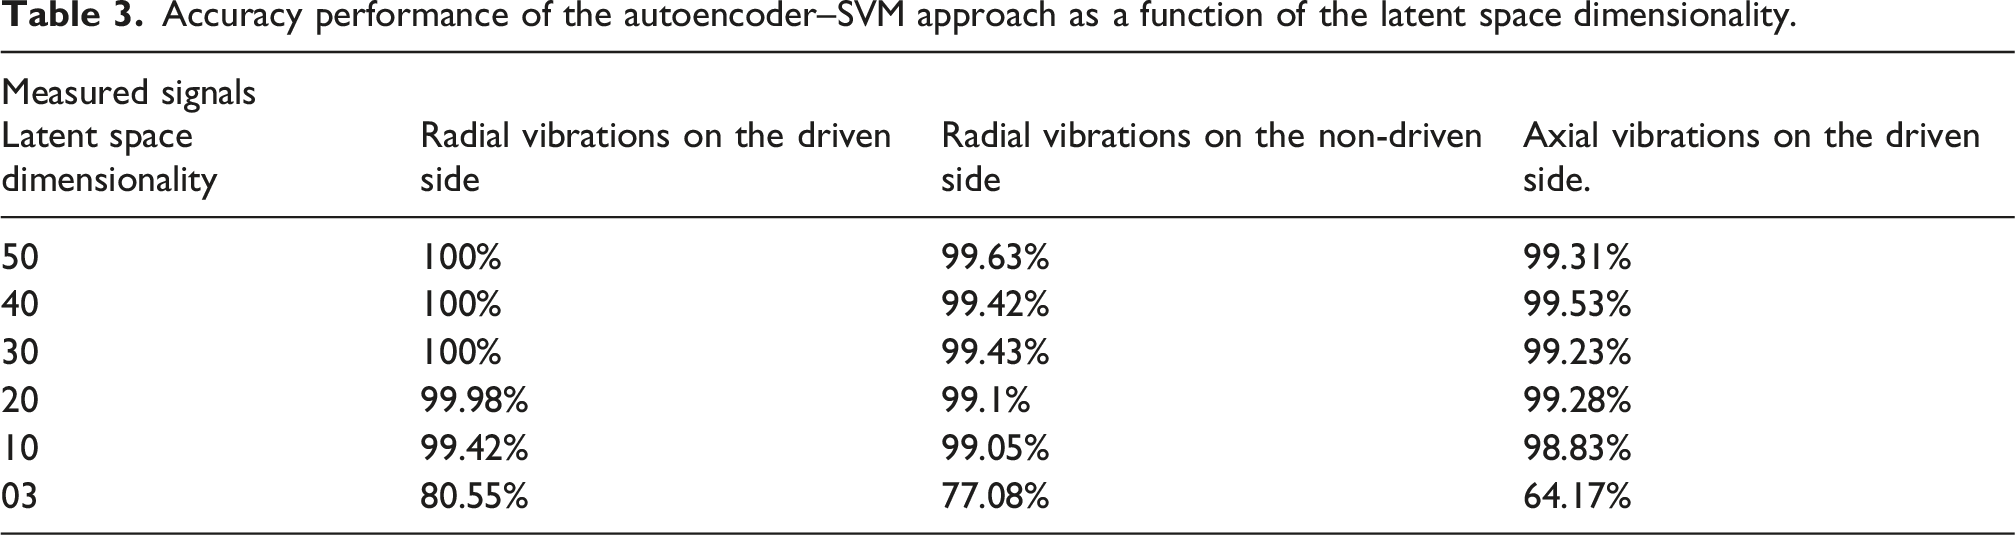
Figure 11 illustrates the confusion matrices computed on the test dataset for the three vibration signals, using an autoencoder with a 20-dimensional latent space. These matrices provide a comprehensive assessment of the SVM classifiers’ ability to accurately distinguish among the different vibration signal classes, based on their representations in the latent space learned by the autoencoder. Confusion matrices computed on the test data using the autoencoder–SVM approach with a 20-dimensional latent space: (a) radial vibrations on the driven side, (b) radial vibrations on the non-driven side, and (c) axial vibrations on the driven side.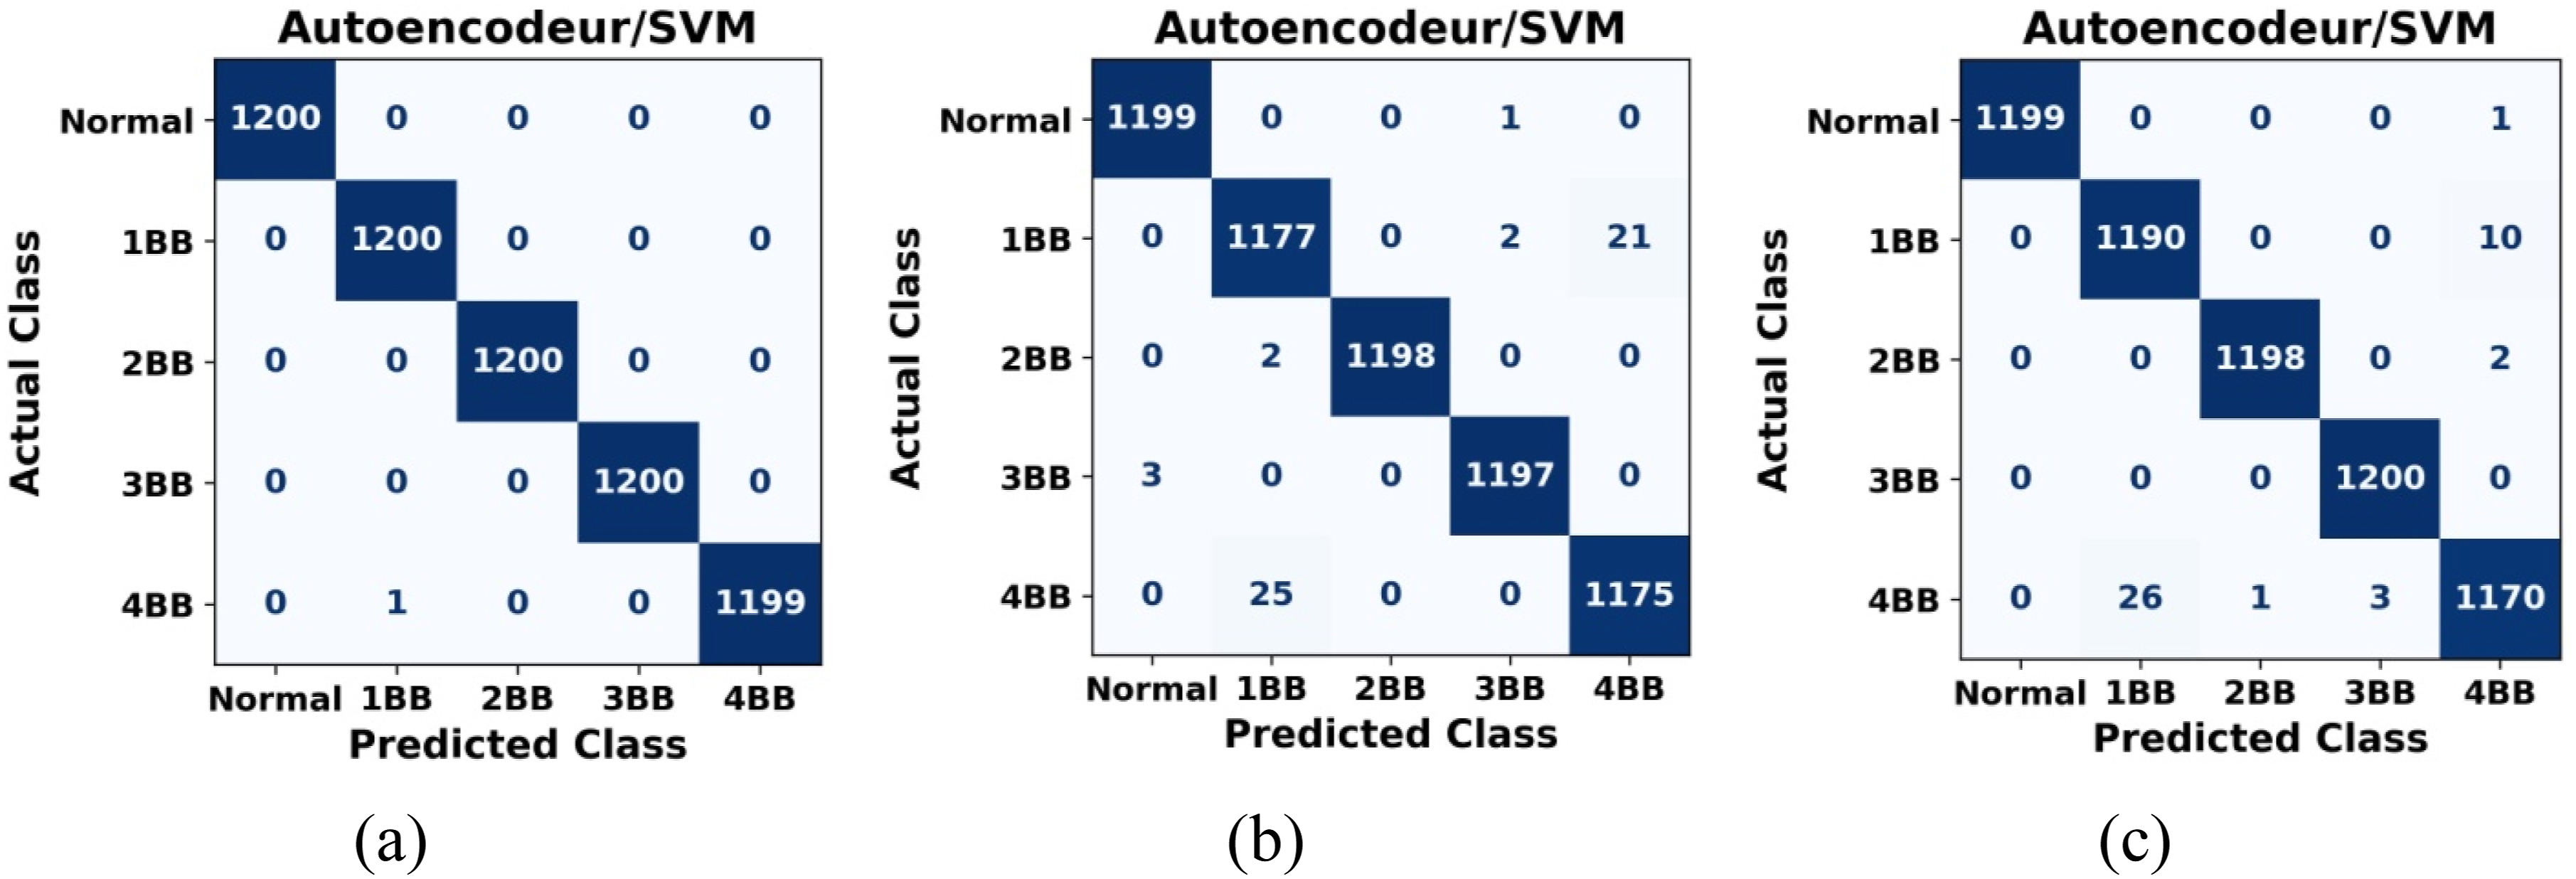
Class-wise performance comparison (%) for latent dimension of 20.
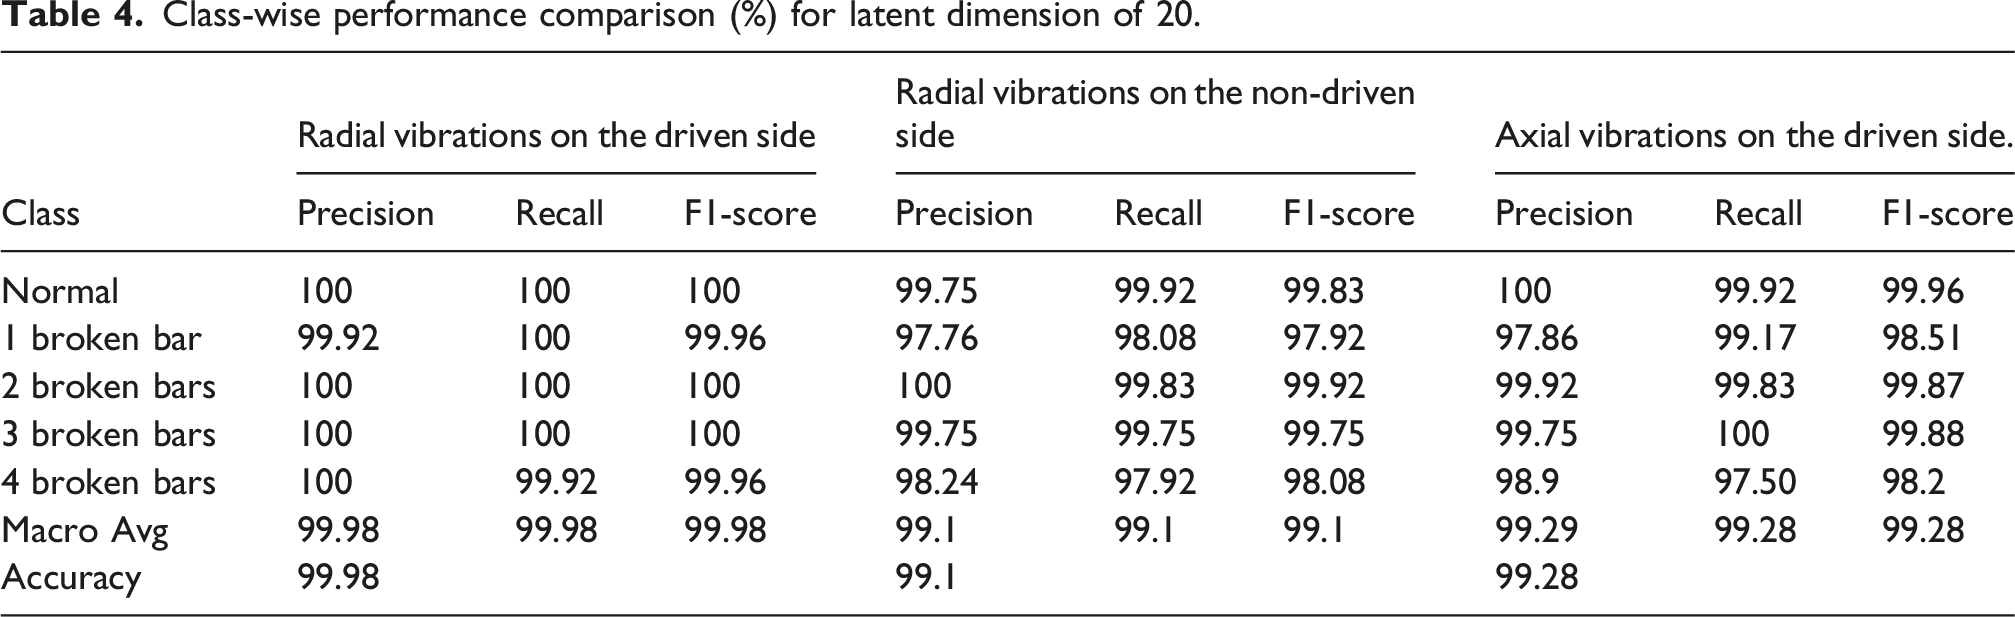
These results demonstrate that the proposed VAE–SVM framework effectively learns discriminative representations from vibration signals while maintaining high classification accuracy for the investigated operating modes. The results indicate a potential reduction in the computational complexity of the classification process while achieving improved classification performance.
Comparison results across previous studies using the same dataset.
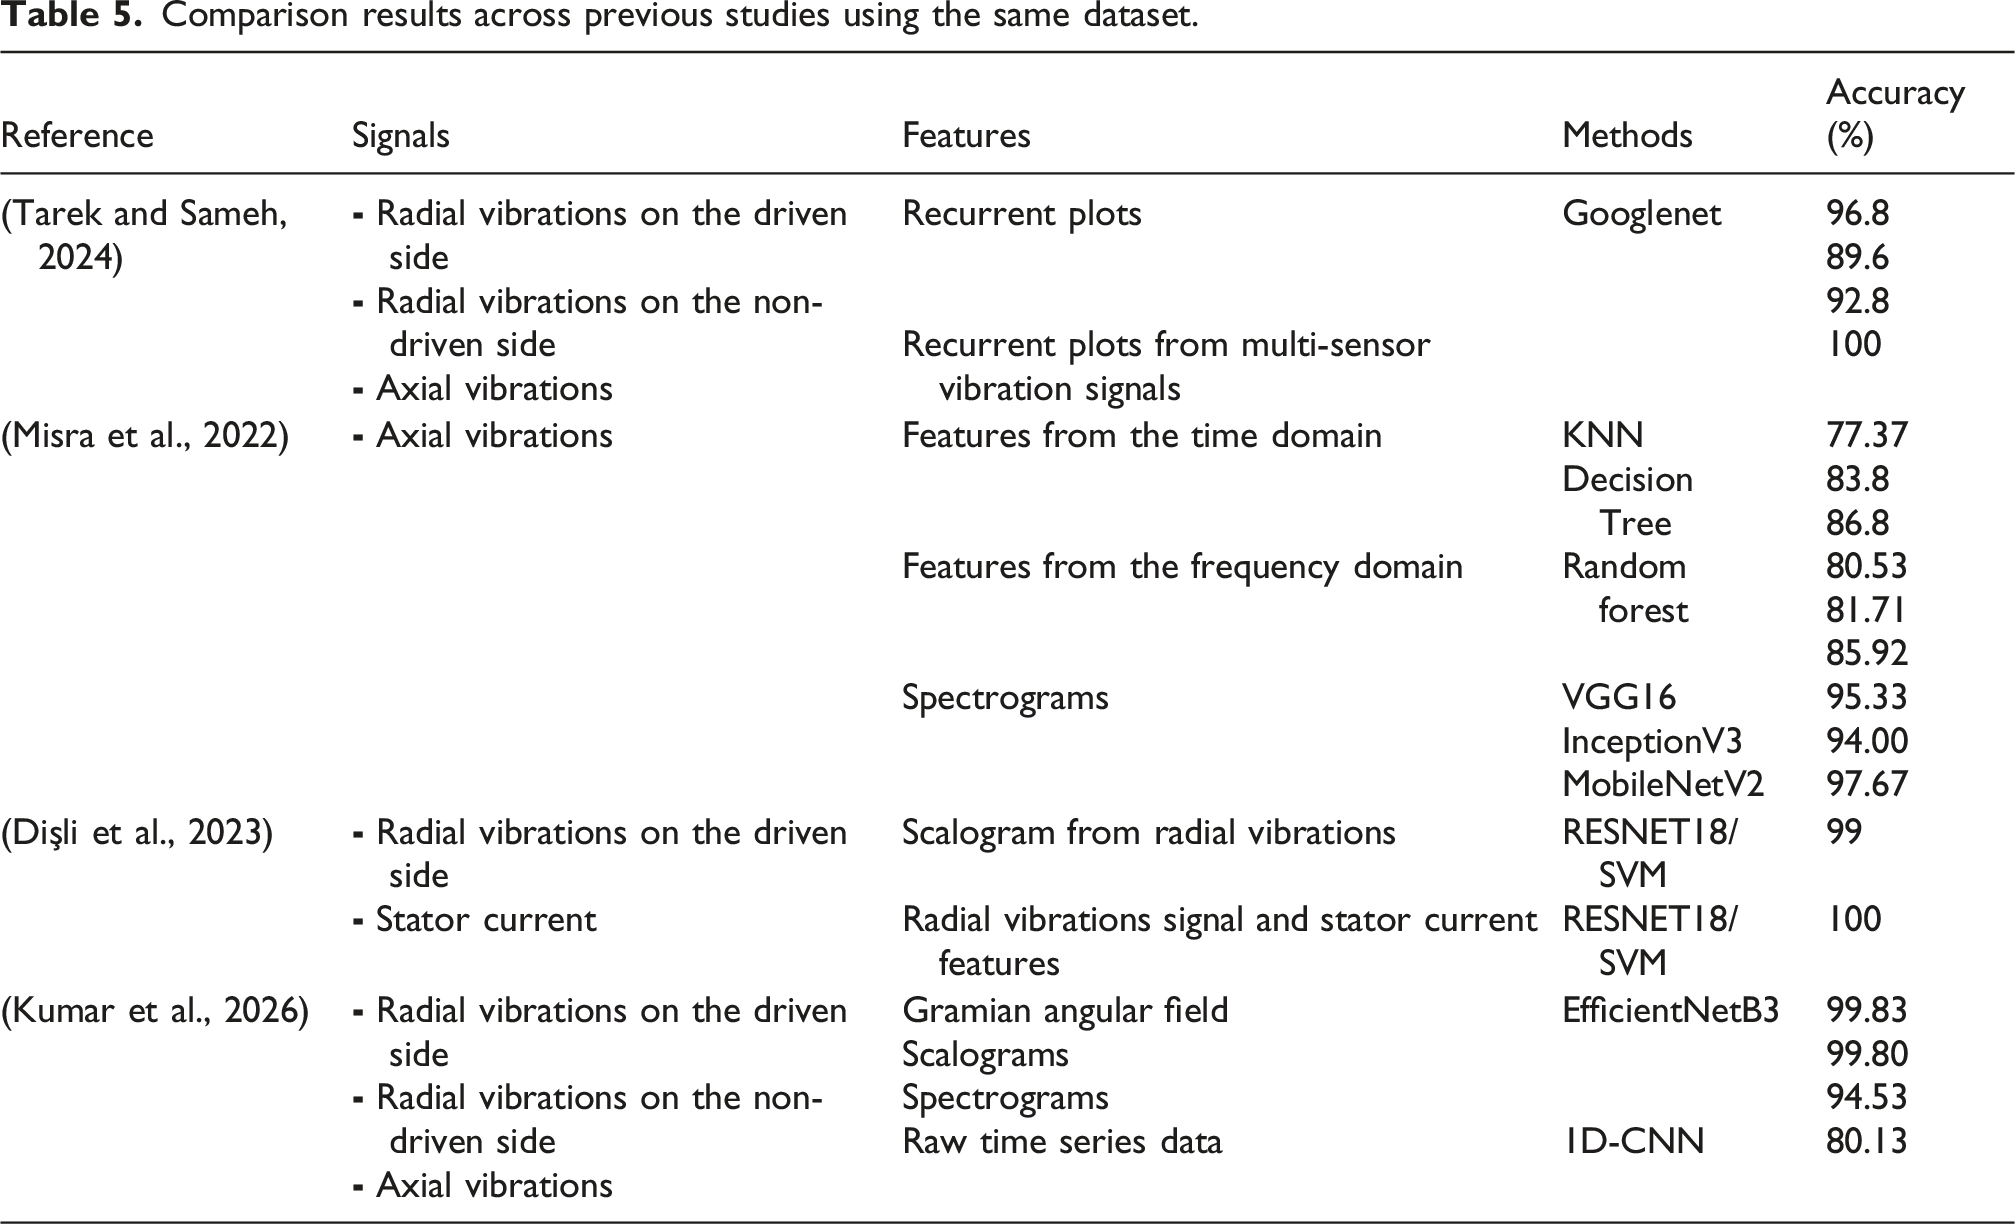
It can be observed that classical machine learning approaches based on time- and frequency-domain features exhibit lower performance, as reported by Misra et al. (2022), highlighting the limitations of manually engineered features in capturing complex fault characteristics. Deep learning approaches based on image transformations significantly improve classification accuracy but require computationally expensive preprocessing steps and large model architectures. However, methods combining convolutional neural networks with SVM classifiers or relying on multi-sensor fusion strategies, although achieving very high performance, generally increase computational cost and reduce computational efficiency.
In contrast, the proposed VAE–SVM framework achieves comparable or superior classification accuracy while operating on compact probabilistic latent representations learned directly and independently from vibration signals. By jointly performing nonlinear dimensionality reduction and feature learning, the proposed method provides an effective trade-off between diagnostic accuracy, computational efficiency, and model generalization. These results confirm the robustness and practical suitability of the proposed approach.
5. Conclusion
In this study, a VAE-SVM approach was proposed for the automatic detection and classification of broken-bar faults in three-phase induction motors. Variational autoencoders were employed to extract informative latent features from vibration signals while simultaneously reducing data dimensionality. These latent representations were subsequently used as inputs for Support Vector Machine classifiers to evaluate fault classification under the considered operating conditions.
The results show that the proposed VAE-SVM framework effectively captures the essential characteristics of vibration signals and enables accurate classification of normal operating conditions and broken bar fault severity levels. Classification accuracies remained high for latent spaces with dimensions up to 10, while a noticeable performance degradation occurred for very low-dimensional representations. The SVM classifier demonstrated good discriminative capability across the different studied fault classes, reflecting the usefulness of the learned latent features.
Overall, integrating VAEs as an automatic feature-extraction and dimensionality-reduction stage significantly reduces the complexity of the classification process and eliminates the need for manual feature engineering. However, the evaluation in this study is limited to a publicly available dataset under controlled experimental conditions. While the results confirm the approach’s effectiveness under these conditions, further investigations are required to assess its robustness in more realistic industrial scenarios, including variable-speed operation, noisy environments, and different machine types.
Future work will focus on improving generalization by considering a wider range of operating conditions and extending the framework to multi-fault and more complex fault scenarios. In addition, the proposed approach will be evaluated using different types of measured signals (electrical and acoustic signals) across various industrial processes.
Footnotes
Acknowledgements
The author expresses his sincere gratitude to the Laboratory of Intelligent Automation of Processes and Systems and the Laboratory of Intelligent Control of Electrical Machines, School of Engineering of São Carlos, University of São Paulo (USP), Brazil, for providing access to the open-source database.
Funding
The author received no financial support for the research, authorship, and/or publication of this article.
Declaration of conflicting interests
The author declared no potential conflicts of interest with respect to the research, authorship, and/or publication of this article.