
Abstract
Cavitation generates abnormal excitation force in the internal flow field of the water-jet pump, and then induces the vibration of the pump body, which will directly threaten the navigation safety, stealth performance, and equipment service life of the ship. To accurately reveal the vibration mechanism of water-jet pump under different cavitation stages, the vibration acceleration signals of guide vane bearing foot and elbow bearing foot of water-jet pump are collected through vibration test, and the vibration characteristics of water-jet pump along the X-axis, Y-axis, and Z-axis are systematically analyzed. The findings indicate that the vibration acceleration spectrum characteristics are significantly affected by the cavitation intensity. The amplitude of the dominant frequency in the low frequency band is related to the frequency of the impeller blades, while the broadband signals in the high-frequency band are induced by cavitation. Additionally, the signal intensity of each frequency band increases with the development of cavitation, but the vibration acceleration is partially suppressed during the first critical cavitation stage. According to the analysis of vibration acceleration energy, the vibration energy at different measurement points and in different directions exhibits an upward trend with the cavitation development, but the variation pattern is different. These research outcomes offer critical experimental data and theoretical backing for studying cavitation-induced vibration mechanisms, and hold direct engineering significance for the design of water-jet systems.
Keywords
1. Introduction
As a propulsion device based on the fluid reaction force principle, the water-jet pump (WJP) is widely used in high-speed patrol craft, amphibious landing vessels, and marine scientific research vessels due to its advantages of high propulsion efficiency, excellent maneuverability, and superior anti-cavitation capability (Long, 2018; Park et al., 2005), playing a key role in maritime transportation, national defense security, and recreational shipping (see Figure 1 for WJP-equipped vessels). Application of WJP in high-performance ships.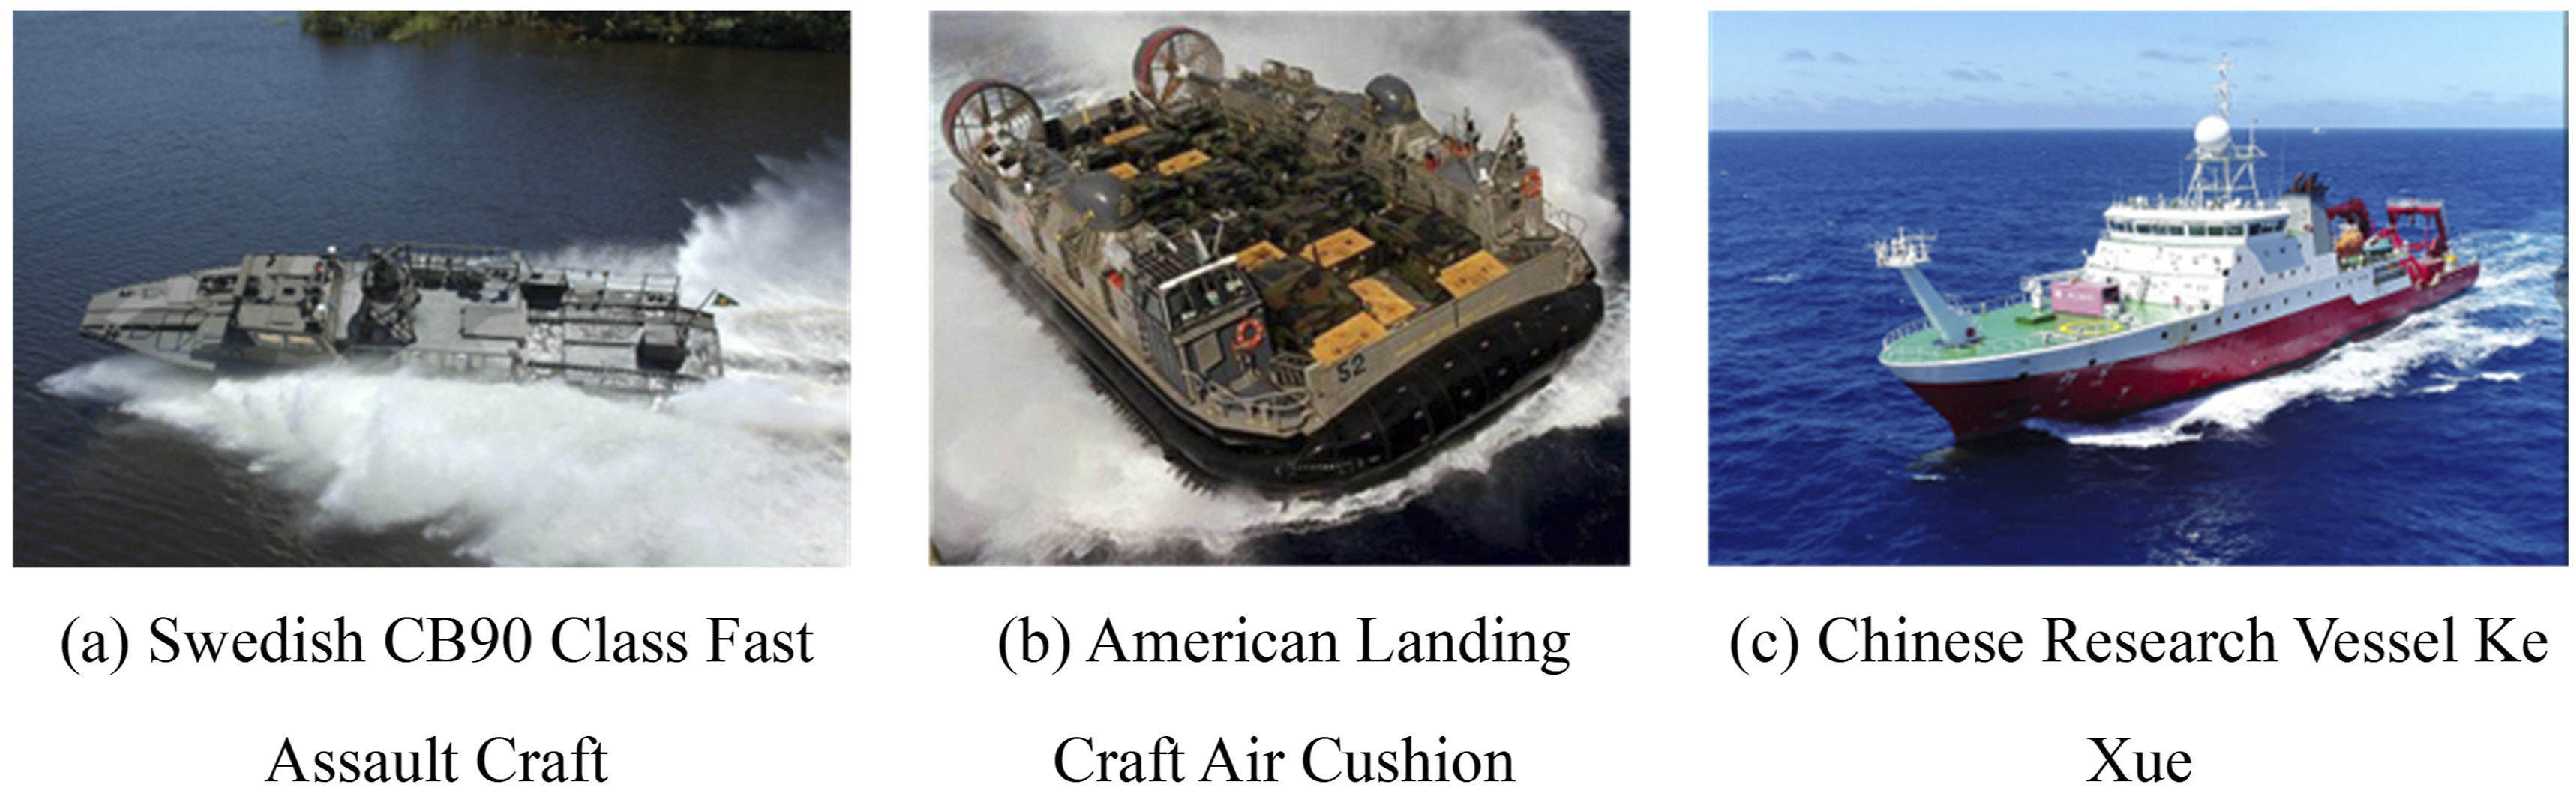
However, the WJP still faces cavitation challenges during operation. As a typical hydrodynamic phenomenon in rotating machinery, cavitation’s dynamic evolution directly induces intense fluid excitation force, threatening WJP’s stable operation. Resonance is easily triggered when the excitation frequency matches the pump body’s natural frequency, leading to structural faults such as bearing foot abnormal vibration and shaft offset.
Flow characteristics are a core factor influencing pump vibration response. Zou et al. (Zou et al., 2025) used EMD-AR modeling to show that EMD-AR spectrum amplitude increases with centrifugal pump rotary shaft seal degradation, providing a reliable diagnostic indicator. Zhang et al. (Zhang et al., 2025) experimentally collected PAT vibration data under different operating conditions and conducted time-frequency analysis, finding vibration intensity rises with flow rate, with most energy concentrated at BPF and its harmonics. Tong et al. (Tong et al., 2025) established a multi-scale FSI model for pump-turbines and simulated two-way FSI under 52–58% rated load (most vibration-prone), revealing clearance flow exerts additional excitation on the runner, amplifying crown and band vibration by 4.8 and 6.1 times, respectively; neglecting this causes significant prediction errors. Mao et al. (Mao et al., 2025) investigated air-water two-phase flow in a pump inducer, identified five flow patterns, and found flow regime transitions and higher gas volume fractions exacerbate performance degradation and vibration, especially at 2–8 times the inducer’s rotational speed.
These studies explored flow-vibration correlation in general pumps, focusing on fault feature identification, diagnostic technology, and structural vibration reduction as key directions for stability improvement. Lu et al. (Lu et al., 2025) observed persistent intense 6–9 kHz signals during centrifugal pump rotating stall, with low-frequency amplitude positively correlated with stall progression and a characteristic frequency of 12 times shaft speed. Gazzar et al. (Gazzar et al., 2025) found vortices significantly increase BPF-near vibration in mixed-flow pumps, with sudden spikes as vortex markers. Garousi et al. (Garousi et al., 2024) showed statistical indicators (skewness, kurtosis) input into an MLP algorithm can accurately classify centrifugal pump faults (e.g., impeller defects and cavitation). Xue et al. (Xue et al., 2025) found radial bearings in the HLD307-LJ-150 pump turbine exhibit higher vibration amplitude (up to 120 μm) and velocity (15 mm/s at 920 r/min) than combined bearings. Ma et al. (Ma et al., 2025) optimized a 7.5 kW marine pump motor, showing shortening shaft extension reduces vibration, rolling bearings have poor damping, and a water-cooled, fanless permanent magnet rotor cuts SF-related vibration by over 40%.
Notably, research on water-jet pumps (WJPs) is scarce, and cavitation-induced vibration is their primary operational threat. As a core hydraulic excitation source, cavitation degrades pump performance and affects multi-dimensional flow, energy loss, and noise radiation (Jia et al., 2025; Jie et al., 2022; Li and Guo, 2025; Long et al., 2023; Lu et al., 2024; Xie et al., 2025b; Yang et al., 2025), as illustrated in Figure 2 (summarizing flow evolution, vortex dynamics, energy loss, sound pressure distribution, and noise under different cavitation conditions). Existing studies show cavitation dominates impeller energy loss and disrupts vortex evolution; in critical and severe stages, it elevates broadband noise by increasing pressure pulsation spectral density at blade trailing edges and outlets. Cavitation is closely correlated with pressure pulsations, structural vibration, and acoustic radiation, and its induced excitation, noise, and fatigue damage threaten ship safety, stealth, and equipment service life (Xie et al., 2025a). Due to complex FSI mechanisms and lack of effective control, cavitation-induced excitation is a key bottleneck for WJP performance optimization and noise control. Multiple effects of cavitation (Jia et al., 2025; Jie et al., 2022; Li and Guo, 2025; Long et al., 2023; Lu et al., 2024; Xie et al., 2025b; Yang et al., 2025).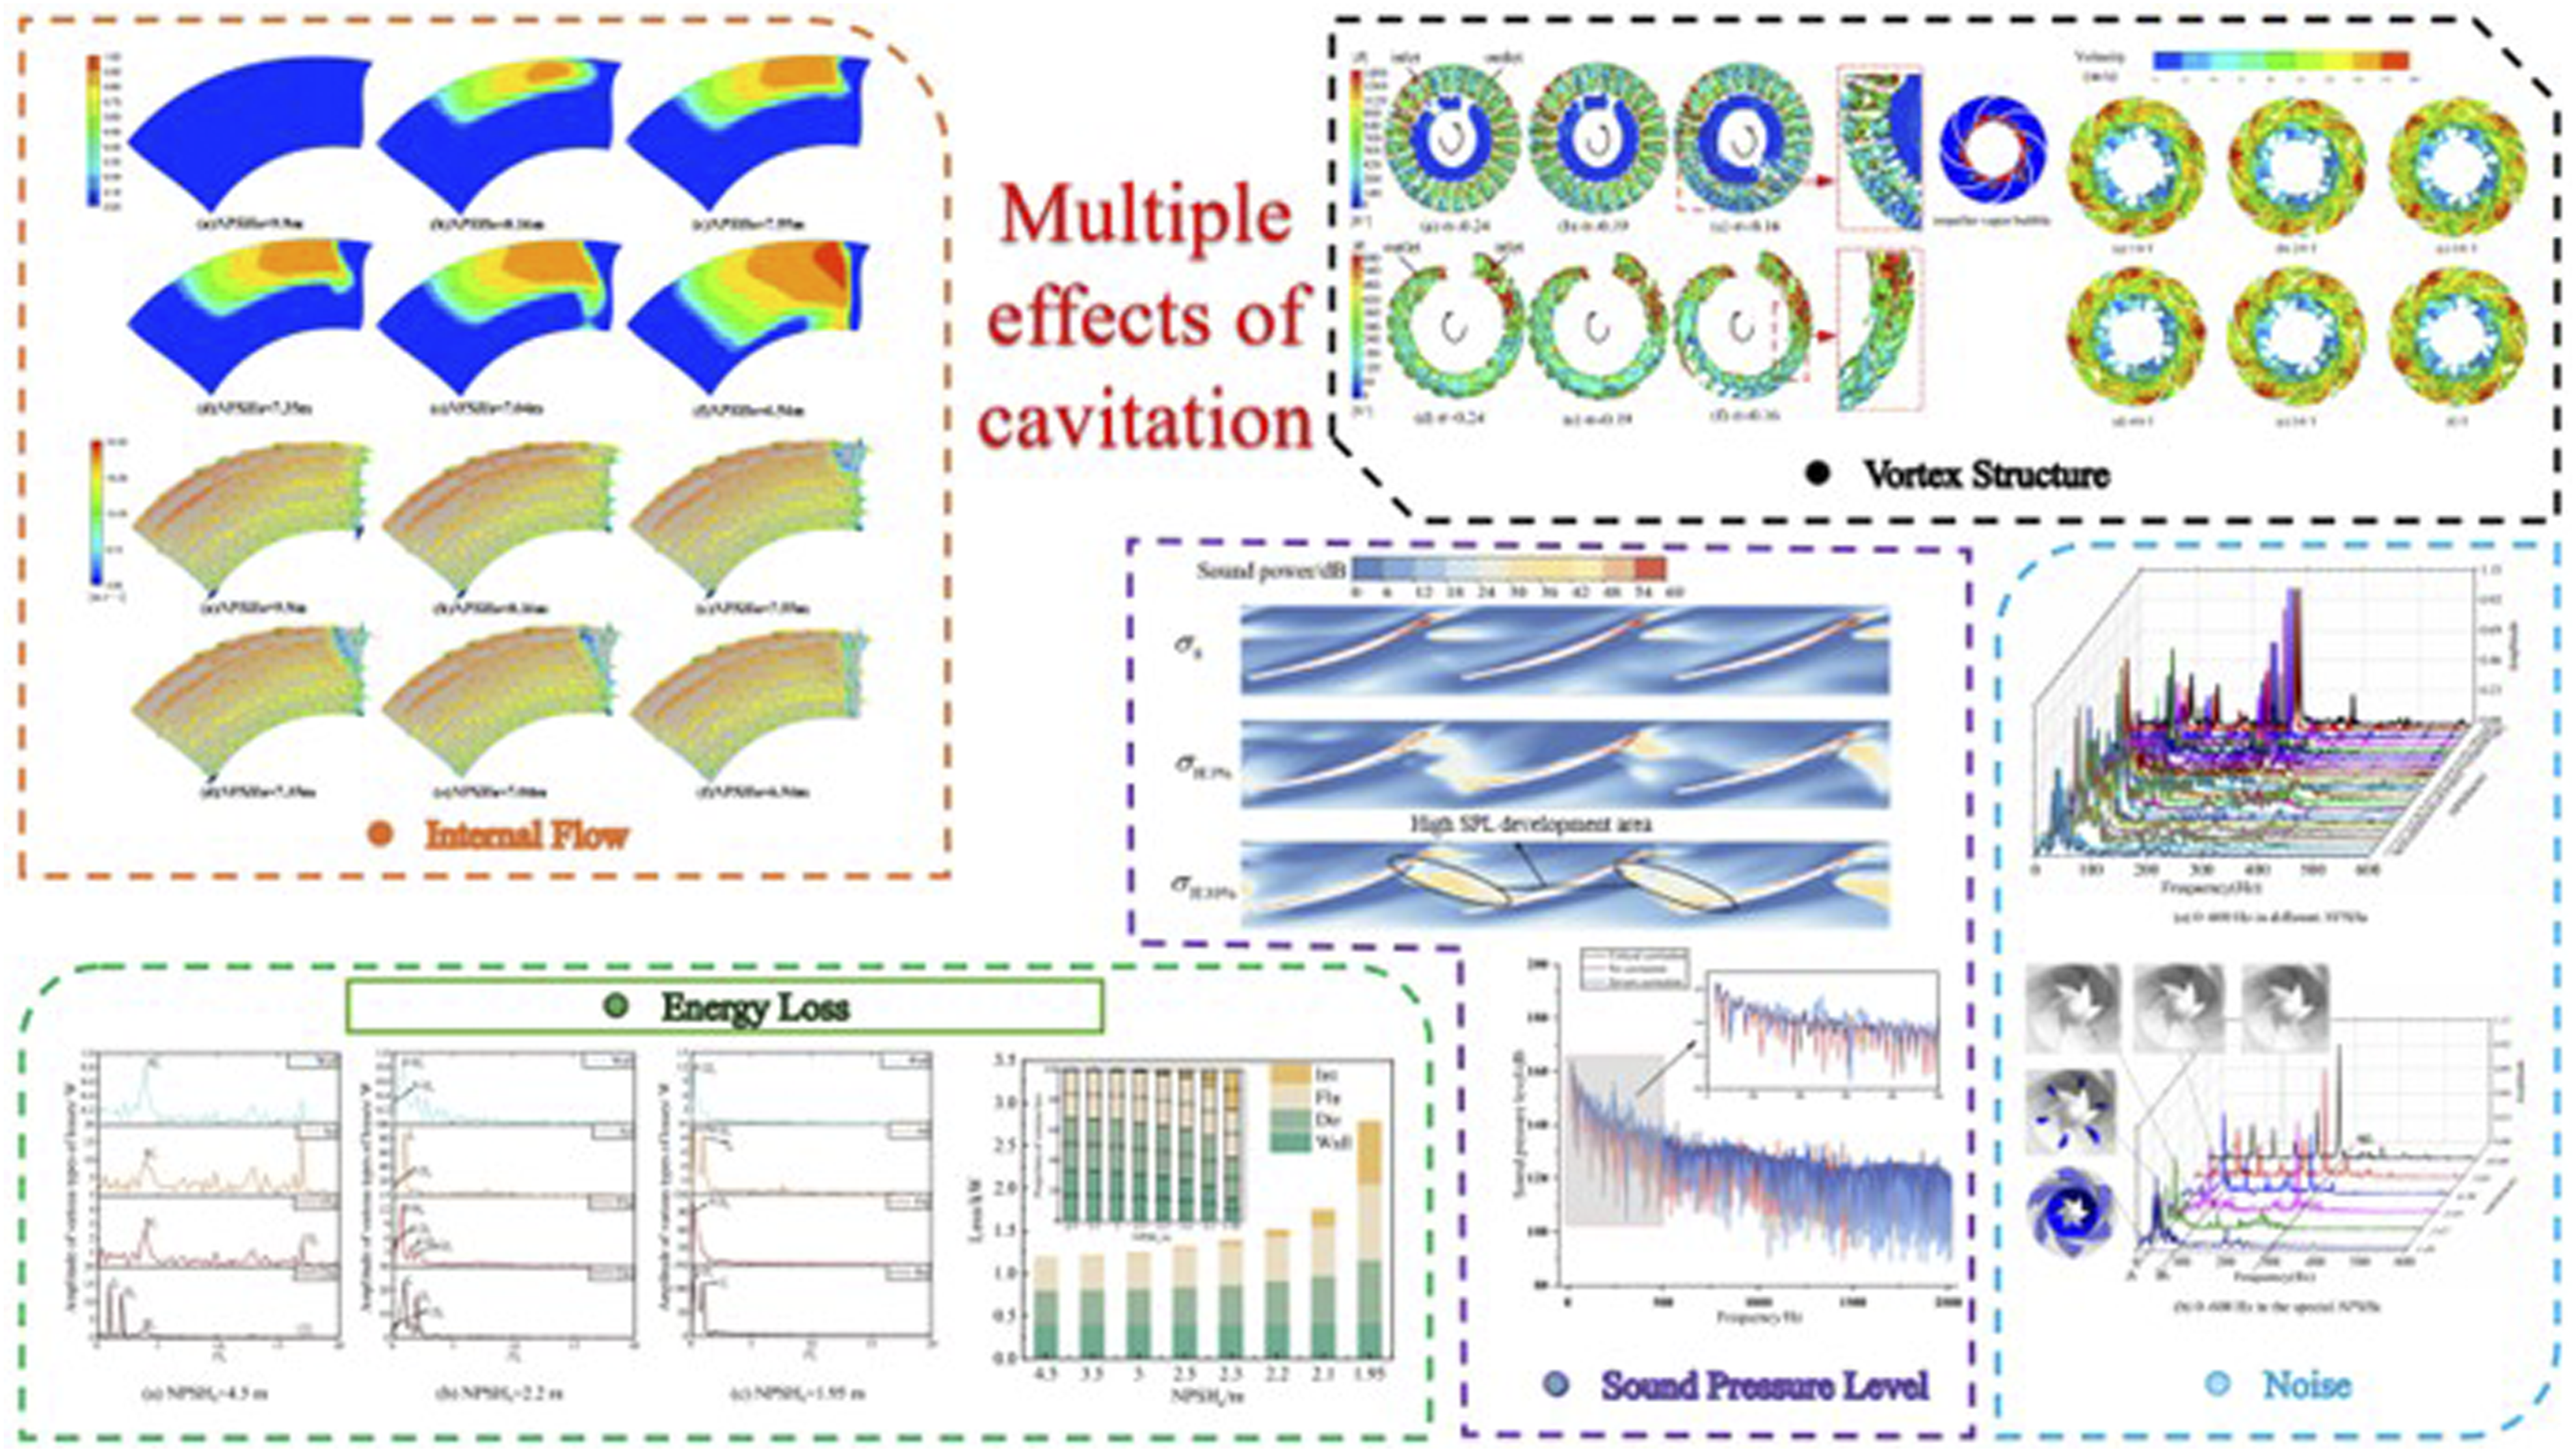
However, existing research on cavitation-induced vibration in water-jet pumps (WJPs) has two key deficiencies: lack of systematic analysis of vibration characteristics of key components (e.g., guide vanes and elbow bearing housing) throughout the entire cavitation evolution, and inadequate investigation into the correlation between cavitation development and three-dimensional vibration energy. Compared with prior studies, this work systematically explores the mid-to-low frequency vibration characteristics of a WJP across all cavitation stages. Specifically, vibration acceleration (VA) signals under various cavitation conditions are collected via tests, and the mid-to-low frequency spectral characteristics of guide vane bearing (GB) and elbow bearing (EB) in X-, Y-, and Z-axes are analyzed. Furthermore, the correlation between hydraulic factors and vibration energy is explored, and the variation law of three-axis vibration energy of the two bearing feet with cavitation development is revealed. This study provides theoretical support for mitigating WJP cavitation-induced vibration by clarifying its mechanism.
2. Experiment setting
2.1. WJP model
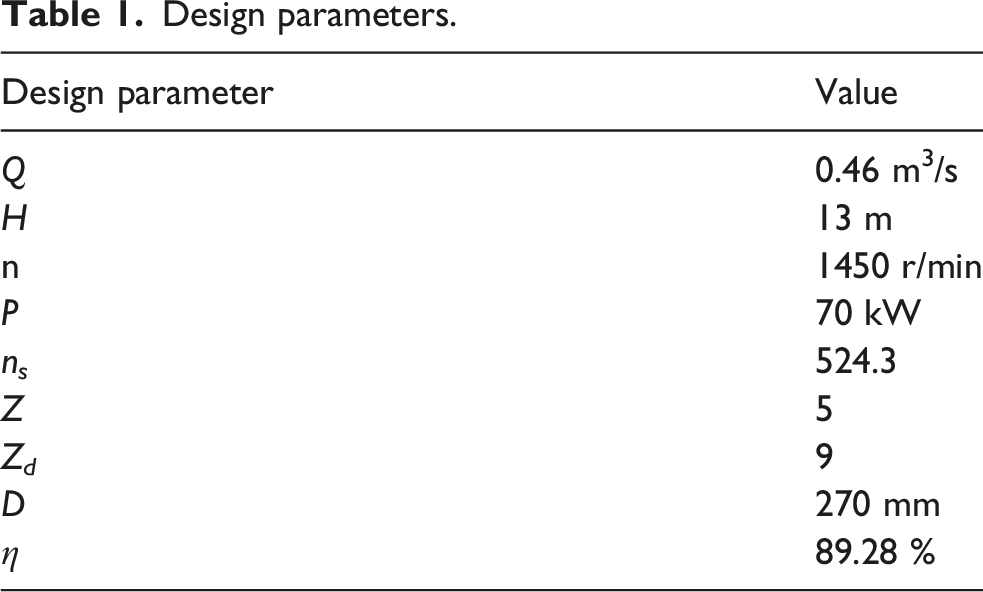
Design parameters.
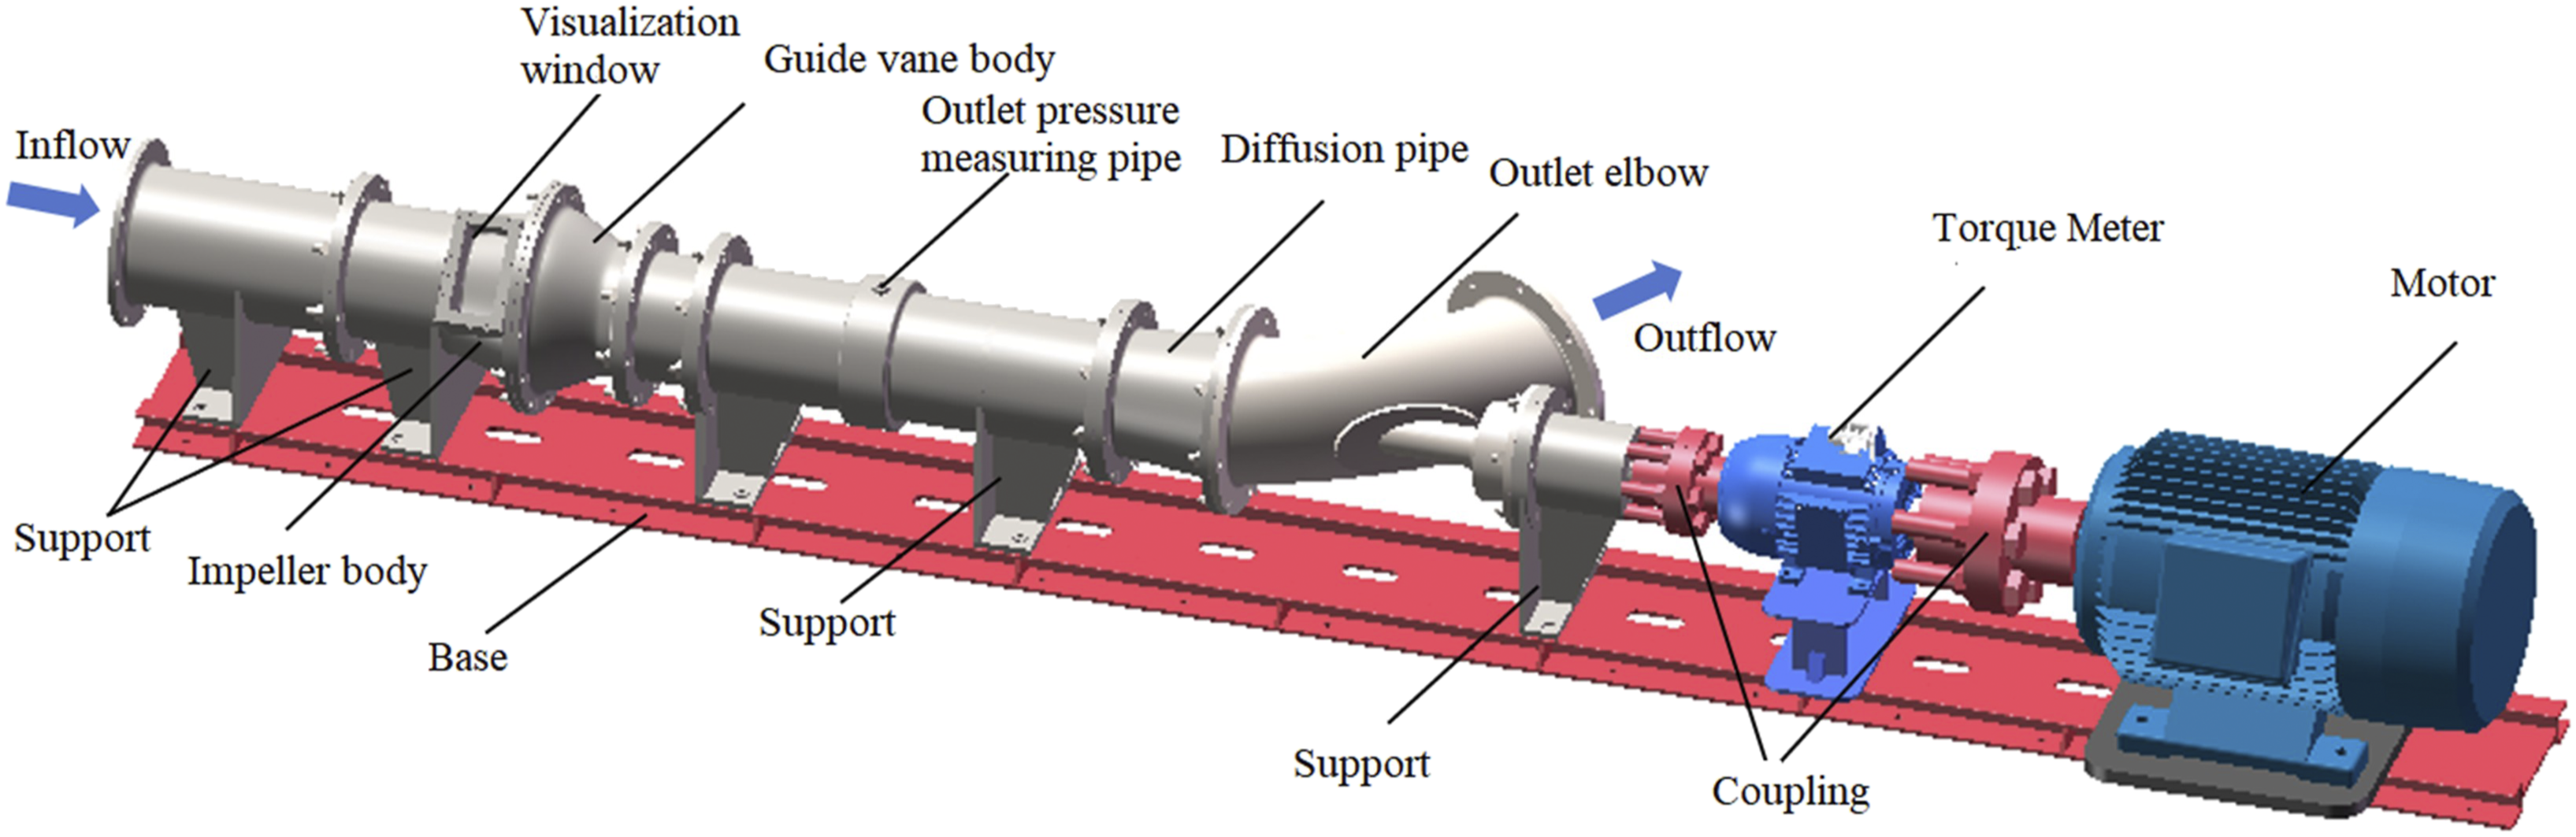
3D diagram of the model pump and test section.
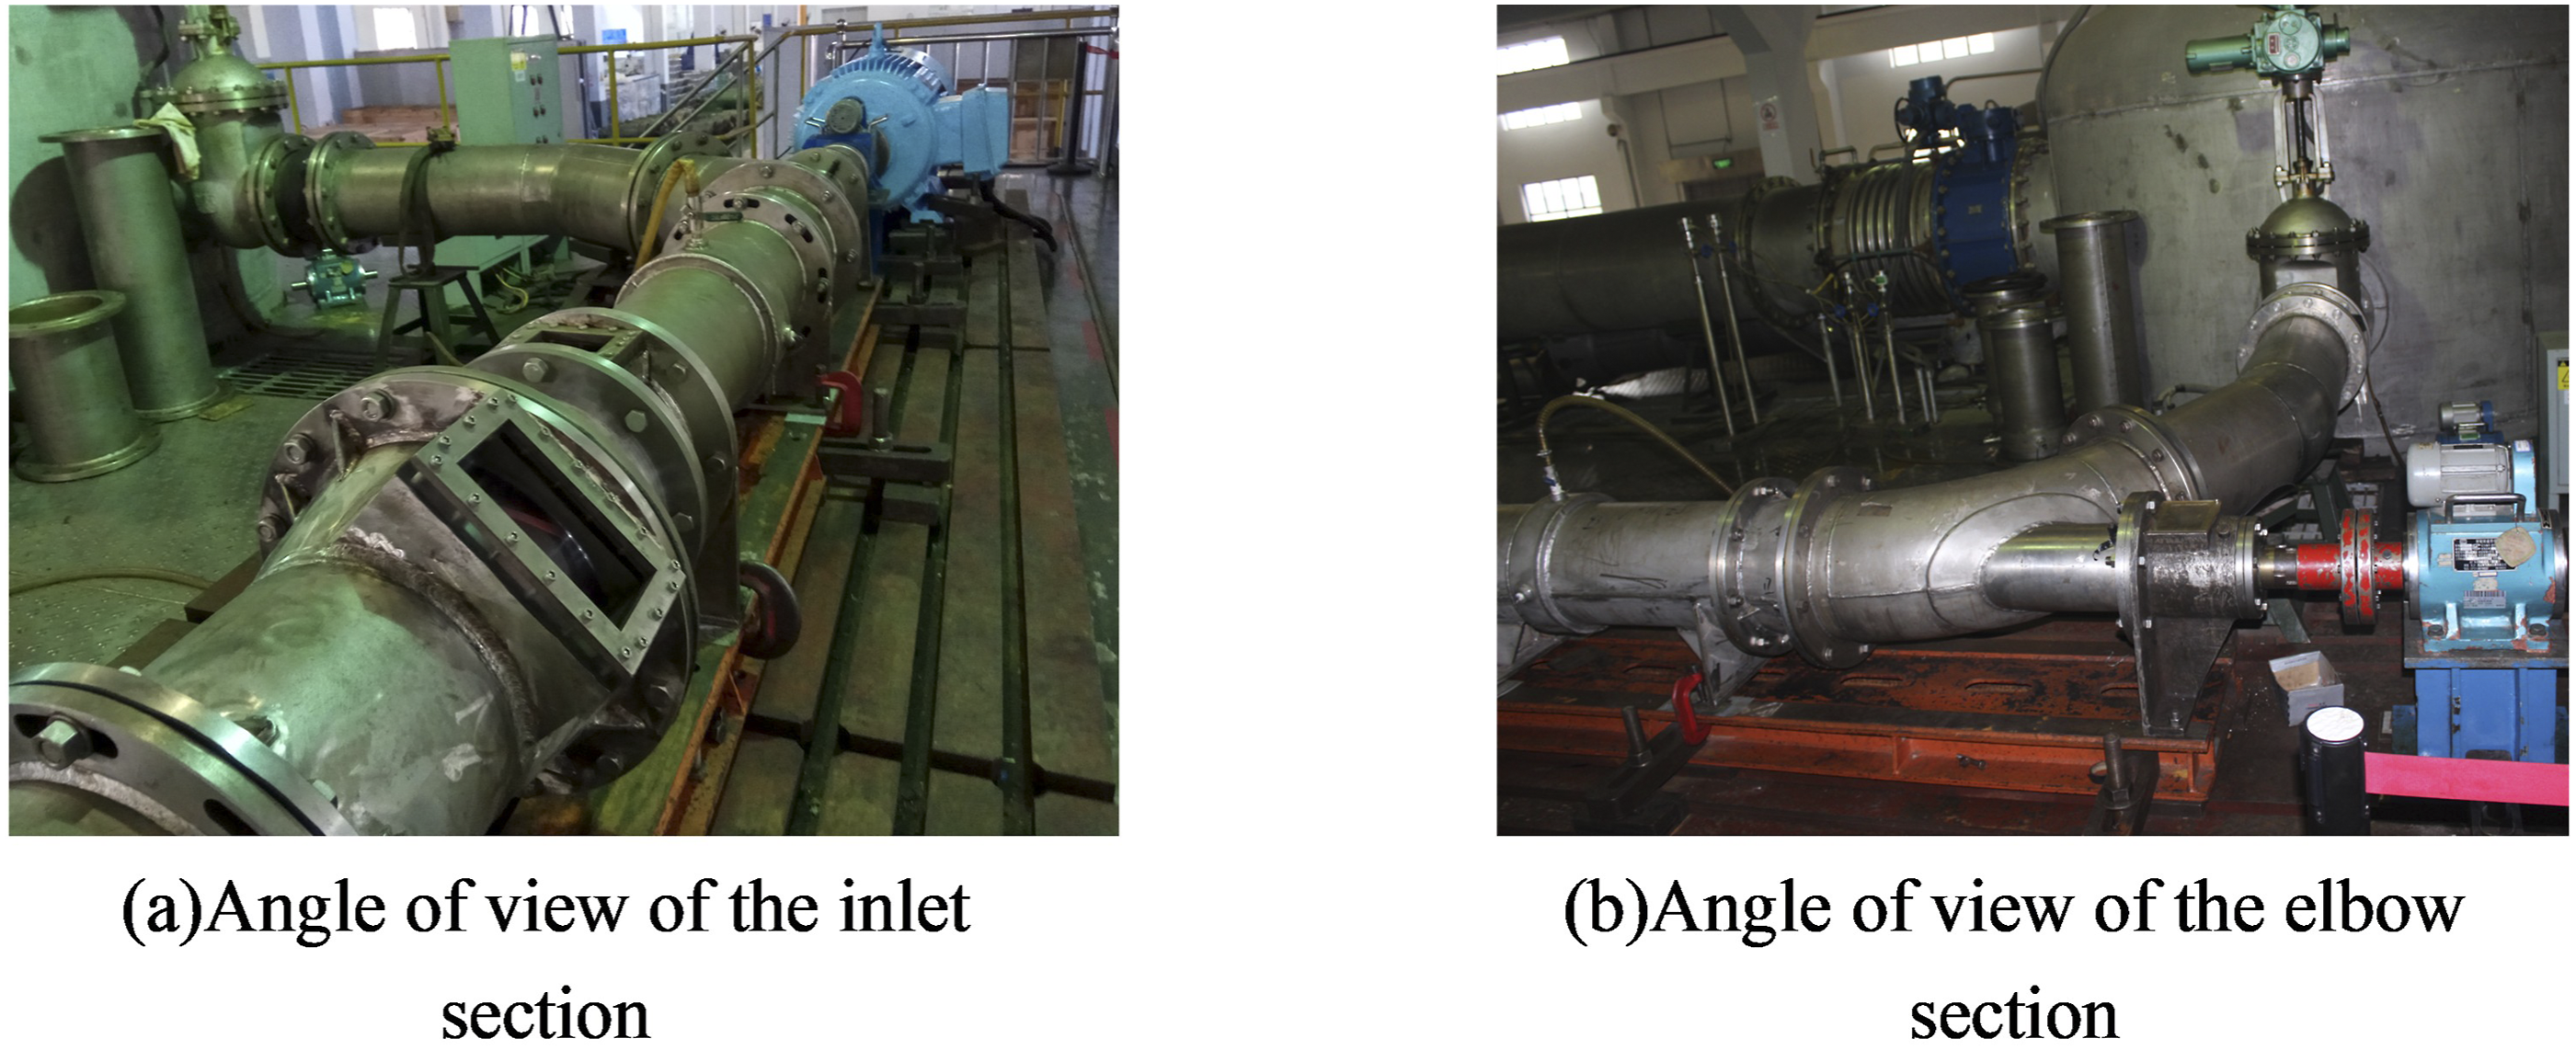
Model pump test site.
Cavitation characteristics of the WJP have been systematically investigated in our previous study (Long, 2018). As shown in Figure 5, the entire cavitation evolution is classified into six typical stages. The dividing criteria remain consistent with the previous work, whereas the corresponding NPSHa values differ slightly in the present test due to subtle differences in experimental conditions. Based on the cavitation performance curve measured under rated conditions, the NPSHa values of typical cavitation stages were determined. The VA data for NCS (NPSHa = 12.20 m, pump head remains constant with negligible tip clearance cavitation), ICS (NPSHa = 9.31 m, initial cavitation occurs with stable pump performance), TCS (NPSHa = 8.62 m, cavitation develops in transition with head fluctuation), FCS (NPSH
a
= 7.88 m, first critical cavitation with head rising then dropping sharply), CCS (NPSH
a
= 7.54 m, critical cavitation with 3% head drop), and BCS (NPSH
a
= 7.33 m, severe cavitation with head breakdown) are selected for processing and analysis. Division of different cavitation stages (Long, 2018).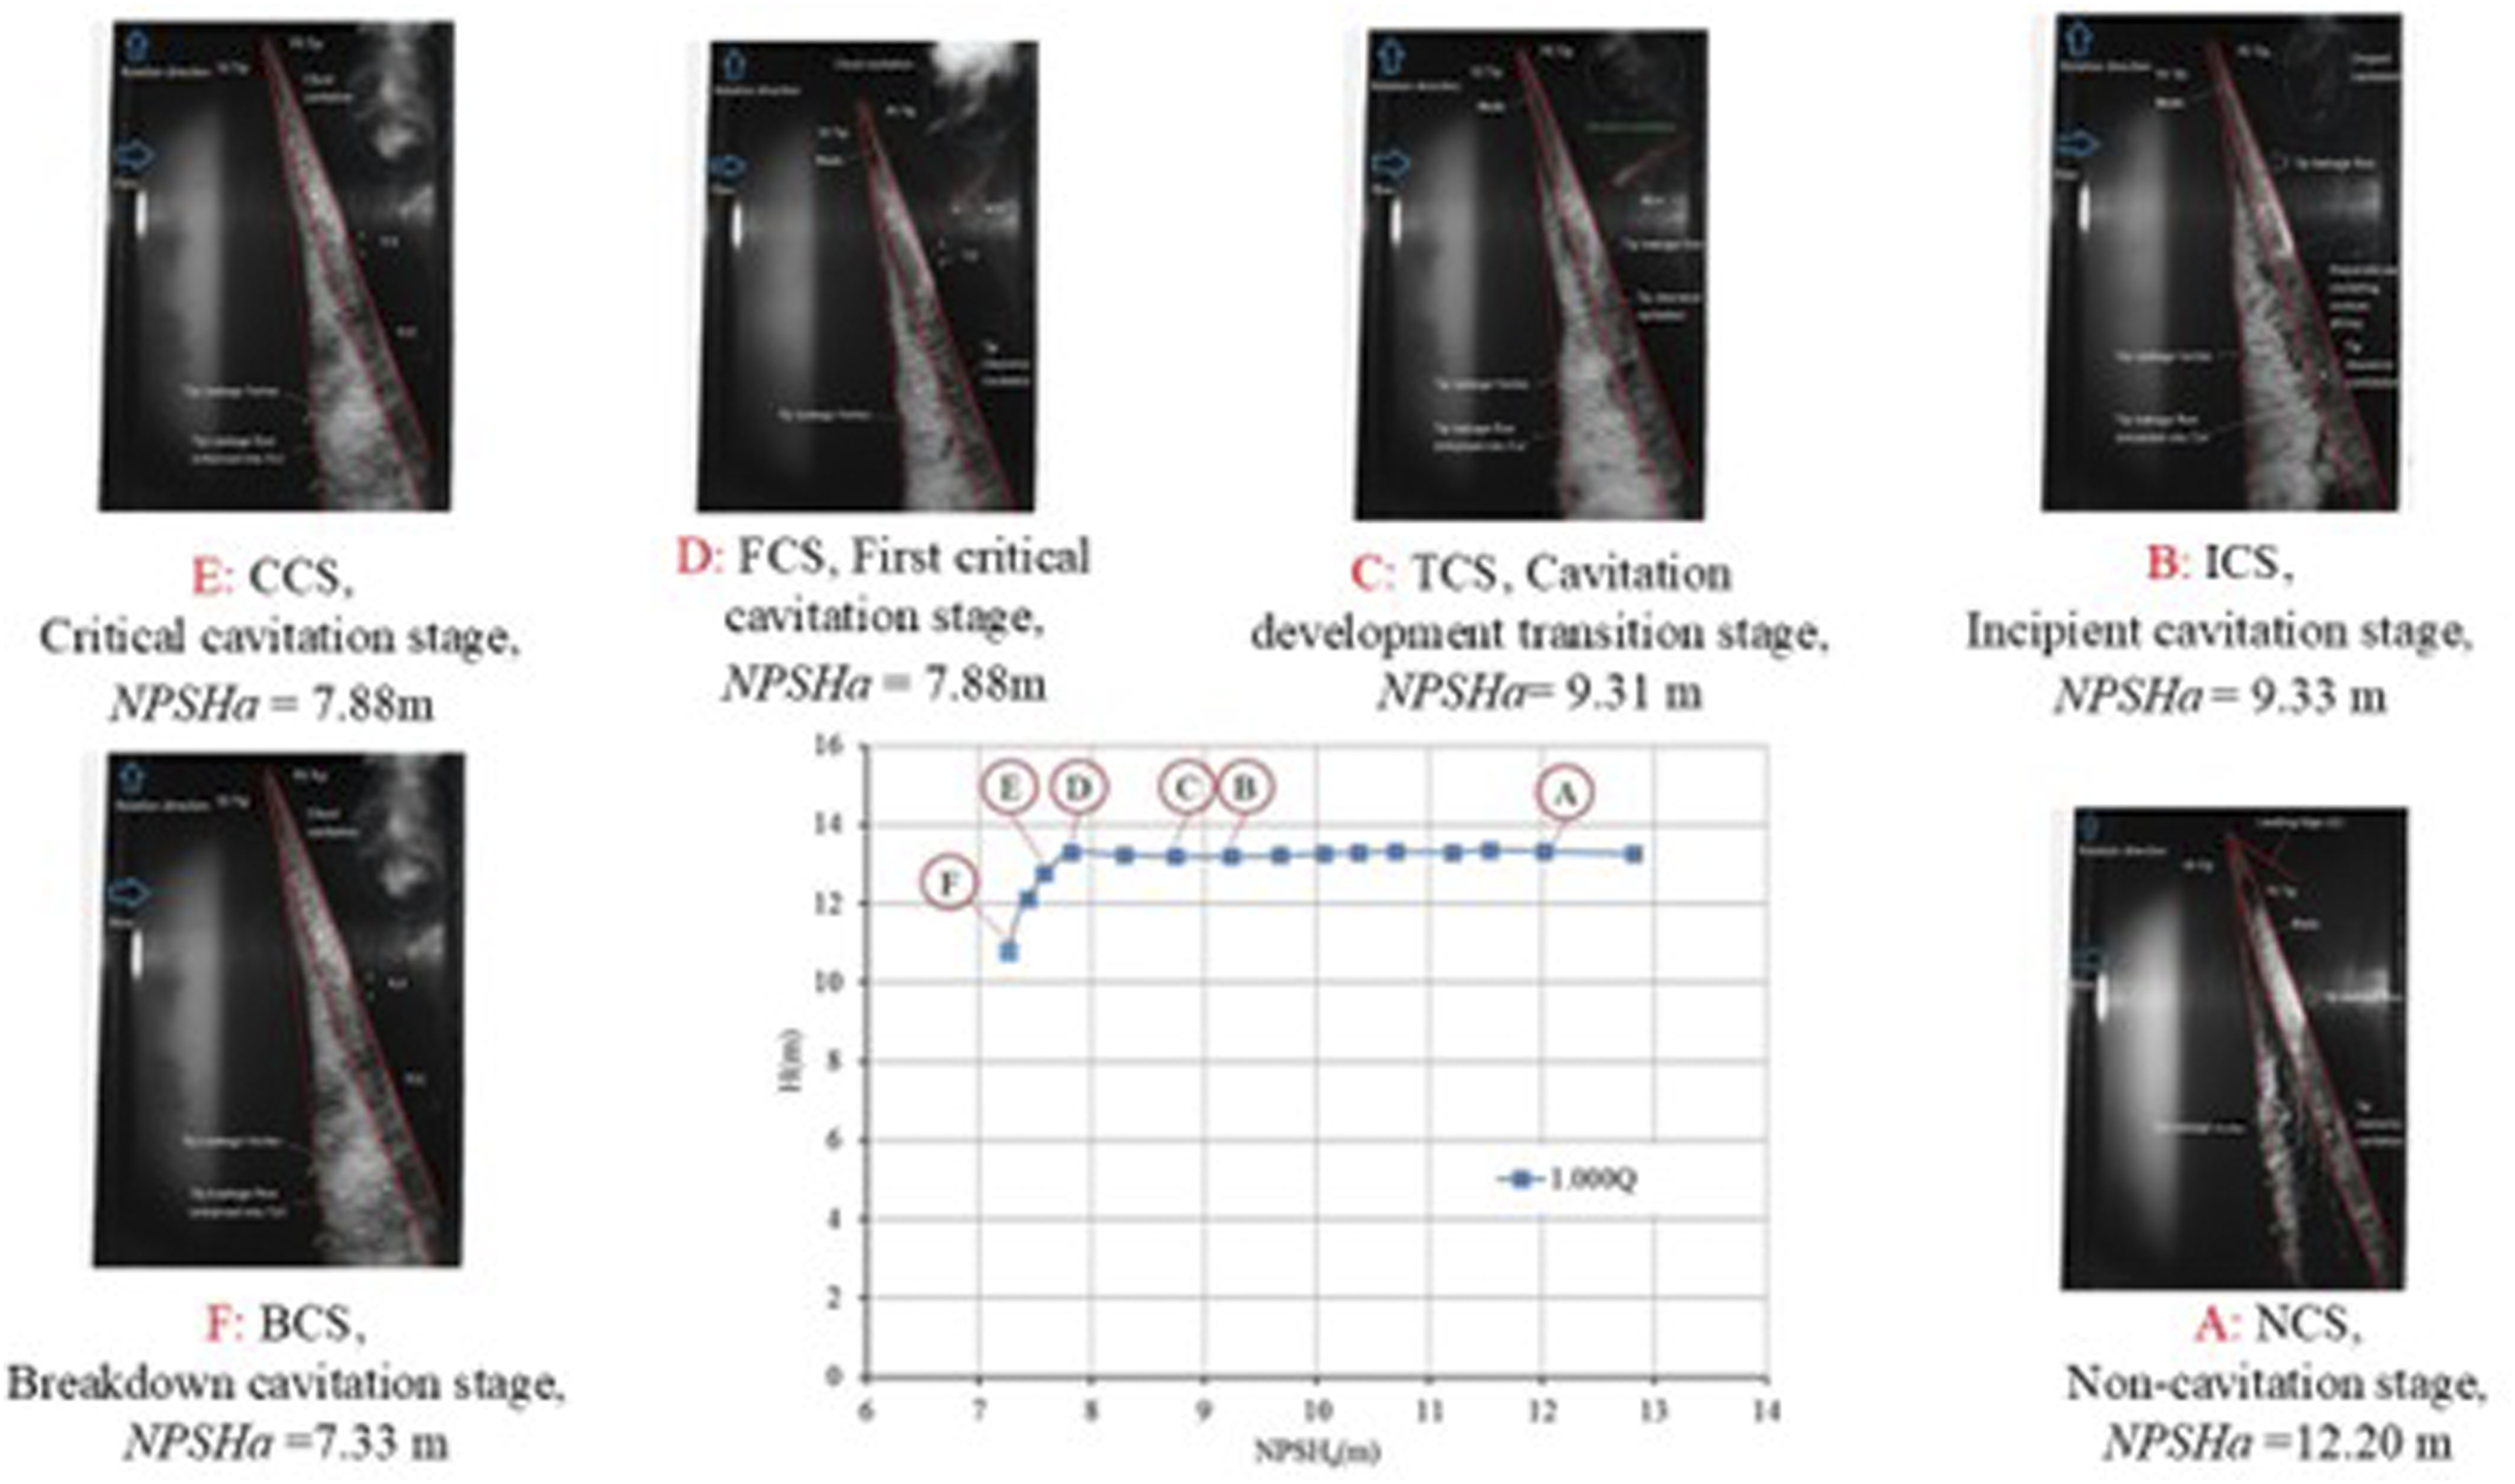
2.2. Vibration test method
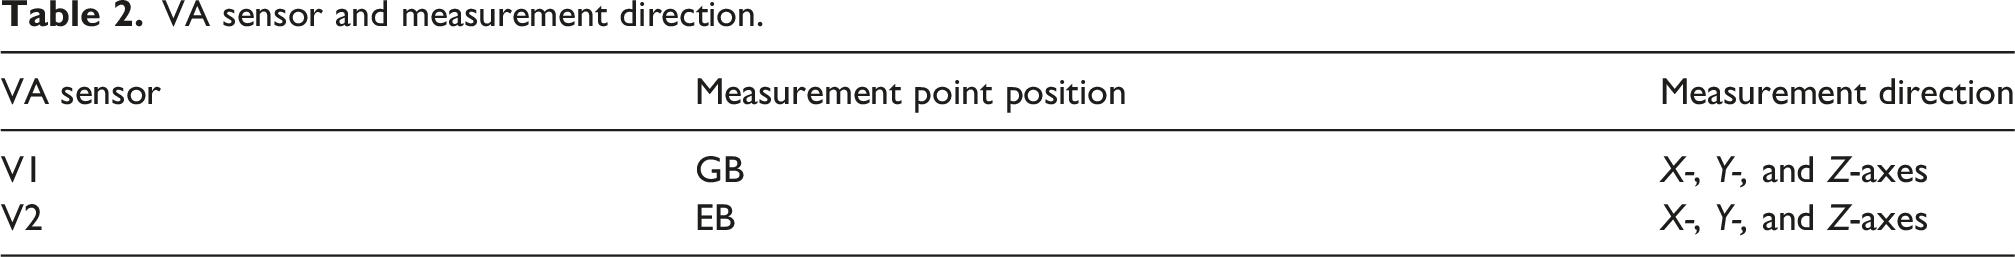
VA sensor and measurement direction.
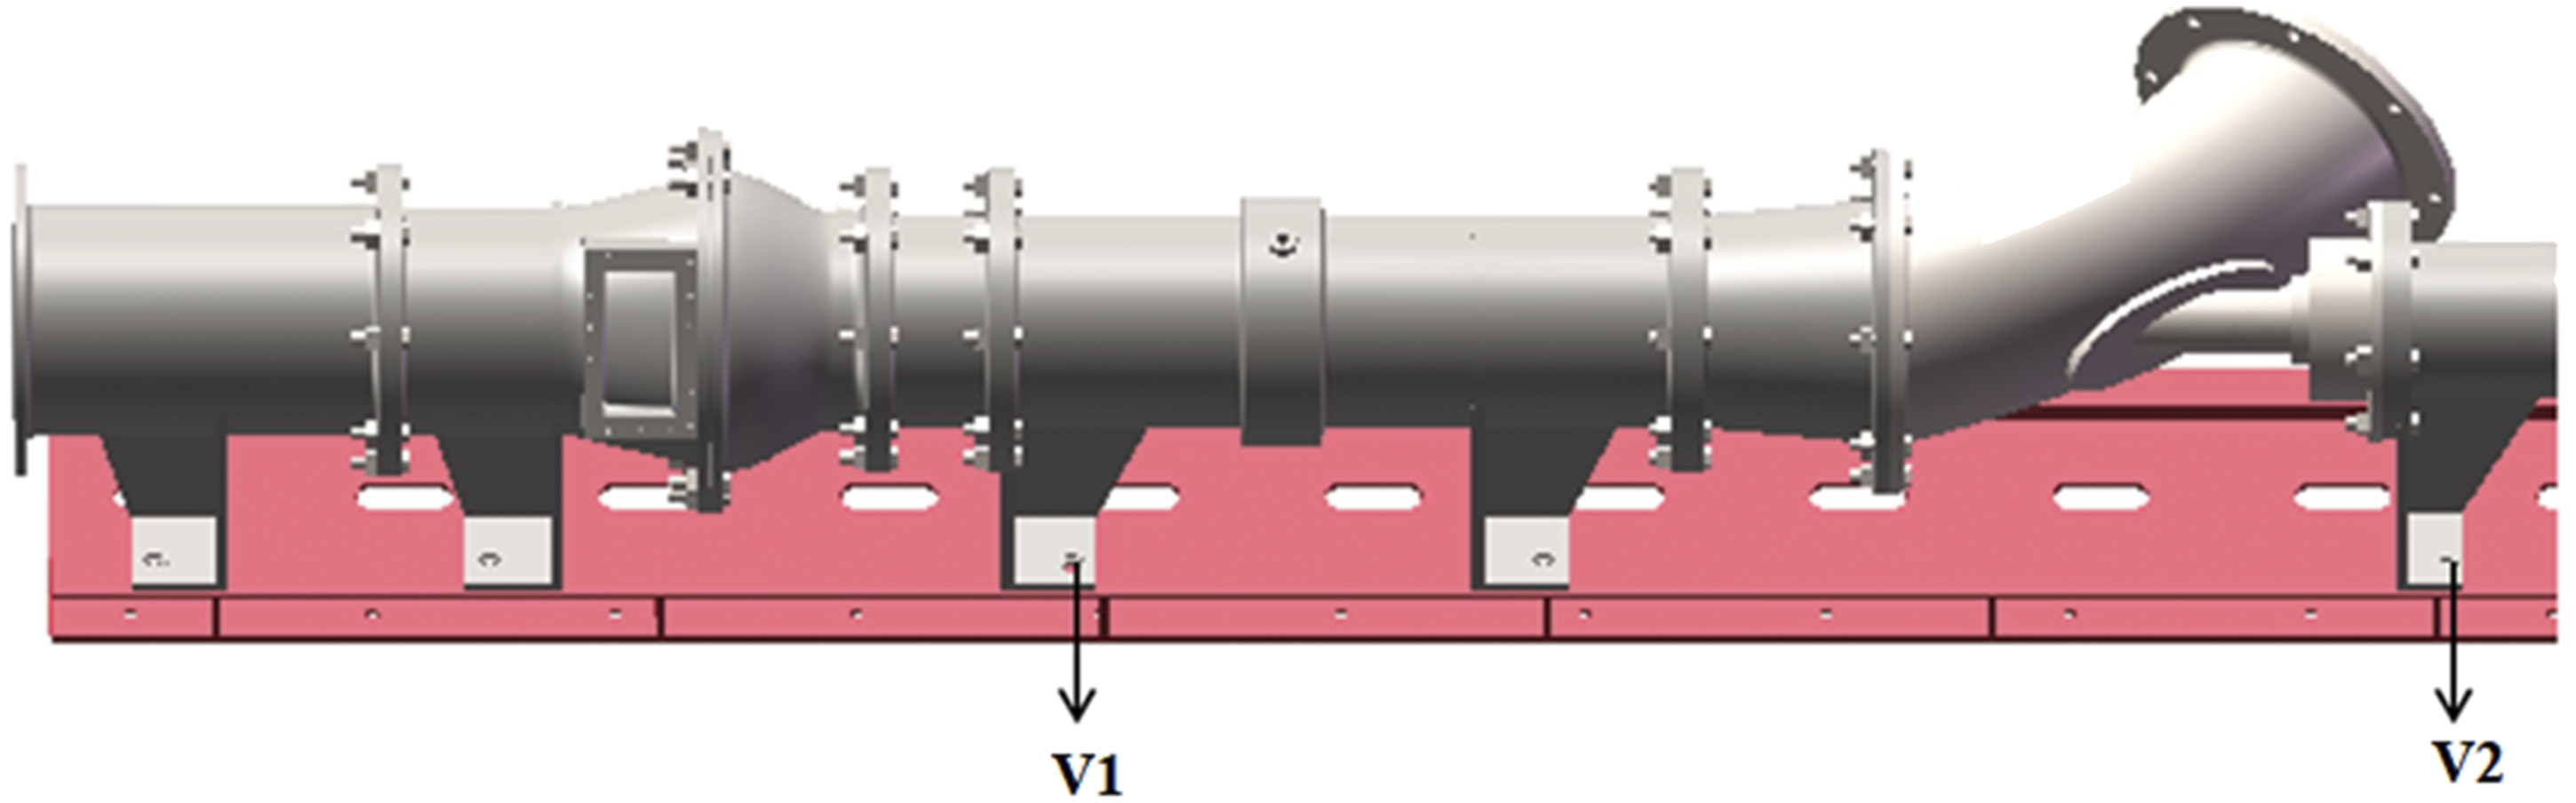
VA measurement point location.
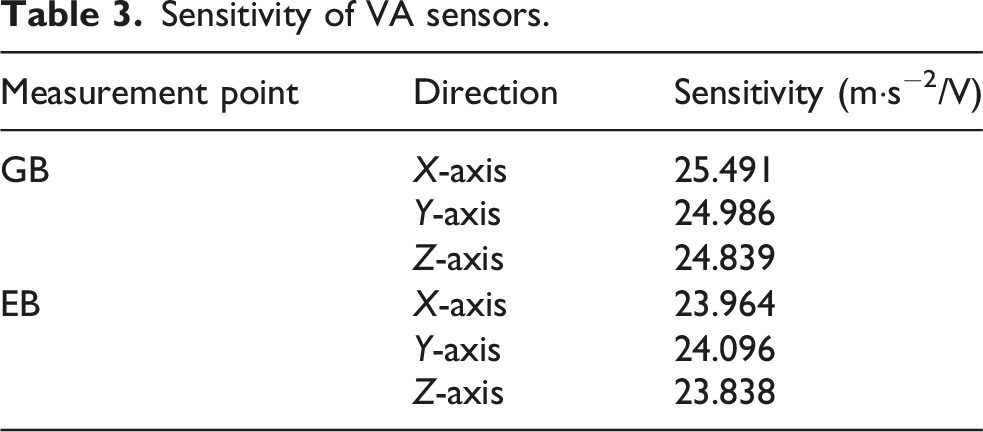
Sensitivity of VA sensors.
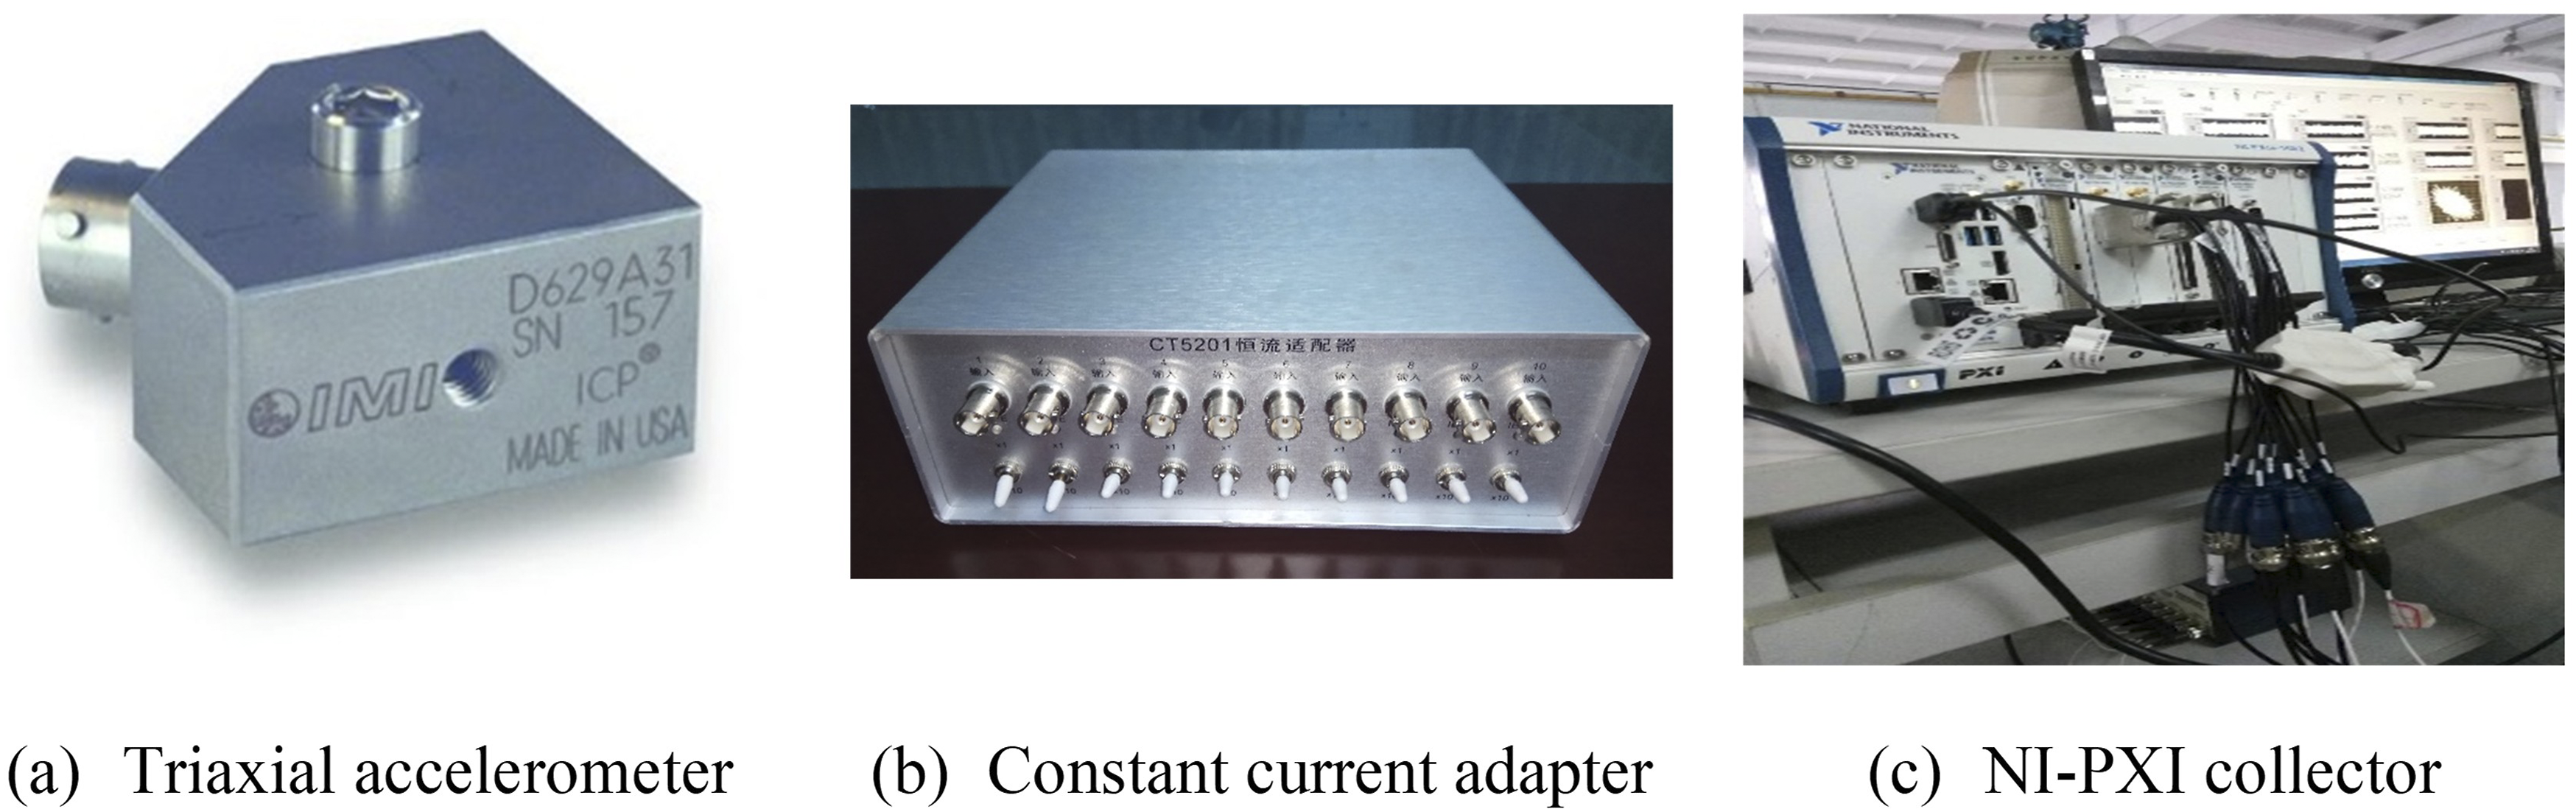
Main instruments for VA test.
The main VA test steps are as follows: (1) Adjust the loop system of the installed WJP test bench to ensure stable operation of the model pump. (2) Using the three-way piezoelectric acceleration sensors at GB and EB, align their sensitive axes strictly with the X-, Y-, and Z-axes of the actual pump body coordinate system. (3) Power the VA sensors via the constant current adapter, and debug and zero them using a standard shaking table within 500–2000 Hz. (4) Under design conditions, open the valve to adjust to the rated flow rate and set the WJP’s rotational speed to 1450 r/min (rated speed). Subsequently, use a vacuum pump to continuously extract air from the closed test bench to reduce the model pump’s inlet pressure until the pump can no longer extract air effectively and then stop extraction. Turn off the vacuum pump at regular intervals to collect VA signals. (5) Shut down the multi-channel signal collector and all power supplies, drain the water after the WJP fully stops, and complete the VA test.
2.3. Data processing methods
Vibration acceleration is non-dimensionalized using the gravitational acceleration g. The dimensionless acceleration a* is defined as follows:
To analyze the variation in overall VA spectrum energy with cavitation development, the frequency-band RMS of a* is adopted to evaluate the spectral vibration energy characteristics of the WJP. The spectral RMS formula based on FFT results is defined as follows (Gao et al., 2017):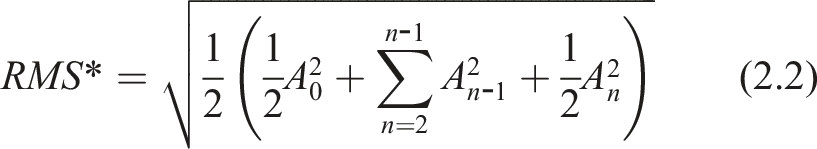
In the formula, A0 and An are the spectral amplitudes of a* at the initial and final frequencies of the target band, and An-1 represents the spectral amplitude of intermediate frequency components within the band.
3. Results and discussion
3.1. VA spectrum characteristics of WJP under various cavitation conditions
As illustrated in Figure 8, the three-direction VA spectra of the GB (V1) under different cavitation stages are presented. The full test frequency range (0–5 kHz) is divided into three bands for systematic analysis: low-frequency band (0–500 Hz), mid-frequency band (500–2000 Hz), and mid-to-high frequency band (2000–5000 Hz). VA spectra of the GB in three directions under various cavitation stages.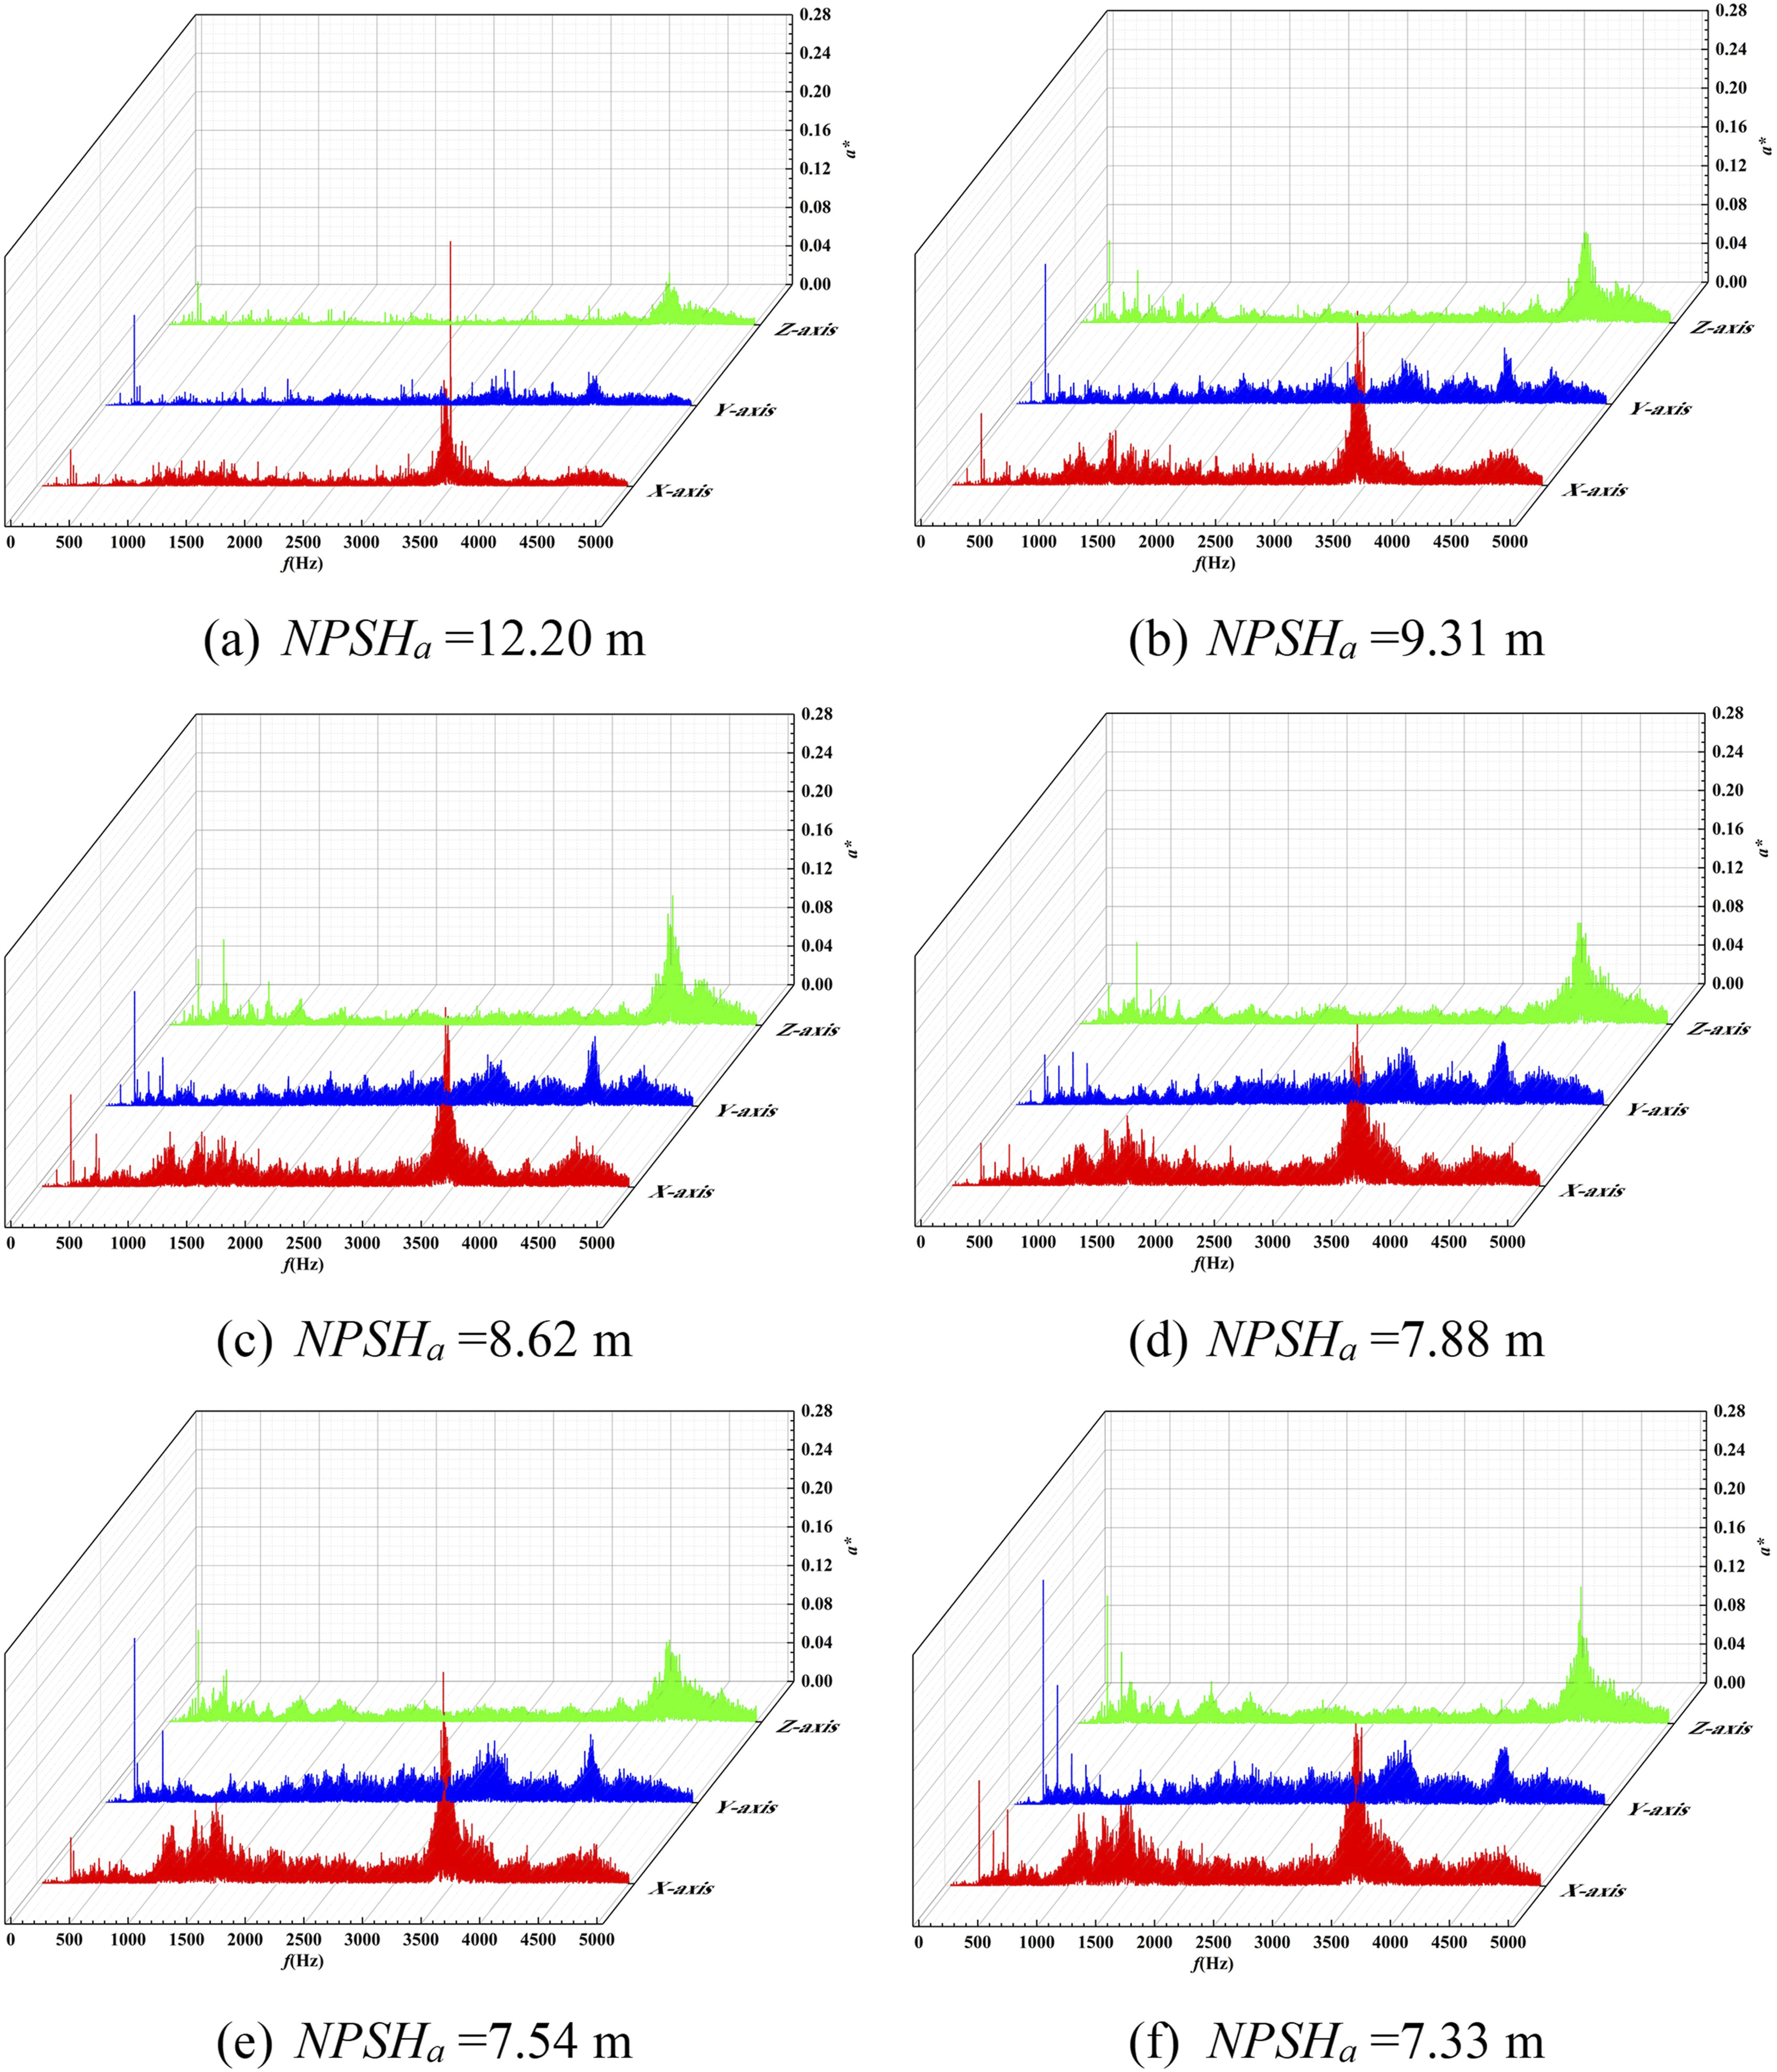
Notably, the maximum VA amplitude of V1 in the low-frequency band occurs at 240 Hz (2IBF), with a slightly lower amplitude at 120 Hz (IBF). Prominent broadband signals are observed in both the mid-frequency and mid-to-high frequency bands. In the mid-frequency band (500–2000 Hz), continuous broadband components appear, indicating that cavitation-induced unstable flows have a significant impact on the mid-frequency vibration response.
In the mid-to-high frequency band (2000–5000 Hz), the broadband VA has no fixed characteristic frequency, but the excitation frequencies are relatively concentrated. At V1, the mid-to-high frequency VA amplitudes peak at approximately 3440 Hz (X-axis), 4165 Hz (Y-axis), and 4260 Hz (Z-axis), with higher amplitudes at adjacent frequencies. These broadband signals are mainly induced by cavitation bubbles; the random collapse of cavitation bubbles in the WJP impeller generates such random mid-to-high frequency broadband vibration signals (Gao et al., 2017; Wang et al., 2013). Moreover, the overall signal intensity of all three frequency bands rises synchronously with cavitation development. Comprehensive analysis of the three-direction VA spectral characteristics of V1 under six cavitation stages reveals that the X-axis VA exhibits the strongest overall excitation effect.
Figure 9 displays the three-direction VA spectra of the EB (V2) under the same cavitation conditions. For V2, 2IBF (240 Hz) remains the dominant low-frequency component, which is consistent with the general law of V1. The full-band VA intensity also rises gradually with cavitation deterioration, and 2IBF always occupies the dominant position in the overall vibration. Different from V1, the maximum amplitude of 2IBF at V2 appears in the Y-axis, which is the most prominent among the three directions. A direct comparison between Figures 8 and 9 demonstrates that the low-frequency 2IBF amplitude of V2 is significantly higher than that of V1, while the mid-frequency and mid-to-high frequency vibration amplitudes are weaker than those of V1. This confirms that the sensor installation position and local flow structure directly determine the vibration level and frequency distribution of the bearing feet. Affected by flow distortion and secondary flow in the elbow section, the EB presents a more intense low-frequency vibration response than the GB. VA spectra of EB in three directions under different cavitation stages.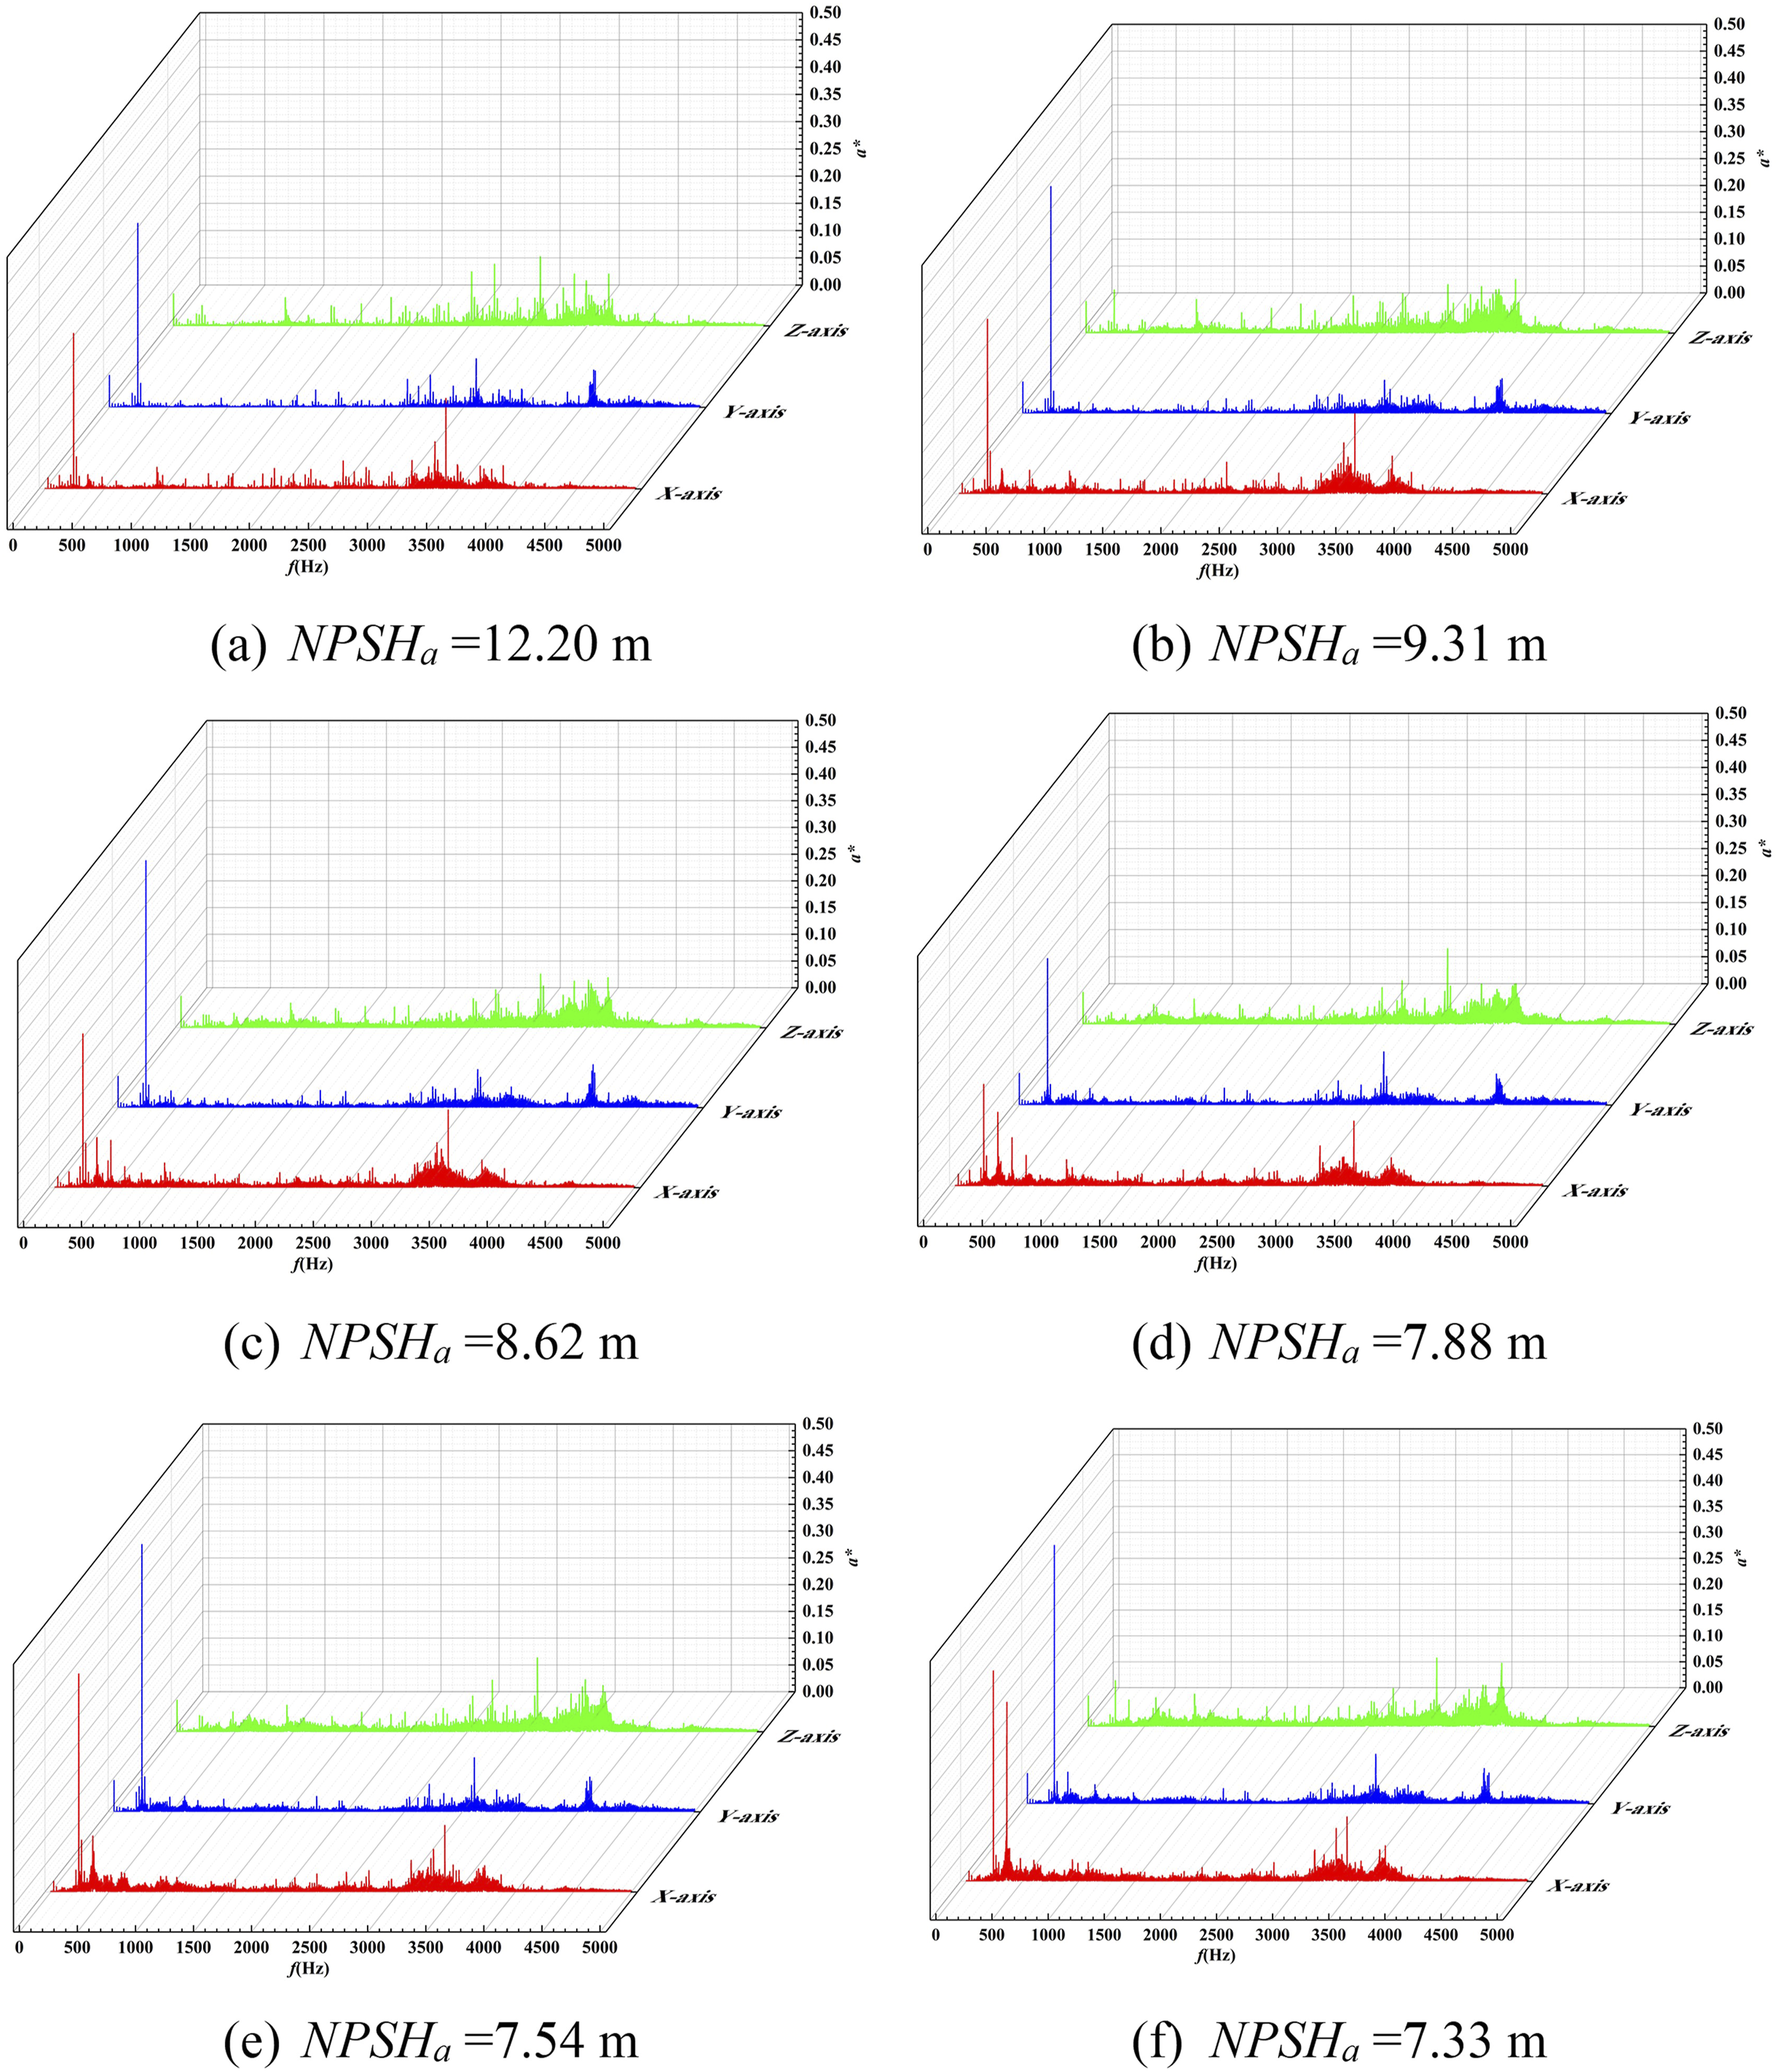
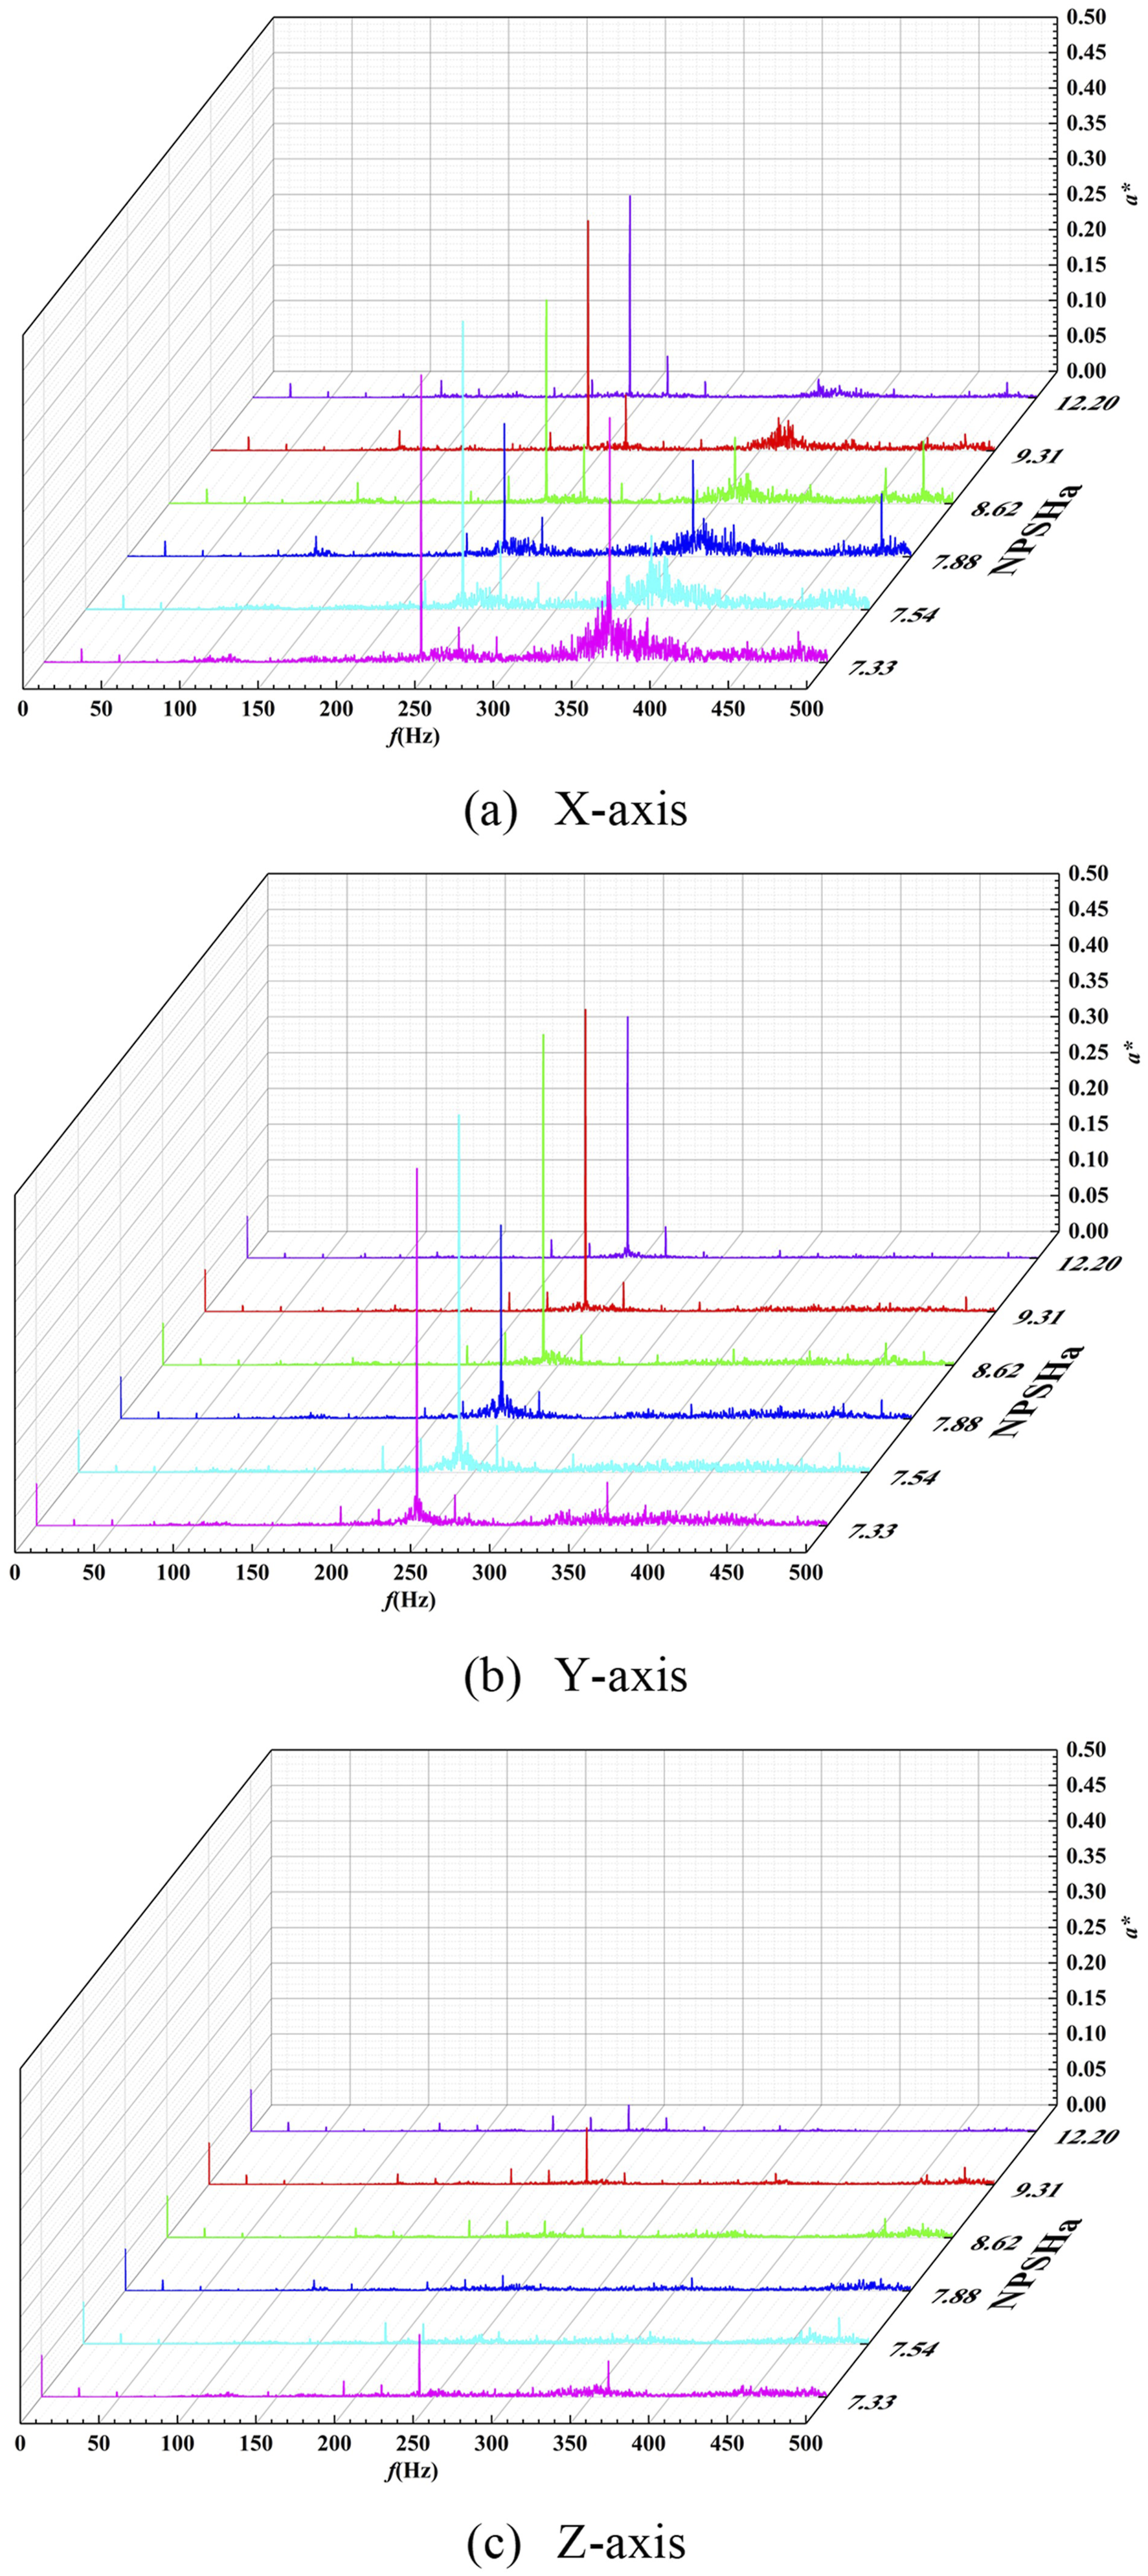
As cavitation develops, periodic cavitation vortex shedding alters the amplitude of low-frequency vibration signals. To investigate the effect of cavitation flow on the low-frequency vibration characteristics of WJP bearing feet across different cavitation stages, the VA spectra of V1 and V2 in the 0–500 Hz low-frequency band are presented in Figures 10 and 11. For both measuring points, 2IBF remains the dominant frequency in this band under all cavitation stages. The SF (24 Hz) shows a negligible amplitude here, indicating high manufacturing accuracy of the WJP, and that rotor system asymmetry and imbalance have little influence on the bearing foot vibration. VA spectrum of GB in the 0–500 Hz frequency range under different cavitation stages. VA spectrum of EB in the 0–500 Hz frequency range under various cavitation stages.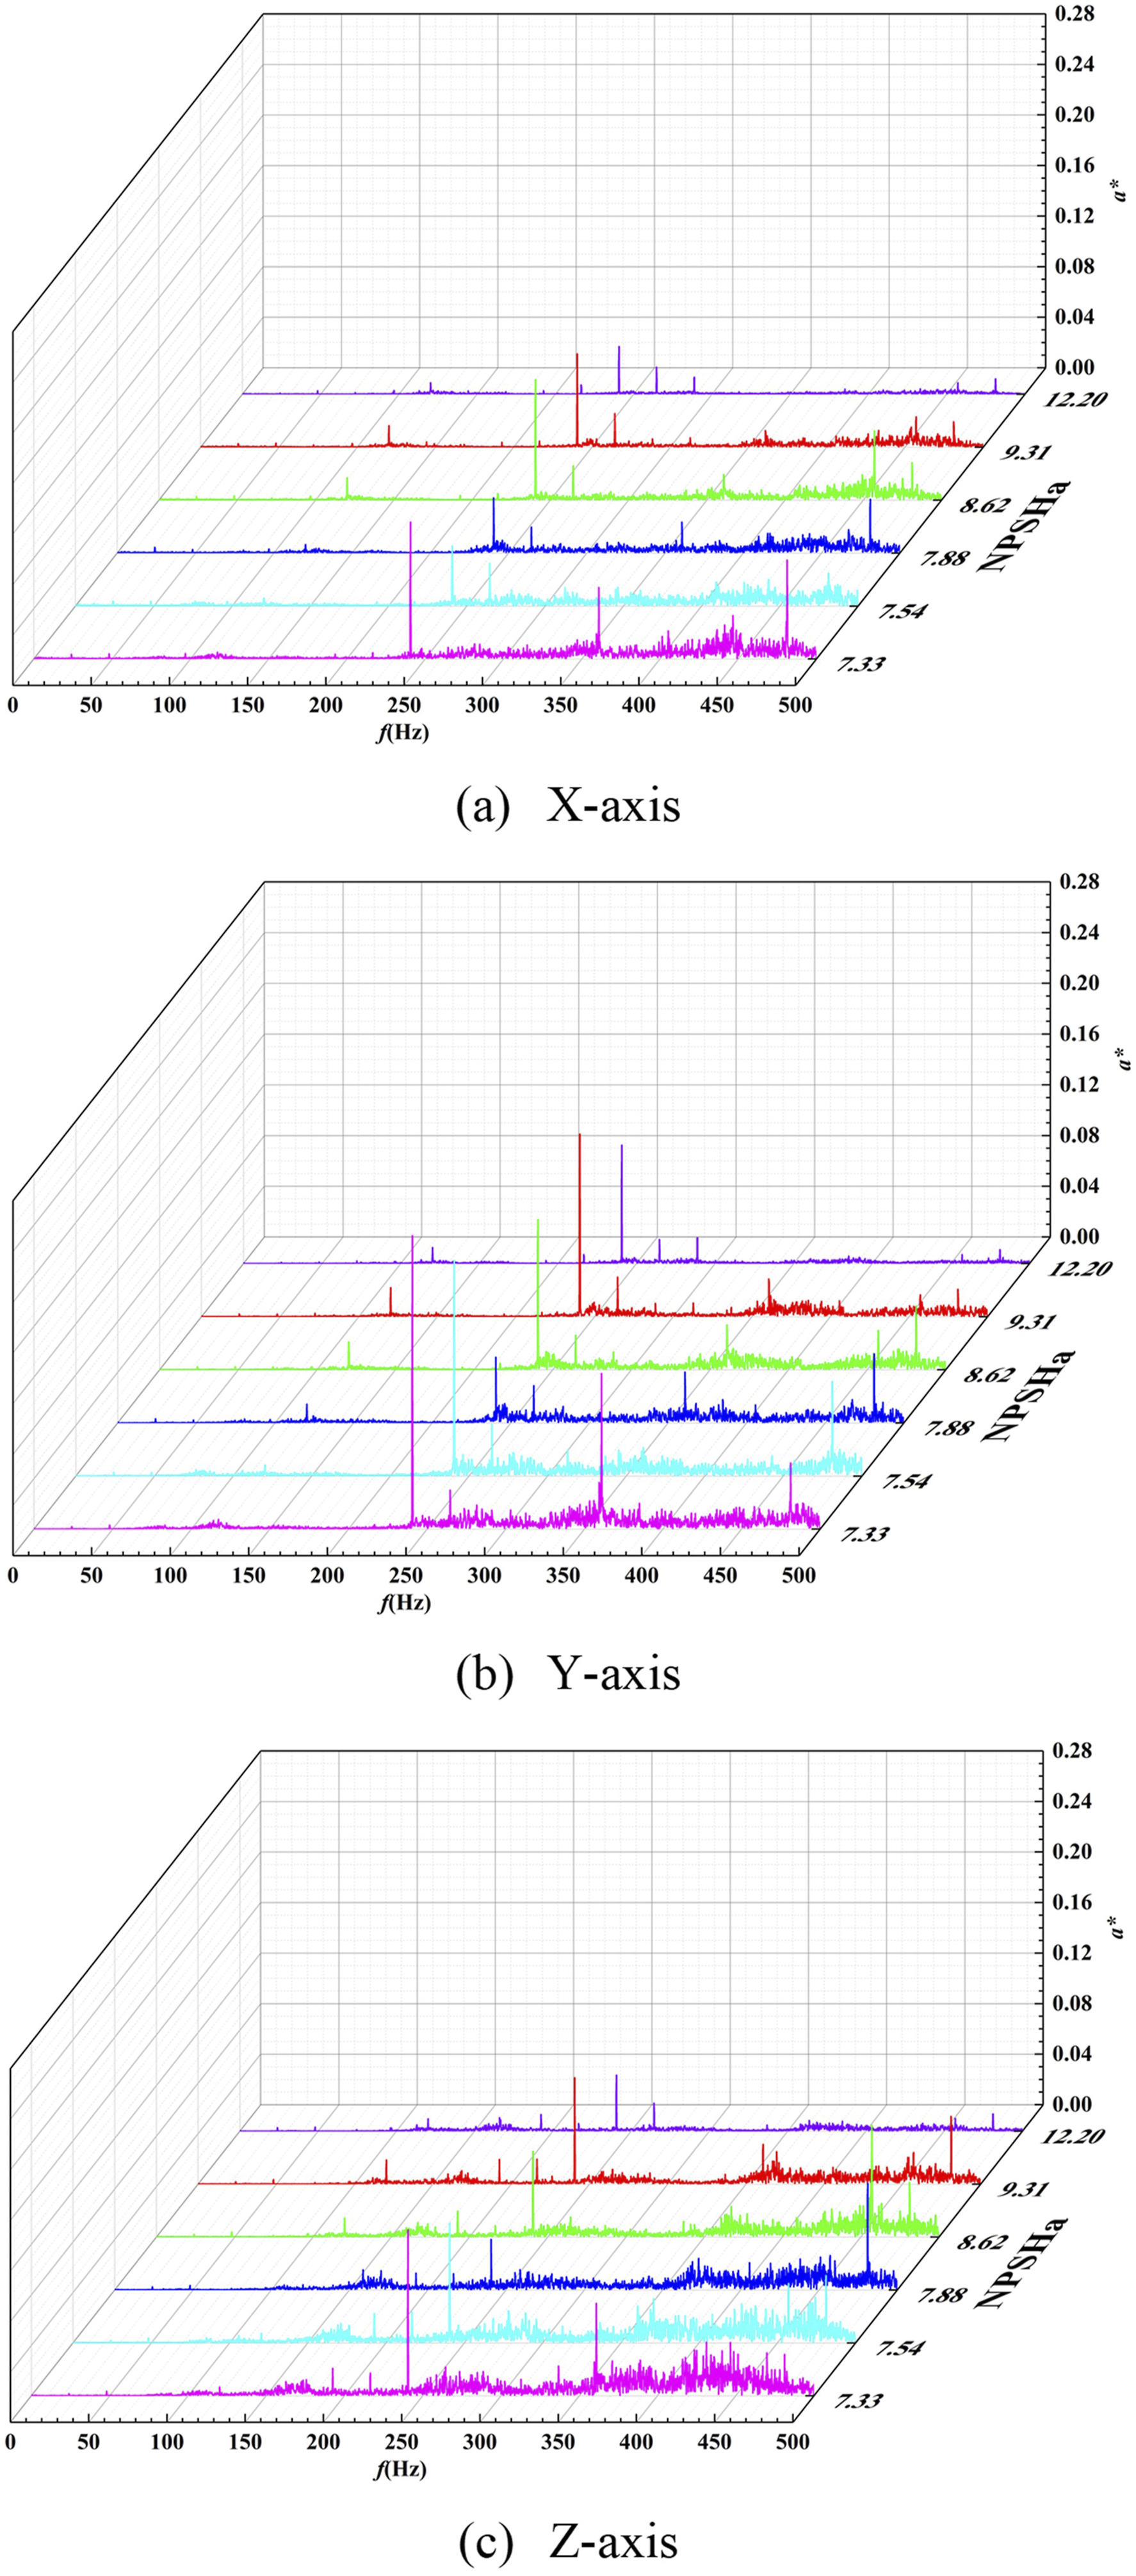
For V1 (Figure 10), the VA amplitude at 120 Hz (IBF) in the X-axis first increases then decreases with cavitation evolution, while the signals in the Y-axis and Z-axis are extremely weak. In all three directions, the VA amplitude at 240 Hz (2IBF) rises slowly before the cavitation transition, decreases gradually in the critical cavitation stage, and increases rapidly in the BCS. The amplitudes at 3IBF and 4IBF in the X-axis follow the same variation trend as 2IBF, with weak signals in the Y-axis and Z-axis. Additionally, a signal peak at 264 Hz (2IBF + SF) appears in the X-axis and Y-axis within this band.
For V2 (Figure 11), the dominant frequency in the three directions remains 240 Hz (2IBF), and the VA amplitude at 2IBF follows the same “increase-decrease-rapid rise in BCS” trend as V1. Different from V1, the signals at IBF (120 Hz), 3IBF (360 Hz), and 4IBF (480 Hz) in the X-axis of V2 are significantly stronger than those in the Y-axis and Z-axis, with a higher overall low-frequency amplitude baseline than V1 under the same working conditions. The amplitudes at 3IBF, 4IBF, and the dominant frequency in the X-axis follow the same variation trend, while the signals in the Y-axis and Z-axis are weak. In addition, signal peaks at 264 Hz (2IBF + SF) and 217.5 Hz (GBF) appear in the X-axis and Y-axis within this band, which is a unique frequency characteristic not observed in V1.
3.2. VA energy analysis under different cavitation stages
Figure 12 presents the variation of VA RMS* at V1 and V2 (X-, Y-, Z-axes) with NPSH
a
in the 10–500 Hz band. The VA RMS* trends of V1 and V2 differ across directions with cavitation development, but both increase with rising cavitation intensity. The variation curves of vibration energy in three directions of the measurement points in the frequency range of 10–500 Hz with NPSH
a
.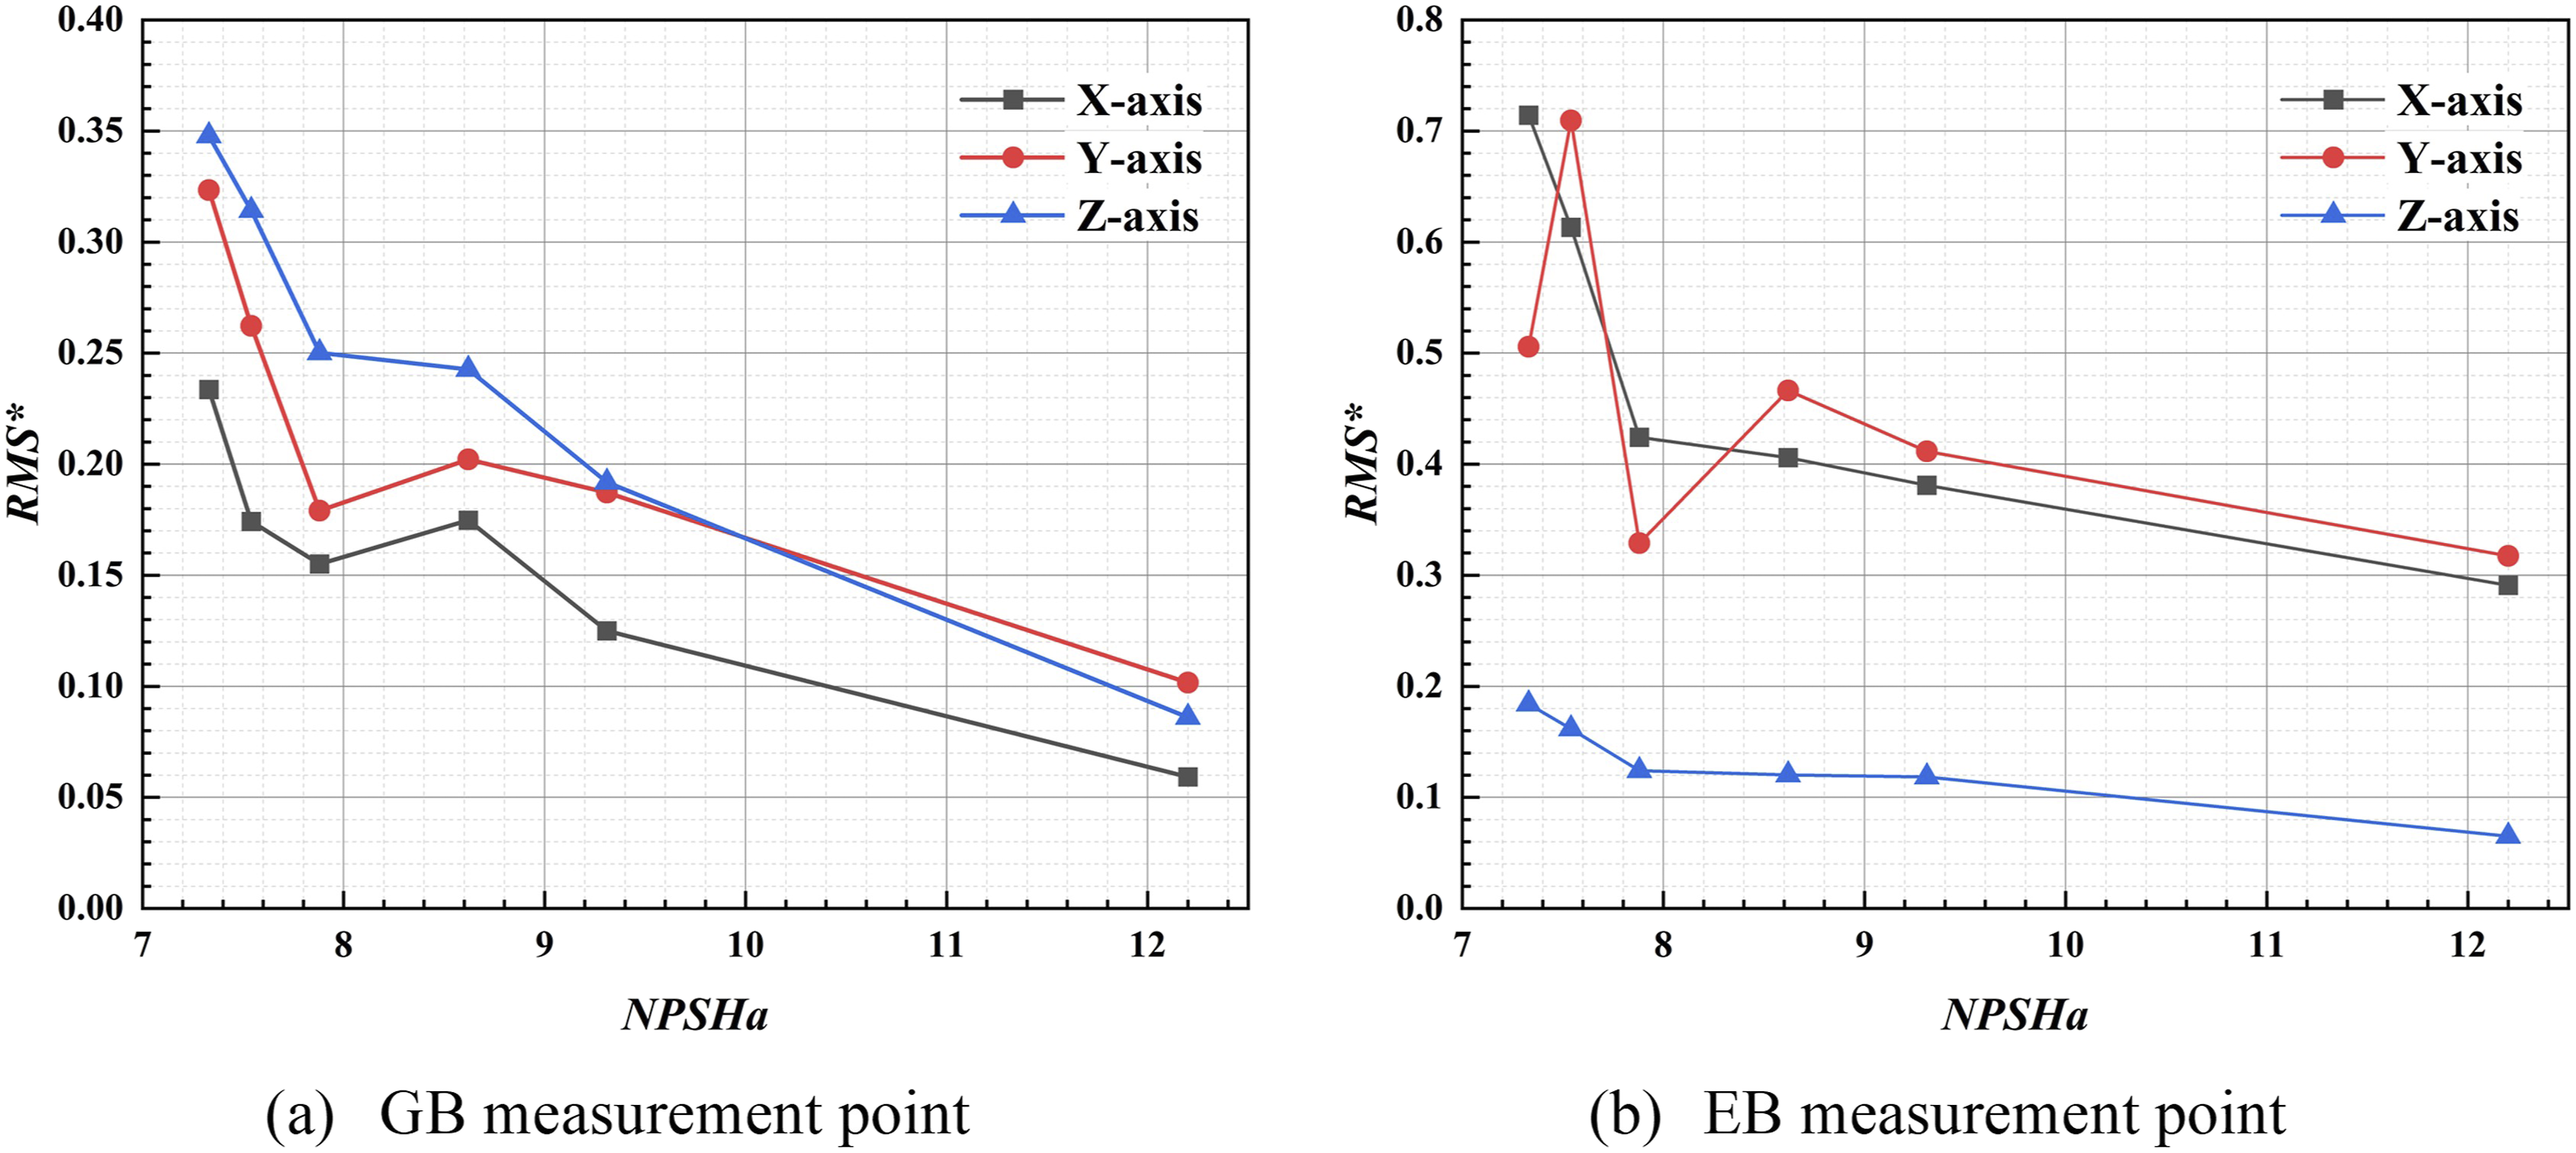
At V1, Z-axis shows the largest overall VA RMS*, followed by Y-axis, with X-axis the smallest. VA RMS* in X-axis and Y-axis rises from NCS to TCS, slightly decreases from TCS to FCS, and then increases sharply toward CCS and BCS. Z-axis VA RMS* shows no decrease, but its growth rate slows from the TCS to FCS. The discrepancy between axial and radial vibration originates from anisotropic flow excitation and force transmission. The axial direction is dominated by cavitation-induced axial thrust fluctuation, while radial vibration is governed by circumferential non-uniform flow.
At V2, overall VA RMS* in X-axis and Y-axis is notably higher than in Z-axis. With cavitation development, X-axis and Z-axis VA RMS* increase continuously: slowly from NCS to FCS, then sharply from FCS to BCS. Y-axis VA RMS* rises slowly from NCS to TCS, falls from TCS to FCS, rebounds near CCS, and finally decreases in BCS. Affected by elbow flow separation and secondary flow, radial pressure pulsation is intensified at V2, whereas axial excitation is weak, resulting in obvious directional differences in vibration response.
Comparing Figure 12(a) and (b), in the 100–500 Hz band, the VA RMS* of V2 in X-axis and Y-axis is higher than that of V1, while its Z-axis value is lower. The VA RMS* in all directions at both measurement points increases with cavitation evolution, and the rising rate slows and decreases at FCS. This slight drop of vibration acceleration at the FCS is mainly attributed to the cushioning and damping effect of dispersed vapor bubbles. Uniform micro-bubbles weaken flow-induced pressure fluctuations and impact loads, thereby partially suppressing structural vibration, rather than structural interference.
Figure 13 shows the variation of VA RMS* with NPSH
a
in the 500–5000 Hz band for V1 and V2 in three directions. Overall, the VA RMS* trends of V1 and V2 differ across directions with cavitation stages, but both increase with rising cavitation intensity. In the mid-to-high frequency range, directional vibration differences are controlled by structural stiffness and mode characteristics, and each axis exhibits distinct sensitivity to high-frequency bubble collapse impact. The variation curves of vibration energy in three directions of the measurement point with NPSH
a
in the frequency range of 500–5000 Hz.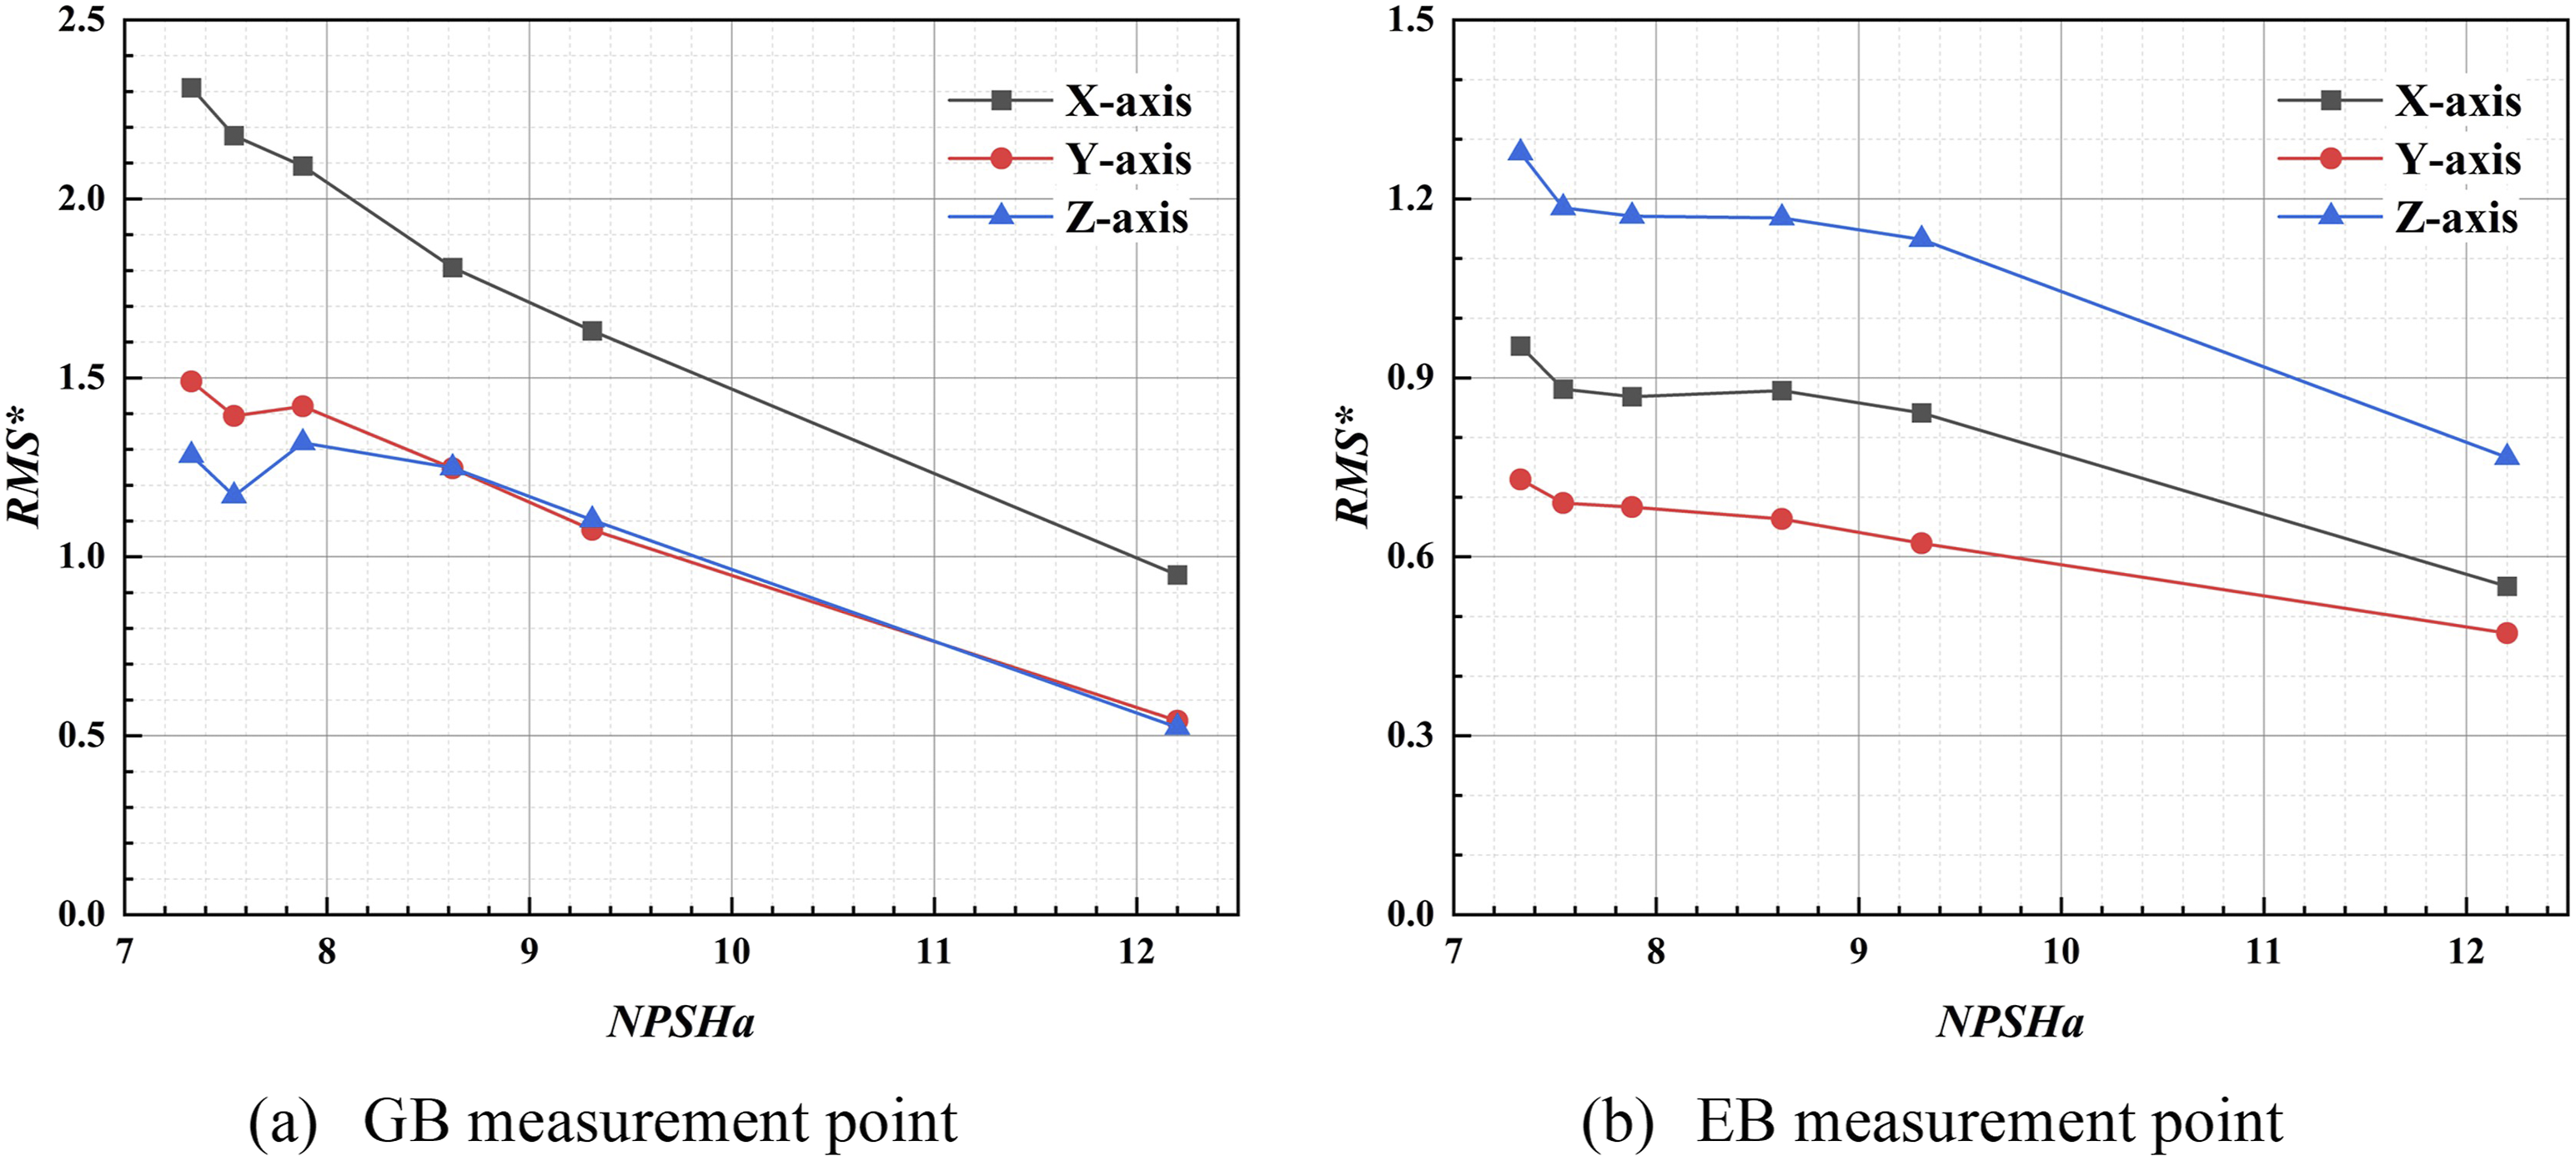
At GB, the X-A VA RMS* curve is the highest, significantly exceeding Y-axis and Z-axis. In this band, X-axis VA RMS* increases steadily with cavitation development. Y-axis and Z-axis VA RMS* rise steadily from NCS to the FCS, decrease at CCS, and increase again at BCS; their values are similar from NCS to TCS.
At V2, Z-A VA RMS* is the highest, followed by X-axis, with Y-axis the lowest. In the 500–5000 Hz band, the three directions show similar VA RMS* trends: increasing gradually from NCS to TCS, stagnating or decreasing slightly from TCS to CCS, and rising rapidly from CCS to BCS.
Comparing Figure 13(a) and (b), in the 500–5000 Hz band, V1 has higher overall VA RMS* in X-axis and Y-axis than V2, while V2 shows lower Z-axis VA RMS* than V1. The VA RMS* in all directions at both points increases with cavitation evolution, with the growth rate slowing and decreasing at FCS.
4. Conclusion
As a key excitation source for vane pump vibration, cavitation induces abnormal excitation force, aggravates noise, and causes pump fatigue damage, seriously threatening ship navigation safety, stealth performance, and equipment service life. To clarify the cavitation-induced vibration mechanism of water-jet systems, this study conducts vibration tests and systematically analyzes the mid-to-low frequency vibration acceleration (VA) characteristics of the guide vane bearing foot (GB) and the elbow bearing foot (EB) at different cavitation stages of the WJP. The main conclusions are as follows: (a) Vibration tests indicate that the vibration responses of V1 and V2 are closely related to cavitation degree, with obvious differences caused by structural layout. (b) For V1 at the GB, low-frequency vibration is dominated by 2IBF with weak harmonic amplitudes. Mid-frequency broadband vibration is mainly induced by cavitation bubble collapse. Cavitation instability excites full-band vibration, and the overall vibration intensity increases with aggravated cavitation, among which the X-axis vibration is the most prominent. (c) V2 at the EB presents a similar frequency characteristic, but its 2IBF low-frequency amplitude is significantly higher than that of V1 and its own high-frequency components. Affected by flow distortion and secondary flow in the elbow section, the elbow bearing foot is more sensitive to low-frequency vibration. (d) In terms of vibration energy, the RMS* values of two measuring points generally rise with the development of cavitation, showing distinct spatial differences. (e) In the low-frequency band, V2 has higher X-axis and Y-axis RMS* than V1, while the Z-axis shows an opposite variation. The energy growth rate is relatively slow at the initial critical cavitation stage. (f) In the high-frequency band, V1 exhibits higher X-axis and Y-axis RMS* due to severe cavitation bubble collapse near the guide vane, and the Z-axis energy of the two points is basically equivalent.
This study reveals the mid-to-low frequency vibration characteristics and energy evolution of the guide vane and elbow bearing feet under different cavitation stages. As the present work focuses on experimental observation and mechanism analysis, vibration mitigation methods are not involved. Future research will combine the obtained vibration laws to carry out structural optimization and flow improvement, to suppress cavitation-induced vibration and provide a reference for the anti-vibration design of WJPs.
Footnotes
Ethical considerations
This article does not contain any studies with human participants or animals performed by any of the authors.
Consent to participate
Informed consent was obtained from all individual participants included in the study.
Funding
The authors disclosed receipt of the following financial support for the research, authorship, and/or publication of this article: This work was funded by the Natural Science Foundation of China (Grant No. 51906085, Grant No. U20A20292), the China Postdoctoral Science Foundation Funded Project (Grant No. 2023M733355), Jiangsu University Youth Talent Development Program (2020), and the Chunhui Program Cooperative Scientific Research Project of the Ministry of Education.
Declaration of conflicting interests
The authors declared no potential conflicts of interest with respect to the research, authorship, and/or publication of this article.
Data Availability Statement
The data that support the findings of this study are available from the corresponding author upon reasonable request.