
Abstract
To accurately identify bearing faults under variable speeds and strong noise, this paper proposes an improved Feature Mode Decomposition method (ED-GAFMD). Addressing the manual dependency and lack of adaptability in traditional FMD parameter selection (modes n, filter number K, and length L), this study utilizes the Grey Wolf Optimizer (GWO) with Permutation Entropy (PE) for automatic optimization. Signals are decomposed using optimal parameters, and sensitive modes are selected via the maximum kurtosis criterion for Envelope Order Analysis (EOA) to identify fault types. Validation using simulation and experimental data with mixed interference (harmonics, impulses, and white noise) demonstrates that ED-GAFMD outperforms GWO-FMD, GWO-VMD, and AFMD. It exhibits superior accuracy in extracting weak features and provides stable fault characterization. Furthermore, when applied to 1D-CNN diagnosis on signals with −2 to −10dB SNR, the method achieves an average accuracy of 96.52%, significantly enhancing diagnostic reliability under variable operating conditions compared to unfiltered signals.
1. Introduction
As critical components of rotating machinery, the health of rolling bearings directly governs the safety and reliability of aerospace, wind power, and industrial systems (Lu et al., 2019; Peng et al., 2022). However, in practical operation, such equipment often functions under complex non-stationary conditions characterized by variable speeds, time-varying loads, and strong background noise (Huo et al., 2024). Under these conditions, fault-induced impulses suffer from dynamic frequency shifts and energy smearing in the time-frequency domain, rendering traditional stationary-based diagnostic methods ineffective (Mechanical Systems and Signal Processing, 2023; Shi et al., 2024). Consequently, accurately extracting weak fault features from noise-submerged signals under non-stationary and low Signal-to-Noise Ratio (SNR) conditions remains a critical challenge in condition monitoring (Li et al., 2024b; Miao et al., 2024).
To address speed fluctuations, Computed Order Tracking (COT) (Jiang et al., 2023; Wang et al., 2024; Zhang and Feng, 2021) is widely employed to resample non-stationary time-domain signals into angular-domain quasi-stationary signals, effectively correcting spectral smearing. Although COT can partially recover signal periodicity, sole reliance on it is often insufficient to enhance weak impulse components under early fault or strong-noise conditions. Furthermore, the resampling process inevitably introduces interpolation errors. To further enhance impulse features, deconvolution algorithms (e.g., MED, MCKD, and MOMEDA) (McDonald and Zhao, 2017; Miao et al., 2017; Wang et al., 2019; Zhang, 2024) and adaptive mode decomposition methods (e.g., EMD and VMD) (Chauhan et al., 2024; Lei et al., 2013; Mechanical Systems and Signal Processing, 2024) have been extensively investigated. Recent studies on signal decomposition techniques have provided comprehensive comparisons and demonstrated their effectiveness in structural health monitoring applications (Civera and Surace, 2021). However, deconvolution methods are often limited by the extraction of single components or a dependency on prior fault periods. Similarly, while decomposition methods like VMD (Li et al., 2020; Lu et al., 2025; Wan et al., 2018) offer better noise robustness, their performance is highly sensitive to the predetermination of mode numbers and penalty factors. This lack of adaptability makes them difficult to apply effectively to complex and variable industrial data.
Recently, Feature Mode Decomposition (FMD) (ISA Transactions, 2025; Miao et al., 2023) and its variant, angle-domain FMD (AFMD) (Mechanical Systems and Signal Processing, 2021; Miao et al., 2023, 2025), have demonstrated significant advantages in noise suppression and periodic impulse extraction by utilizing Correlated Kurtosis (CK) (Hogg, 1972; Ma et al., 2021) or Average Kurtosis (AK) (Huo et al., 2025; Mechanical Systems and Signal Processing, 2021) as objective functions. However, a critical limitation restricts the application of existing AFMD methods: feature extraction performance is highly sensitive to the selection of filtering parameters, specifically the filter length, number of filters, and mode number (Gao et al., 2022; Yan and Jia, 2022). Conventionally, these parameters are selected empirically or via trial-and-error. Such strategies prove inadequate under significant speed fluctuations or varying signal-to-noise ratios (SNR), where improper settings directly lead to under-decomposition (feature loss) or over-decomposition (spurious modes), severely compromising algorithmic robustness. Despite these limitations, these methods (VMD, FMD, and AFMD variants) remain widely used benchmark approaches in rotating machinery fault diagnosis.
In recent years, intelligent condition monitoring techniques have been increasingly applied in practical engineering systems, particularly in Europe, including mechatronic systems, robotic platforms, and industrial inspection processes (Kumar et al., 2022). These applications highlight the urgent need for robust diagnostic methods capable of handling non-stationary operating conditions and strong-noise interference in real-world environments. To address these limitations and achieve robust feature extraction under extreme conditions, this paper proposes a parameter-adaptive ED-GAFMD framework, in which an entropy-driven optimization mechanism is embedded into AFMD and a Grey Wolf Optimizer (GWO) is employed to globally search the optimal decomposition parameters, enabling adaptive matching between AFMD settings and non-stationary signal characteristics. A coarse-to-fine cascade enhancement strategy is further adopted to improve robustness under variable-speed and strong-noise conditions, while a lightweight 1D-CNN is employed for end-to-end fault classification (Ahmadzadeh et al., 2025; Lu et al., 2022). This strategy comprises three tightly coupled stages. First, the Coarse Processing stage addresses drastic speed fluctuations by utilizing Computed Order Tracking (COT) to resample non-stationary time-domain signals into angular-domain quasi-stationary signals, fundamentally mitigating frequency modulation interference. Second, the Fine Extraction stage targets interpolation residuals and strong background noise. By abandoning empirical parameter selection, this stage introduces the Grey Wolf Optimizer (GWO) (Dada et al., 2022; Heroual et al., 2024; Liu et al., 2024) with Permutation Entropy (PE) (Kay et al., 2024; Ma et al., 2025; Sun et al., 2024)—which quantifies signal complexity—as the fitness function to adaptively search for the optimal AFMD parameter combination globally. Entropy-based indicators have been widely validated for anomaly detection and structural condition monitoring due to their strong sensitivity to dynamic complexity variations (Civera and Surace, 2022a; 2022b),This step precisely purifies weak periodic impulses from the noise-laden signal. Finally, in the Intelligent Identification stage, the high-SNR modes purified by ED-GAFMD are input into a lightweight 1D-CNN. Benefiting from the high quality of the input features, the network achieves high-precision fault pattern recognition across operating conditions with minimal parameters.
Validations using the University of Ottawa variable-condition dataset and simulation experiments demonstrate that ED-GAFMD outperforms current mainstream methods in feature extraction and diagnostic accuracy, even under rapid speed variations and strong-noise levels as low as −10dB (Li et al., 2024a; Zhang et al., 2024).
2. Improved feature mode decomposition
To address the challenge of extracting weak bearing fault features under variable speed and strong background noise conditions, this paper proposes an Entropy-Driven Grey Wolf Optimizer-based Angle-Domain Feature Mode Decomposition method (ED-GAFMD). As illustrated in Figure 1, the proposed method adopts a “coarse-to-fine” cascade enhancement strategy, comprising three core stages. First, Computed Order Tracking (COT) is utilized to eliminate speed fluctuations and establish a stationary angular-domain baseline. Second, an entropy-driven adaptive parameter optimization strategy is introduced, employing GWO to globally optimize the key parameters of AFMD, thereby achieving the refined purification of weak impulse features. Finally, a lightweight 1D-CNN is integrated to realize end-to-end intelligent fault diagnosis. Flowchart of the proposed method.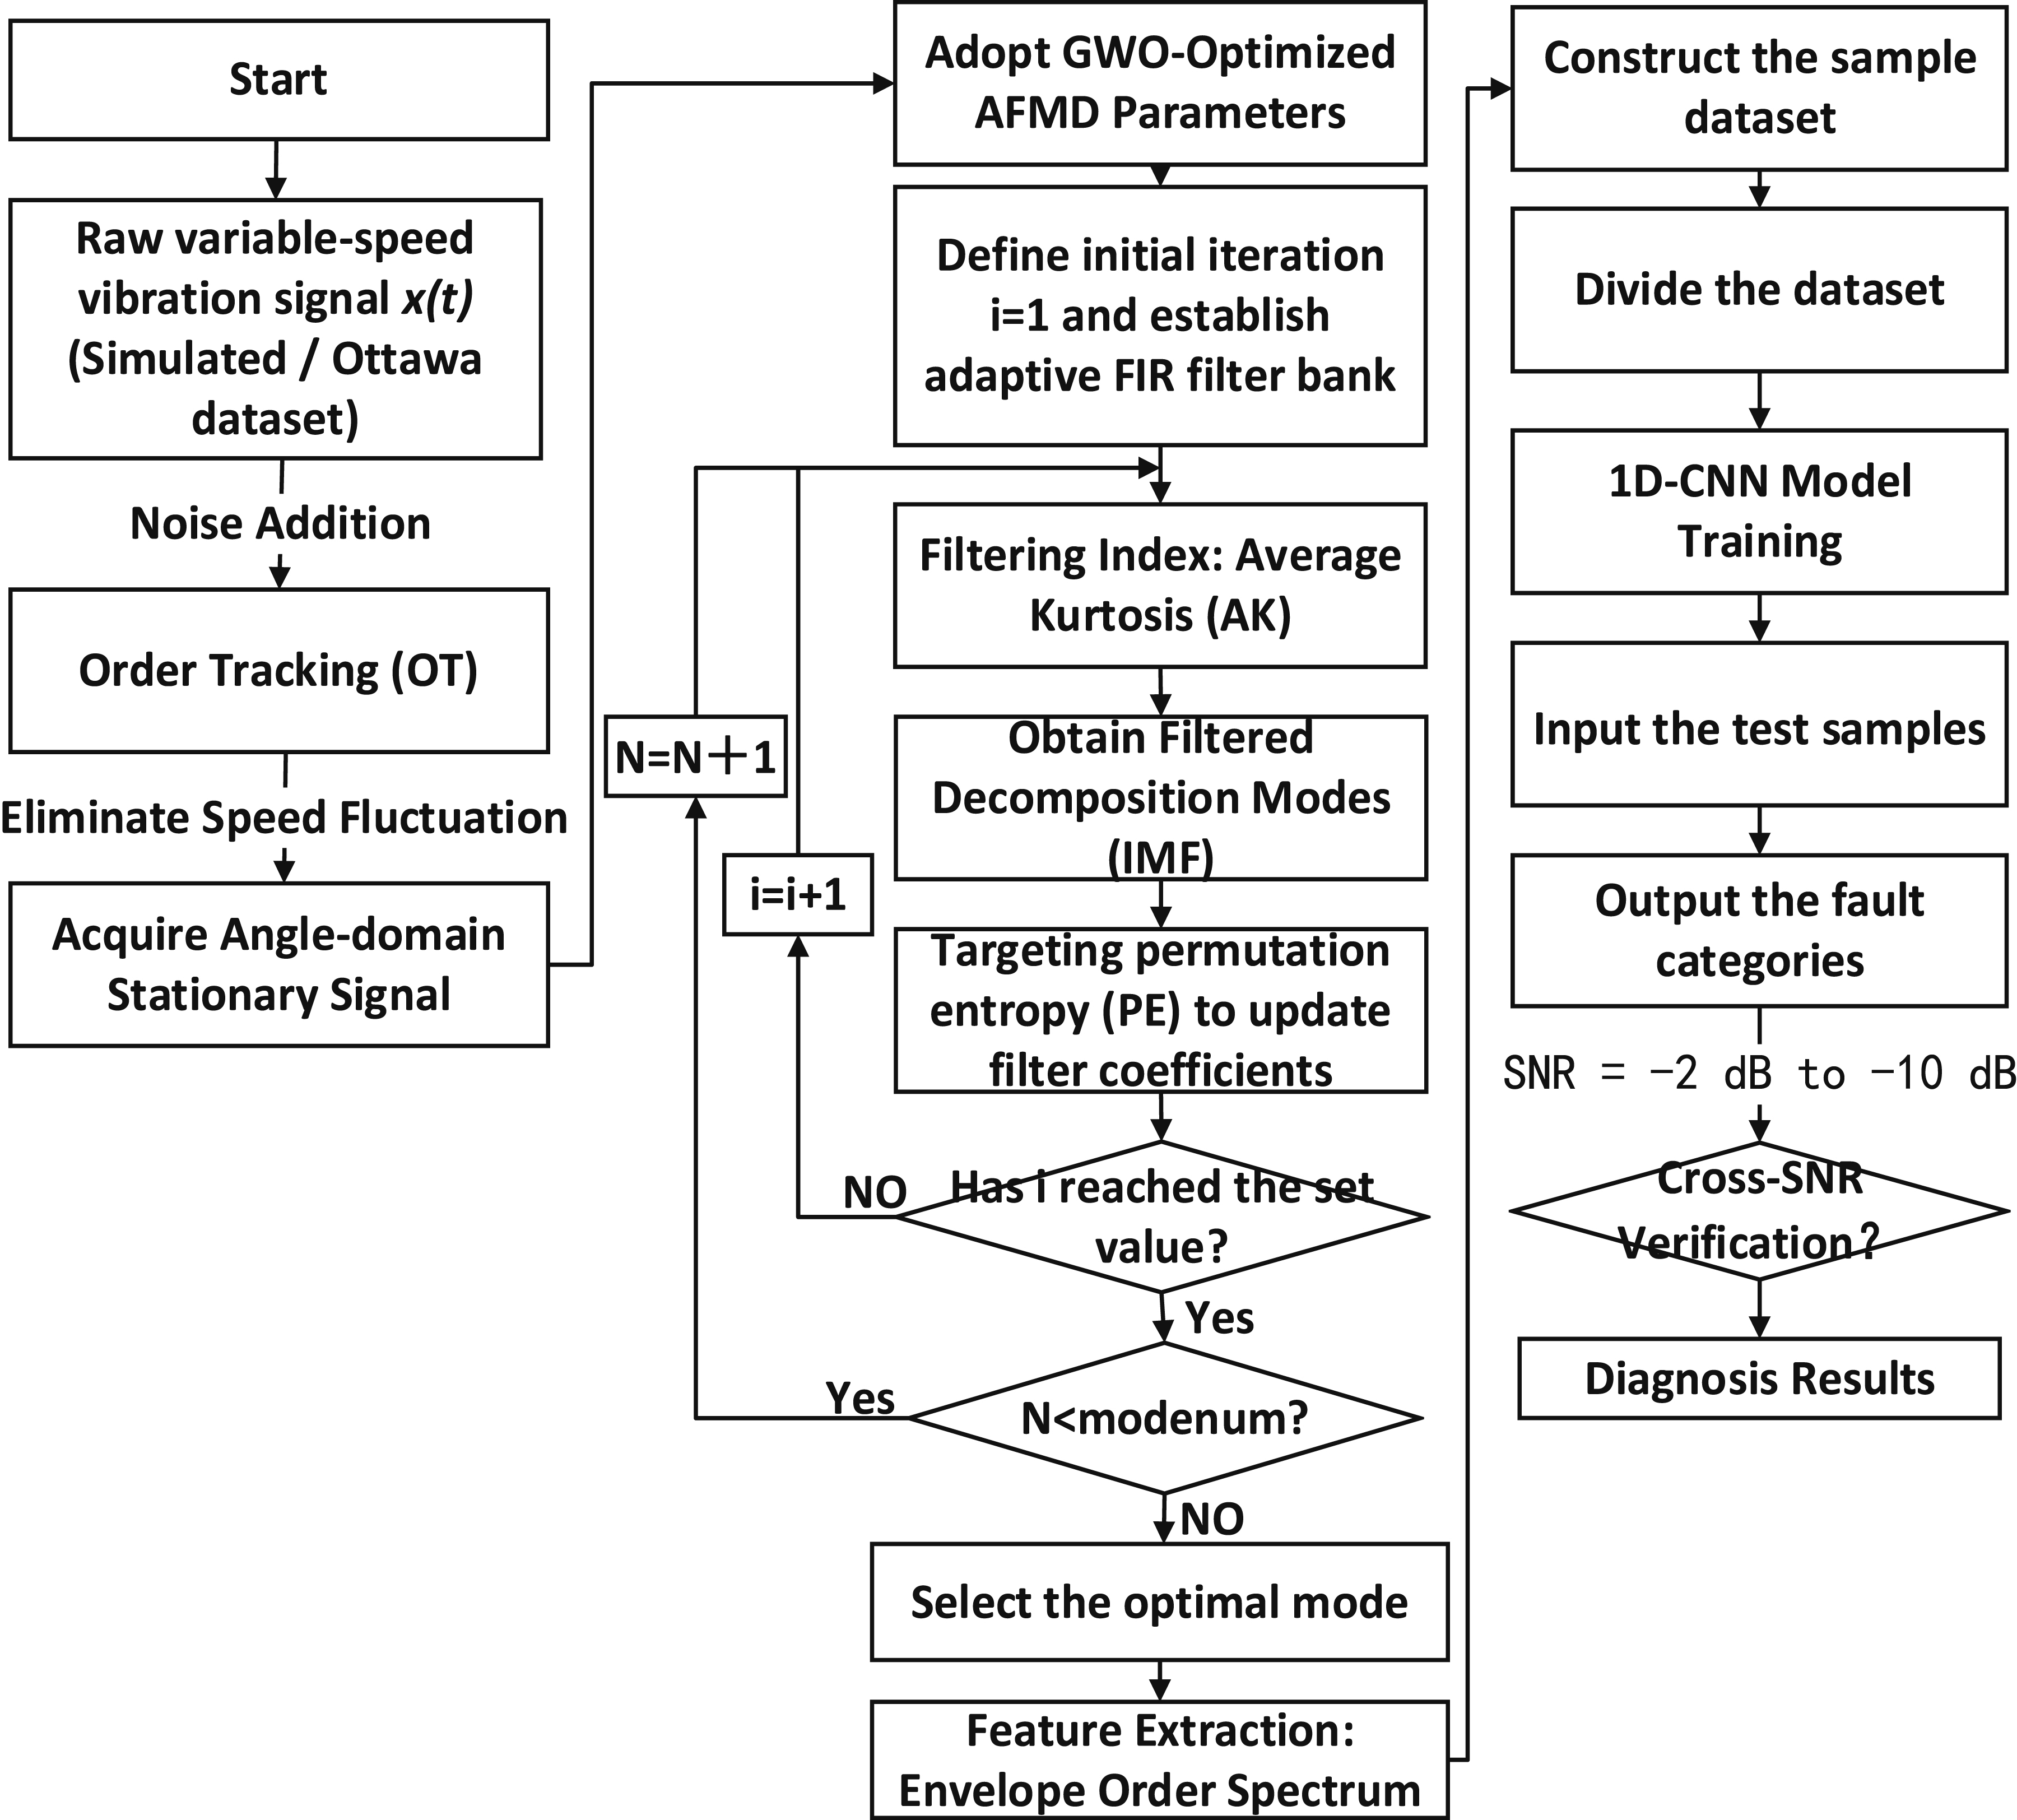
2.1. Optimized angle-domain feature mode decomposition
Although Computed Order Tracking (COT) (Jiang et al., 2023; Wu et al., nd; Zhao et al., 2013) can convert non-stationary time-domain signals into quasi-stationary angular-domain sequences, effectively suppressing frequency modulation, impulse components during the early fault stage are often submerged by resampling residuals and strong background noise. To address this, this paper introduces the AFMD algorithm (Miao et al., 2023, 2025) based on COT to achieve deep feature separation.
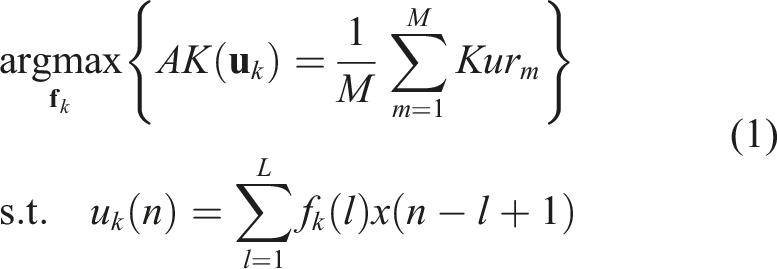
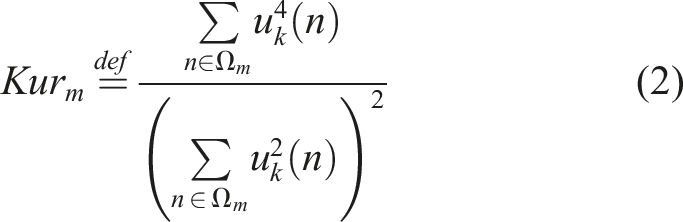
AFMD is fundamentally an adaptive filter bank design method (Miao et al., 2023, 2025). For the angular-domain vibration sequence x(θ) pre-processed via COT, AFMD aims to construct a set of optimal filters by iteratively updating the Finite Impulse Response (FIR) filter coefficients f k = [f k (1), …, f k (L)]. The objective is to maximize the Average Kurtosis (AK) of the filtered output modes u k , thereby significantly enhancing periodic fault impulses.
2.1.1. Construction of the objective function
Considering that fault impulses within angular-domain signals exhibit strict cyclostationarity, AFMD formulates the feature extraction process as the following constrained optimization problem:
2.1.2. Fast iterative solution
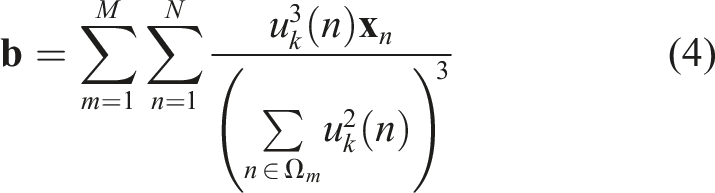
To solve the aforementioned non-convex optimization problem, the concept of Generalized Eigenvalue Decomposition (GEVD) is utilized. By calculating the partial derivative of the objective function with respect to the filter coefficients f
k
and setting it to zero, a fixed-point iteration algorithm in matrix form is derived:

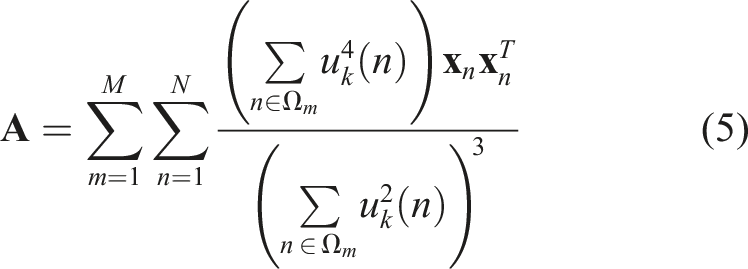
Here, the analytical expressions for the weighted correlation matrix A and the weighted correlation vector b are given as follows:
2.1.3. Period segmentation strategy
Accurate period segmentation is a prerequisite for calculating AK. Since the input signal has been converted into an angular-domain sequence, the Fault Characteristic Order (FCO) becomes a constant value independent of speed variations. The boundary point n
m
between adjacent fault periods can be directly determined by the following equation:
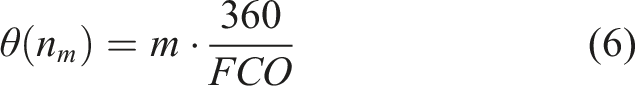
This strategy avoids the cumulative errors resulting from the integration of instantaneous speed in traditional time-domain methods, significantly enhancing computational stability.
2.2. Entropy-driven adaptive parameter optimization
In the AFMD algorithm, the selection of filtering parameters dictates the efficacy of signal decomposition. A complex nonlinear coupling relationship exists among the parameter triplet (n, K, and L) (Ahmadzadeh et al., 2025; Lu et al., 2022) The filter length L determines the frequency-domain resolution and the decay of time-domain impulses, while the mode number n and the number of filters K jointly determine the granularity of frequency band partition. Relying solely on empirical selection makes the method prone to the dilemma of “under-decomposition” (where fault features are not isolated) or “over-decomposition” (where noise is misinterpreted as modes). To address this, this paper proposes an adaptive parameter optimization strategy based on the Grey Wolf Optimizer (GWO) (Dada et al., 2022; Liu et al., 2024) and Permutation Entropy (PE) (Kay et al., 2024; Ma et al., 2025; Sun et al., 2024).
2.2.1. Fitness function: Permutation entropy (PE)
To quantify mode SNR and regularity, Permutation Entropy (PE) serves as the GWO fitness function. Unlike kurtosis (Miao et al., 2017), PE is more sensitive to noise fluctuations and effectively measures signal complexity. Optimal AFMD parameters yield periodic fault impulses with high orderliness and minimized PE. Conversely, improper settings retain noise, increasing randomness and PE values (Kay et al., 2024; McDonald and Zhao, 2017; Sun et al., 2024).
For a time series {x(i)}, PE is defined as follows:
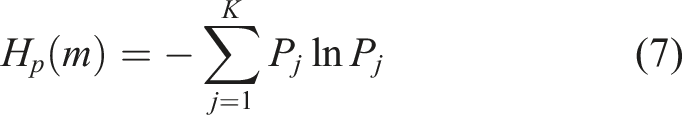
In the specific implementation of this study, the embedding dimension is set to
2.2.2. Dual-metric screening mechanism
Single metrics rarely balance global denoising and local feature enhancement effectively. To address this, a hierarchical dual screening mechanism is proposed: 1. Inner Optimization (Global Search Stage): The GWO algorithm is driven by minimizing PE. This stage prioritizes the “overall orderliness” of the decomposition, aiming to isolate pure mode components from noisy signals while avoiding local optima. 2. Outer Screening (Decision Stage): Upon obtaining optimal parameters, mode selection is performed using the Maximum Kurtosis principle (Miao et al., 2017). Leveraging the high sensitivity of kurtosis to impulses, this step identifies the most significant fault-sensitive mode (Best IMF) from the low-noise candidates, ensuring the distinctiveness of subsequent diagnostic features.
2.3. Implementation process of the ED-GAFMD algorithm
Based on the dual strategy, ED-GAFMD achieves adaptive extraction of weak fault features via a “coarse-to-fine” cascade process. The specific steps are outlined below (corresponding to Figure 1):


Iteratively converge to the global optimum and output the optimal parameter combination [n
*
, K
*
, L
*
].
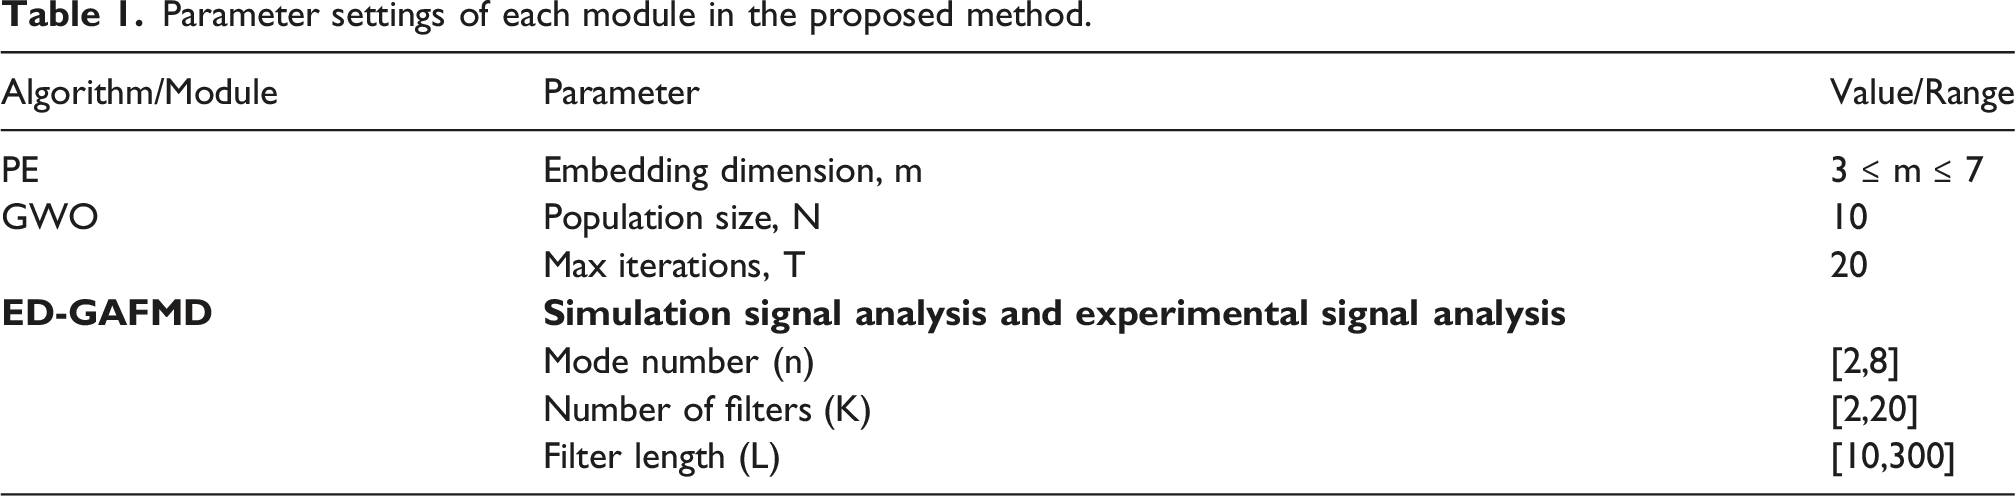
Parameter settings of each module in the proposed method.
Parameter settings of the 1D-CNN diagnostic model.
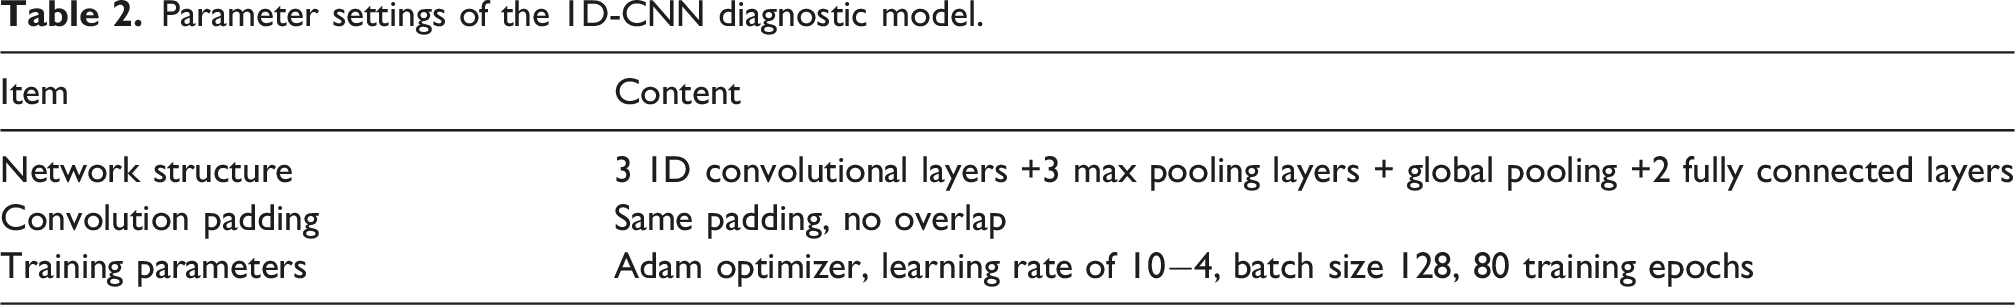
The model consists of 3 1D convolutional layers, 3 max pooling layers, global pooling and 2 fully connected layers. All convolutions adopt same padding without overlap, with kernel sizes of 11, 9, 7, channel numbers of 64, 128, 256, and uniform pooling size of 4. The model is trained by Adam optimizer with learning rate of 10-4, batch size of 128 and 80 epochs.
3. Simulation signal analysis
To validate ED-GAFMD under variable-speed and strong-noise conditions, a non-stationary simulation model is constructed based on bearing dynamics. Comparative analyses are conducted for inner and outer race faults.
3.1. Variable-speed non-stationary fault simulation model
To simulate complex responses under variable speed conditions, a composite signal incorporating fault impulses, speed fluctuations, load modulation, and strong background noise is constructed (Wang et al., 2022, 2023). The time-domain model is defined as Strong noise interference diagram.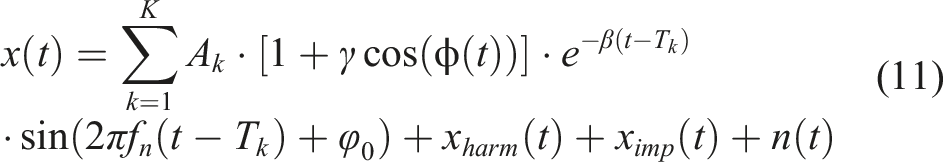
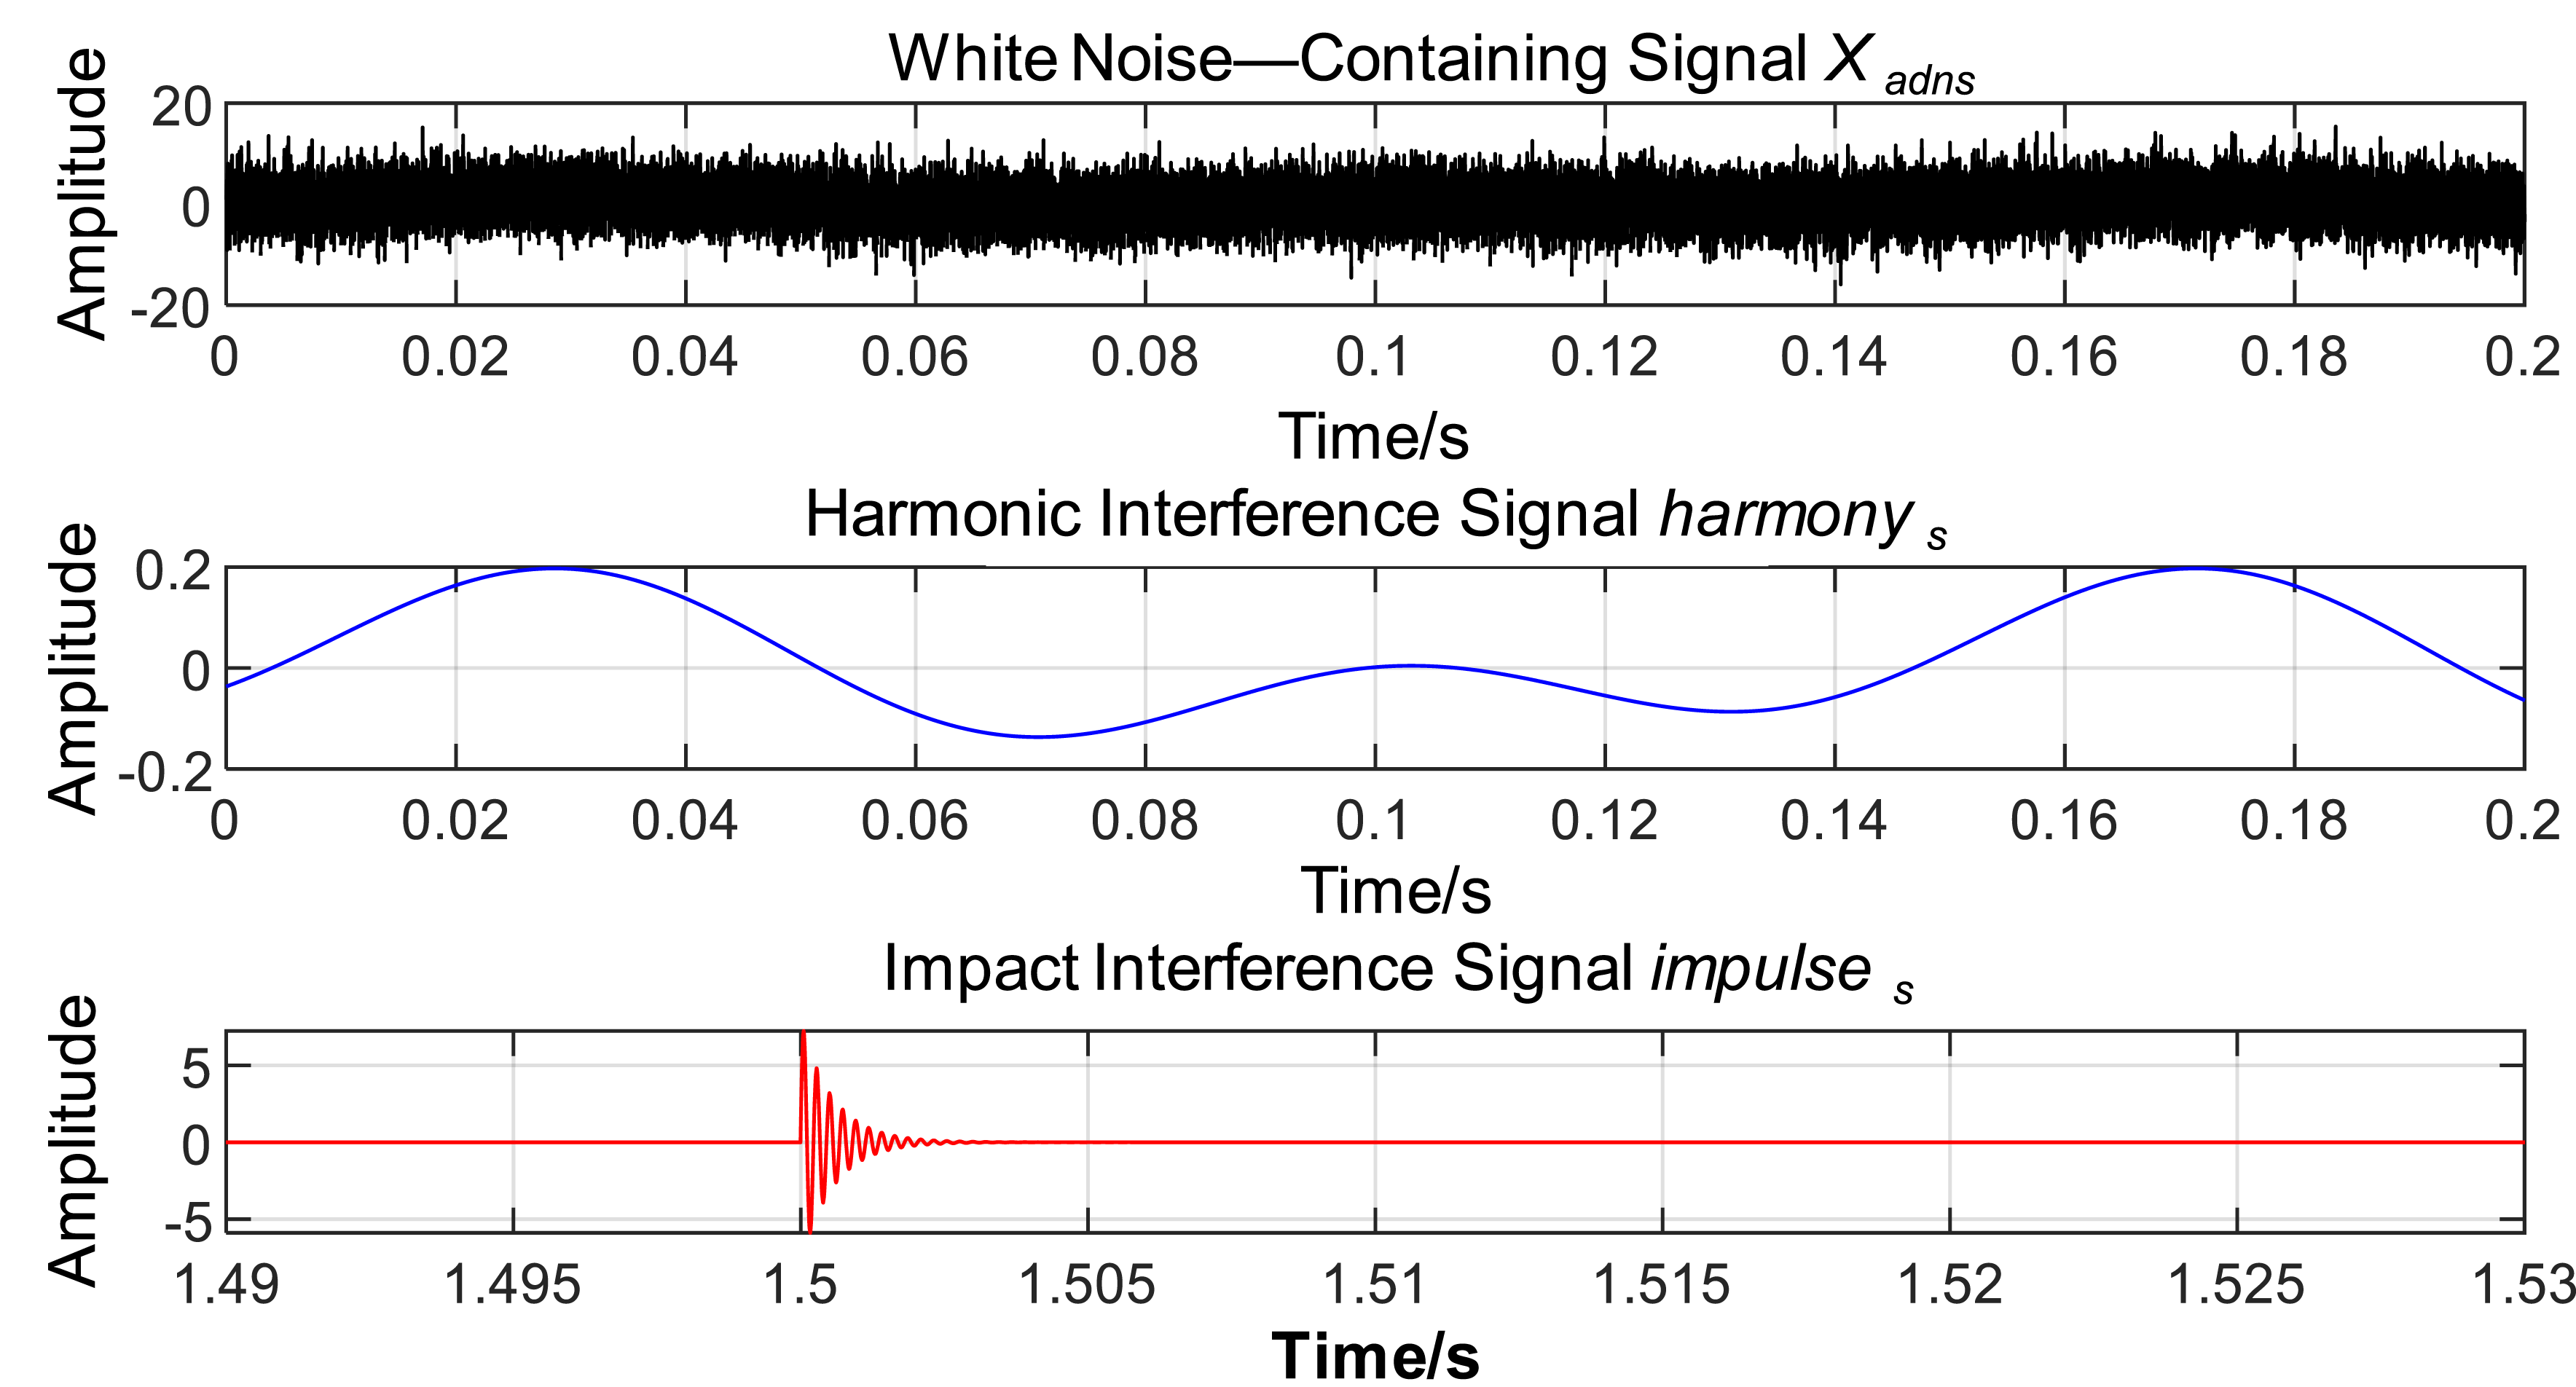
Simulating foundation vibrations or adjacent rotational equipment, with its frequencies set at 7 Hz and 14 Hz and constant amplitudes of 0.1. Meanwhile, x
imp
(t) denotes aperiodic impact interference (labeled as impulses in Figure 2), mimicking sporadic heavy mechanical collisions from peripheral equipment. These discrete impacts are introduced at non-periodic timestamps (t = 1.5 s and 3.2 s) with varying shock amplitudes (8 and 2, respectively), exciting a typical high-frequency structural resonance at 4415 Hz with a damping factor of 1800.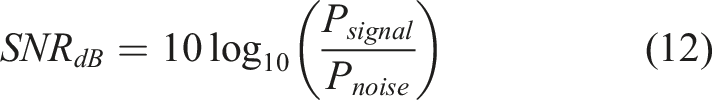
3.2. Outer race fault simulation
Simulation parameters for inner and outer race fault.
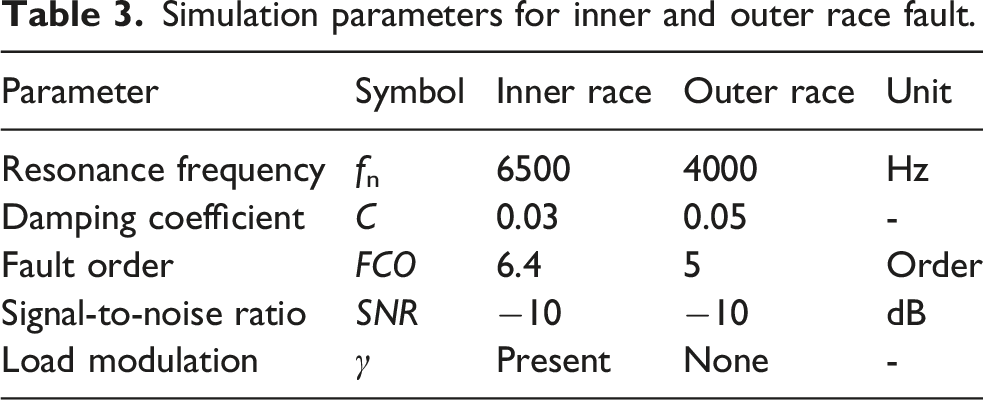
3.2.1. Analysis of Simulation Signals and proposed method
Figure 3 illustrates signal characteristics under variable speed (linear ramp 25–35 Hz, Figure 3(a)) and strong noise (SNR = −10dB). The raw waveforms for outer (Figure 3(b)) and inner (Figure 3(d)) races exhibit high disorder; fault impulses are completely submerged, obscuring speed-dependent impulse intervals. In the Envelope Order Spectra (Figure 3(c) and (e)), despite Order Tracking, the characteristic orders (Outer: 5.0; Inner: 6.4) are indistinguishable from the noise floor and surrounded by random interference. Consequently, traditional time-domain observation and basic order analysis fail to extract weak features under these coupled conditions. Time domain and envelope order spectrum of simulated raw signal. (a) outer race time domain, (b) its envelope order, (c) inner race time domain, (d) its envelope order.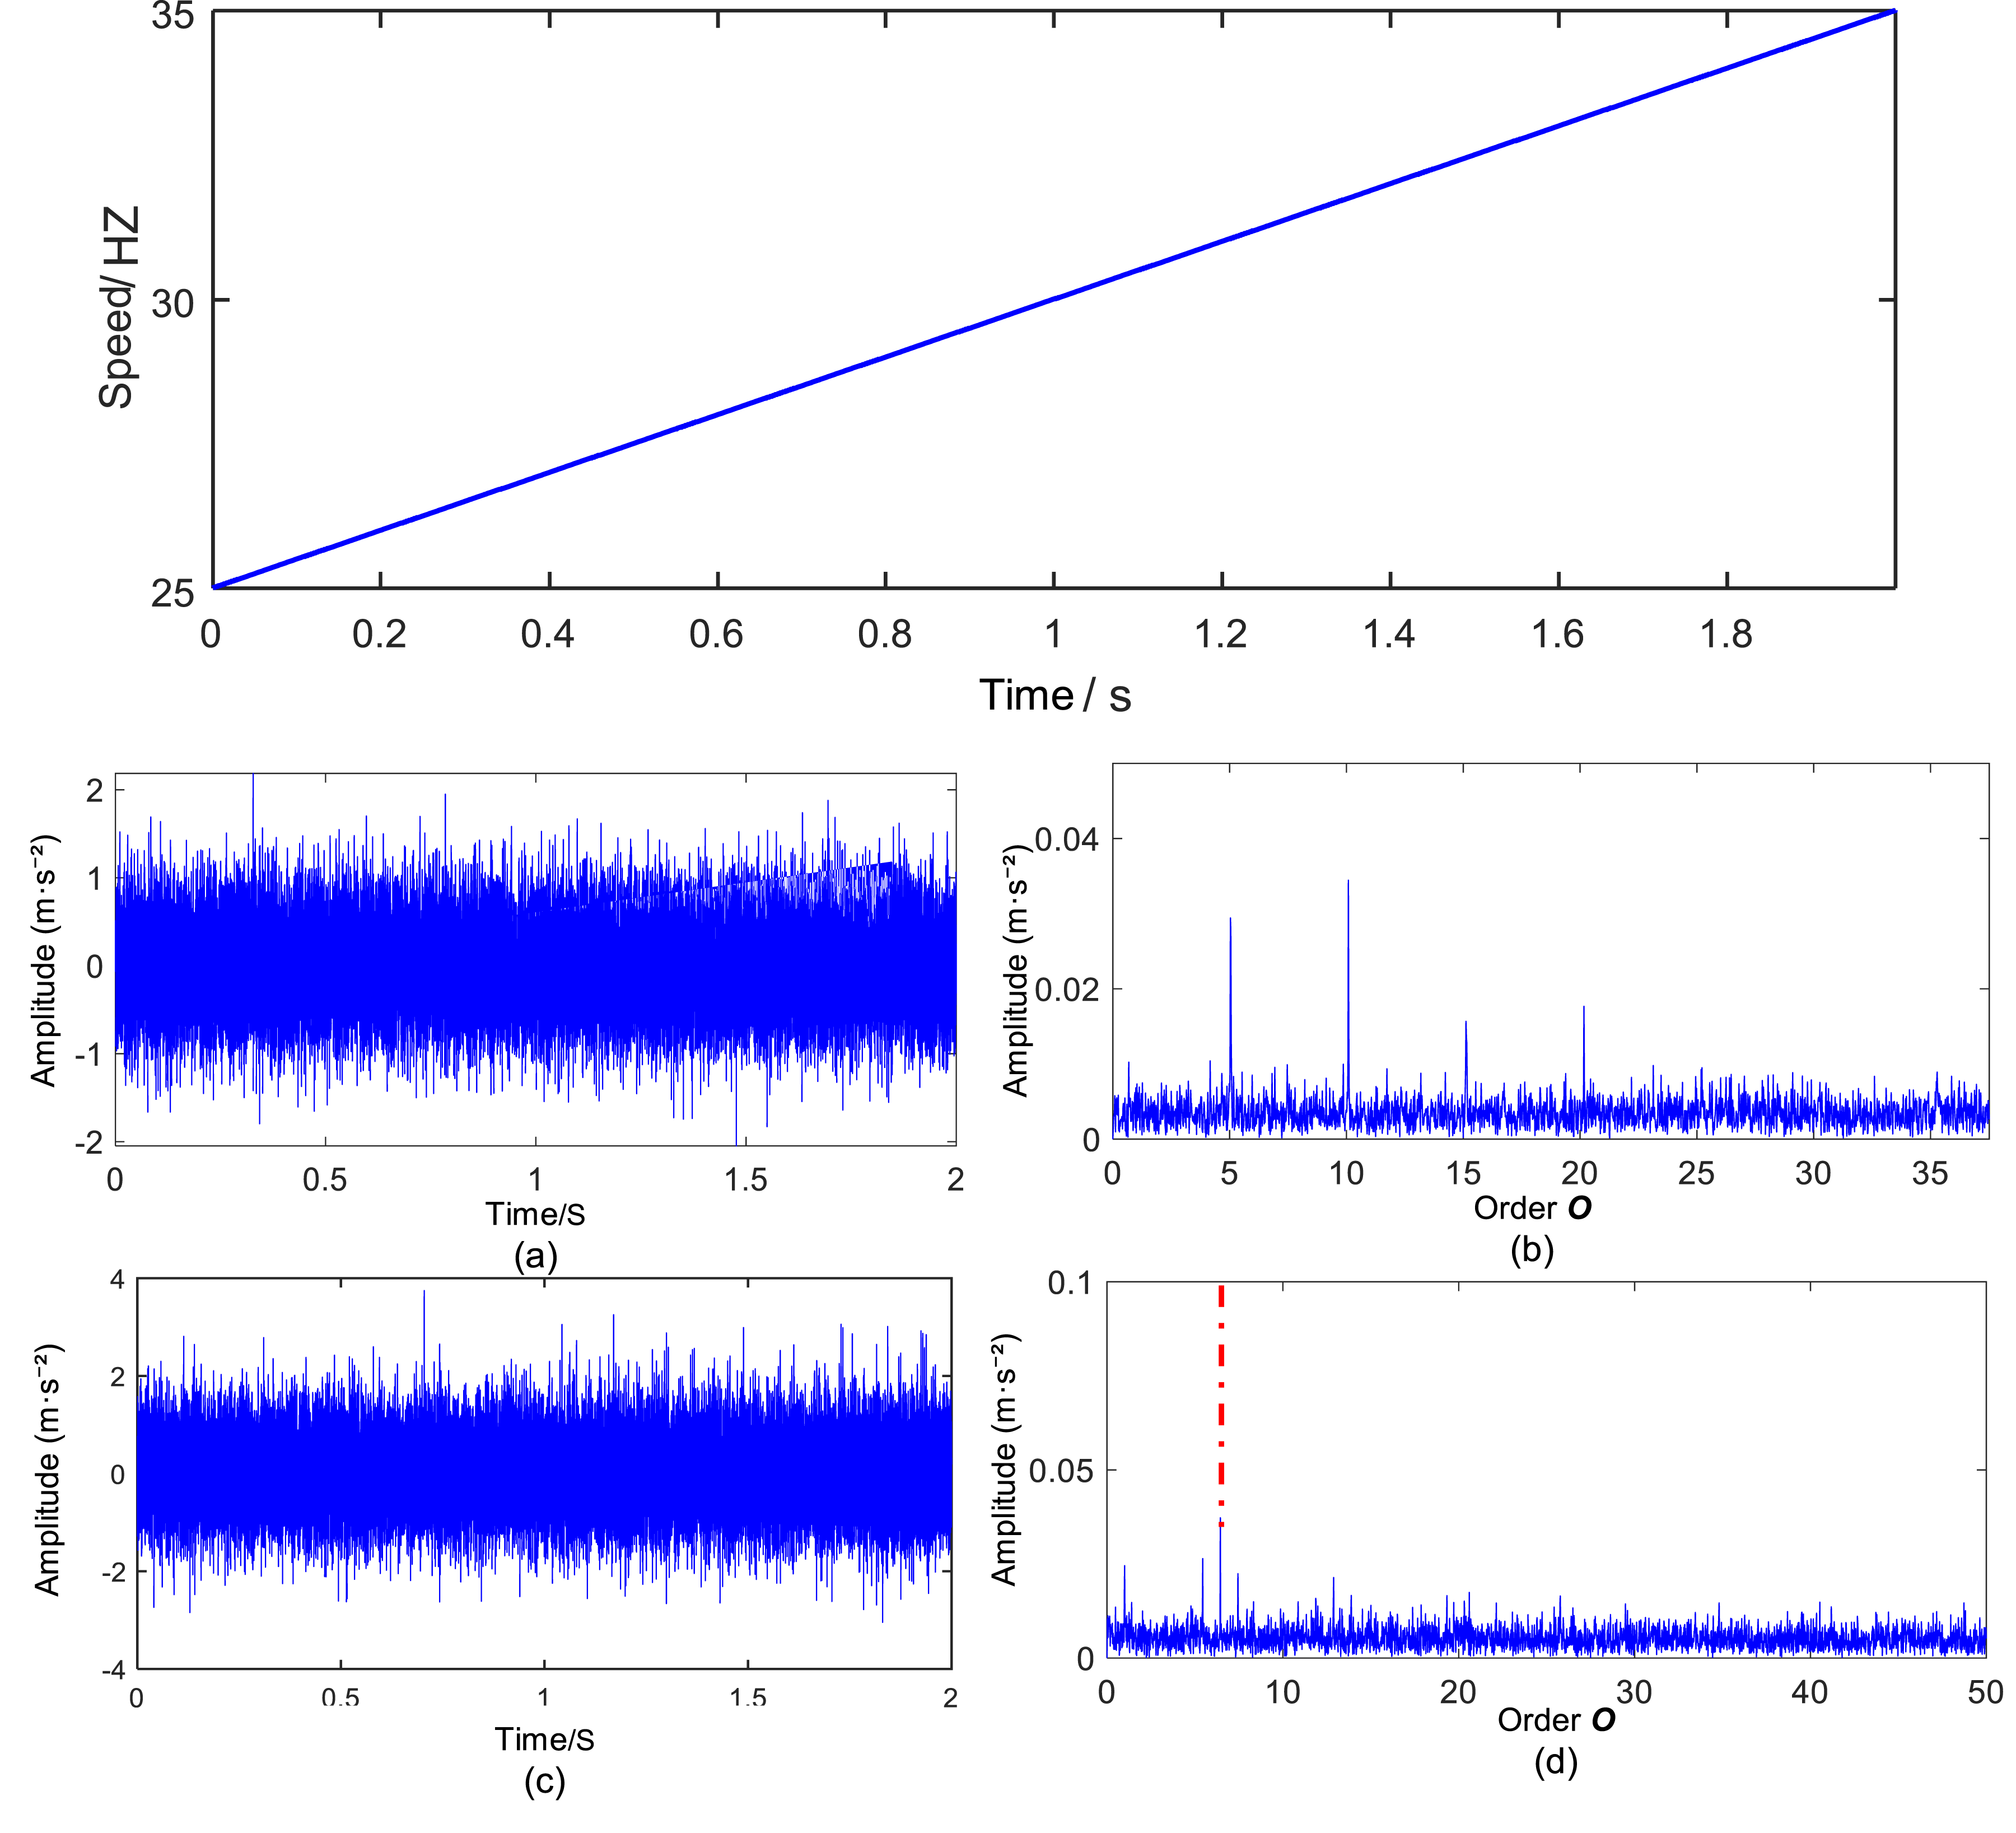
3.2.2. Adaptive diagnostic analysis via ED-GAFMD
To extract weak features masked by strong noise, the ED-GAFMD method is applied to the angular signals. The GWO search space is initialized as mode number n ∈ [2, 8], filter number K ∈ [2, 20], and filter length L ∈ [10, 300]. Using PE as the fitness function, the algorithm automatically seeks the optimal parameter combination.
For the outer race, GWO rapidly converged to the global optimum [n*, K*, L*] = [3, 7, 150]. Based on the Maximum Kurtosis Principle, the sensitive mode (Best IMF) was selected. As shown in Figure 4(a), the angular waveform significantly eliminates broadband noise, revealing a clear periodic impulse sequence. The Envelope Order Spectrum (Figure 4(b)) displays distinct peaks at the fault characteristic order (O
1
= 5.0) and its harmonics (2O
1
∼ 6O
1
) with a minimal noise floor, accurately identifying the outer race fault. Simulated signal results via proposed method. (a) outer race angular domain, (b) its envelope order, (c) inner race angular domain, (d) its envelope order.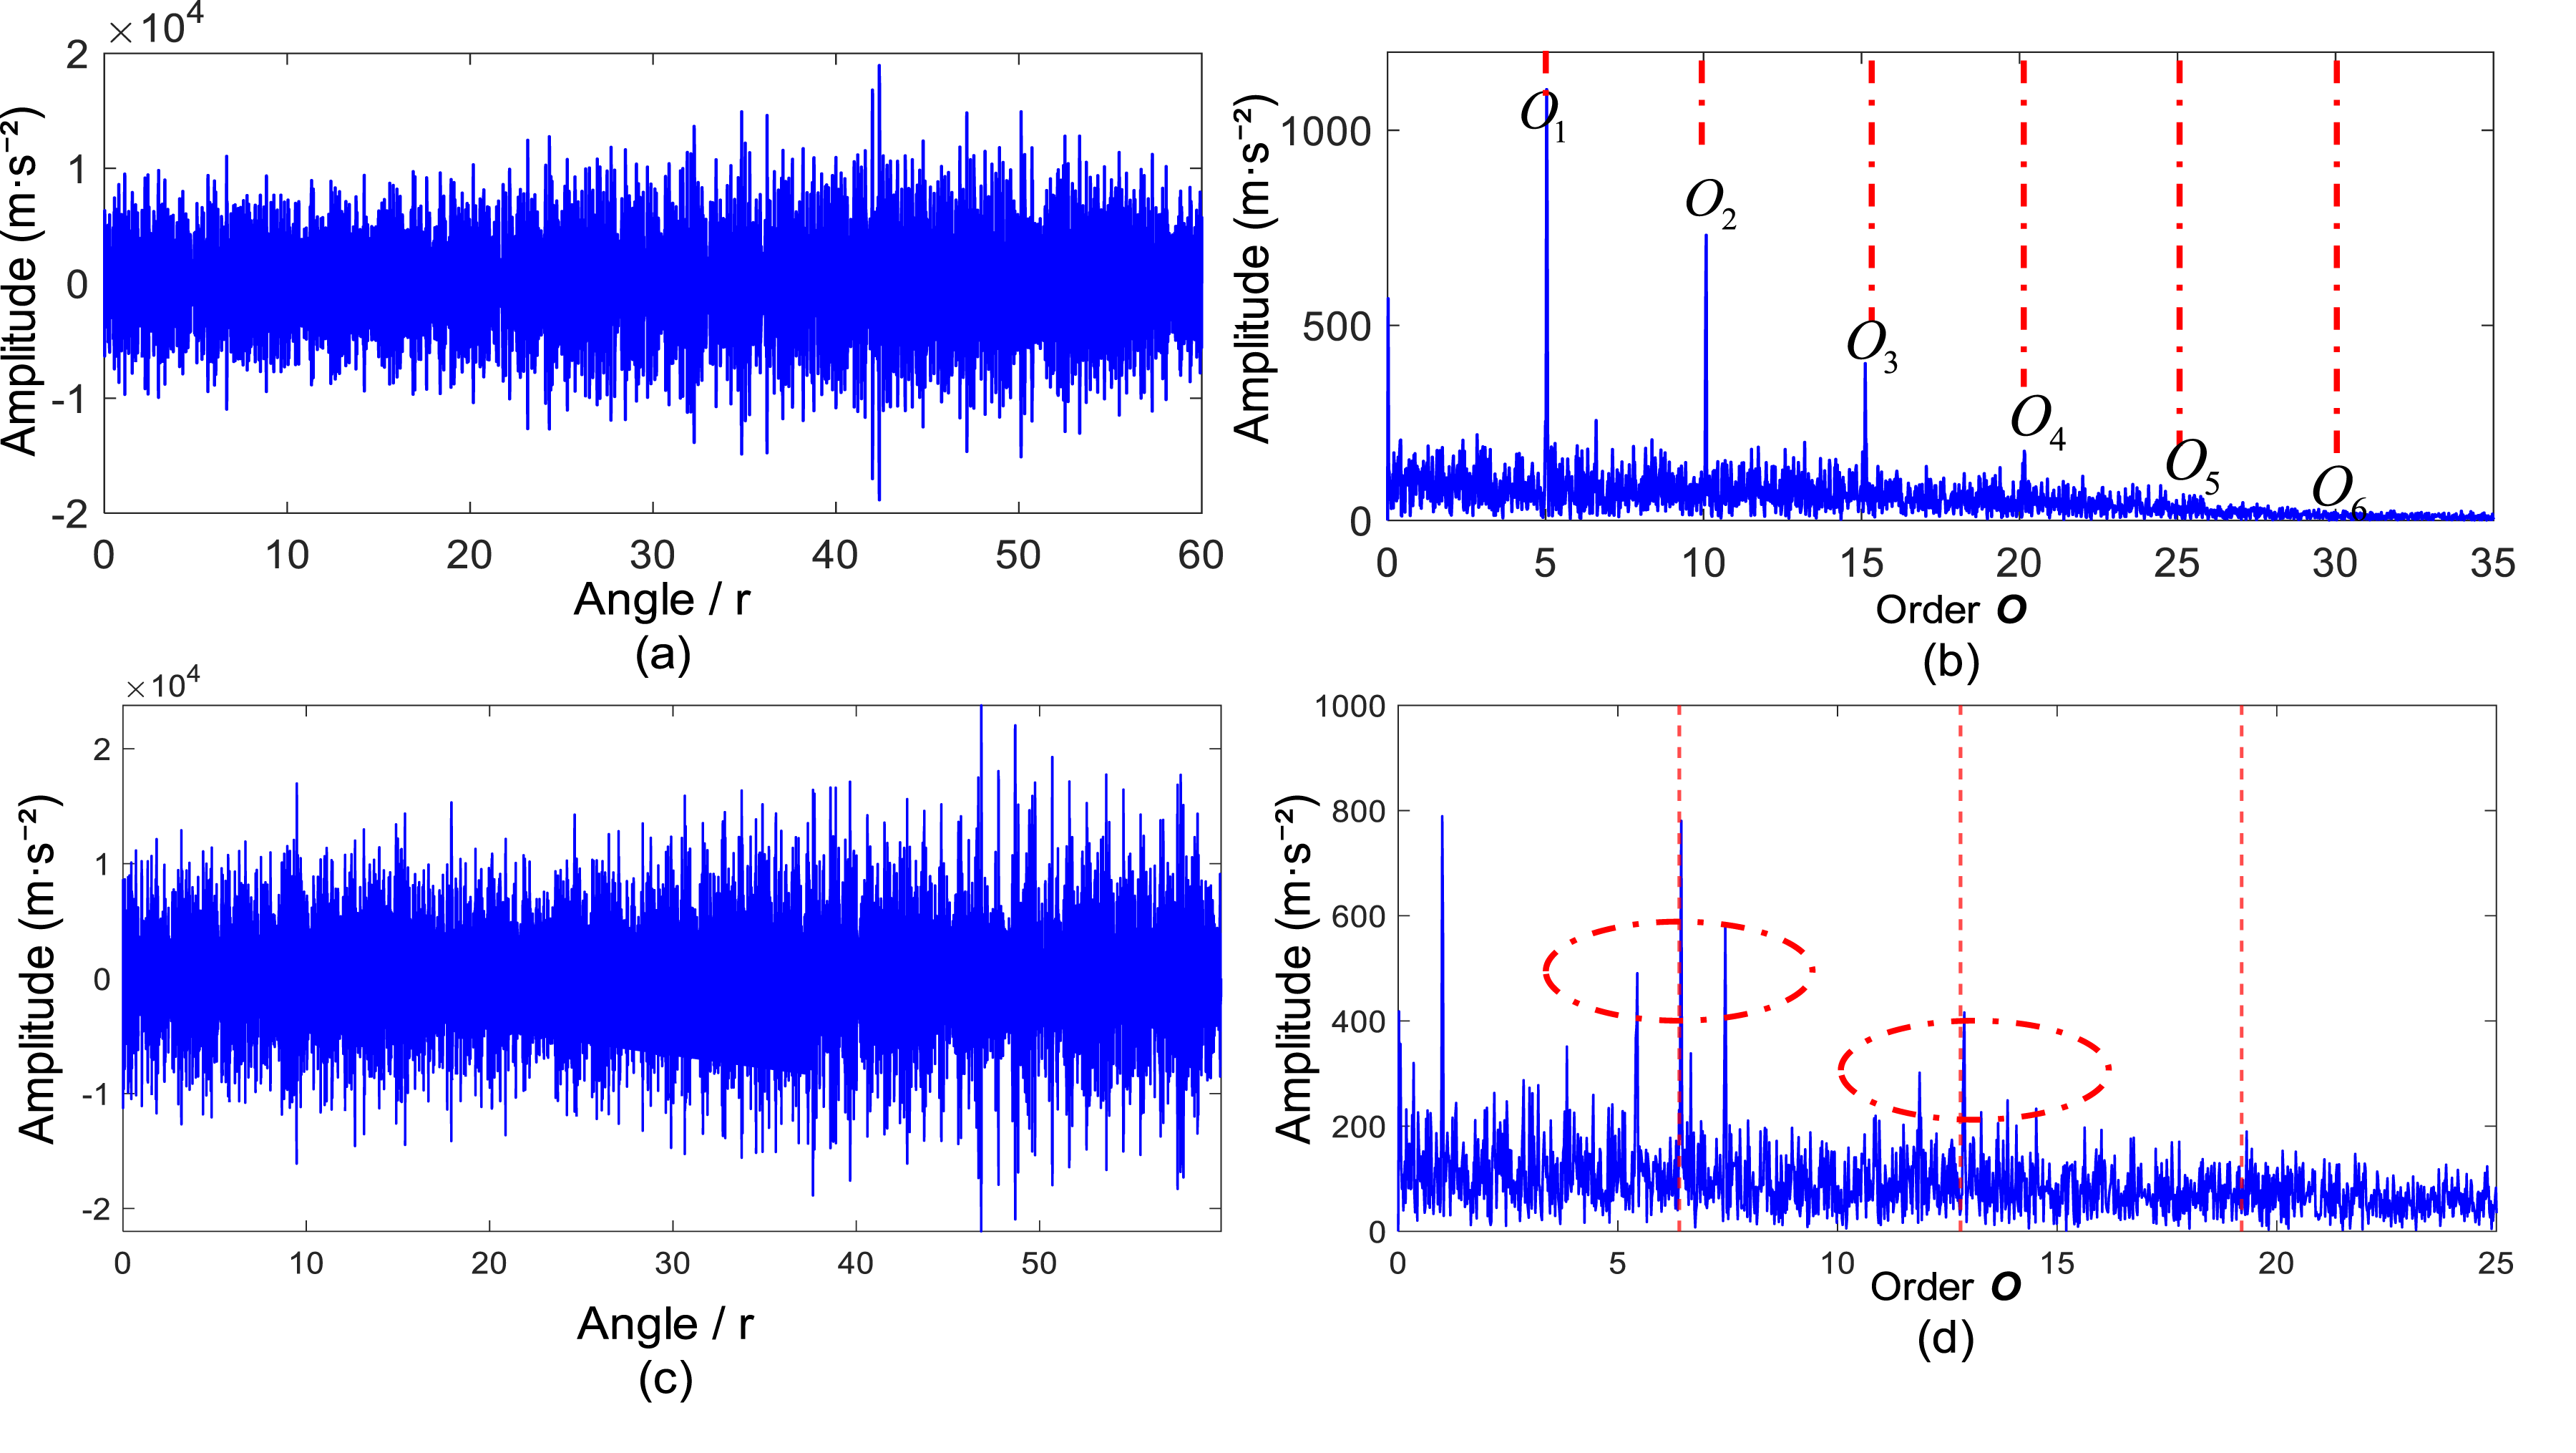
For the inner race, the algorithm adaptively selected a longer filter length to accommodate complex load modulation, yielding optimal parameters [n*, K*, L*] = [3, 7, 220]. The sensitive mode (Figure 4(c)) perfectly reconstructs the fault impulses. In the spectrum (Figure 4(d)), the characteristic order (6.4X) is precisely locked, and rotation speed sidebands (encircled in red) are clearly visible. This demonstrates that ED-GAFMD effectively suppresses noise while preserving the non-stationary modulation information unique to inner race faults.
In summary, whether for outer race faults characterized by simple impulses or inner race faults with complex modulation, ED-GAFMD adaptively matches optimal parameters to achieve precise feature extraction and diagnosis.
Figure 5 displays the modal decomposition results under optimal parameters. The algorithm effectively achieves orthogonal separation: the sub-dominant modes (Mode 2 and Mode 3) are low-amplitude and disordered, consisting primarily of broadband noise. Conversely, Mode 1 exhibits high SNR, with the fault characteristic order (O
1
) and its harmonics appearing sharp against a flat noise floor. Based on the Maximum Kurtosis Principle, Mode 1 is selected as the Best IMF, visually validating the precise focusing capability of ED-GAFMD on fault impulse energy. ED-GAFMD: Mode decomposition results (a) envelope order spec. of outer race modes, (b) envelope order spec. of inner race modes.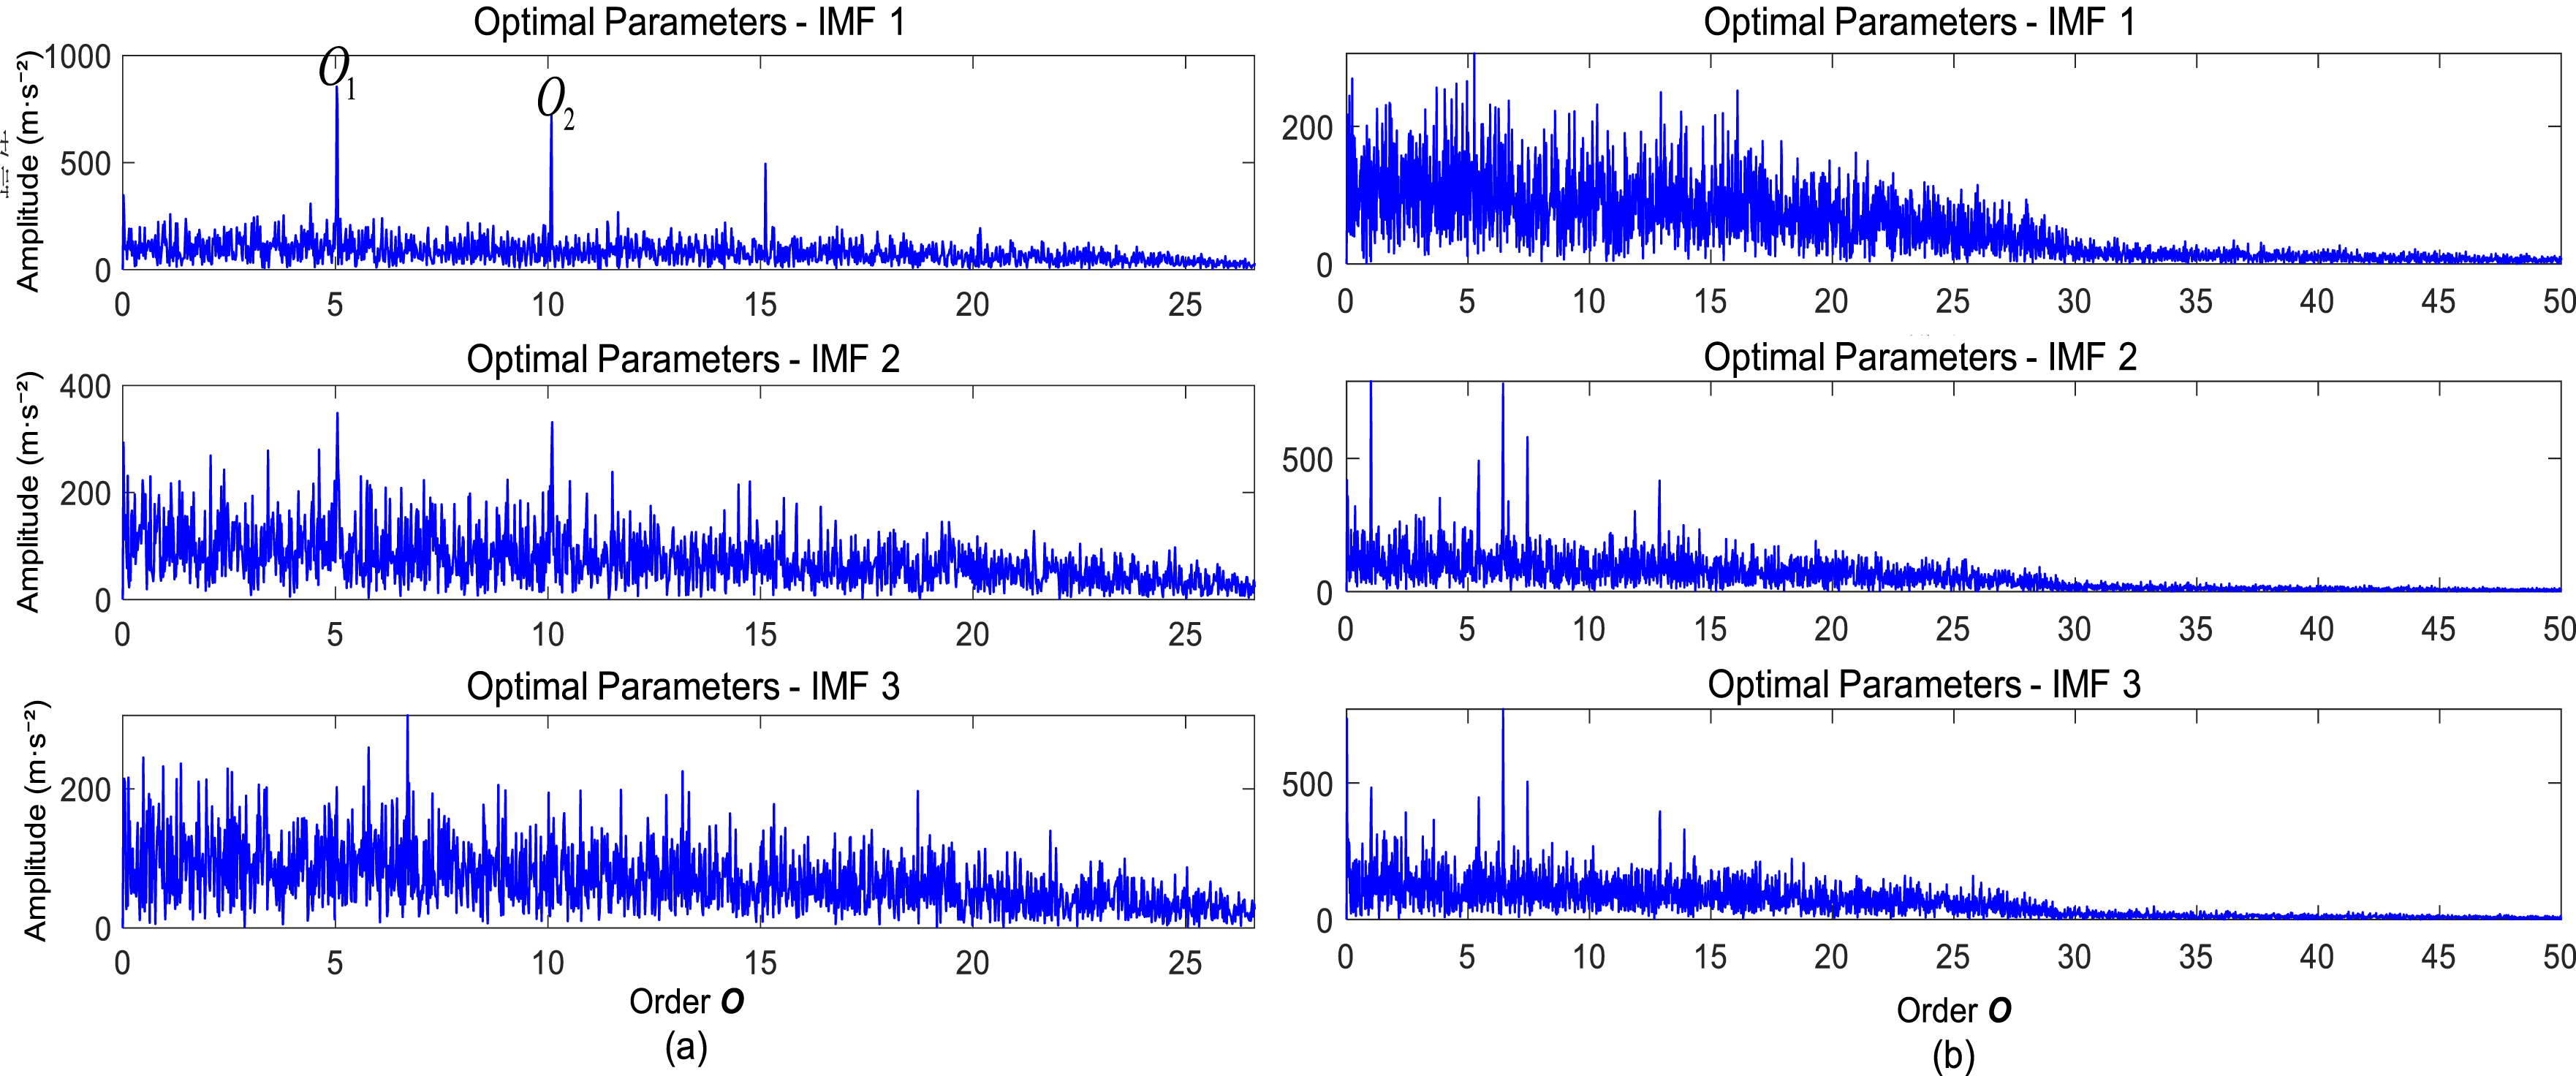
Figure 6 compares feature extraction performance before and after parameter optimization. With empirical parameters (L = 40, Figure 6(a)), improper bandwidth matching results in an excessive noise floor; fault features are submerged, leading to a high risk of missed diagnosis. In contrast, after GWO optimization (L = 150, Figure 6(b)), the filter establishes a narrow passband precisely matched to fault impulses. Consequently, background noise is significantly suppressed, and the amplitude of characteristic orders is drastically enhanced. This stark contrast demonstrates that the proposed adaptive optimization strategy is critical for improving diagnostic accuracy under non-stationary conditions with strong noise. Optimal Mode Order Spectrum: ED-GAFMD vs AFMD (a) outer race envelope order, (b) inner race envelope order.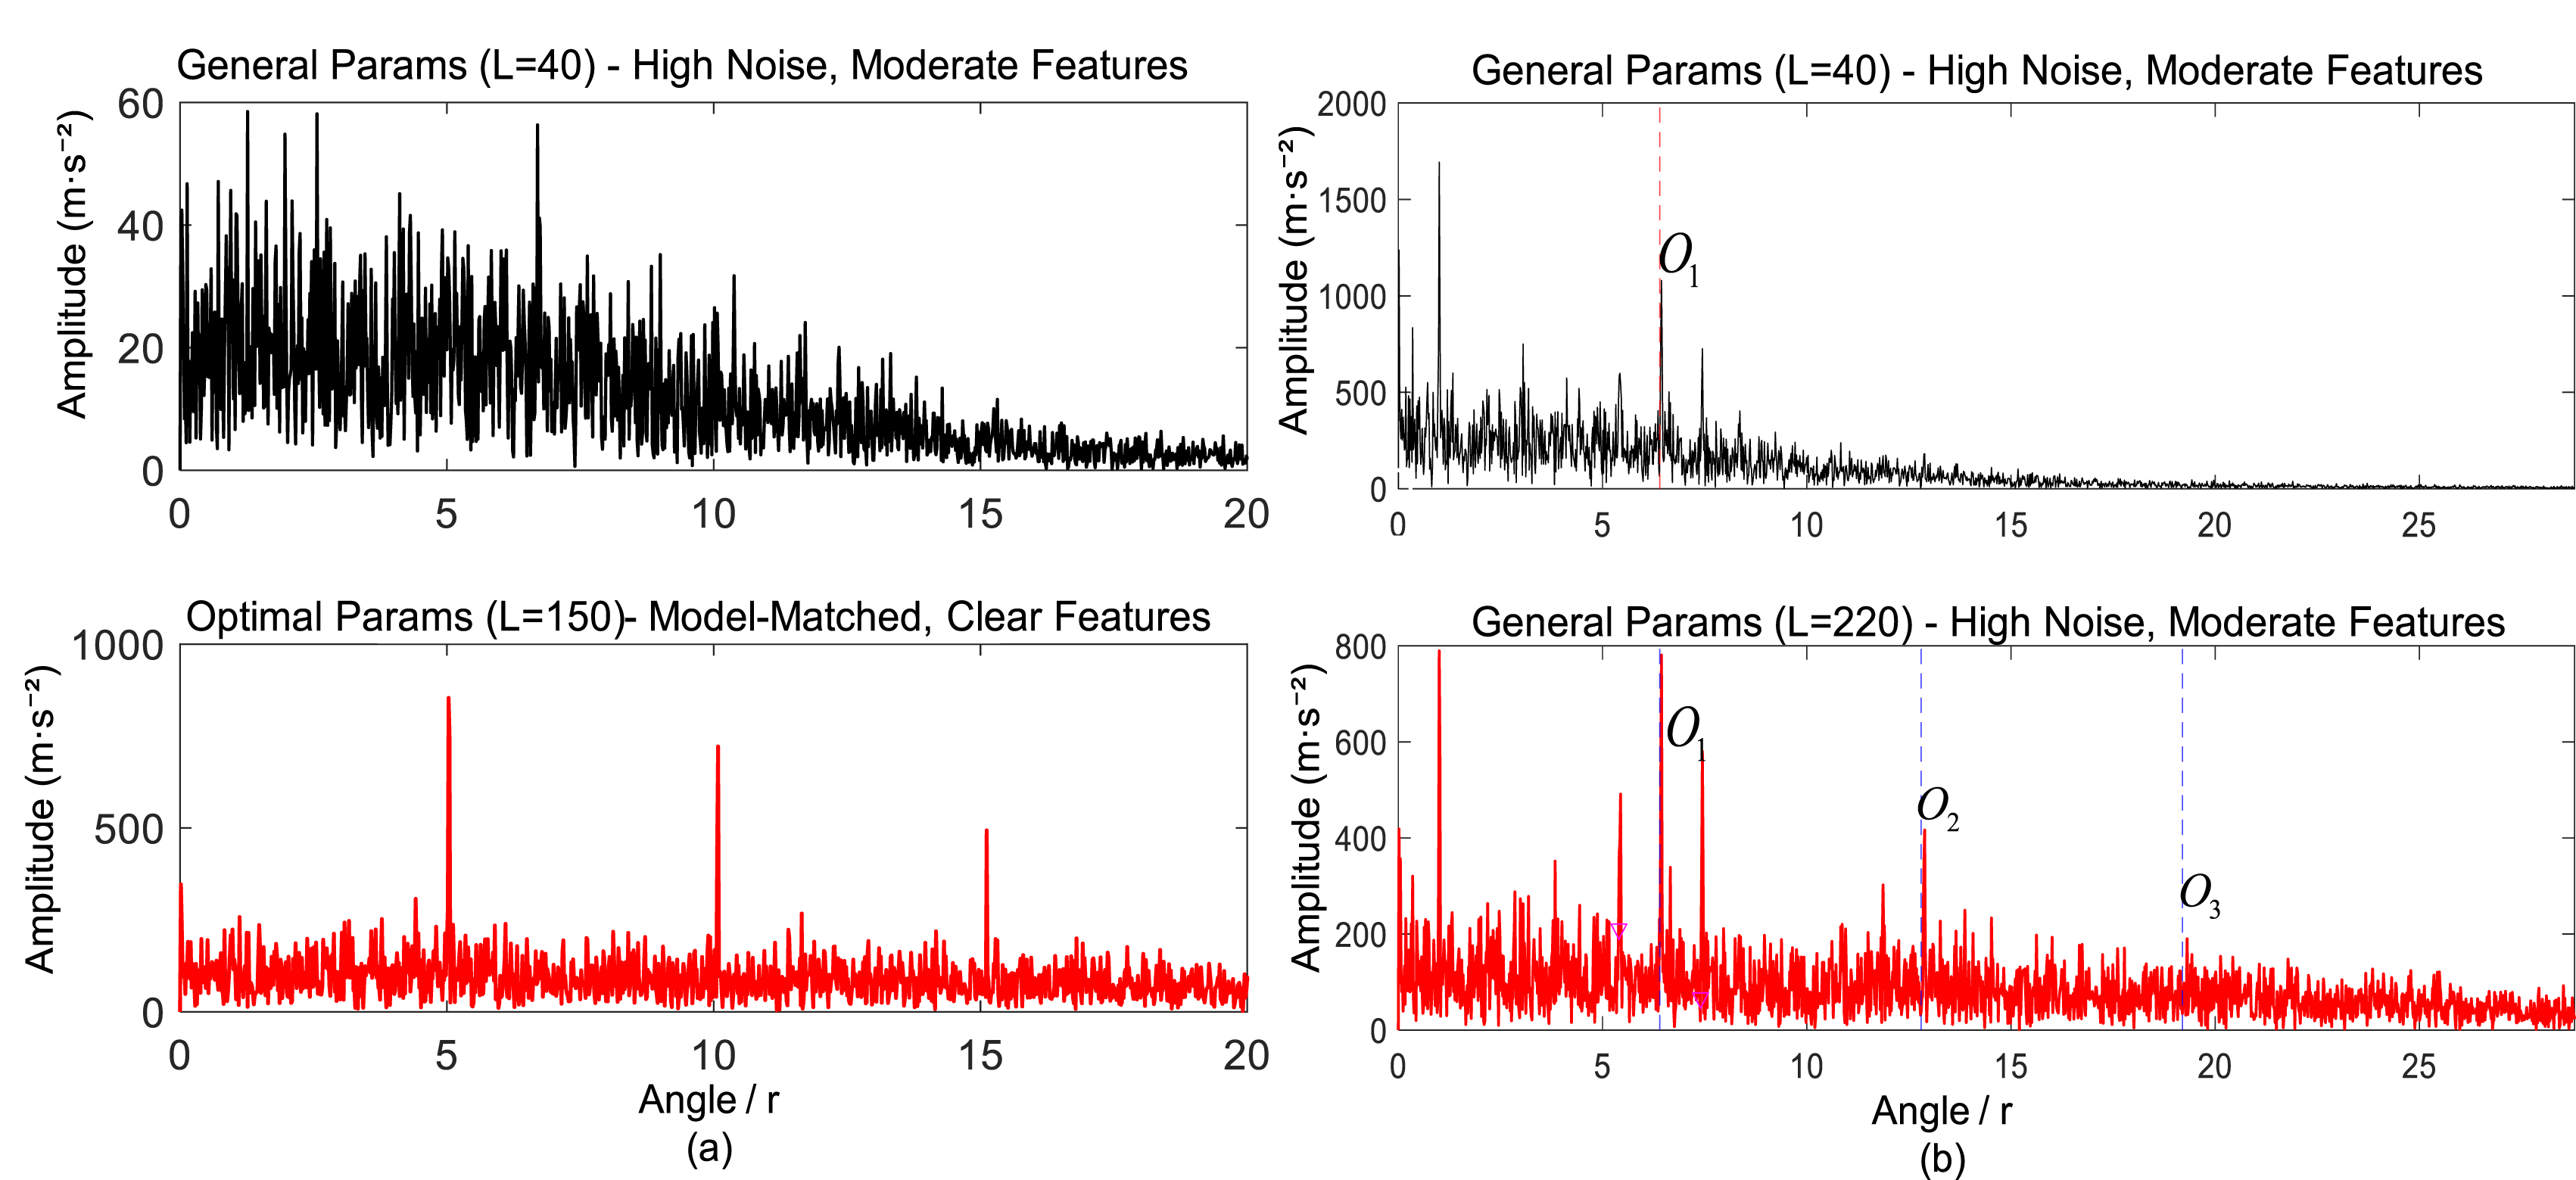
3.2.3. Comparative analysis and quantitative evaluation
To validate the superiority of ED-GAFMD, comparative analyses are conducted using three mainstream methods: AFMD, GWO-FMD, and GWO-VMD. Figures 7–9 display the Envelope Order Spectra of the best modes extracted by these methods. Analysis results of simulated signals via AFMD (general params). (a) Outer race angular domain, (b) its envelope order, (c) inner race angular domain, (d) its envelope order. Analysis results of simulated signals via GWO-FMD. (a) outer race angular domain (b) its envelope order, (c) inner race angular domain, (d) its envelope order. Analysis results of simulated signals via GWO-VMD. (a) outer race angular domain, (b) its envelope order, (c) inner race angular domain, (d) its envelope order.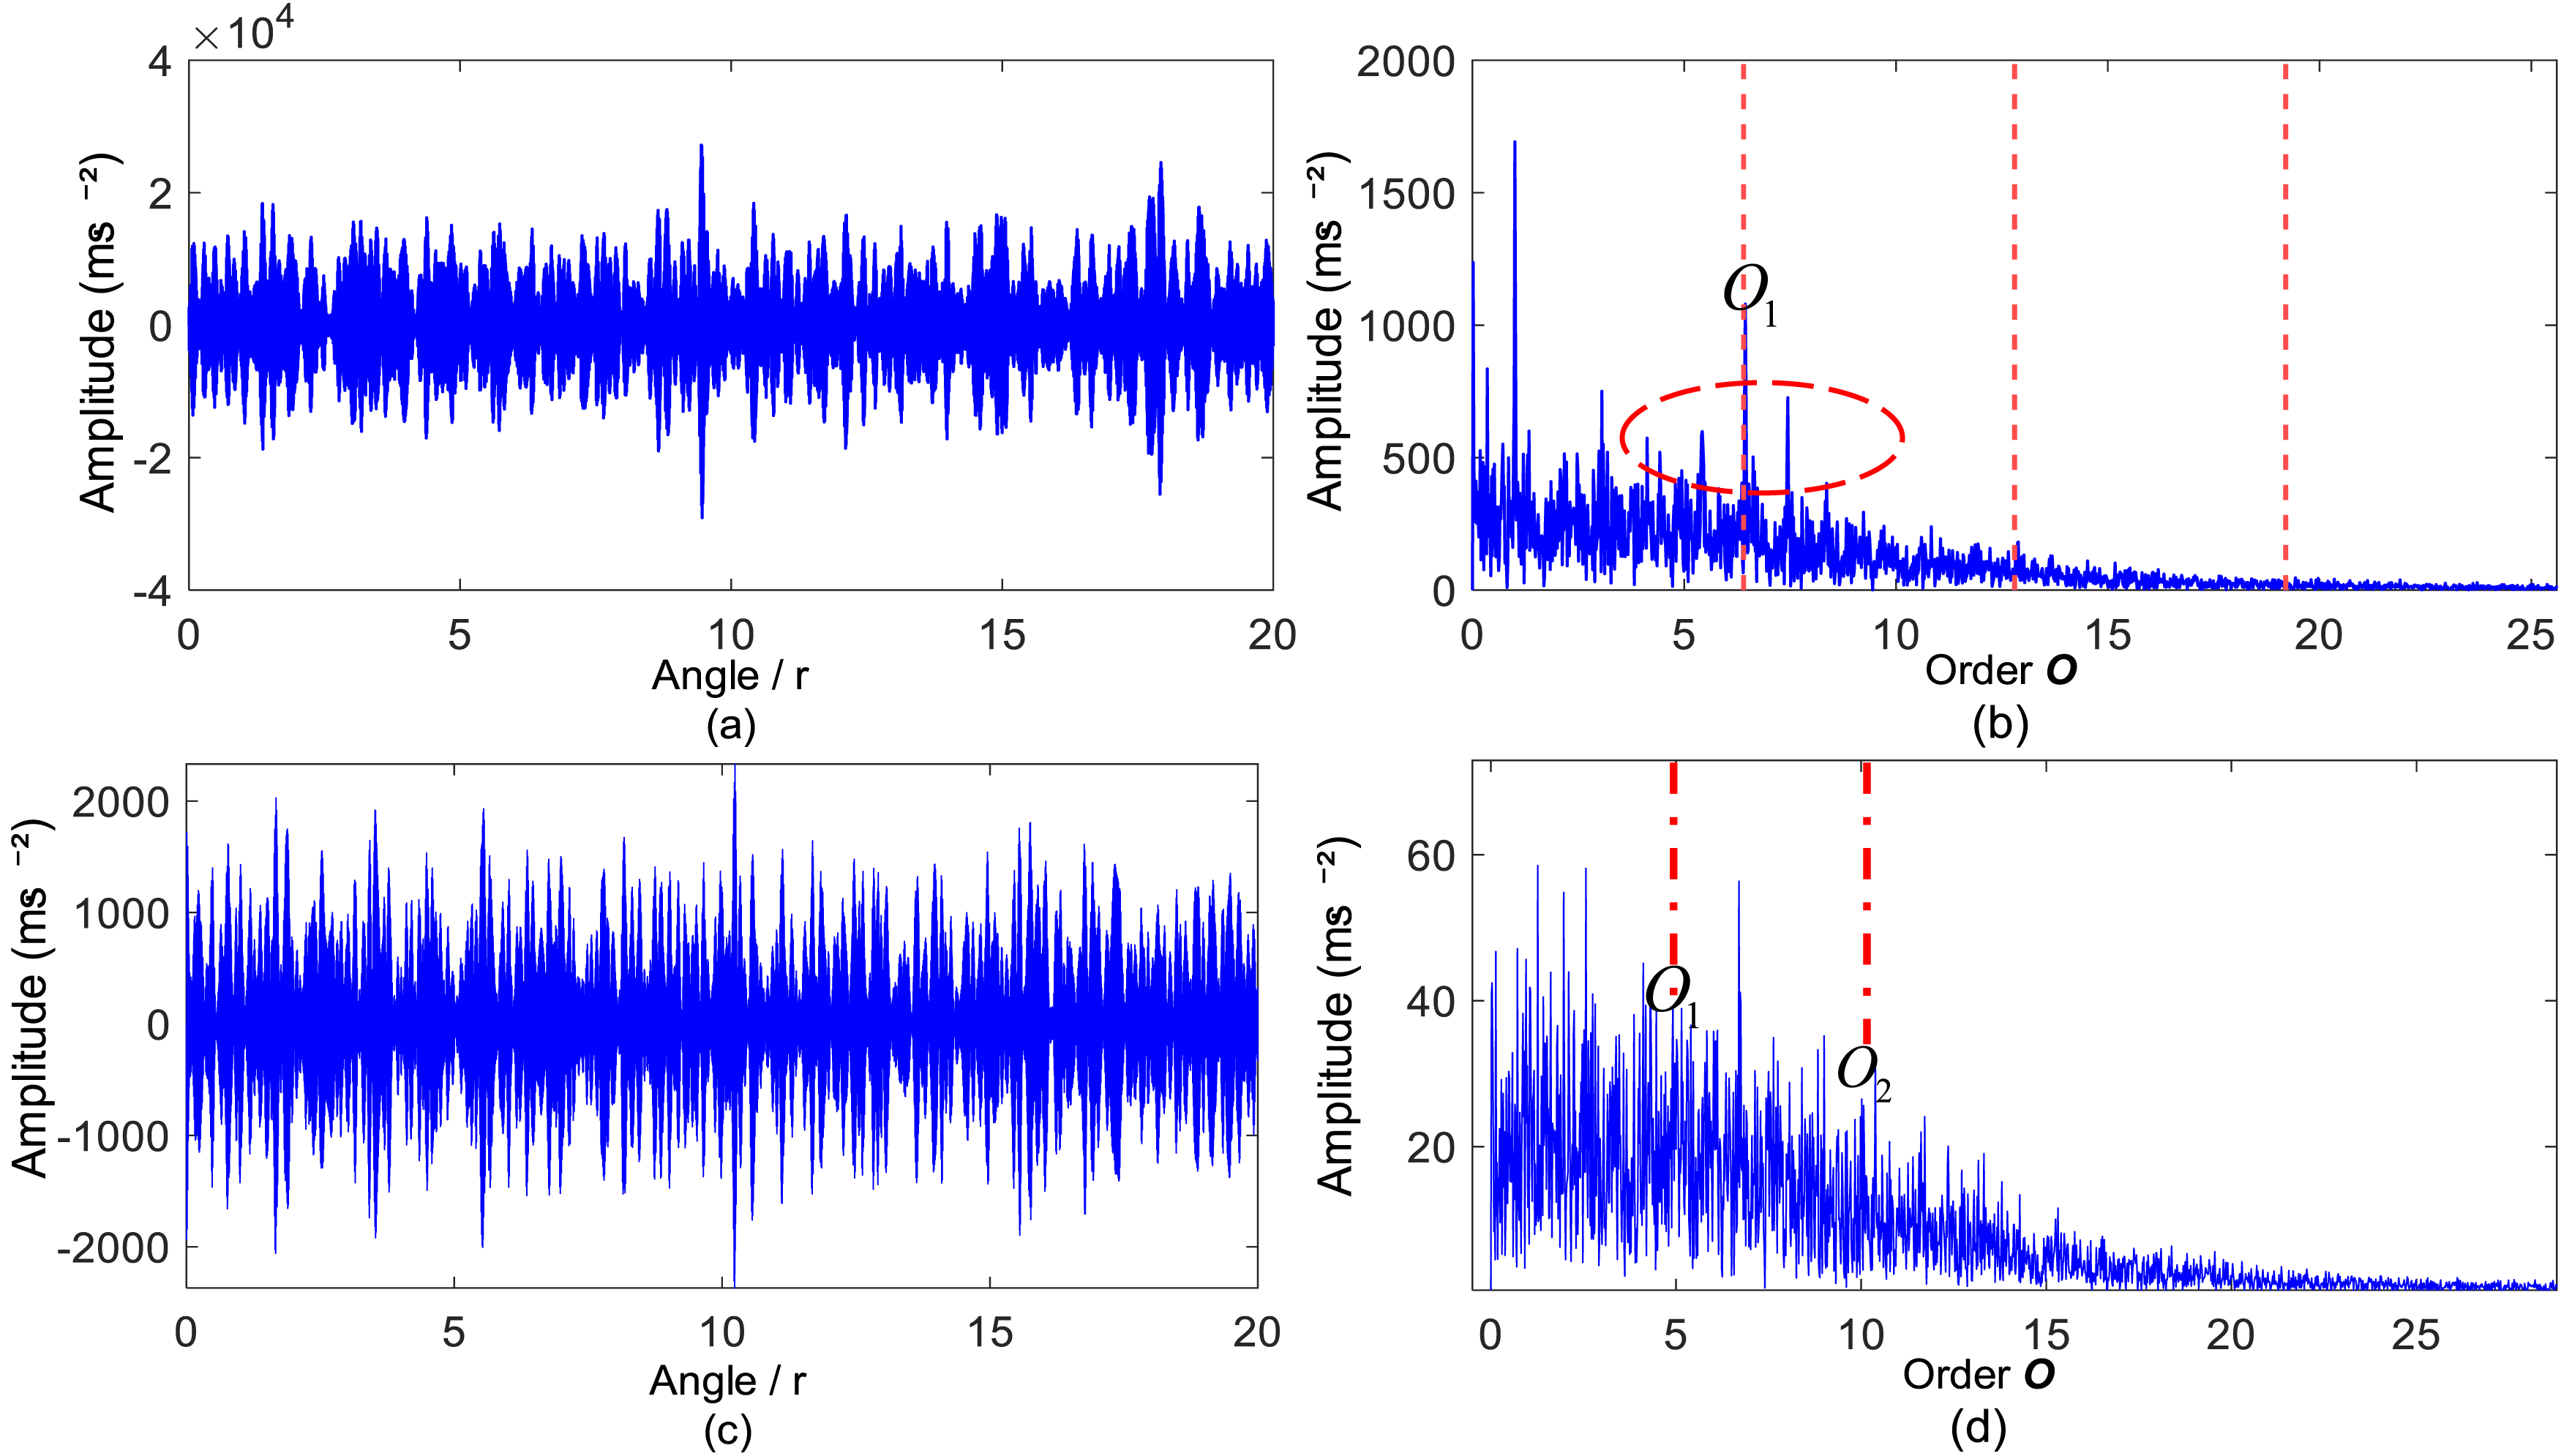
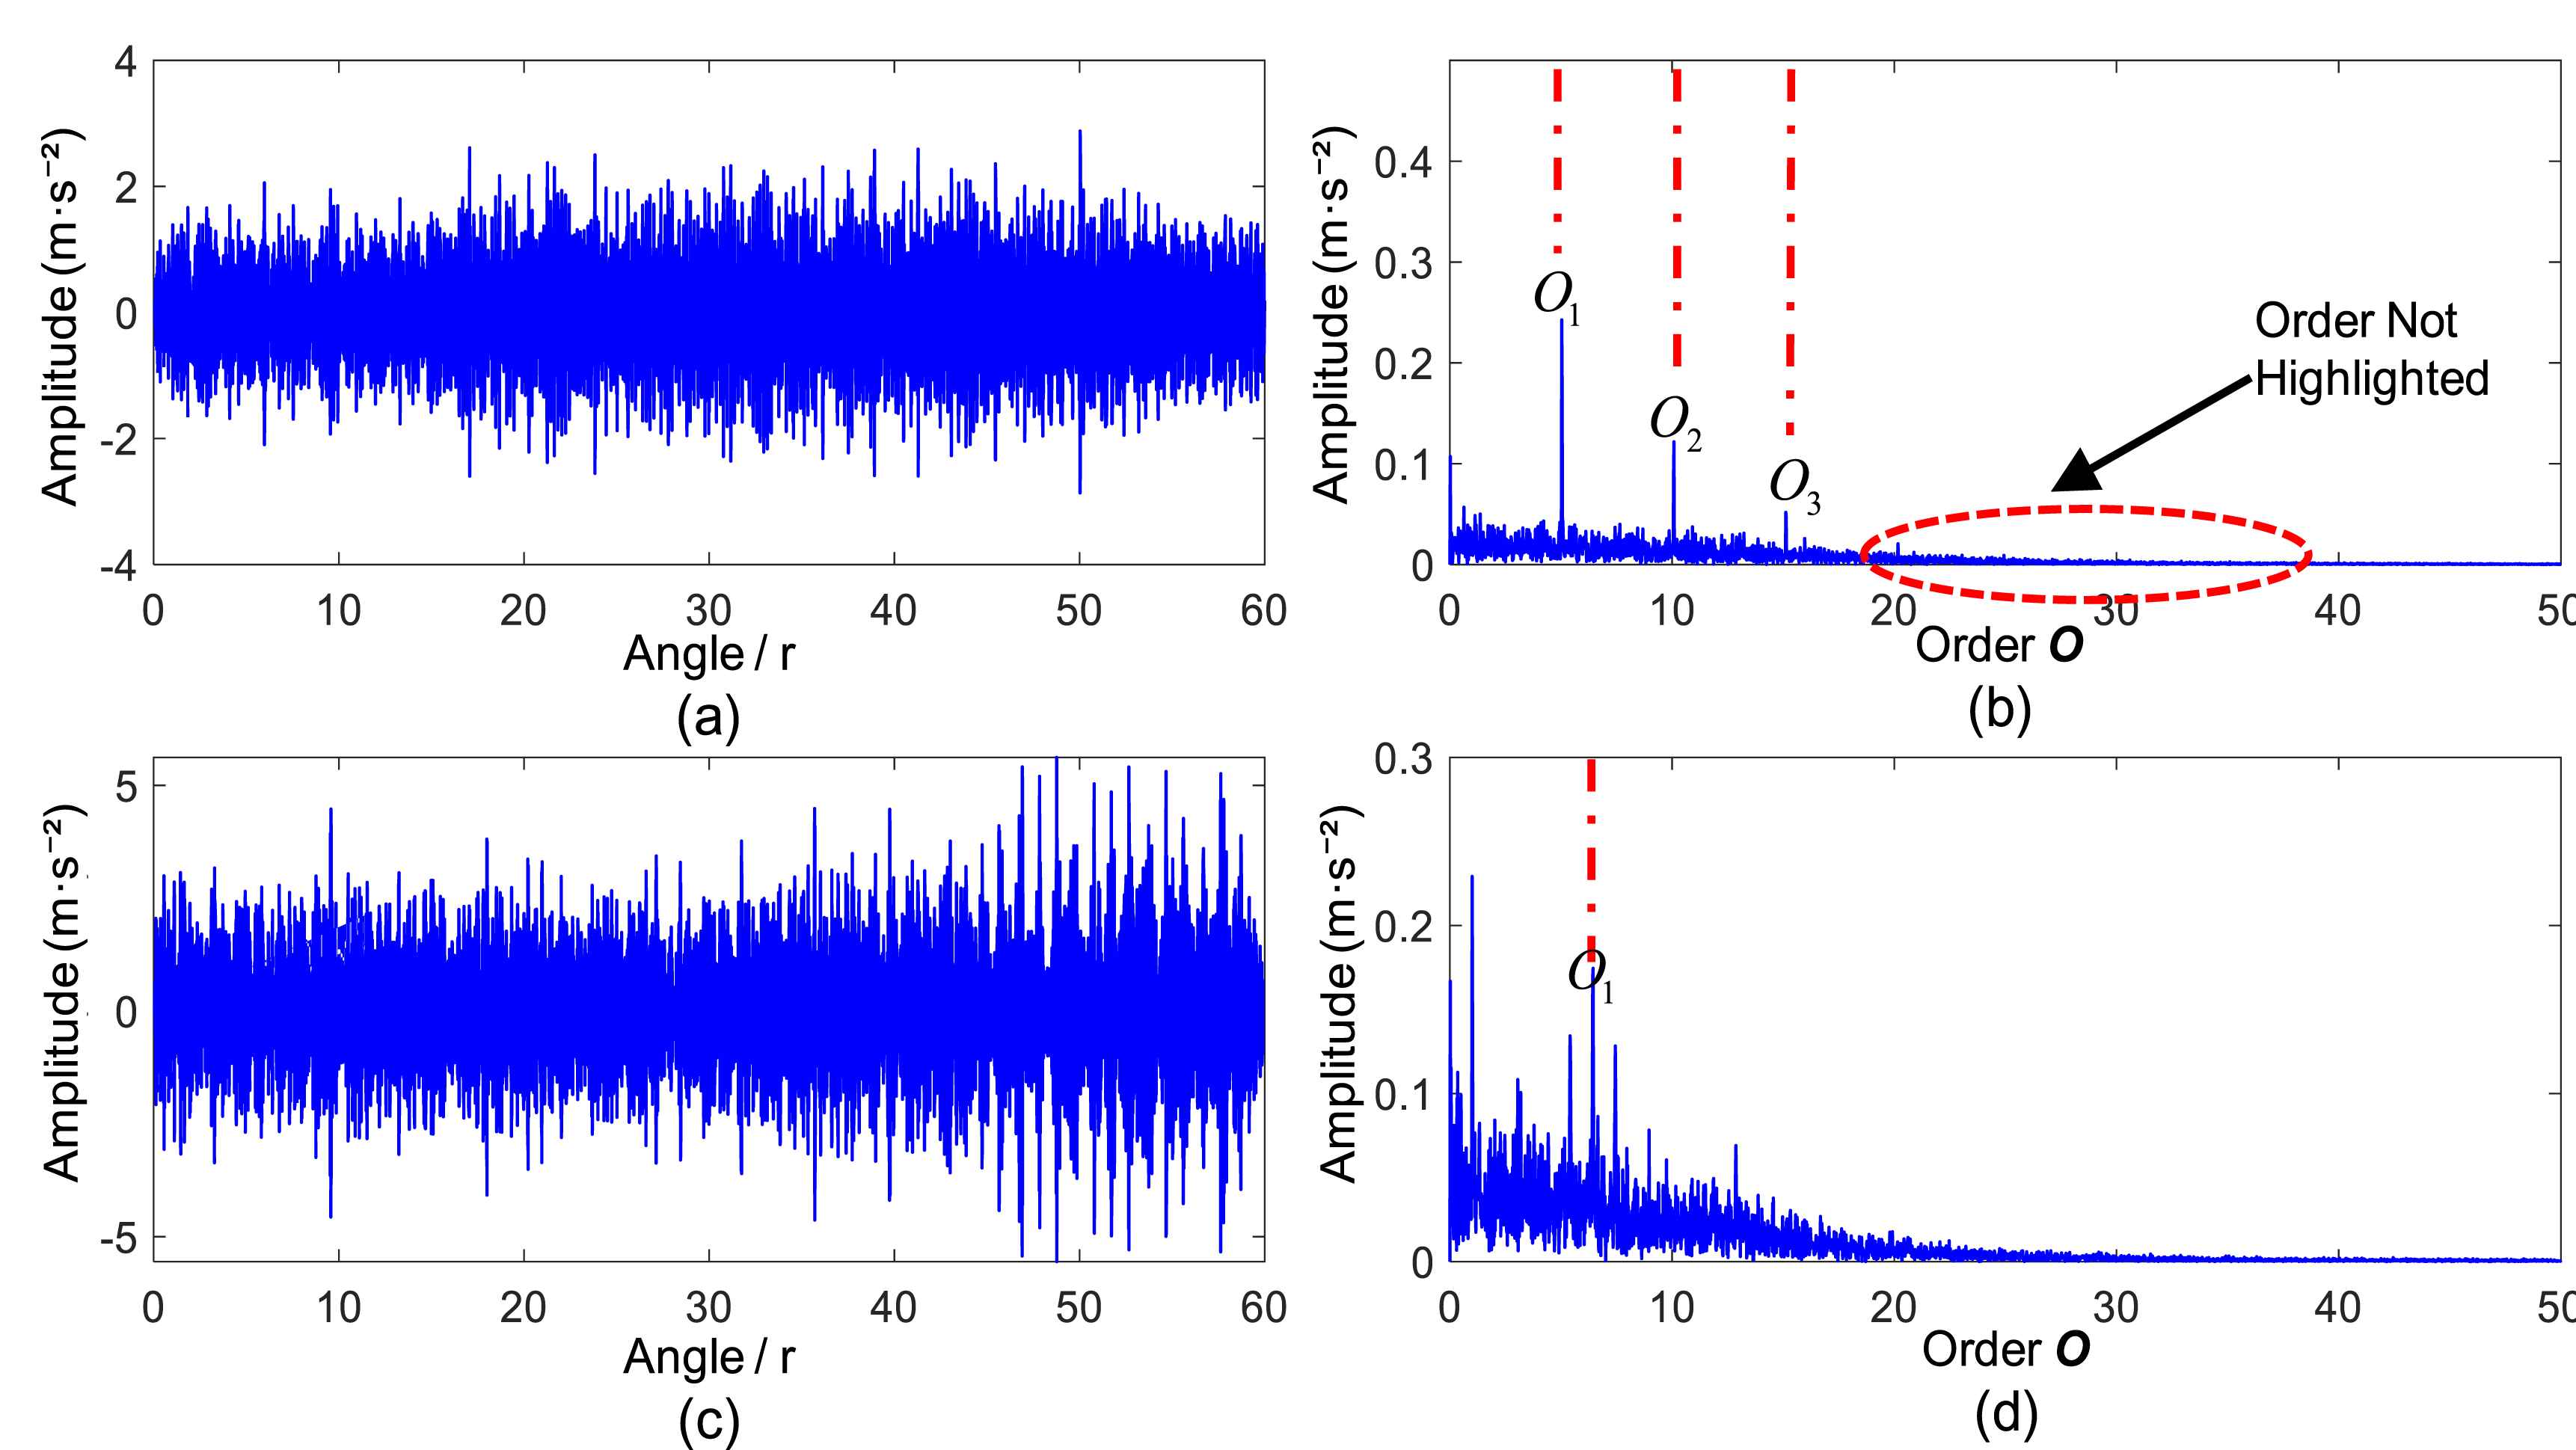
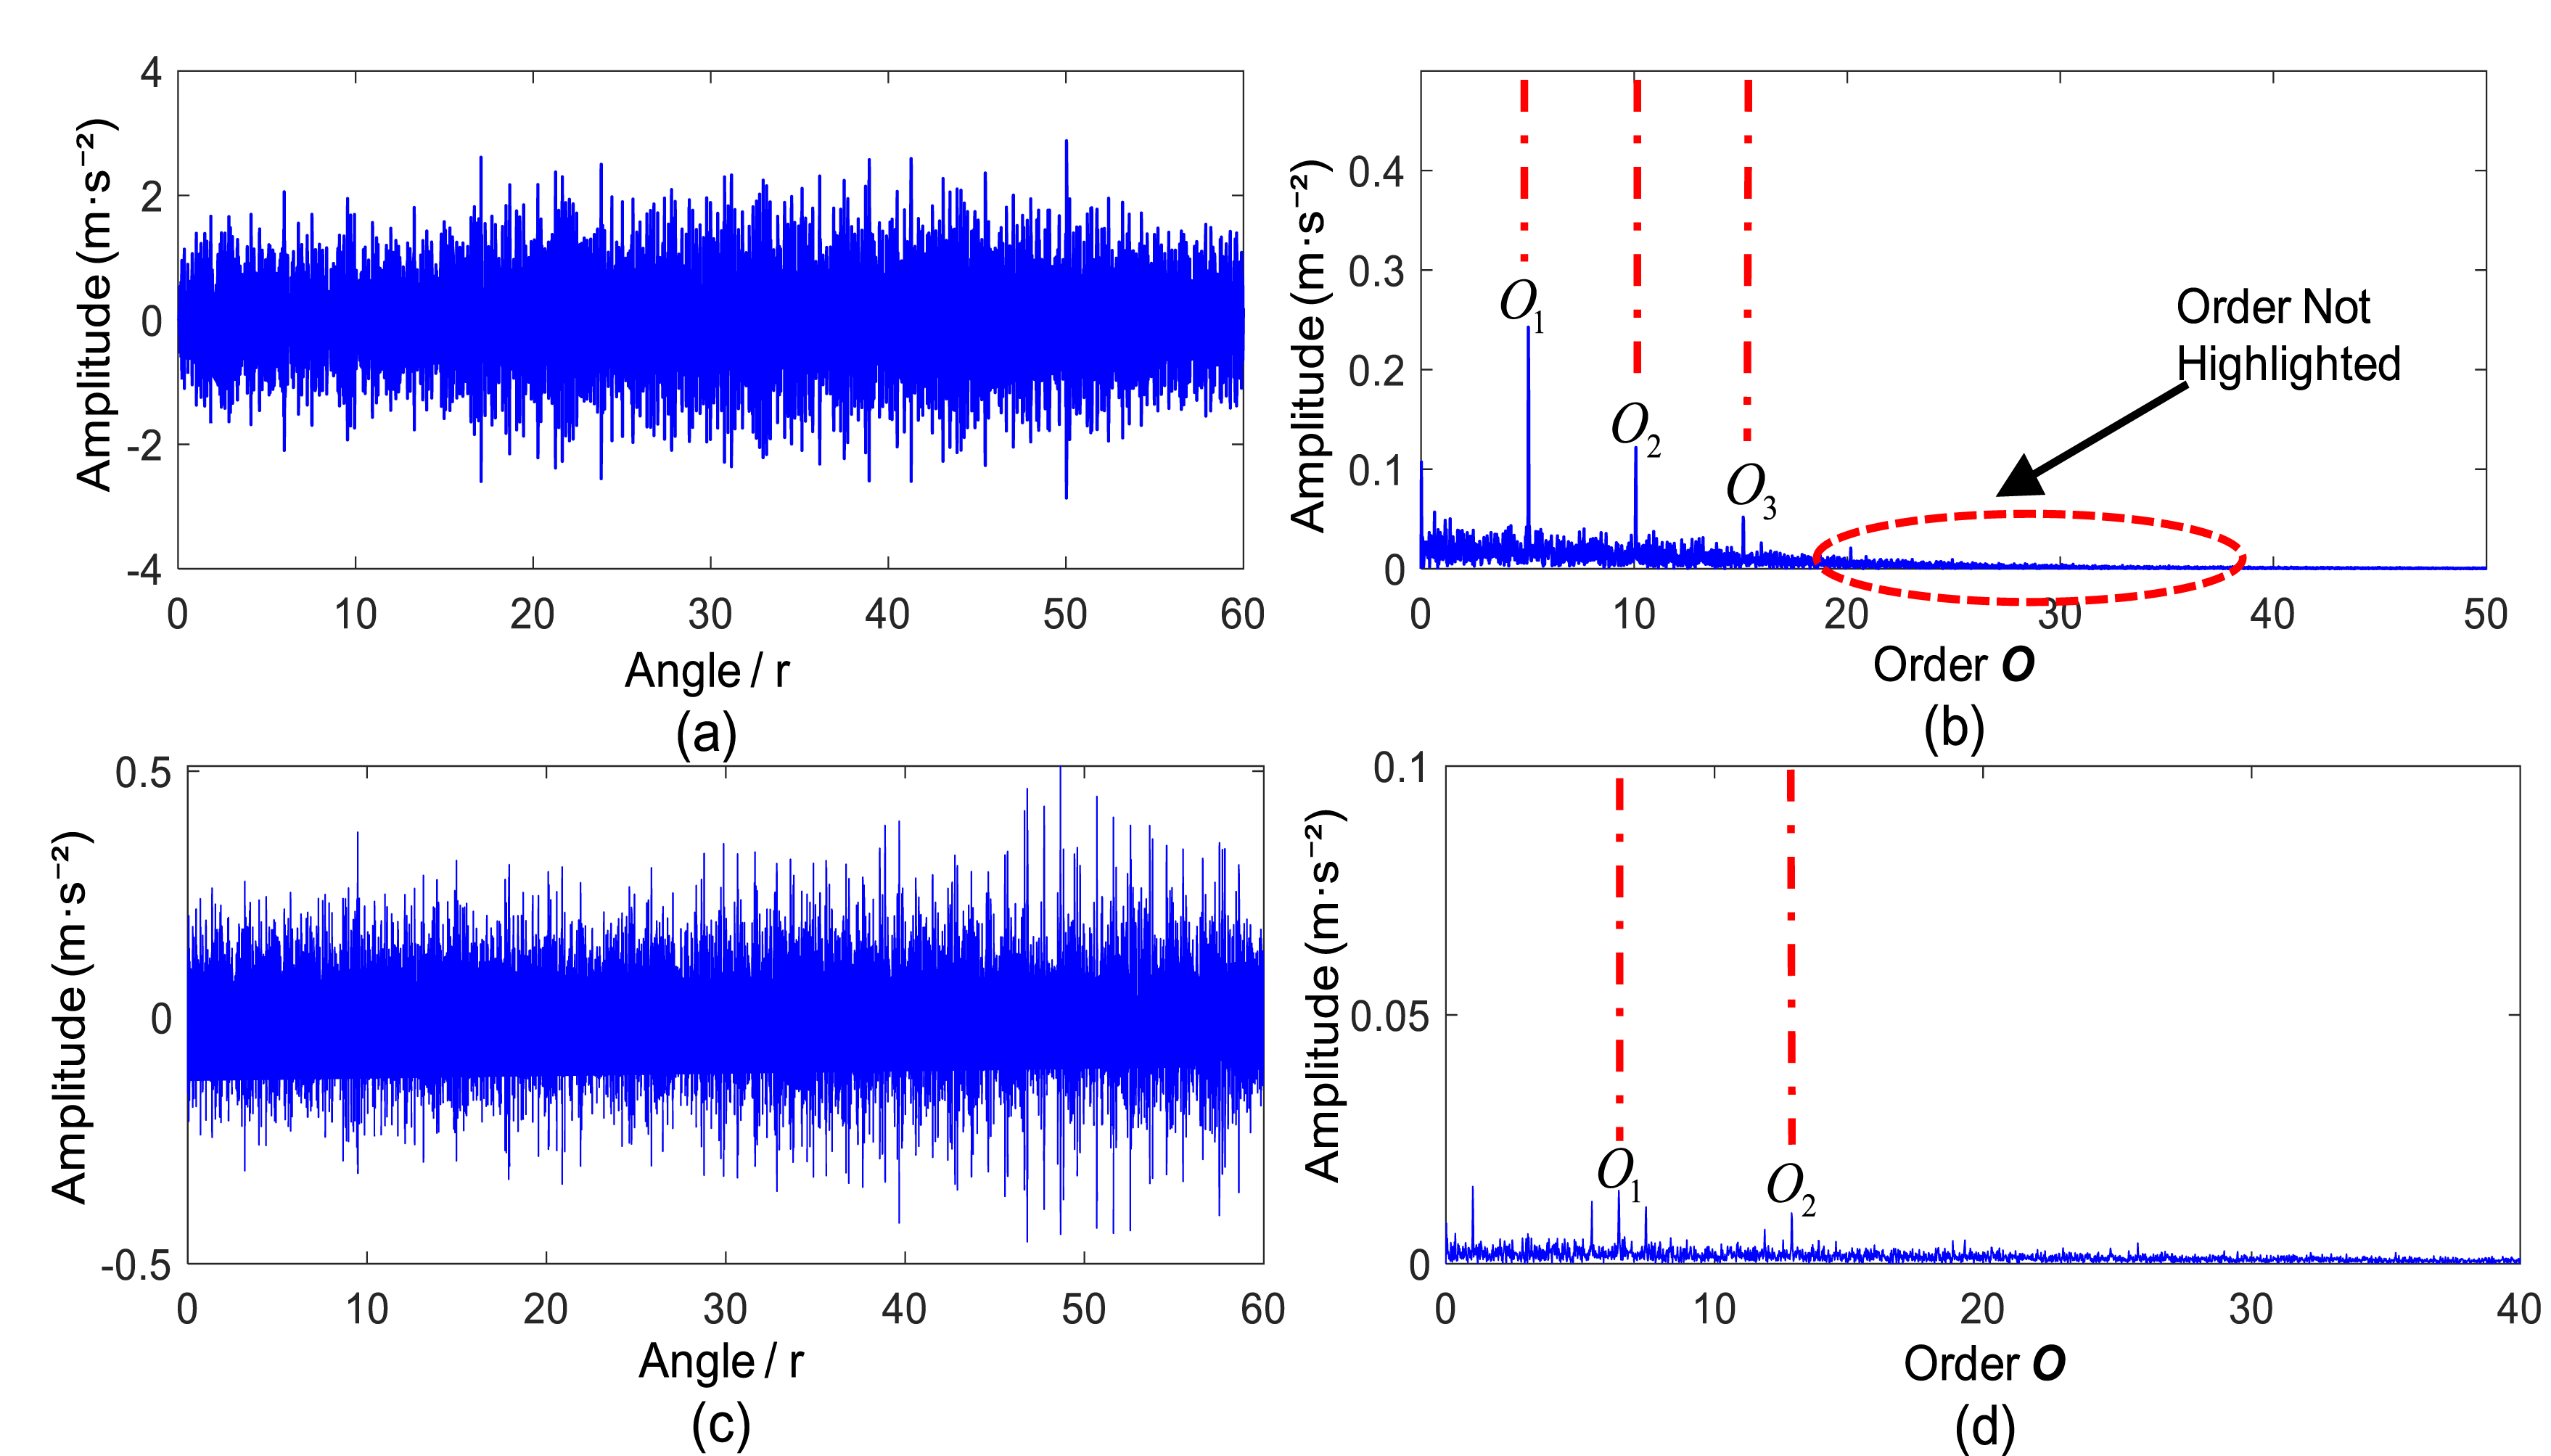
Figure 7 presents the AFMD results (empirical L = 40). Lacking parameter adaptability, the fixed-bandwidth filter fails to accurately cover the resonance band, admitting excessive out-of-band noise. As shown in the red dashed region, while weak fault frequencies are visible at low orders, their amplitudes are negligible. High-order harmonics are completely submerged in broadband noise, resulting in poor feature identifiability. Figure 8 shows the GWO-FMD results. Although GWO optimizes parameters, FMD remains sensitive to strong impulsive noise. Furthermore, relying solely on time-domain kurtosis as the objective function often leads to local optima. Consequently, the noise floor remains high, and significant non-fault interference surrounds the characteristic order (O 1 ), failing to effectively enhance fault features. Figure 9 displays the GWO-VMD results. VMD is inherently a narrow-band decomposition technique. When processing bearing faults with wideband impulse characteristics, its narrow-band assumption causes severe leakage of impulse energy. Although GWO-VMD suppresses some background noise, the extracted feature amplitudes are notably low (indicating severe energy loss), and it fails to resolve weak sideband information for inner race faults.
In summary, comparative methods fail to effectively extract weak features under these harsh conditions. Conversely, ED-GAFMD (Figure 4) exhibits superior noise suppression and impulse restoration.
4. Experimental verification
To validate the robustness of ED-GAFMD under practical variable-speed and strong-noise conditions, the University of Ottawa bearing fault dataset is utilized. As the original signals possess relatively high SNR, a harsh industrial environment is simulated to test the noise resistance limit. Consistent with the simulation methodology, mixed interference—comprising Gaussian white noise (−2dB), harmonics, and random impulses—is injected to construct a strong-noise, non-stationary test scenario (Figure 10). Bearing test rig.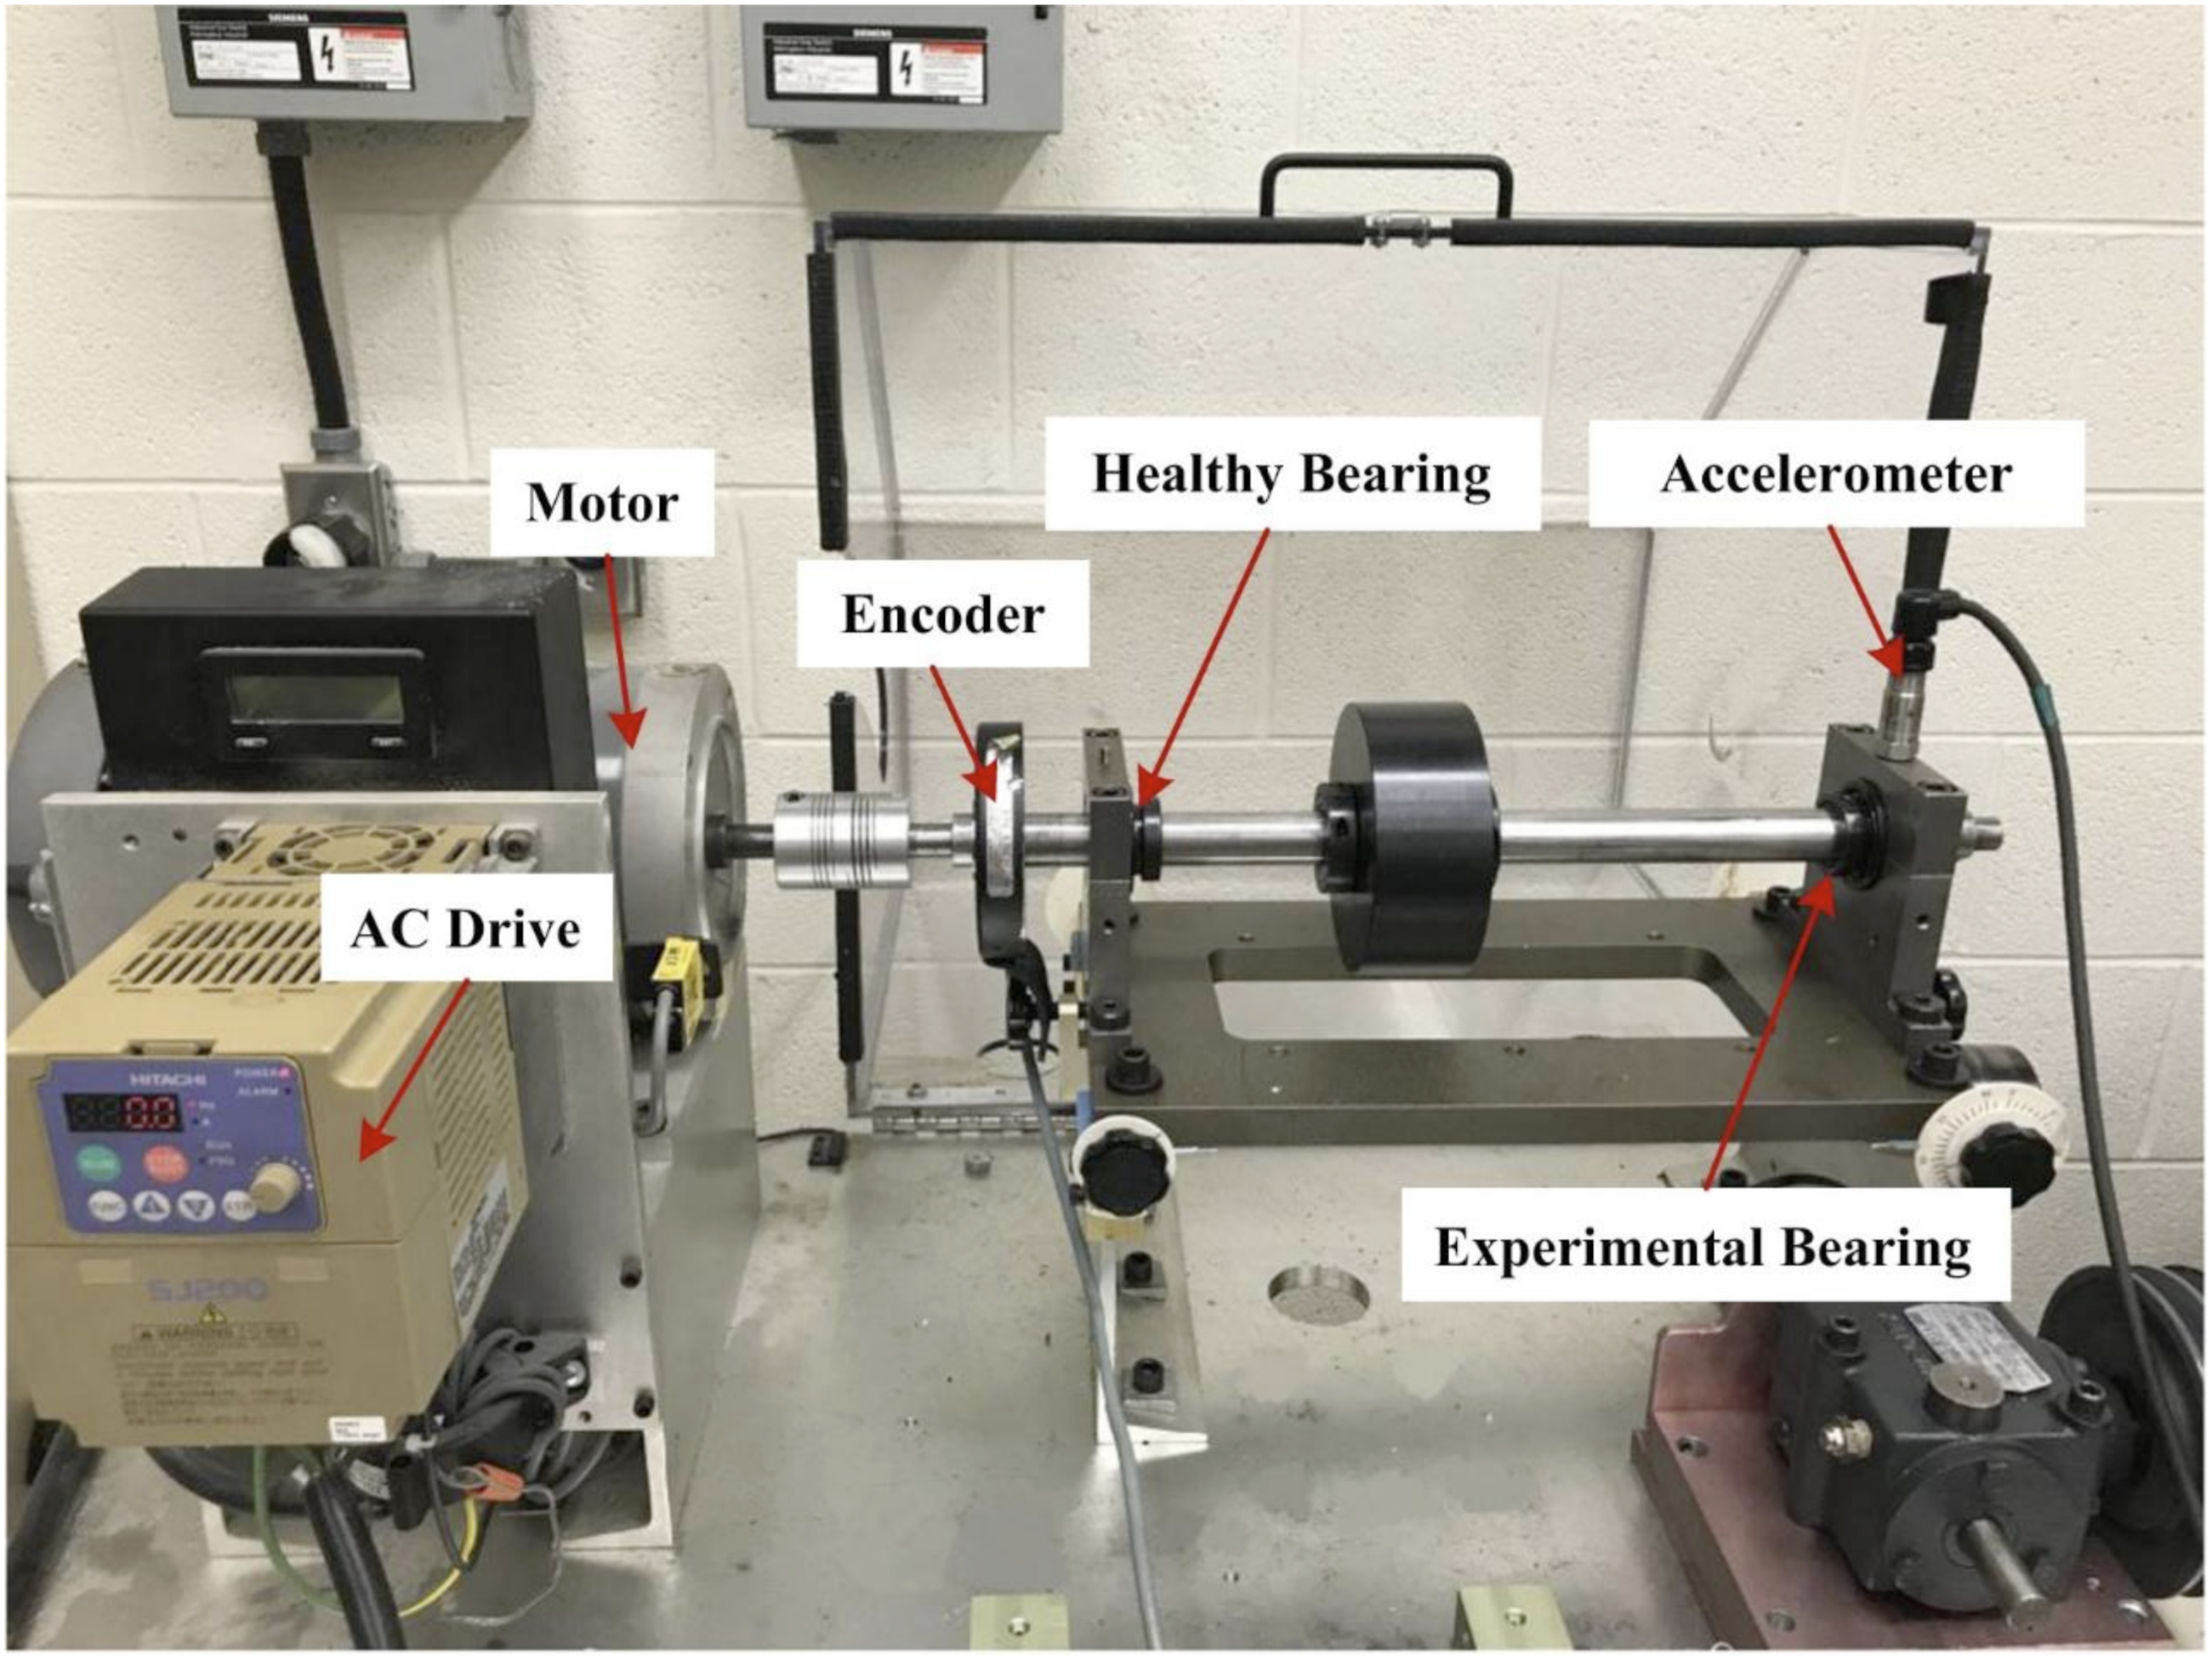
4.1. Experimental setup
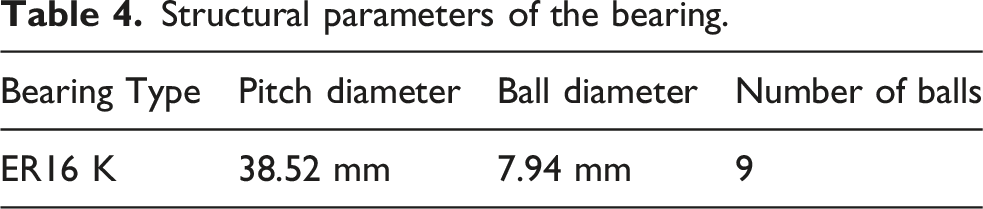
Structural parameters of the bearing.
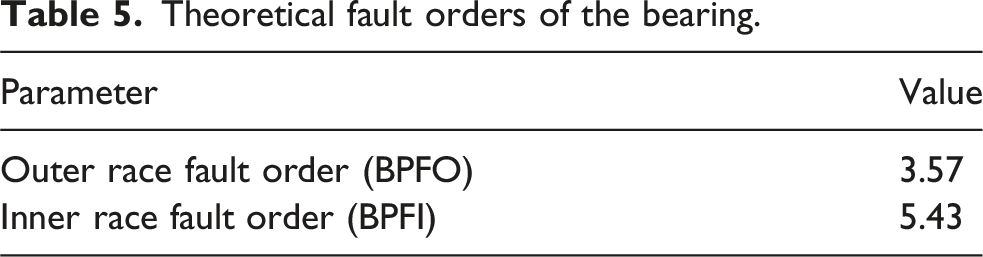
Theoretical fault orders of the bearing.
4.2. Analysis of experimental signals
4.2.1. Bearing fault analysis
To validate the noise resistance limit, variable-speed datasets O-A-2 (outer race) and I-A-2 (inner race) are selected. The rotational speed in O-A-2 increases from 12.9 to 23.0 Hz, while I-A-2 ramps from 13.0 to 25.7 Hz (duration: 10 s). To simulate realistic industrial conditions, a challenging test scenario is constructed by injecting −2dB Gaussian white noise, harmonic interference, and random impulses into the raw signals.
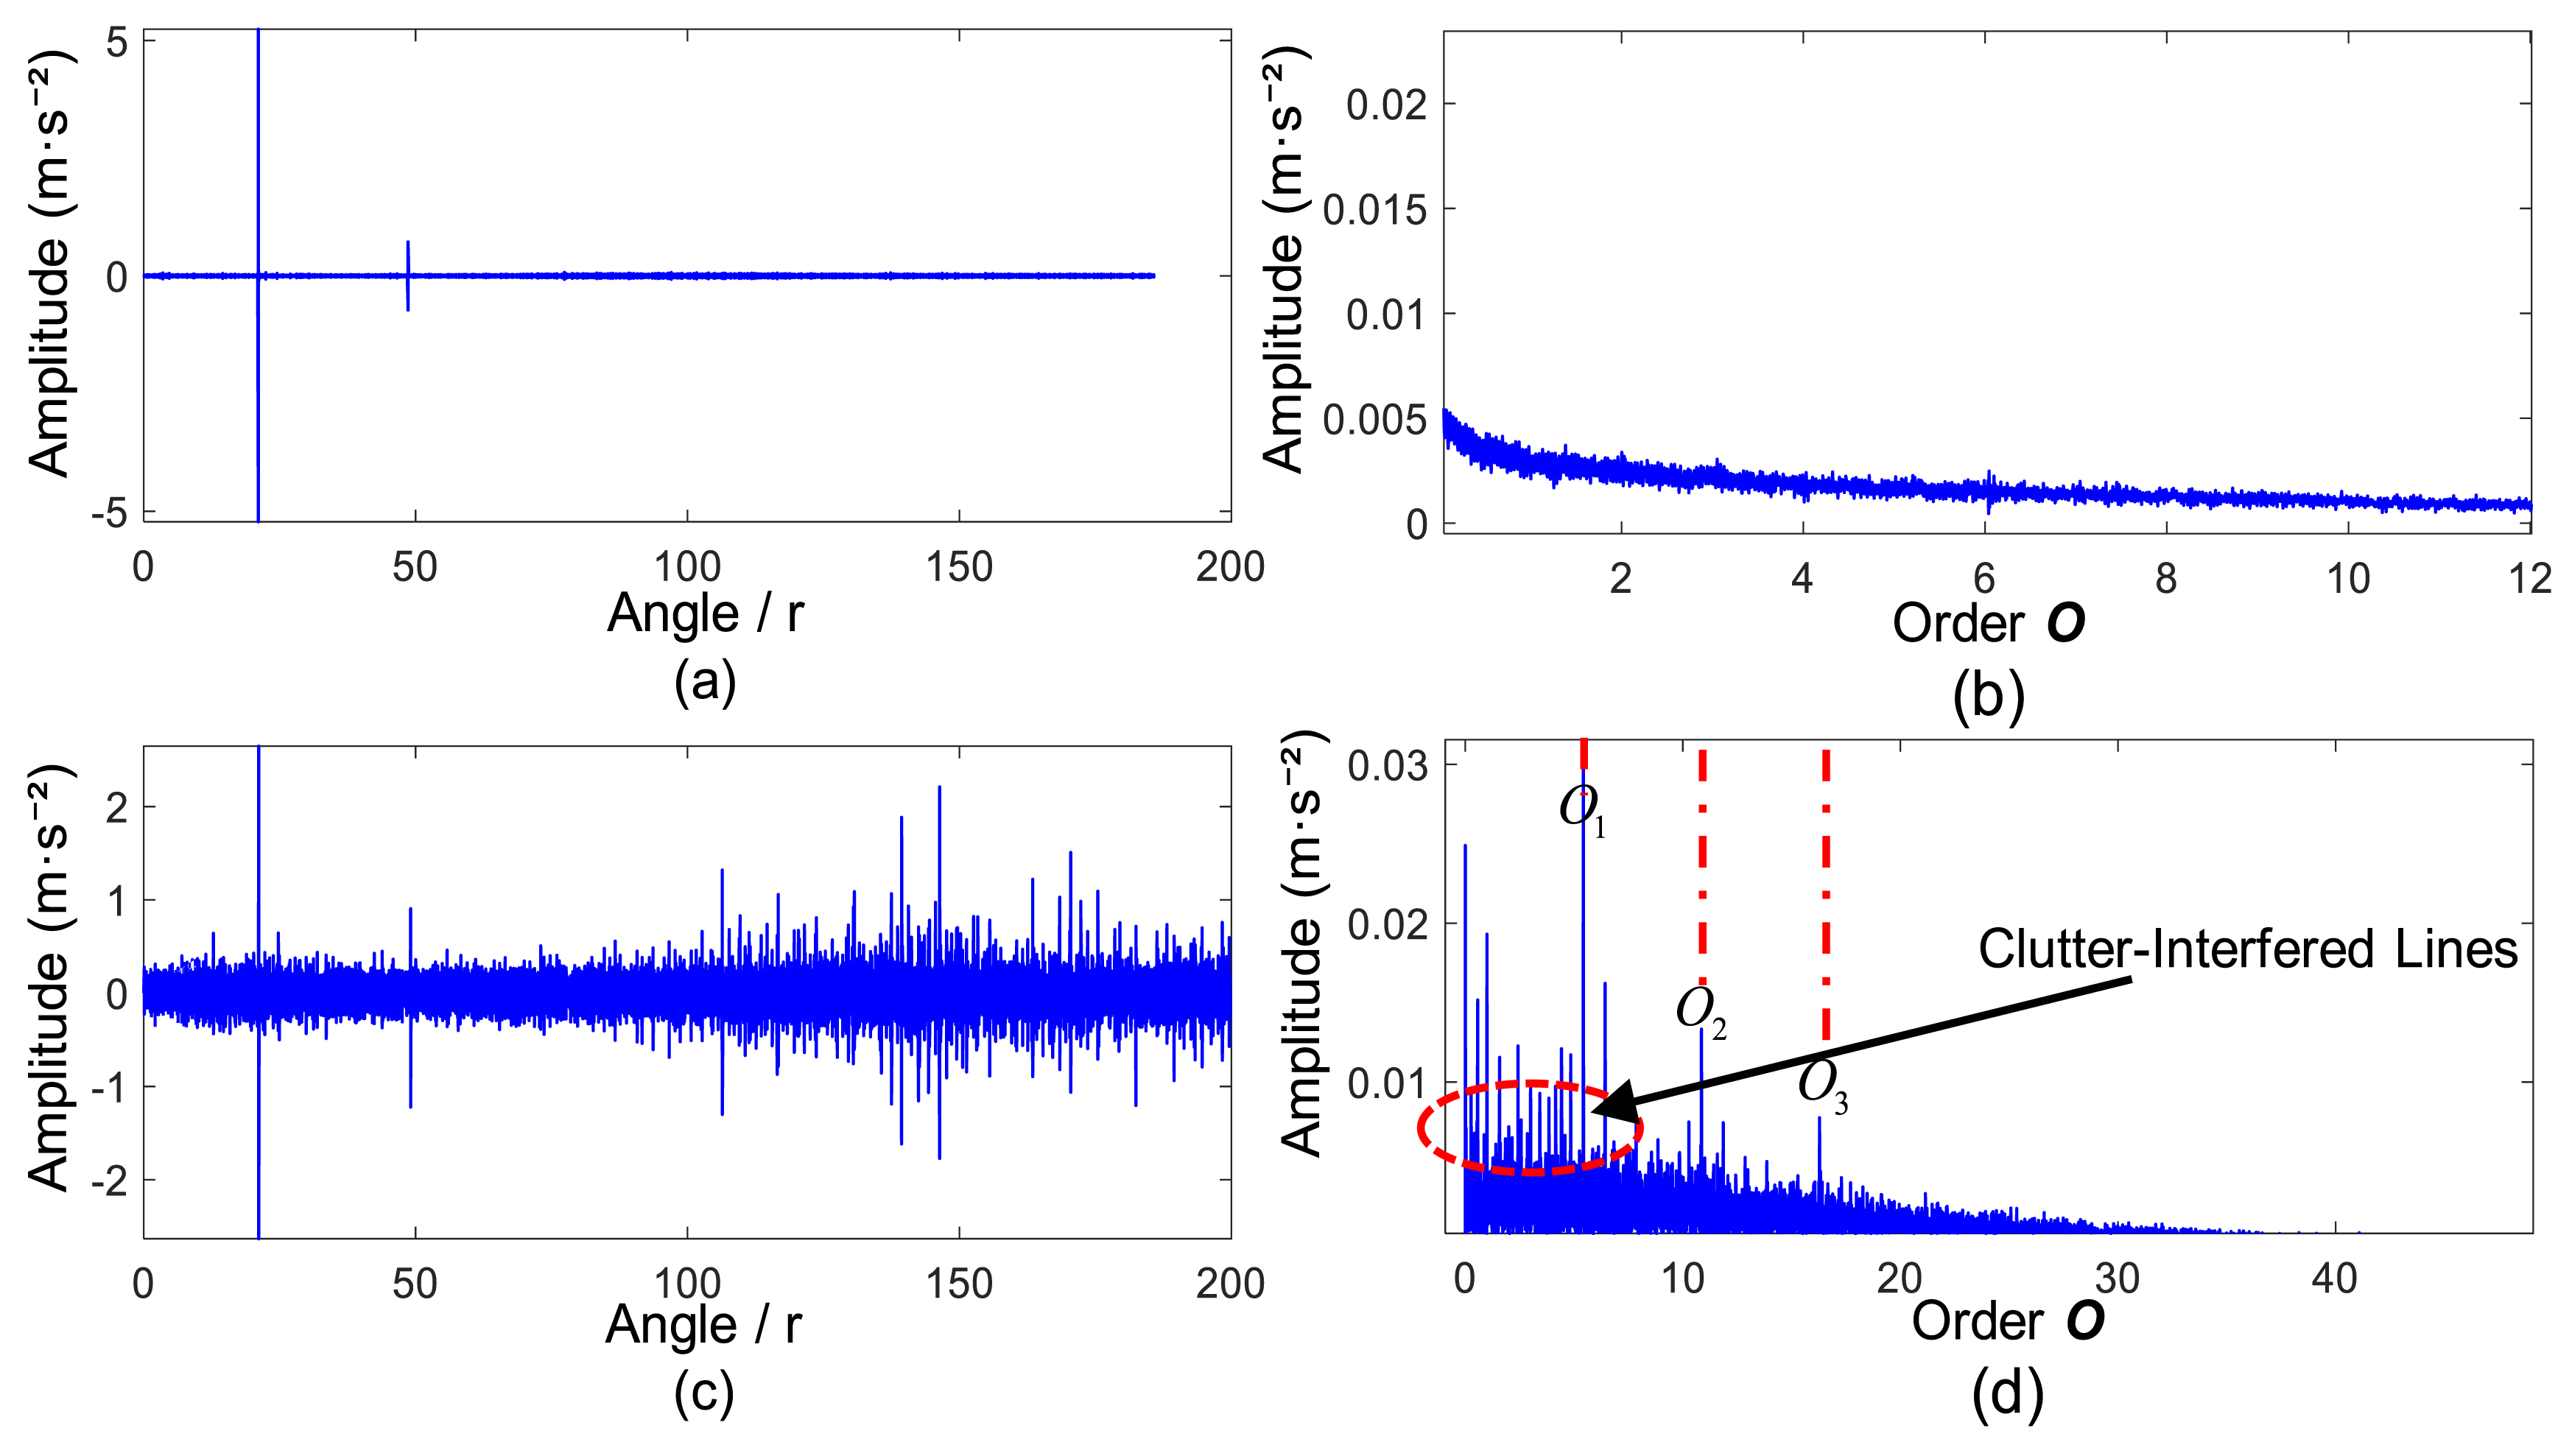
Mixed noise significantly weakens order features, causing severe frequency blurring. Consequently, angular resampling is employed to obtain the Order Spectrum. Figure 11 illustrates the raw waveforms and order spectra under variable-speed conditions. Real raw signal: Time domain & envelope order spectrum. (a) outer race rot. speed, (b) inner race rot. speed, (c) outer race time domain, (d) its envelope order (e) inner race time domain, (f) its envelope order.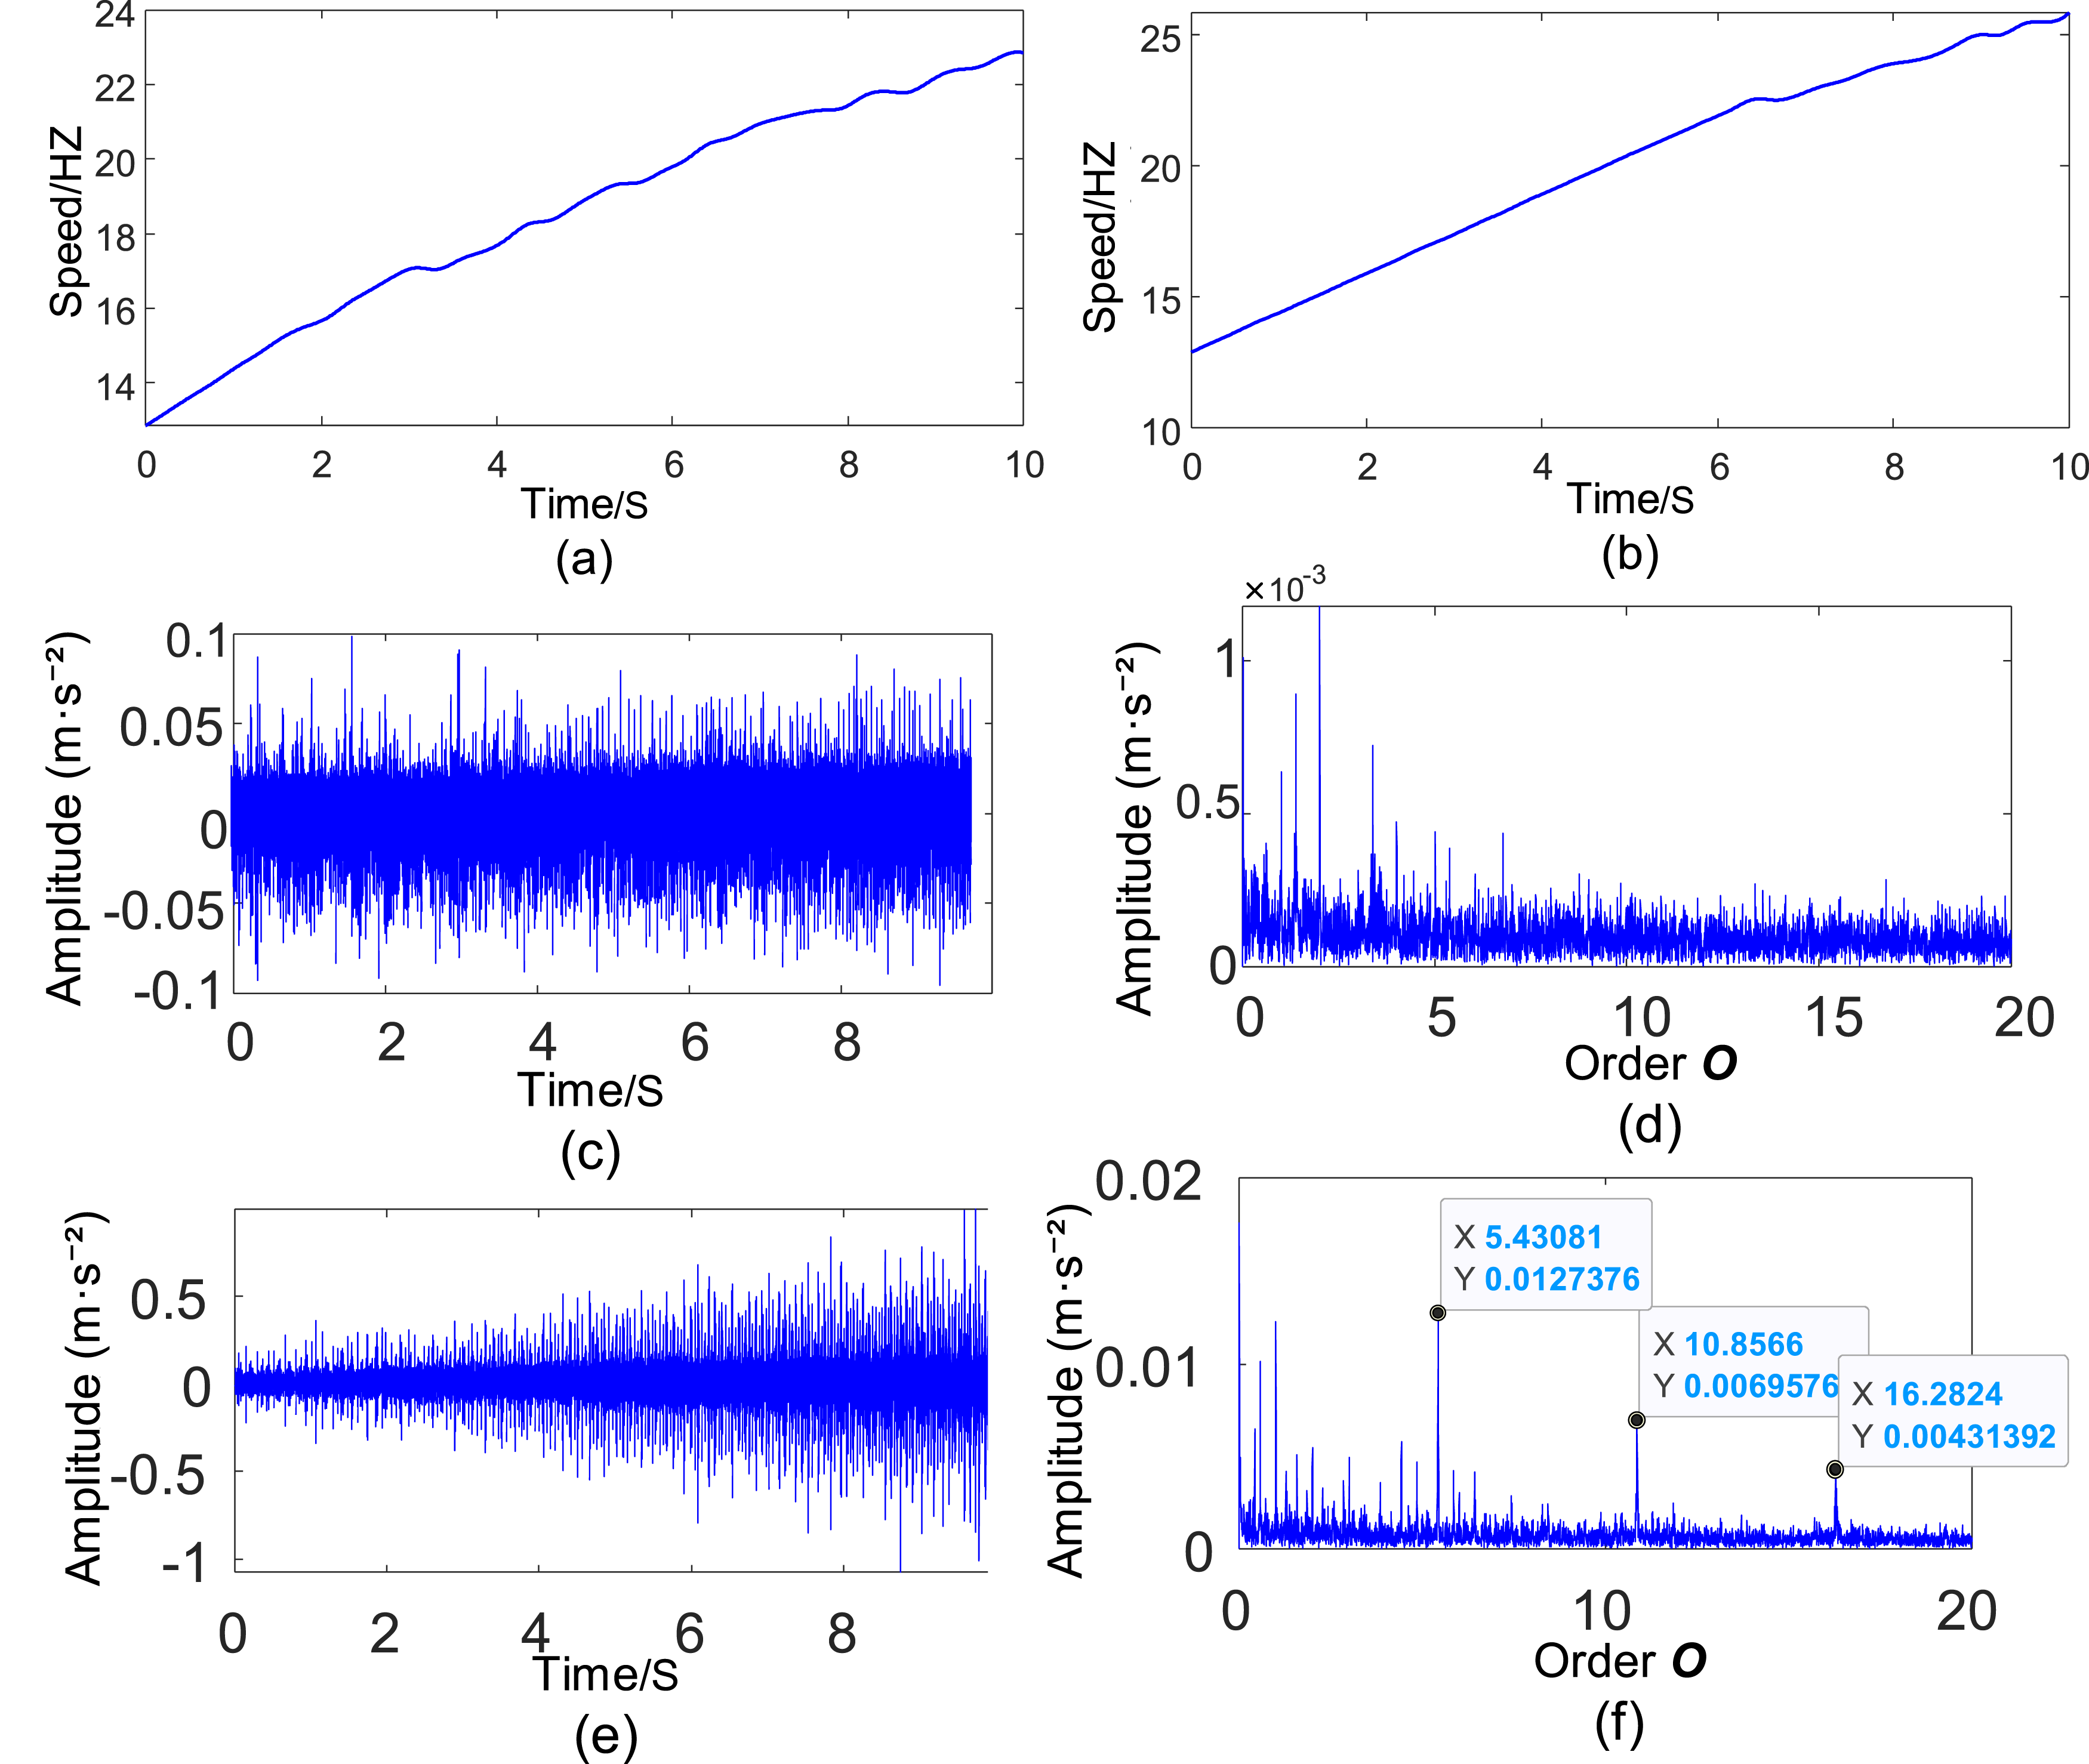
Non-stationary Speed Characteristics (Figure 11(a) and (b)): The motor speed exhibits a distinct linear increase. As shown in Figure 11(a), speed rises from ∼13 Hz to 23 Hz in 10 s, while Figure 11(b) shows sharper acceleration to 25.7 Hz. This rapid variation induces non-stationarity, causing vibration amplitudes to show a progressive “trumpet-shaped” increase. However, in the time-domain waveforms (Figure 11(c) and (e)), periodic fault impulses are completely submerged by mechanical background noise and path attenuation. The disordered signals make it impossible to observe clear impulse intervals.
Outer Race Order Spectrum (Figure 11(d)): Despite transformation to the order domain, strong noise results in a cluttered spectrum. The theoretical Fault Characteristic Order (BPFO = 3.57) and its harmonics lack distinct peaks, hindering direct diagnosis. Inner Race Order Spectrum (Figure 11(f)): Diagnosis is more challenging. Although the Fault Characteristic Order (BPFI = 5.43) is marked, its amplitude is negligible (∼0.012 m/s2), barely exceeding the noise floor. This confirms that under coupled strong-noise and variable-speed conditions, basic Order Analysis is insufficient, leading to a high risk of missed diagnosis.
4.2.2. Adaptive fault diagnosis via ED-GAFMD
To address frequency blurring and feature masking, the ED-GAFMD method is applied. By converting non-stationary signals to the angular domain via Order Tracking, GWO adaptively optimizes filtering parameters for precise impulse extraction.
For the Outer Race (O-A-2), considering severe mixed noise, the search space is defined as n ∈ [2, 8], K ∈ [2, 20], and L ∈ [10, 300]. Minimizing Permutation Entropy (PE), GWO converged to the optimum [n*, K*, L*] = [3, 7, 20]. IMF3 was selected as the sensitive mode via the Maximum Kurtosis Principle. As shown in Figure 12, the SNR is significantly improved. Distinct harmonics (1× ∼ 4× BPFO) appear as sharp, independent peaks without blurring, accurately revealing the fault. Processing results via the proposed method. (a) outer race angular domain, (b) its envelope order, (c) inner race angular domain, (d) its envelope order.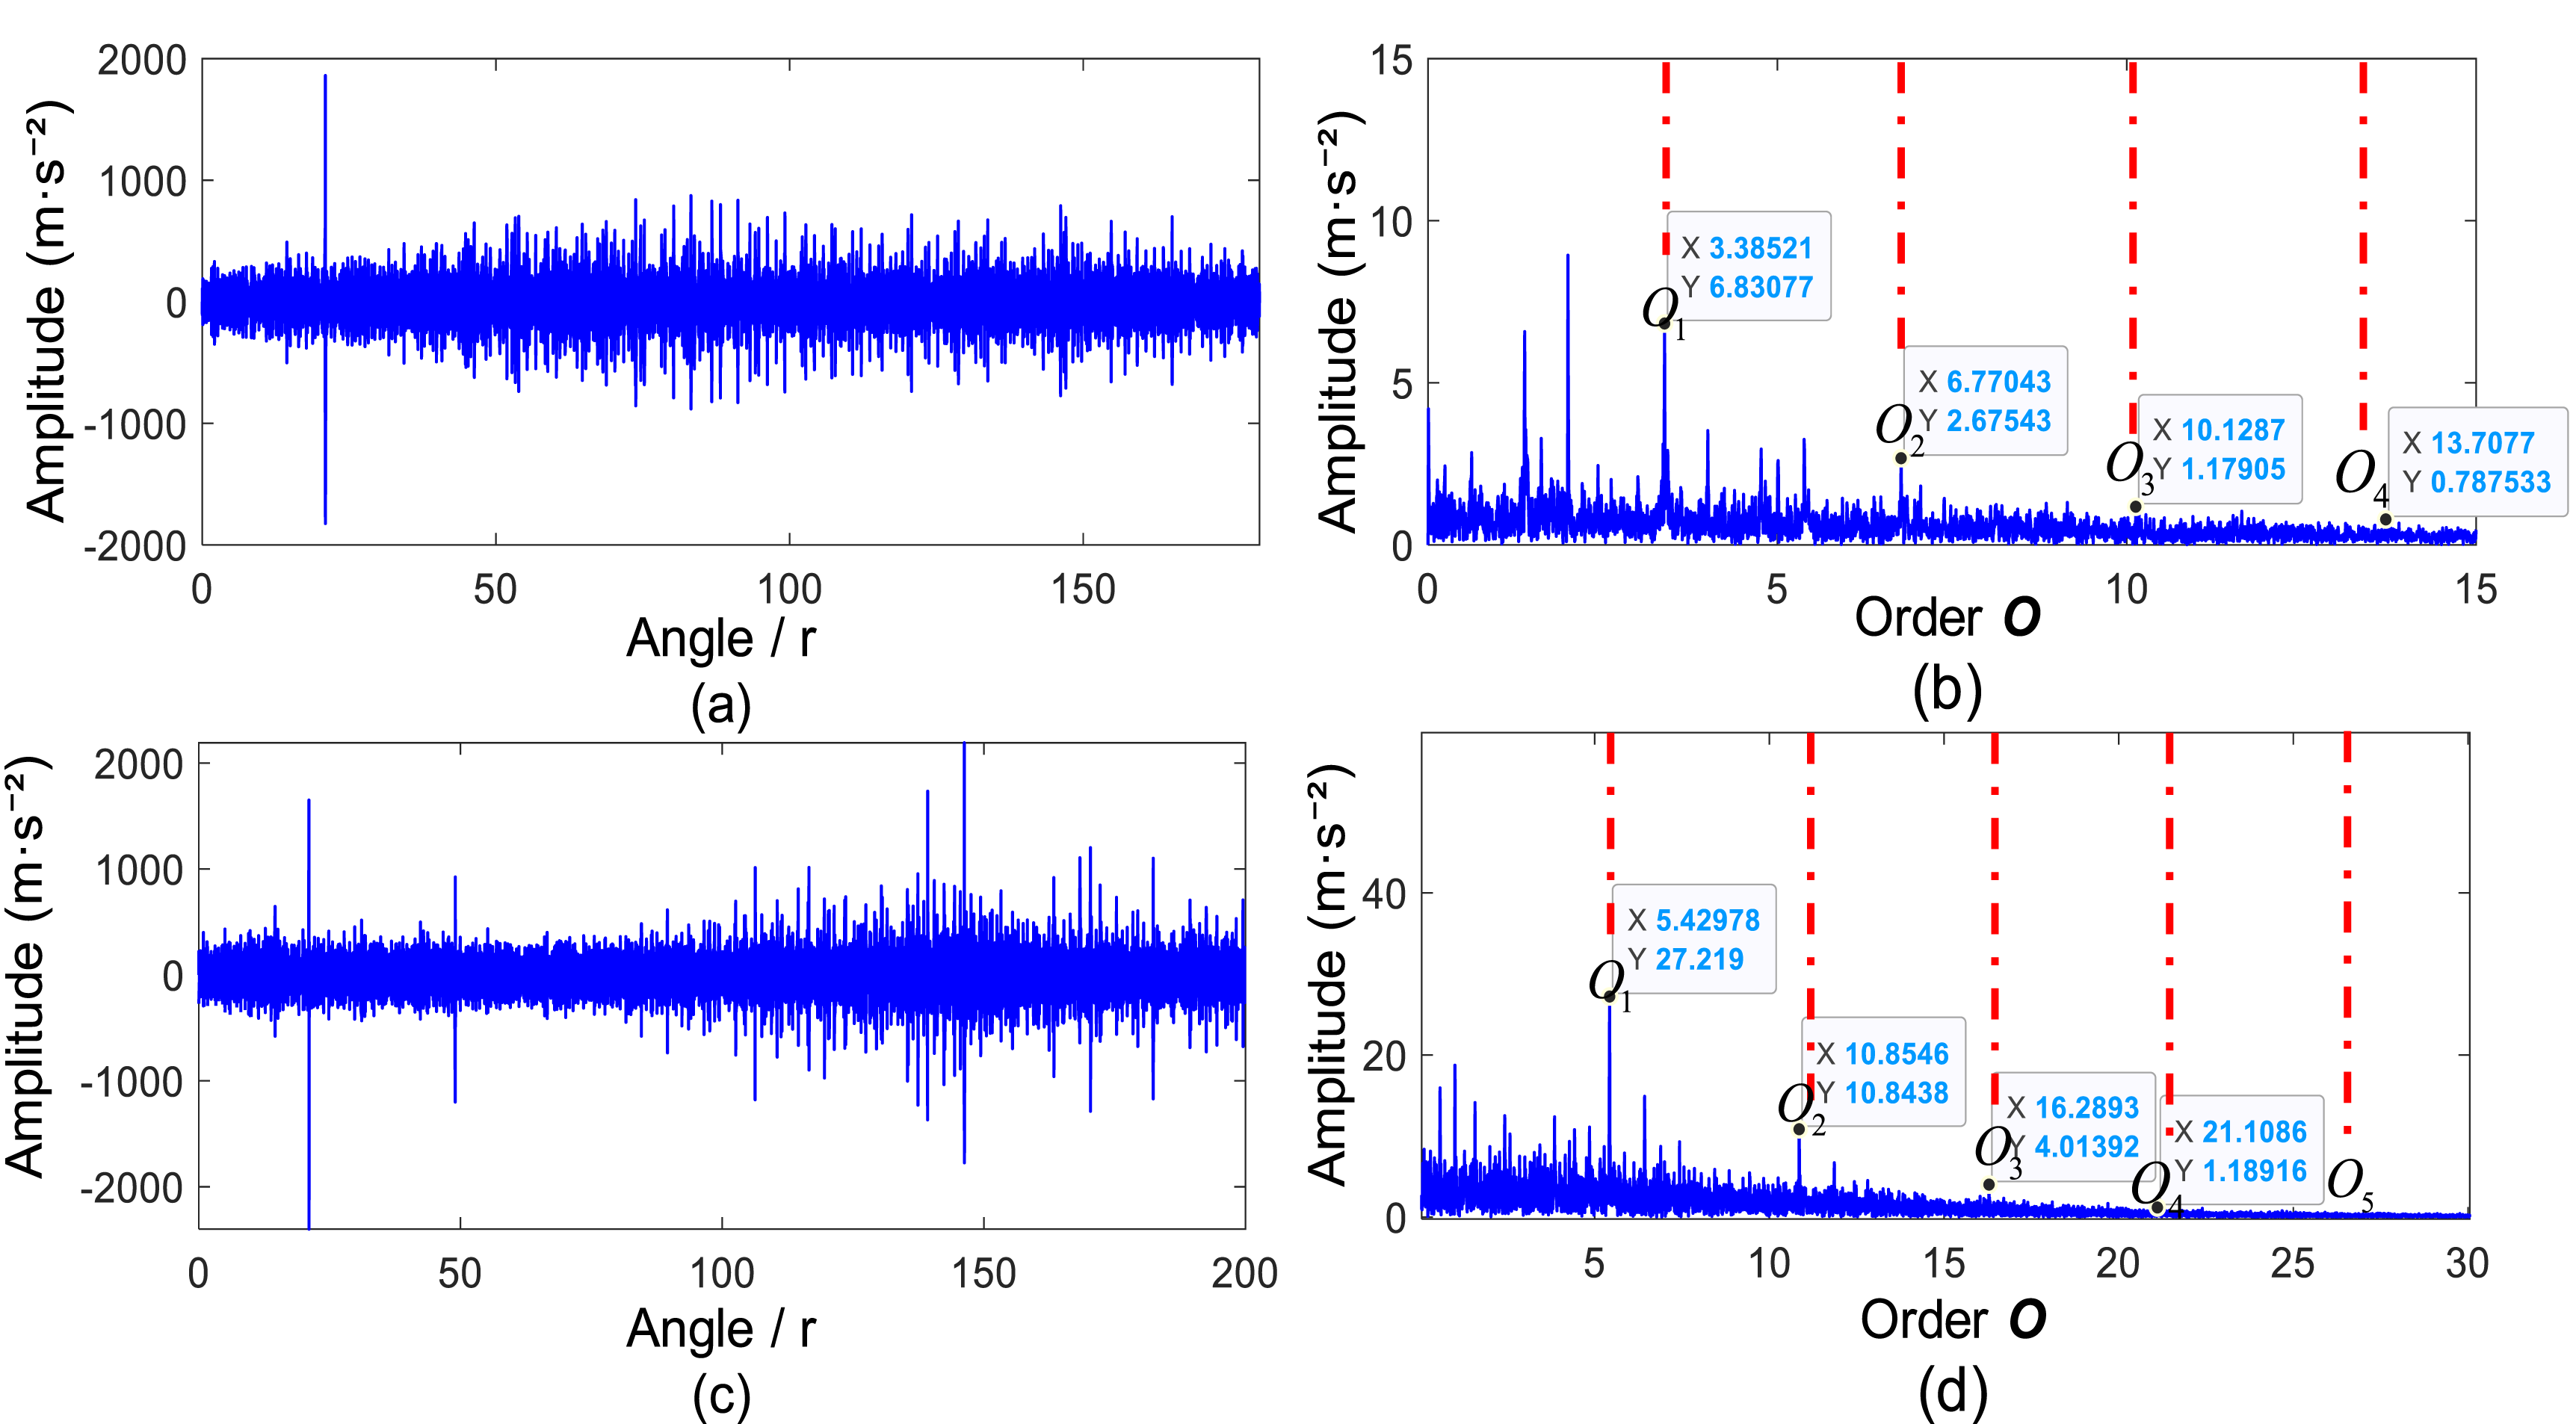
For the Inner Race (I-A-2), which involves signal attenuation and rotational modulation, the algorithm adapted to the wideband impulse characteristics, yielding optimal parameters [n*, K*, L*] = [3, 7, 15]. Figure 12 demonstrates the diagnosis. Feature amplitude surged from ∼0.012 (raw) to ∼27, a qualitative leap from “unidentifiable” to “distinct.” Harmonics (1× ∼ 5× BPFI, where BPFI = 5.43) are clearly presented with reduced clutter. This confirms that ED-GAFMD effectively overcomes strong noise while preserving unique modulation information.
Following optimal parameter determination, ED-GAFMD executes the final decomposition. Figure 13 illustrates the extracted Intrinsic Mode Functions (IMFs) and their corresponding kurtosis indices. For the outer race (Figure 13(a)), IMF1 exhibits a dominant kurtosis of 4220.07, significantly surpassing other modes, indicating it concentrates the primary fault energy. For the inner race (Figure 13(b)), despite strong interference, IMF3 (Kurtosis = 16.36) notably outperforms IMF1 (5.27) and IMF2 (7.31). Consequently, based on the Maximum Kurtosis Criterion, the mode with the highest index is selected as the sensitive mode for reconstruction, enabling precise extraction of weak fault features. ED-GAFMD: Mode decomposition results. (a) envelope order spec. of outer race modes, (b) envelope order spec. of inner race modes.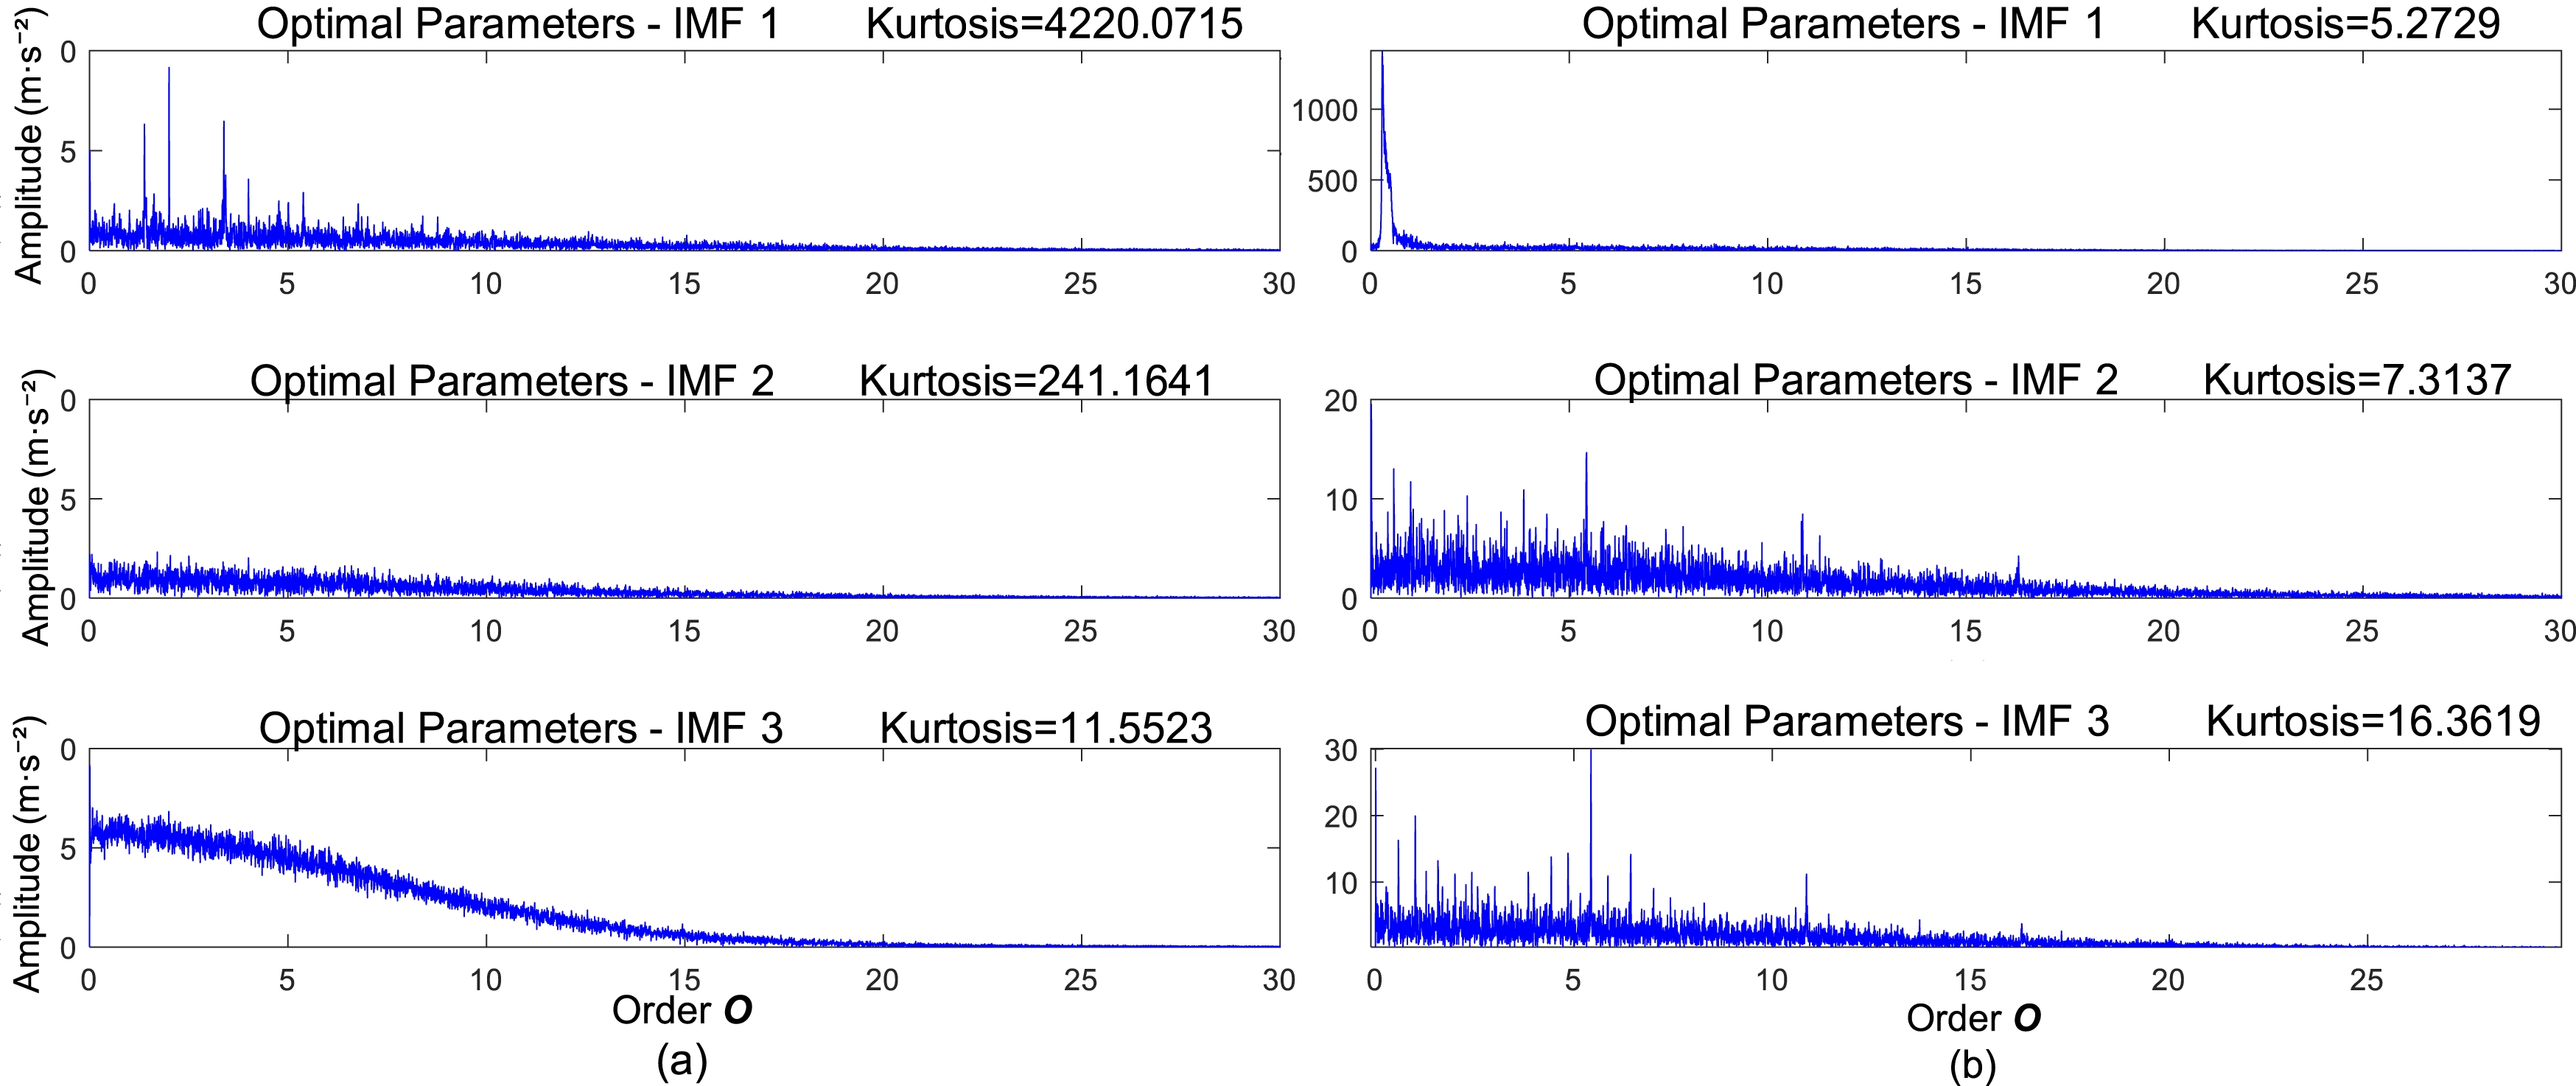
To validate the necessity of GWO optimization, Figure 14 compares envelope order spectra obtained using (a) empirical parameters versus (b) optimal parameters. With empirical parameters (L = 120, Figure 14(a)), bandwidth mismatch causes severe noise intrusion. In both outer (left) and inner (right) race cases, the theoretical characteristic orders are barely visible amidst clutter, with high-order harmonics completely submerged, indicating a low SNR. In contrast, using optimal parameters (Outer L = 20, Inner L = 15; Figure 14(b)), the algorithm precisely locks the resonance band. Background noise is drastically suppressed, revealing sharp, independent harmonics (O
1
, O
2
, O
3
). Notably, for the inner race (bottom right), weak features are successfully reconstructed from the strong-noise floor, validating the algorithm’s adaptability to varying fault mechanisms. Optimal mode order spectrum: ED-GAFMD vs AFMD, (a) outer race envelope order, (b) inner race envelope order.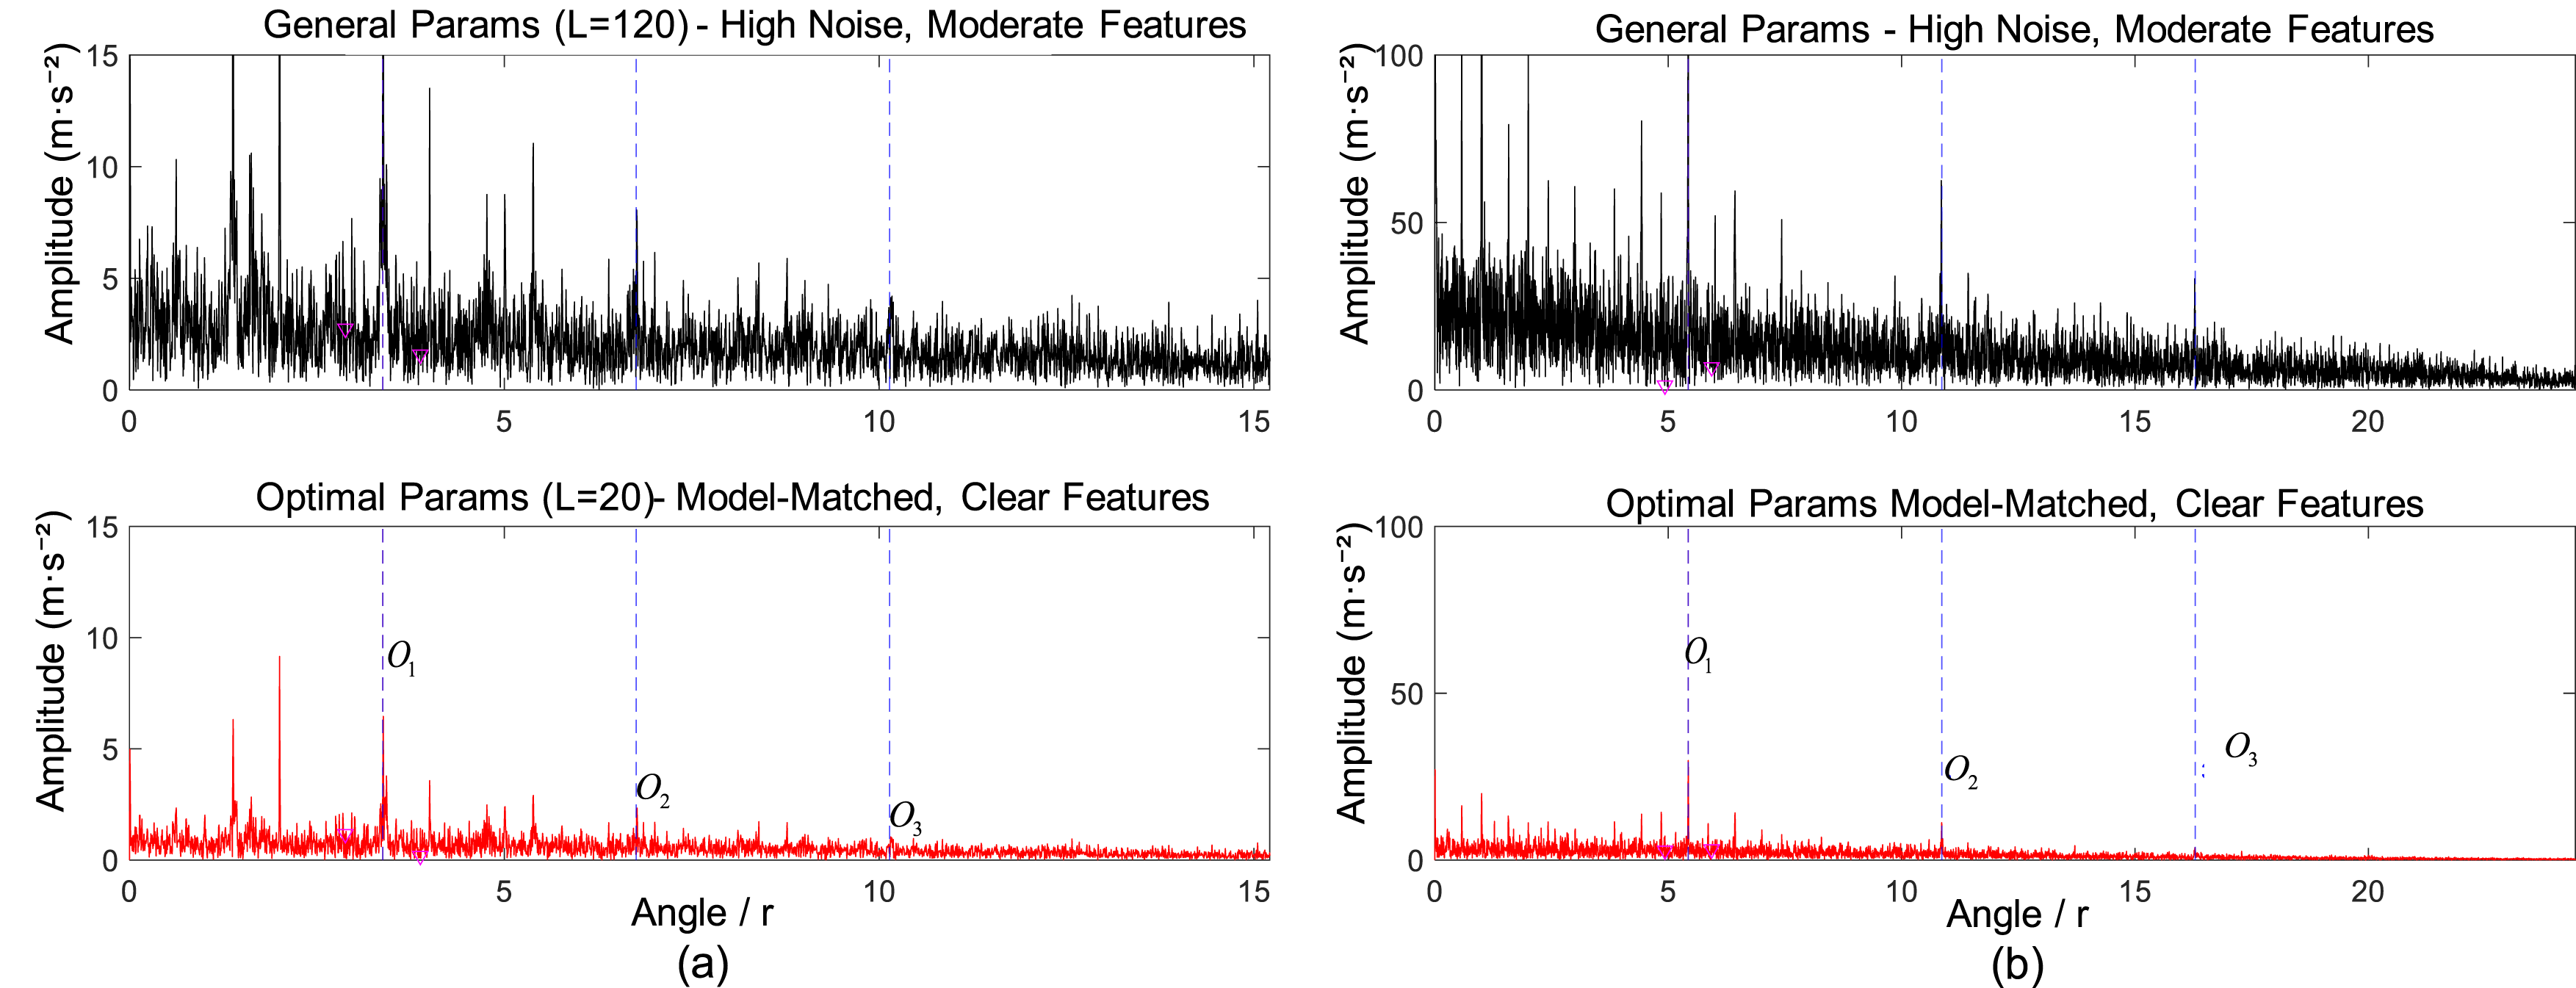
To validate the superiority of ED-GAFMD, it is compared with AFMD, GWO-FMD, and GWO-VMD under identical conditions. Results are shown in Figures 15–17. Analysis results of simulated signals via AFMD (general params). (a) outer race angular domain, (b) its envelope order, (c) inner race angular domain, (d) its envelope order. Analysis results of simulated signals via GWO-FMD. (a) outer race angular domain, (b) its envelope order, (c) inner race angular domain, (d) its envelope order. Analysis results of simulated signals via GWO-VMD. (a) outer race angular domain, (b) its envelope order, (c) inner race angular domain, (d) its envelope order.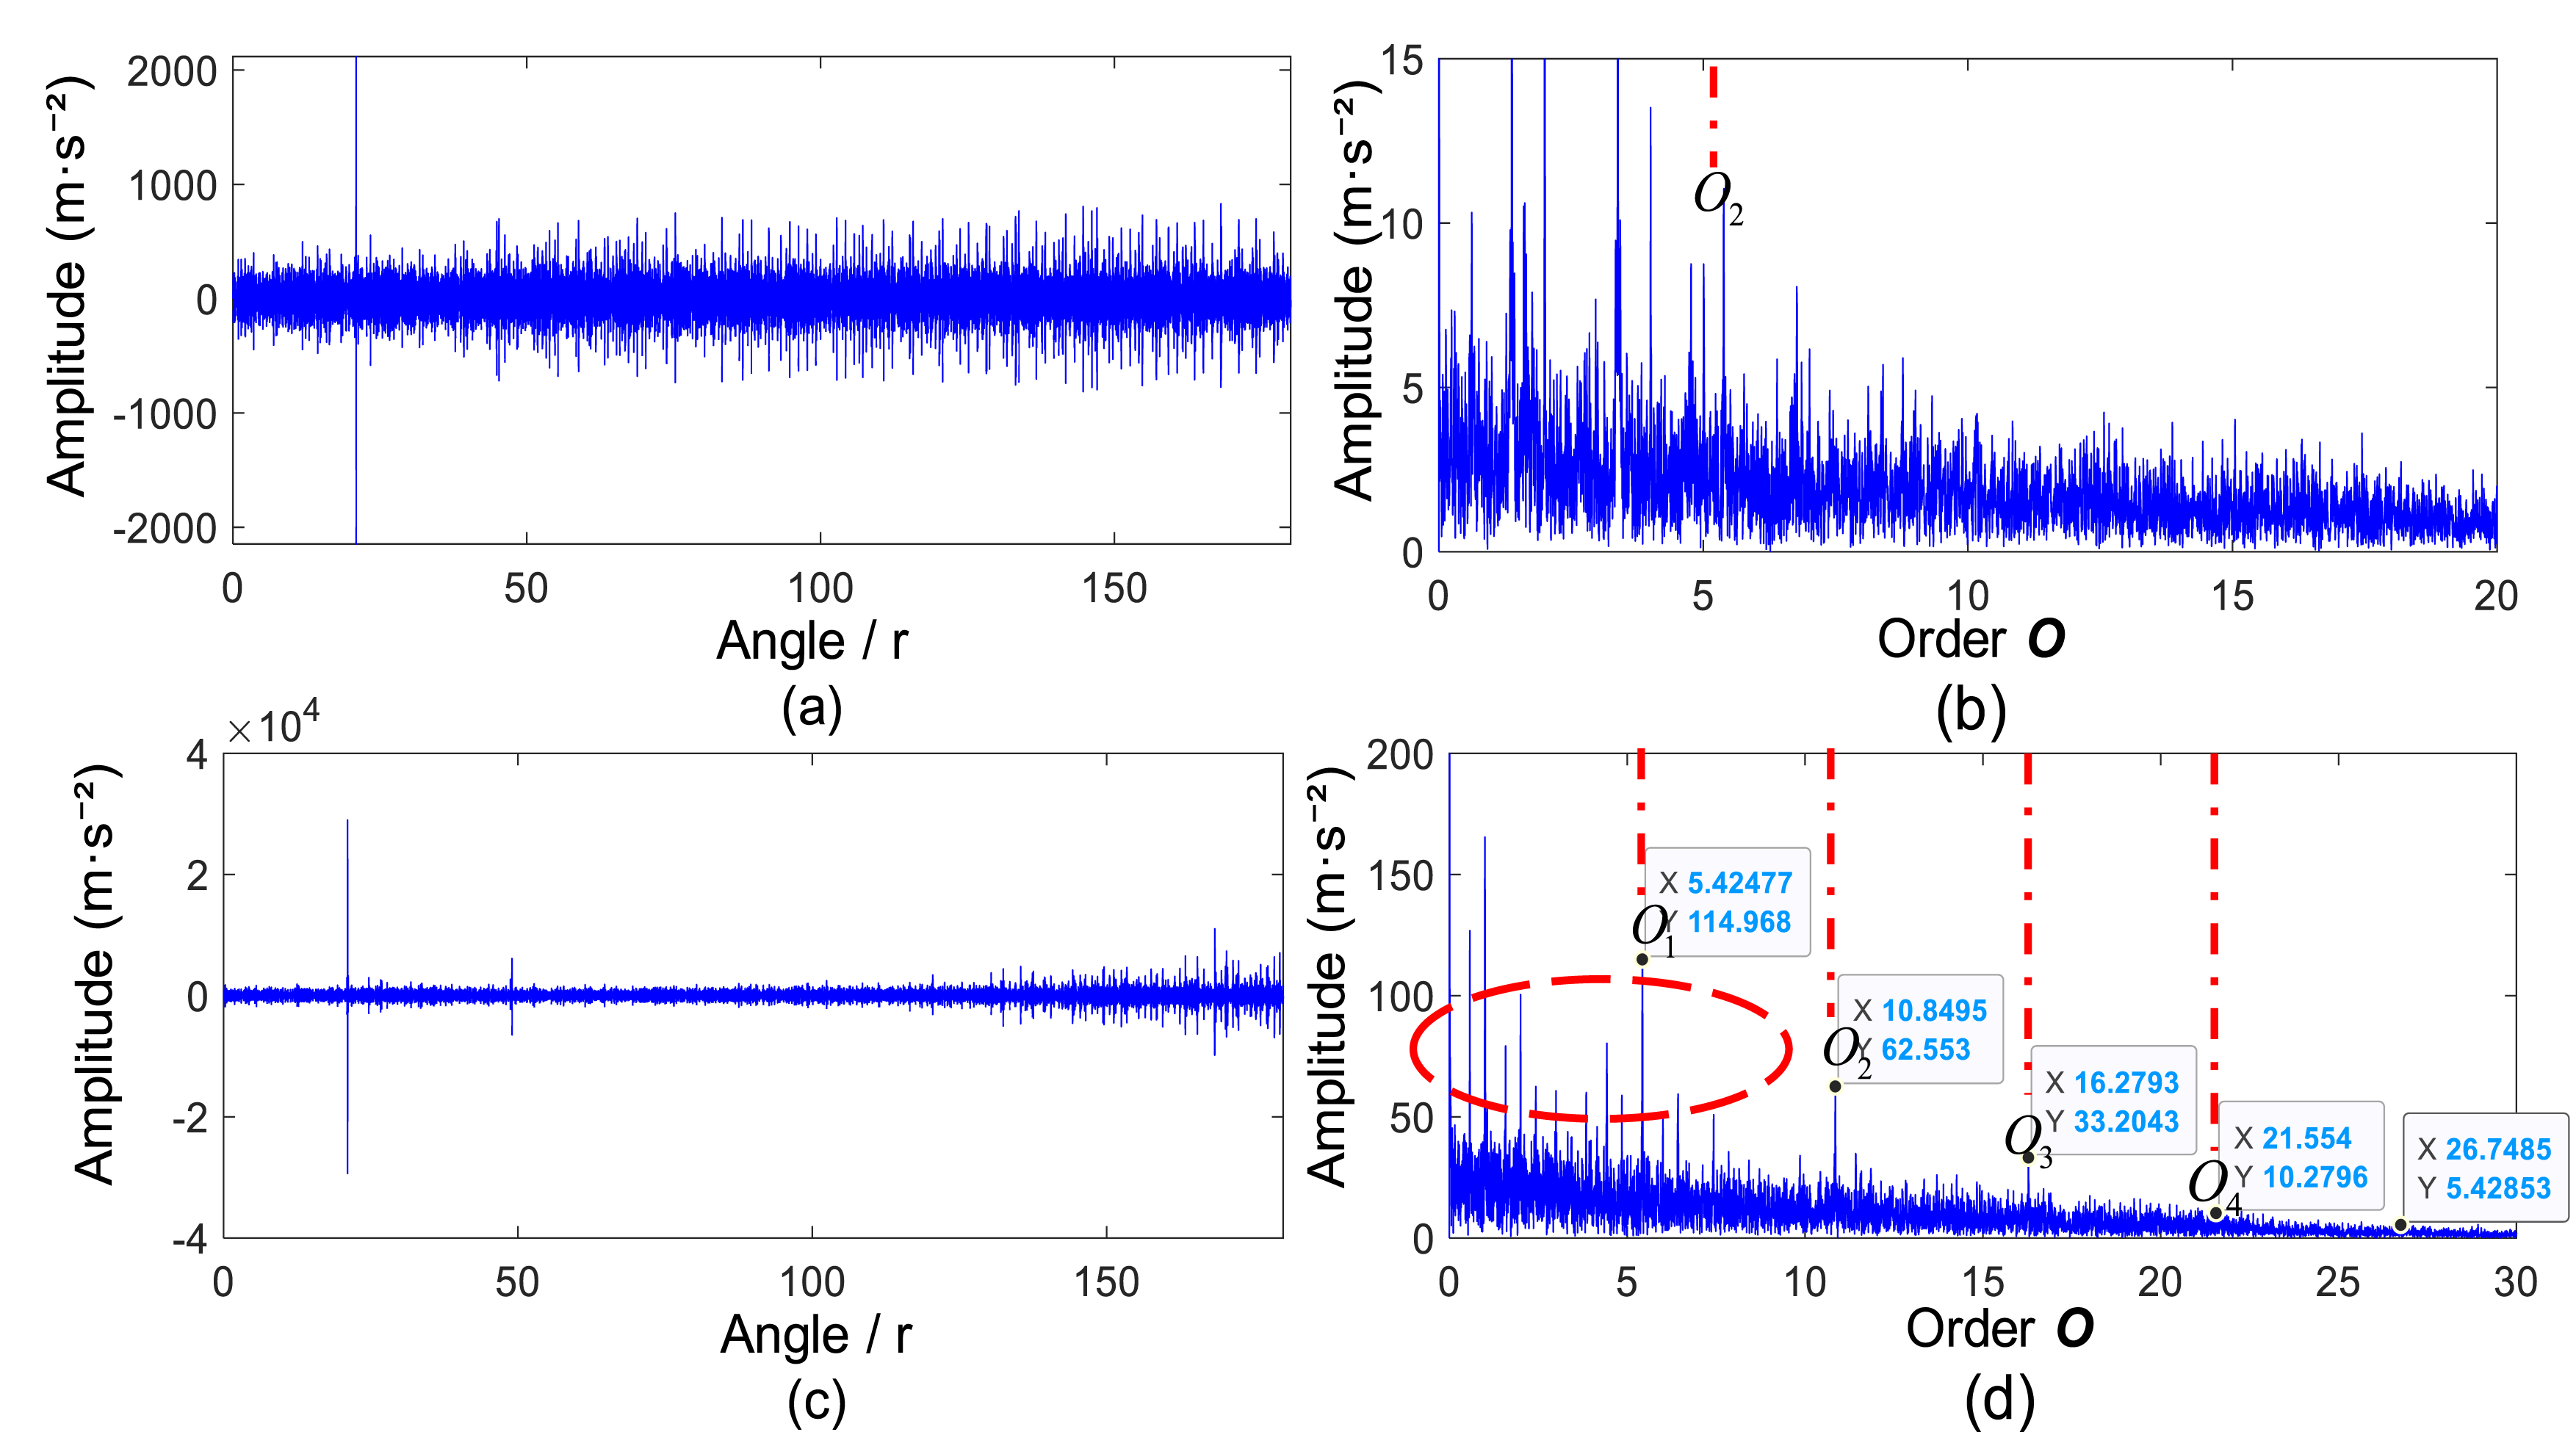
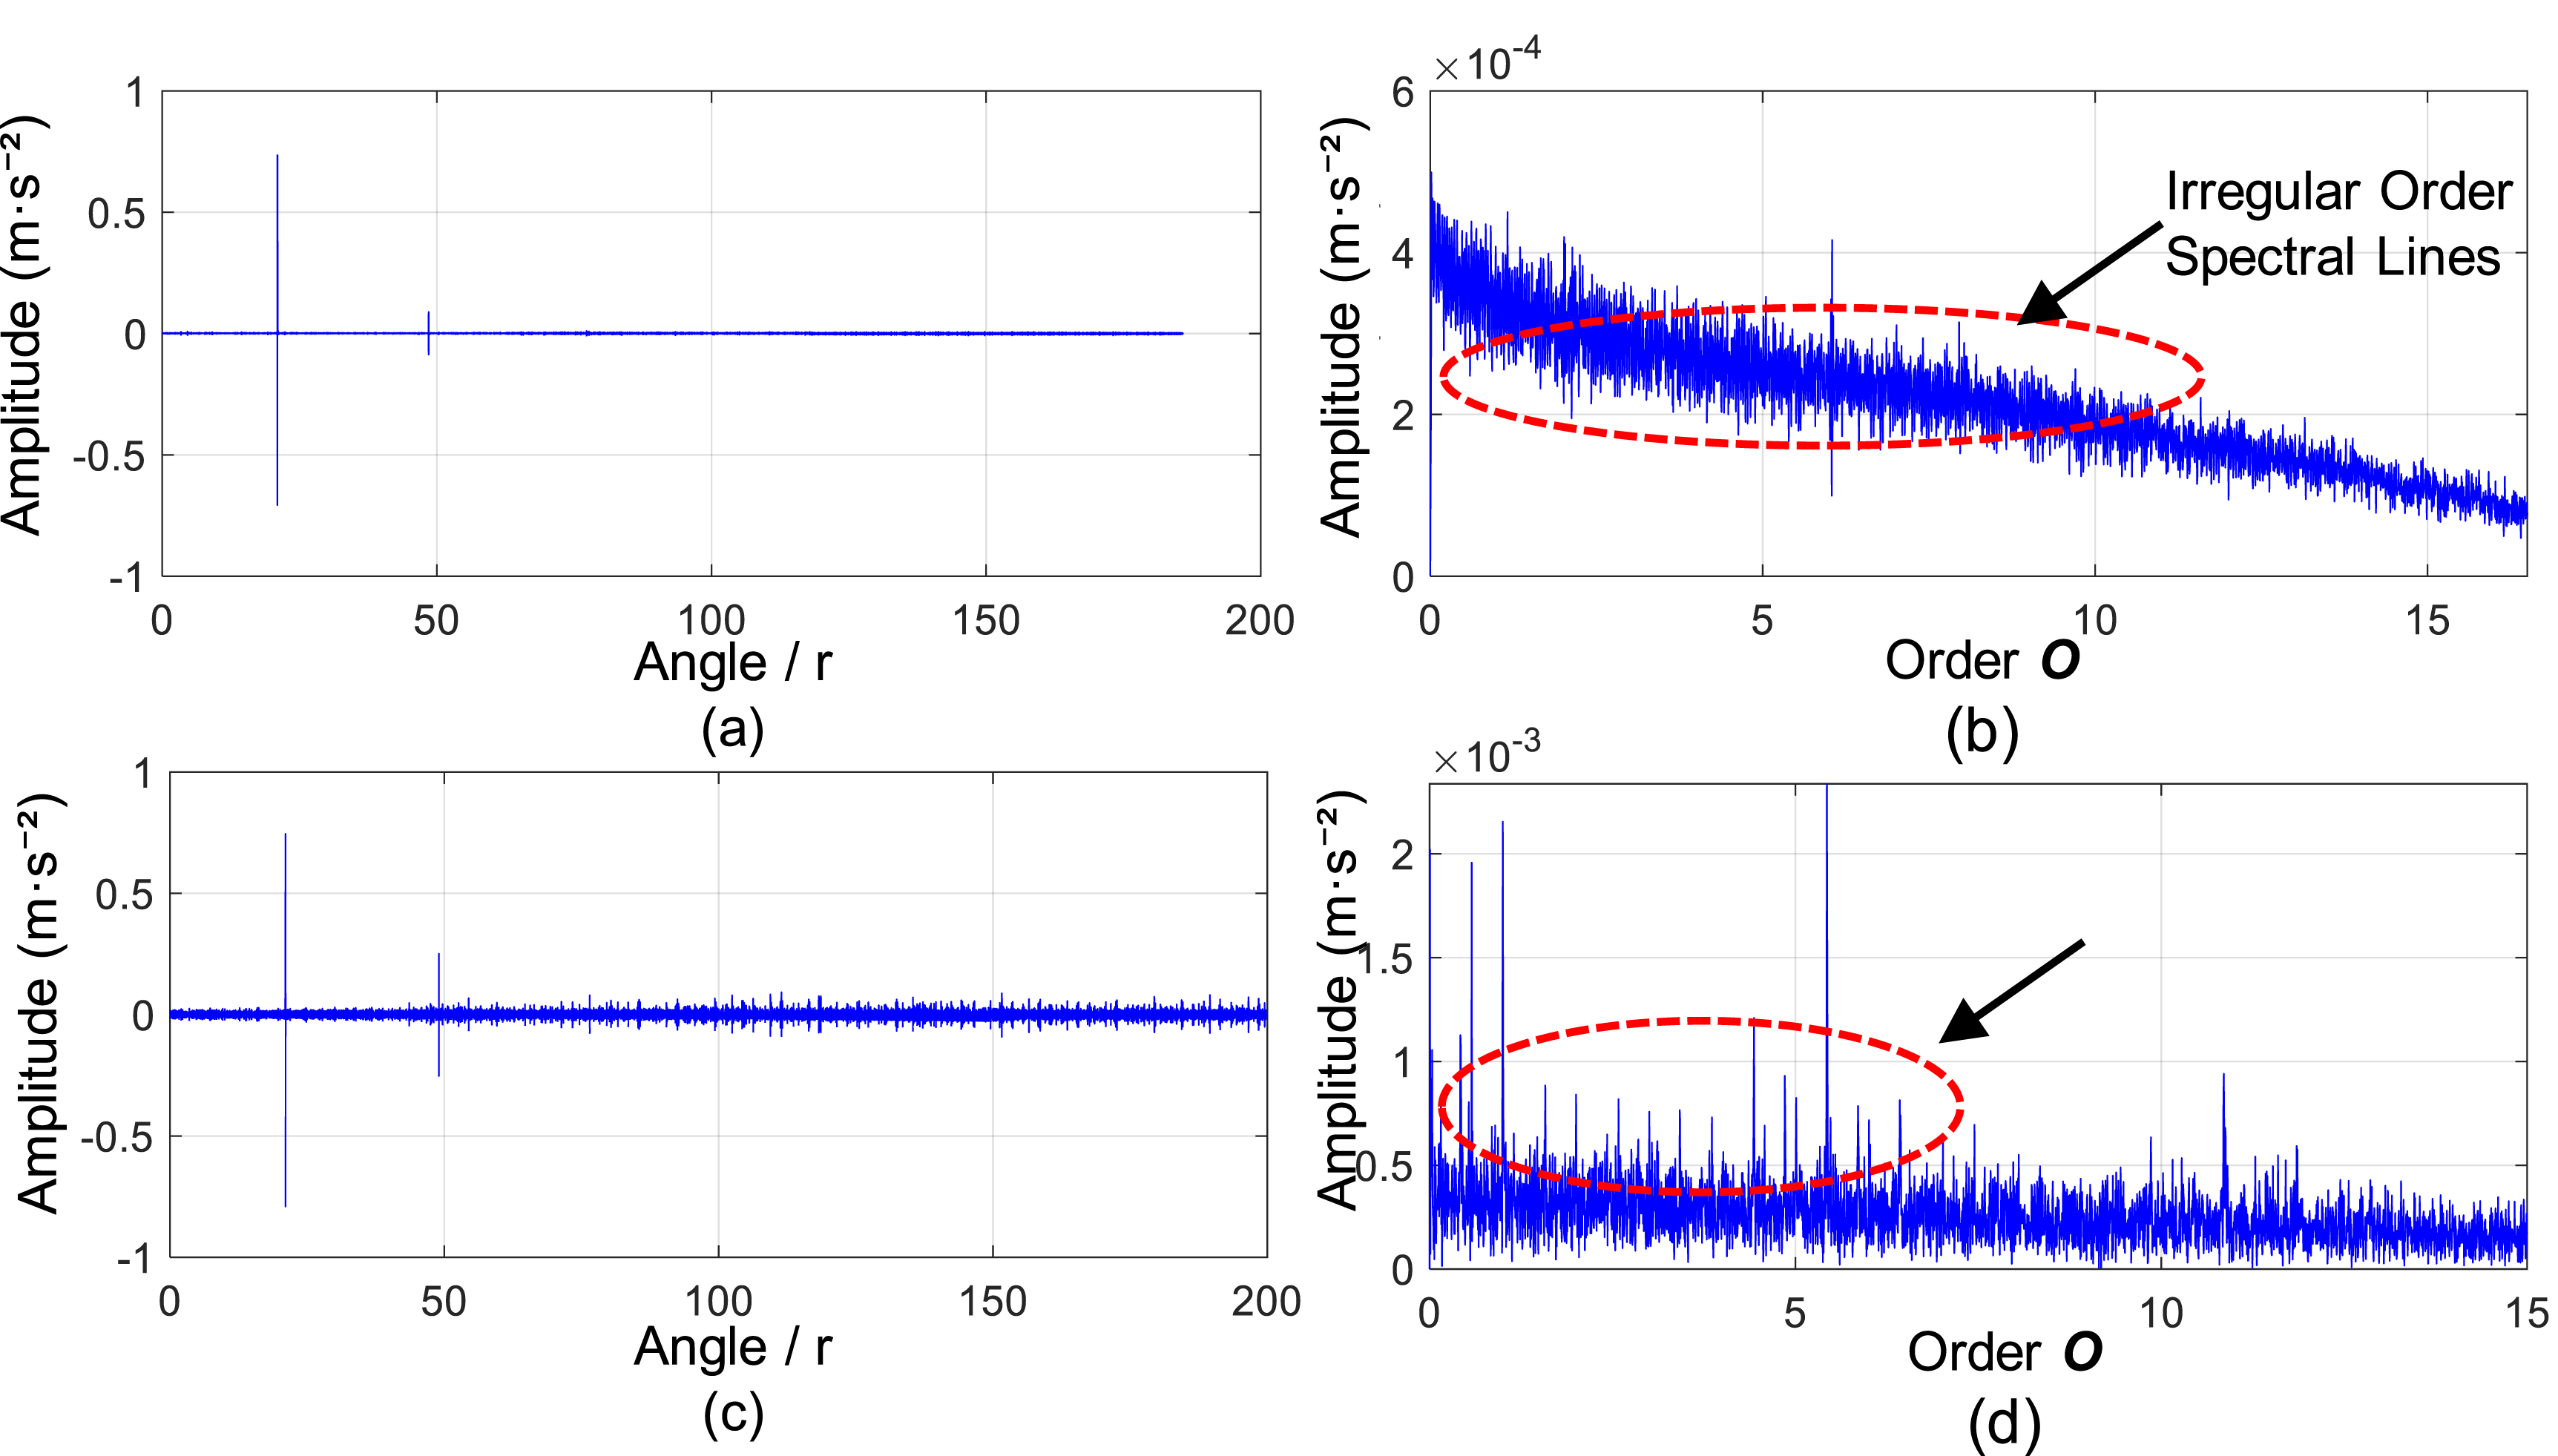
AFMD (Figure 15): In the angular domain (Figure 15(a) and (c)), signals retain significant noise and glitches. While the envelope order spectra (Figure 15(b) and (d)) reveal some fault orders, they are cluttered with high-amplitude spurious interference. Particularly for the inner race, this clutter severely hinders the identification of characteristic frequencies and harmonics.
GWO-FMD (Figure 16): Although waveforms (Figure 16(a) and (c)) appear smoother due to denoising, the method suffers from severe feature attenuation. In the spectra (Figure 16(b) and (d)), key fault characteristic amplitudes are nearly suppressed, drastically reducing diagnostic sensitivity.
GWO-VMD (Figure 17): This method exhibits the poorest noise robustness. Waveforms (Figure 17(a) and (c)) are heavily corrupted. Spectra (Figure 17(b) and (d)) are dominated by irregular non-stationary interference, masking both outer and inner race fault frequencies.
In contrast, the proposed ED-GAFMD method (Figure 12) demonstrates significant superiority. In both outer and inner race angular domains (Figure 12(a) and (c)), signal waveforms are distinct and clean, indicating effective noise suppression. Correspondingly, the envelope order spectra (Figures 12(b) and 12(d)) exhibit markedly enhanced fault characteristic amplitudes. Harmonic structures are clearly resolved against a flat noise floor, devoid of significant spurious interference.
In summary, comparative methods are limited by residual noise and feature attenuation under harsh conditions. Conversely, ED-GAFMD effectively balances denoising and enhancement, validating its superiority in complex diagnostic scenarios.
4.3. Analysis of diagnostic experiments
To validate practical effectiveness under variable conditions, a lightweight 1D-CNN is constructed to classify ED-GAFMD filtered signals. The dataset is partitioned into training, validation, and testing sets (ratio: 8:1:1).
Experimental results yield a test accuracy of ∼98% despite the compact model size. This confirms that ED-GAFMD extracts highly discriminative features suitable for lightweight classification. As shown in the confusion matrices (Figure 18), the model maintains superior accuracy across varying noise levels (SNR: −2dB to −10dB) for Healthy, Inner, Outer, and Ball states, with minimal misclassification. 1D-CNN confusion matrix: ED-GAFMD decomposition features (a) −2dB, (b) −4dB, (c) −6dB, (d) −8dB, (e) −10dB.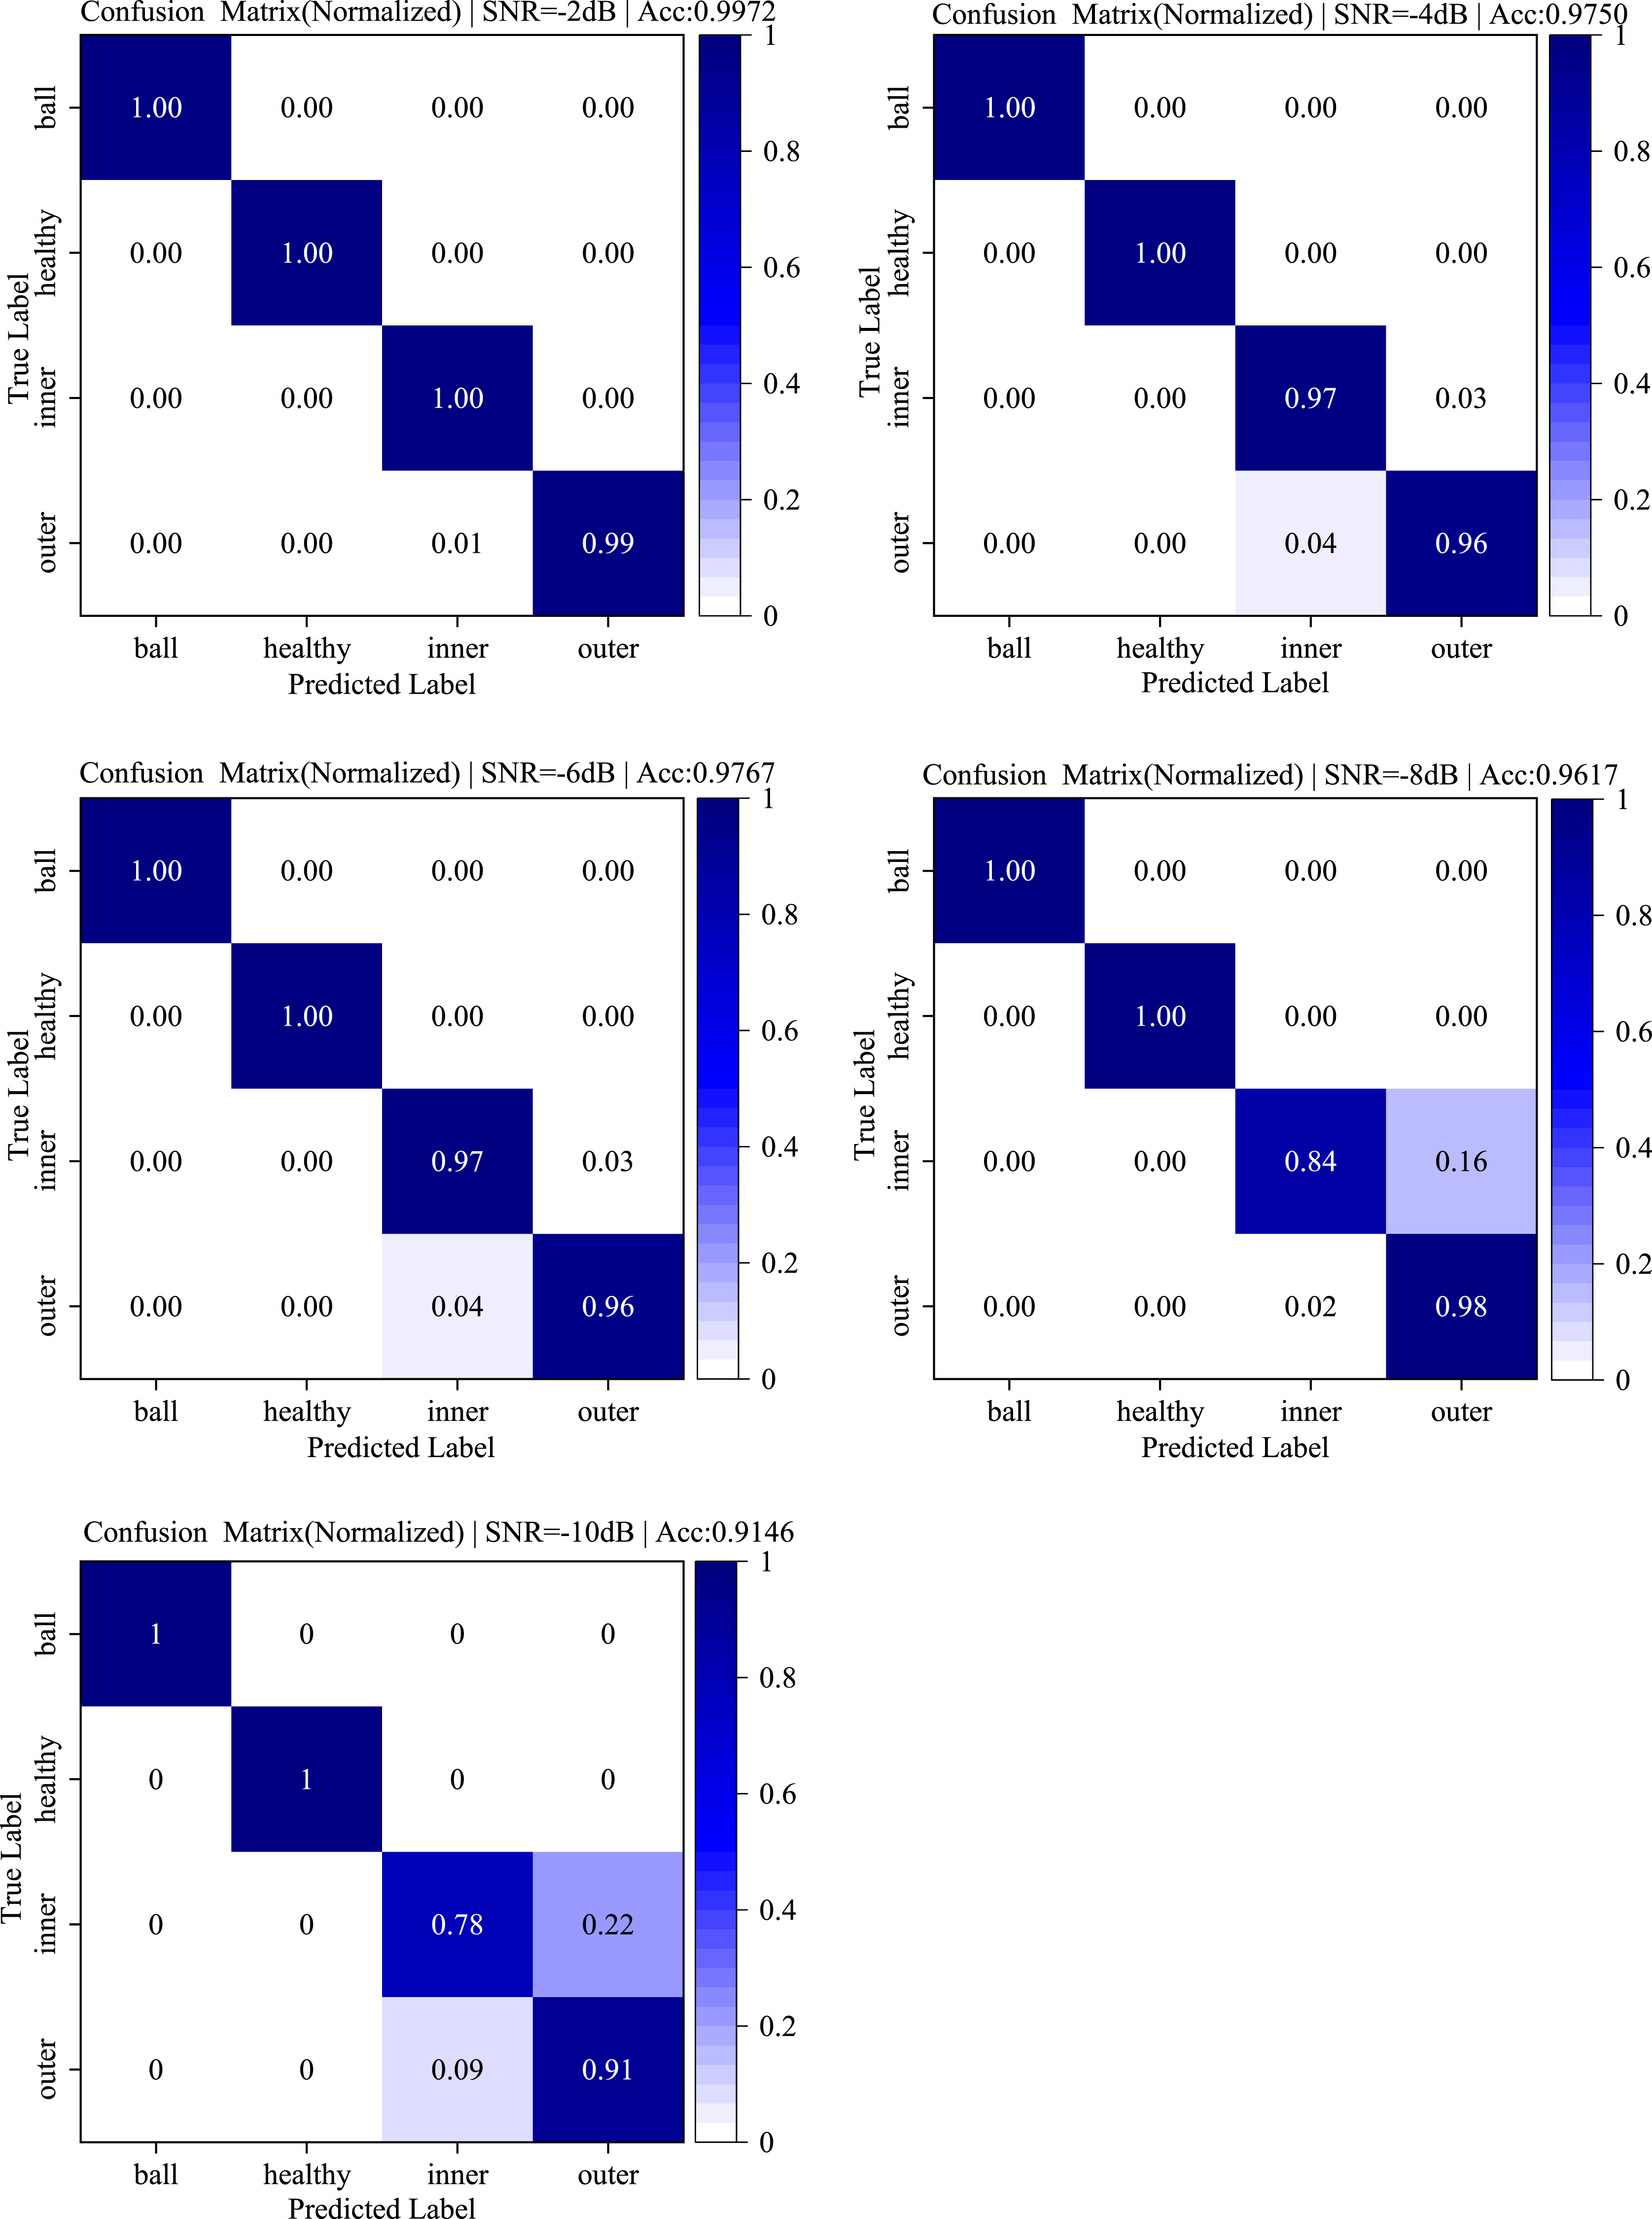
Figure 19 illustrates test accuracy evolution. At −2dB, accuracy reaches 99.72%, demonstrating precise identification. Despite the natural decline with lower SNRs, performance remains robust, retaining 91.5% accuracy even at −10dB. This validates the model’s strong-noise resilience and consistent classification capability. 1D-CNN training accuracy (Cross-SNR, ED-GAFMD).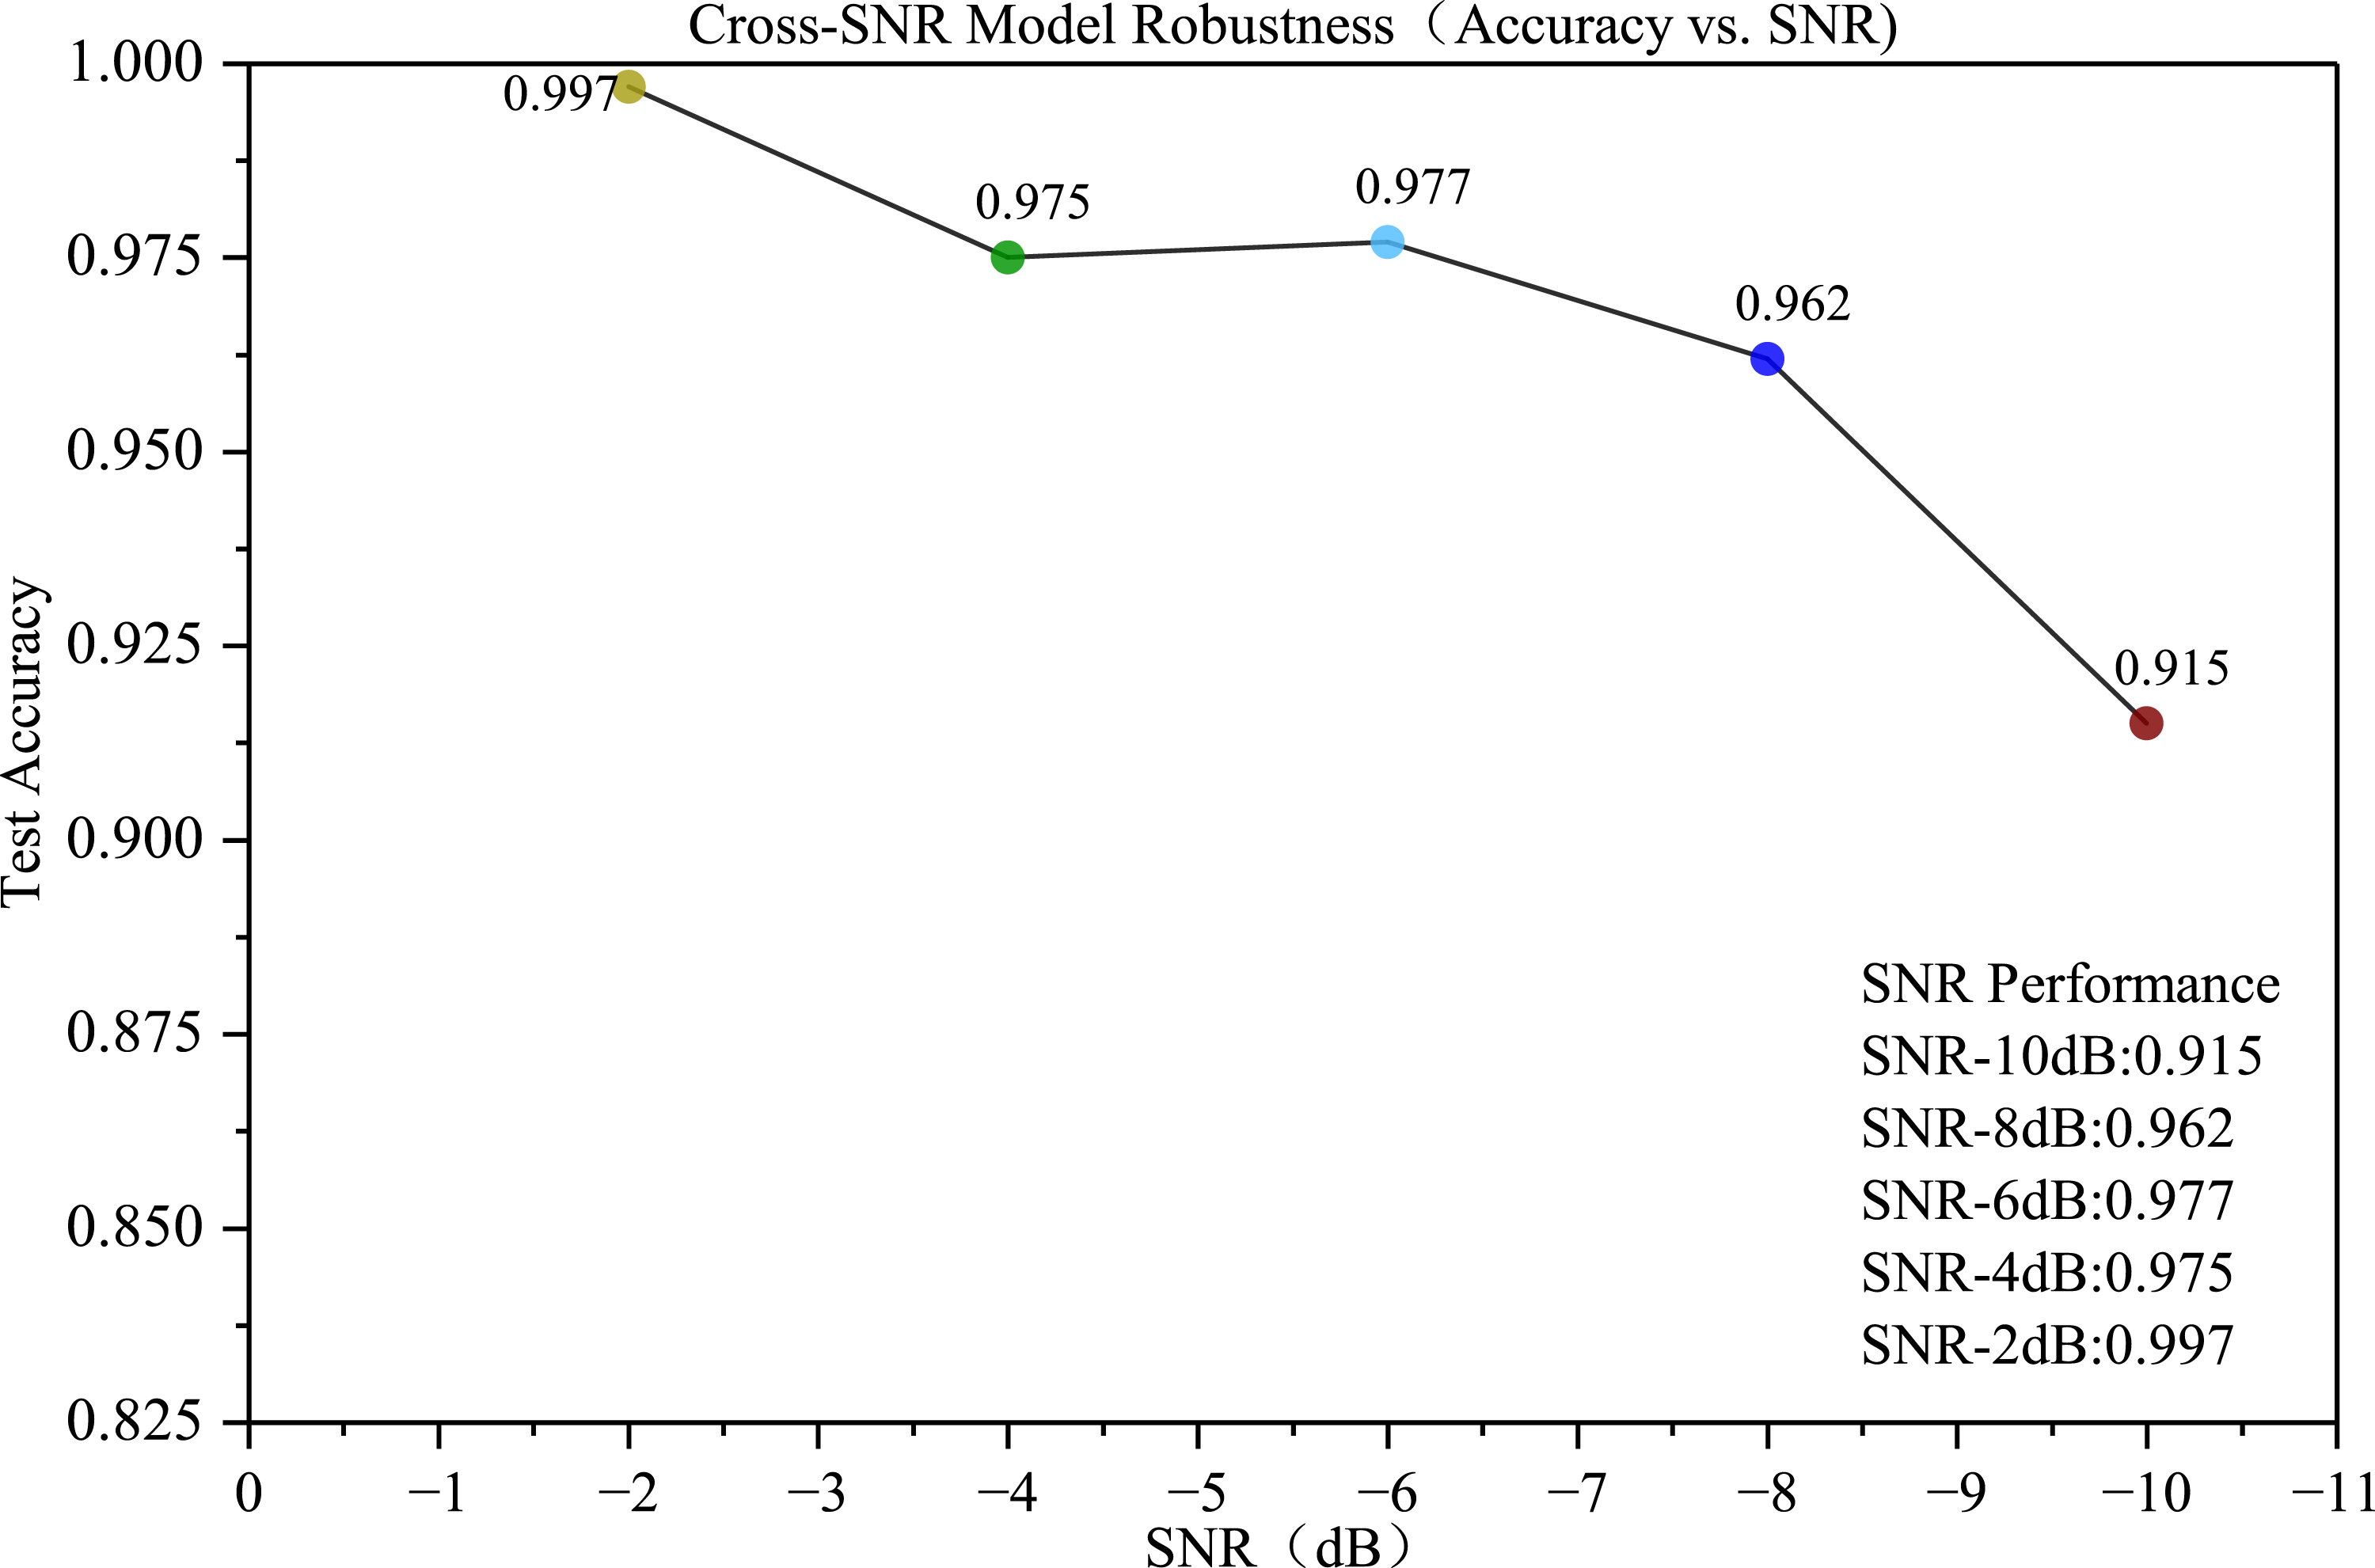
Figure 20 illustrates the training accuracy and loss curves across different categories and SNR levels. As training epochs increase, the accuracy gradually rises and stabilizes. Simultaneously, both training and validation losses decrease and plateau. These trends indicate that the model effectively captures data features without overfitting, achieving a robust final accuracy of 97%. Training accuracy and loss rate of 1D-CNN (ED-GAFMD).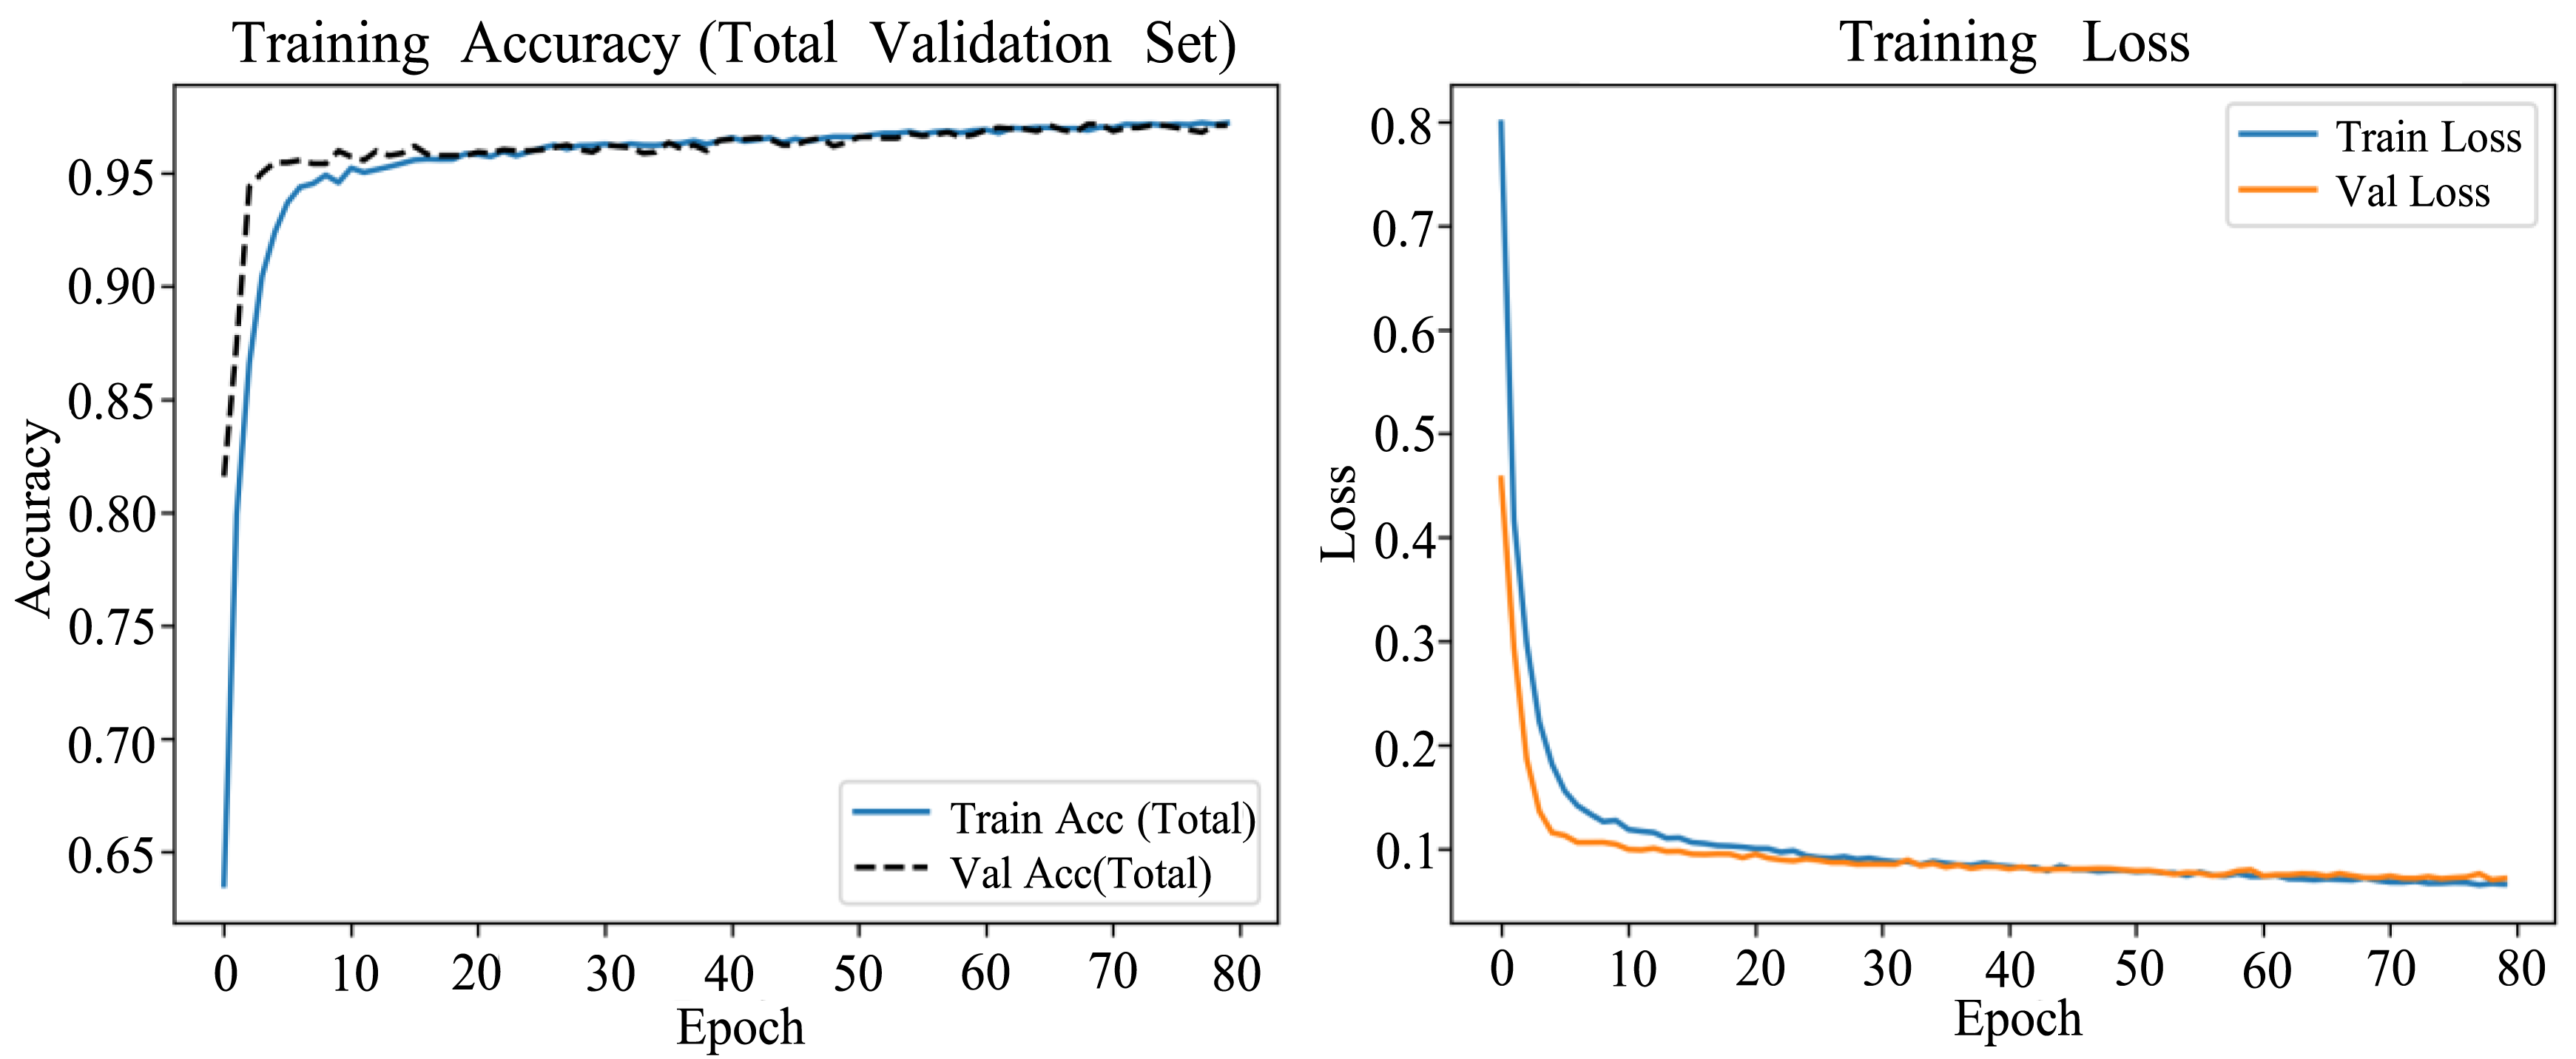
From an engineering perspective, the method achieves reliable identification without relying on complex hardware. Given that industrial scenarios are often resource-constrained, the integration of ED-GAFMD with a lightweight 1D-CNN reduces hardware demands while maintaining high accuracy. Consequently, this offers significant practical value as an efficient solution for fault diagnosis under variable conditions.
4.4. Analysis of diagnostic experiments
To verify the effectiveness of the proposed ED-GAFMD method, this section conducts a comprehensive performance evaluation. First, repeatability tests and statistical significance analyses are performed to eliminate objective errors caused by algorithmic randomness. Second, ablation studies and baseline comparisons are utilized to analyze the specific contributions of different fitness functions and selection criteria. Finally, by combining quantitative metrics (ERAK and FER) with computational runtime analysis, the superiority and engineering practicality of the proposed method under variable-speed and heavy-noise conditions are fully demonstrated.
To comprehensively evaluate the diagnostic performance, standard classification metrics including Mean Accuracy and F1-Score are adopted. Furthermore, all experiments are independently repeated 10 times to record the standard deviation (Std), ensuring the robustness of the results.
4.4.1. Anti-noise performance and repeatability analysis under severe noise
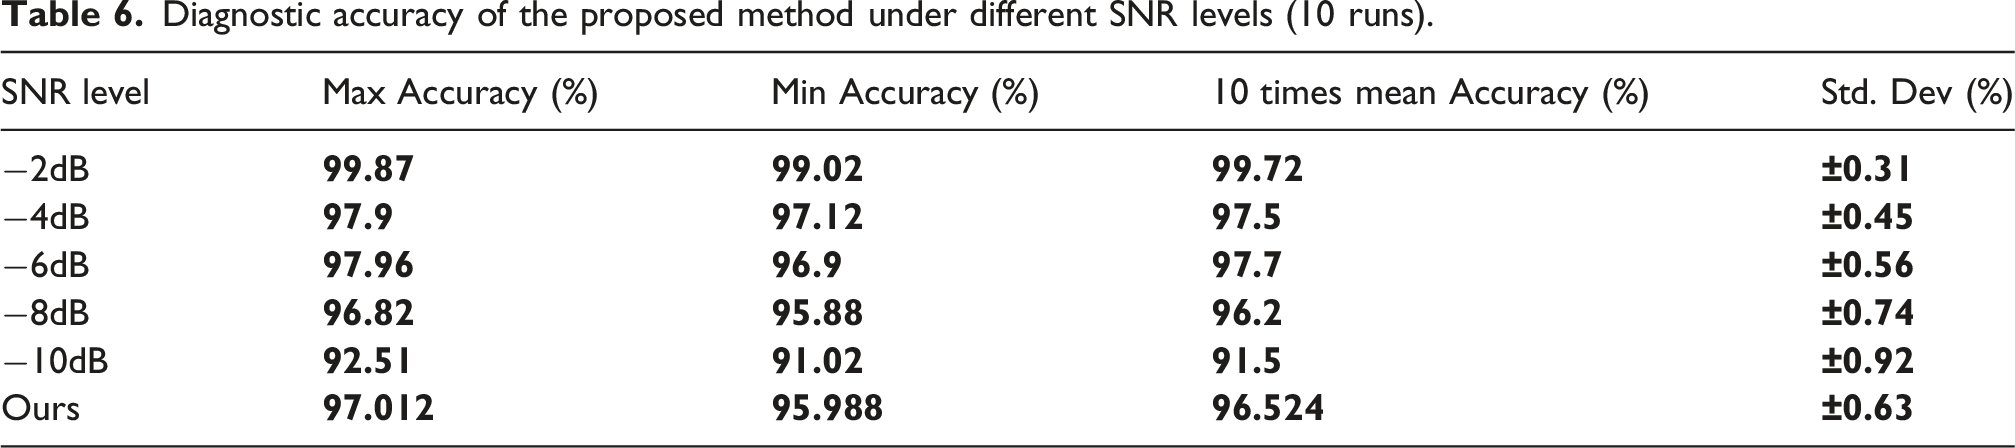
To strictly verify the robustness of the algorithm under extreme conditions, cross-tests were conducted under multiple Signal-to-Noise Ratios (SNRs) ranging from −2dB to −10dB. To eliminate the random errors caused by deep learning network initialization, all conditions were independently executed 10 times.
As illustrated by the line trends in Figure 21 and Table 6, with the intensification of background noise, the diagnostic accuracy of early methods without fine filtering (e.g., Case 1 and Case 2 experiences a cliff-like drop. In contrast, the proposed ED-GAFMD framework (Case 5 not only maintains excellent recognition accuracy under the −10dB extreme noise limit but also controls the average standard deviation of 10 runs within a minimal range, fully proving its strong anti-noise stability and feature extraction capability. Diagnostic accuracy comparison of different ablation models under varying SNR levels. Diagnostic accuracy of the proposed method under different SNR levels (10 runs).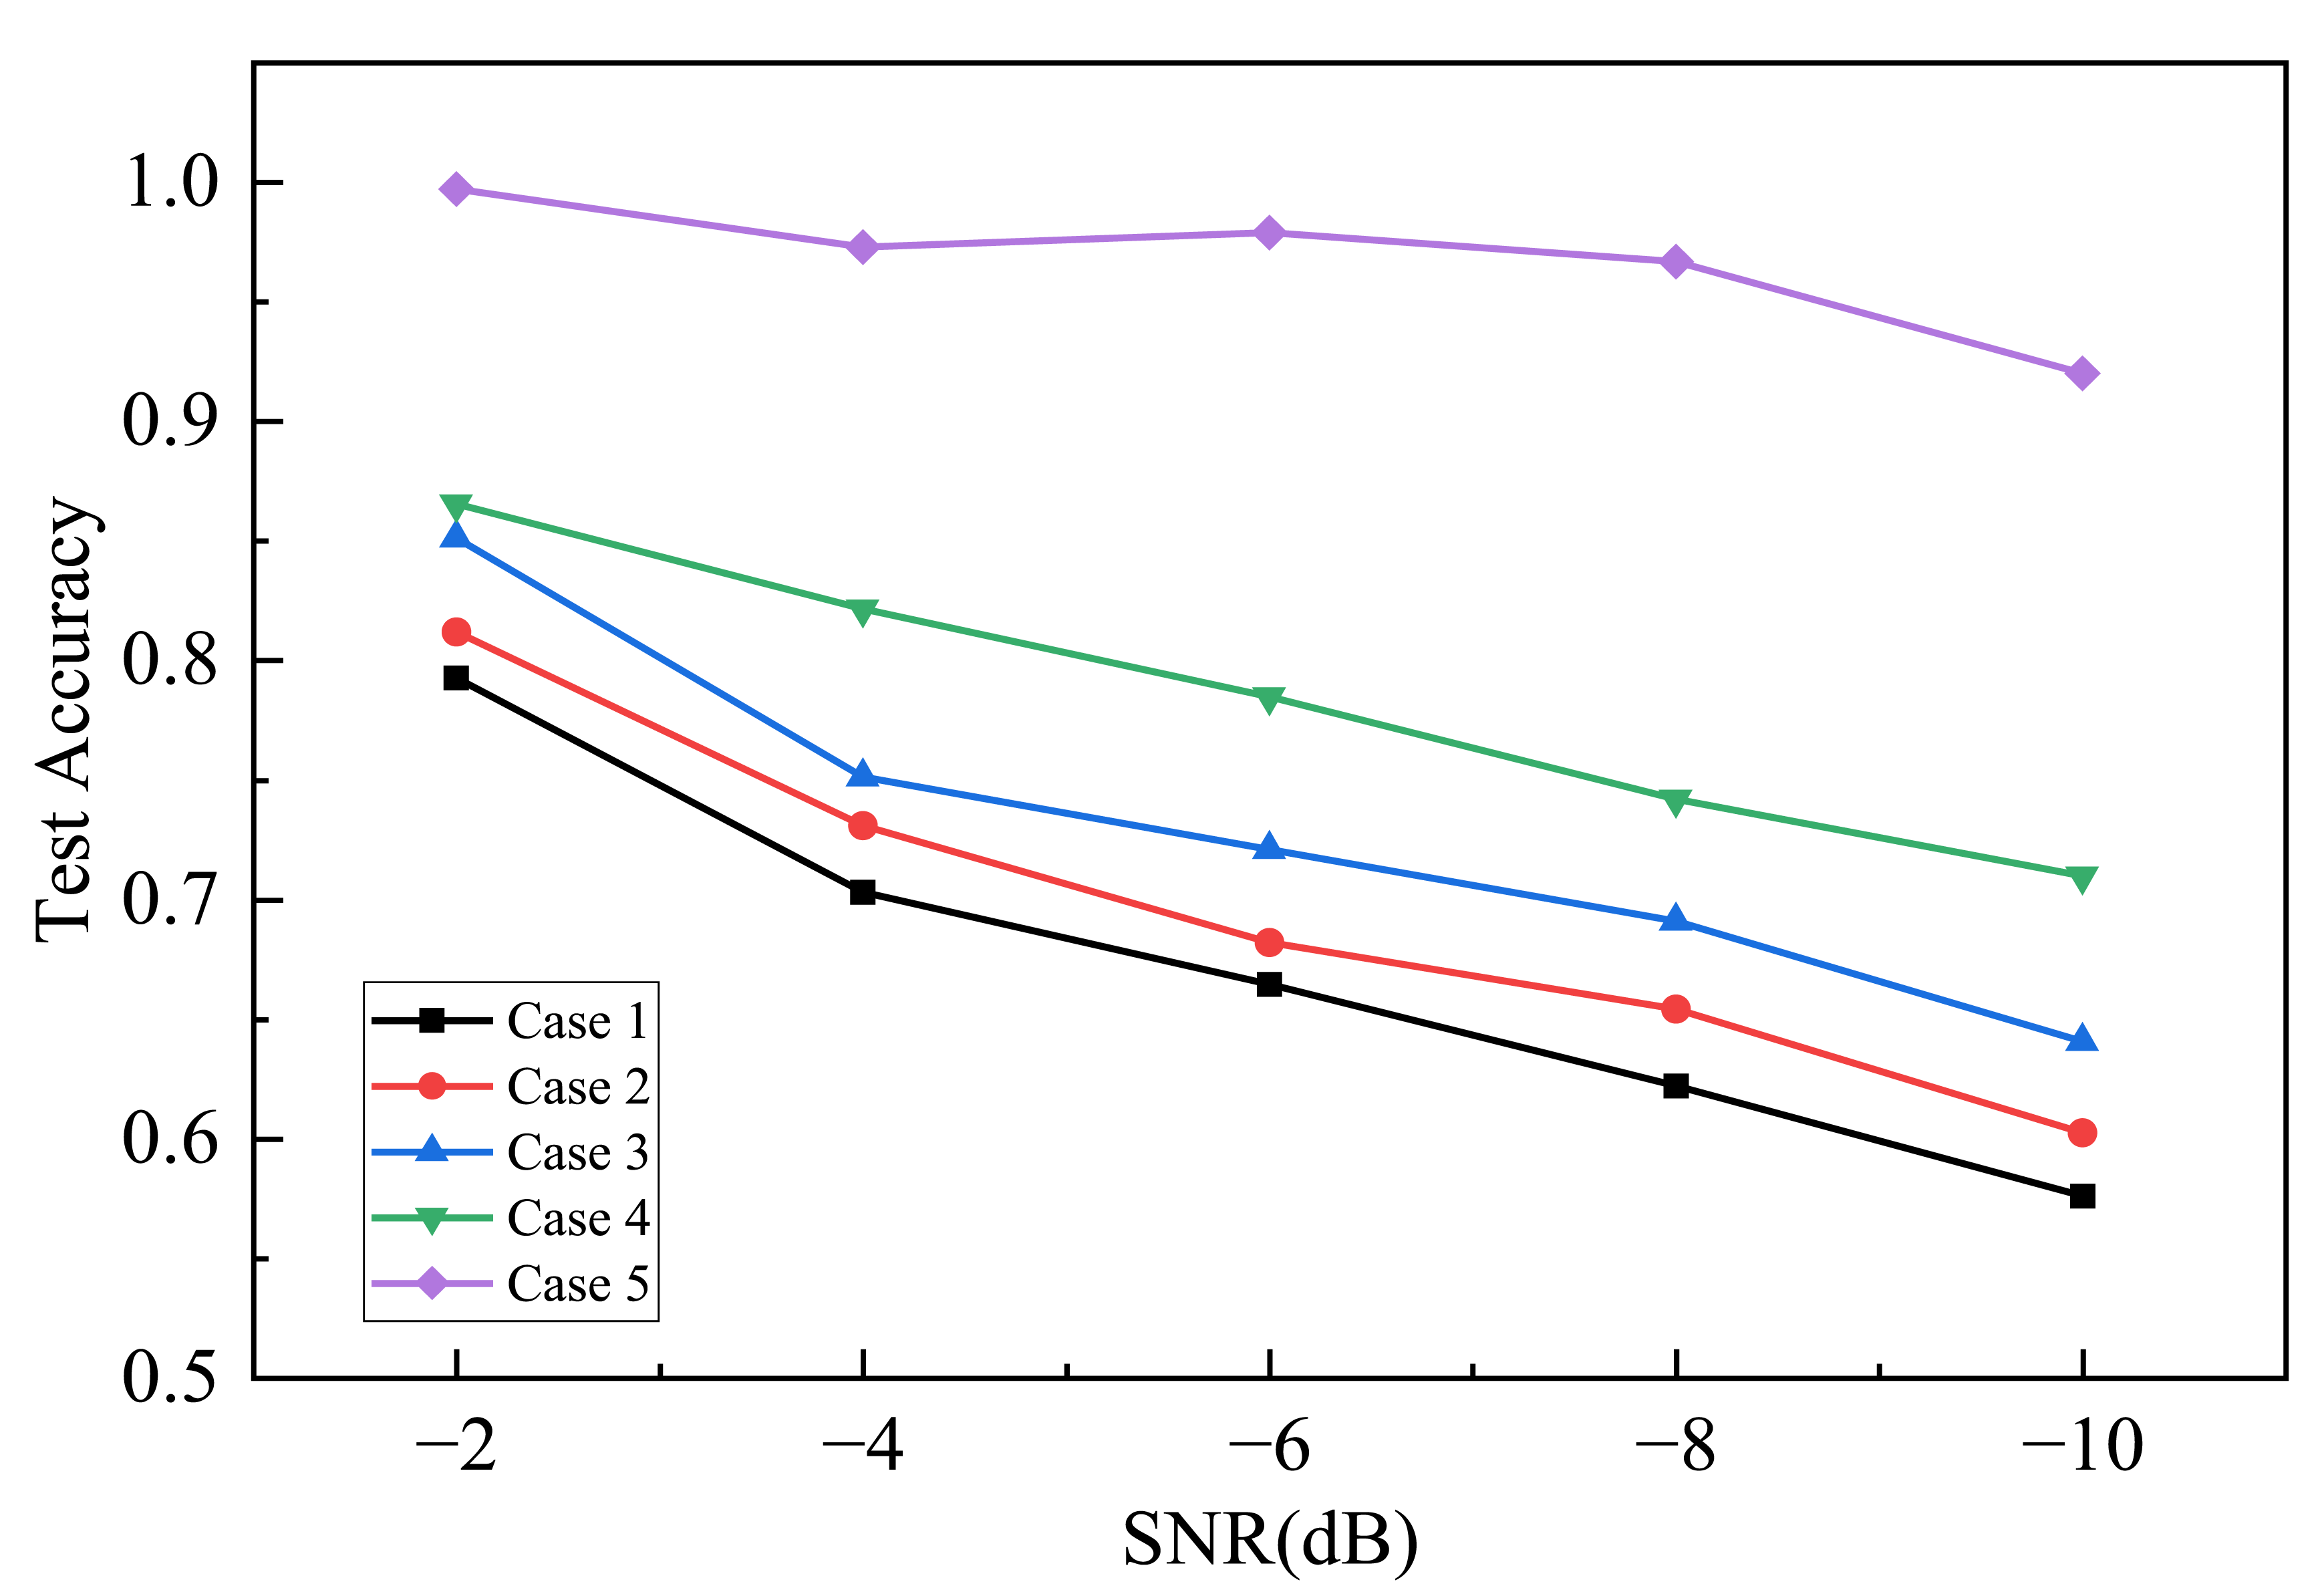
4.4.2. Diagnostic model ablation study and error analysis
To clarify the specific contributions of the COT resampling, adaptive decomposition (AFMD), and intelligent optimization modules to the overall diagnostic performance, a progressive ablation study comprising 5 stages was designed.
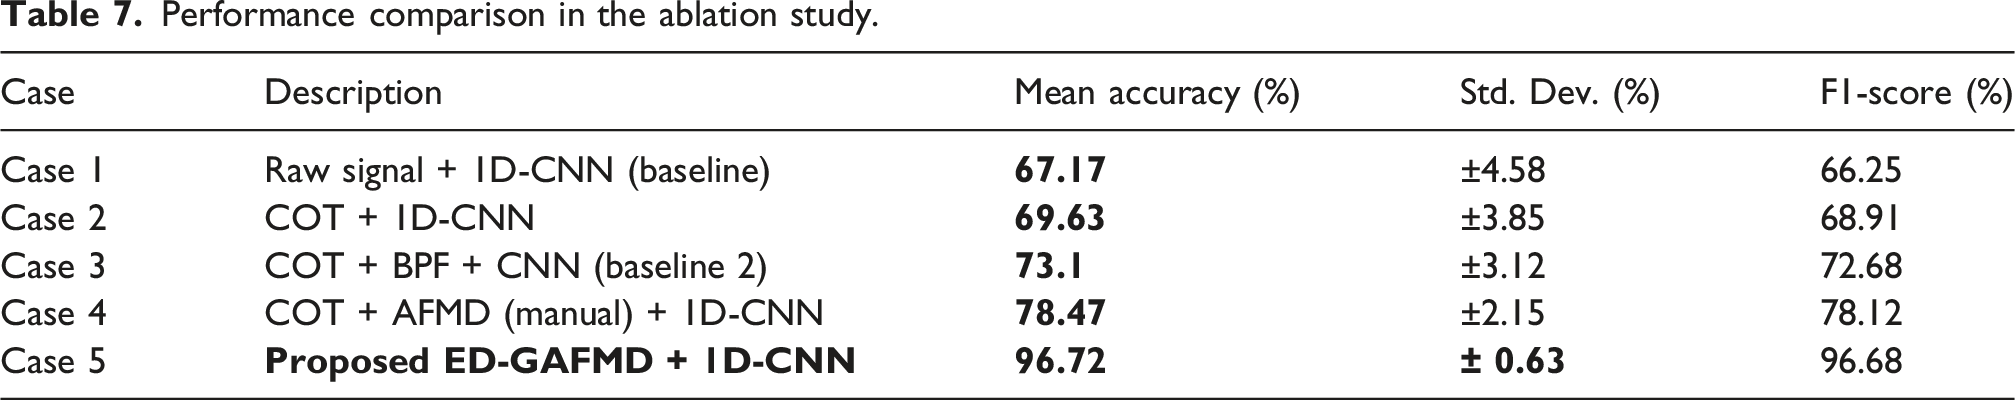
As shown in the bar chart with error bars in Figure 22 and Table 7, the performance exhibits a logical progressive upward trend. Case 3 (simple bandpass filtering) improves accuracy compared to Case 2, but restricted by a fixed frequency band, it cannot adaptively strip overlapping noise. Although Case 4 introduces AFMD signal decomposition, it is limited by manual parameter settings, leaving its error bar relatively wide (Std. Dev. = ±2.15%). The proposed method (Case 5), by introducing GWO intelligent closed-loop optimization, achieves the highest mean accuracy (96.72%) and F1-Score (96.68%), while the error bars at the top of the columns are extremely converged (only ±0.63%). This ablation result overwhelmingly proves that advanced signal decomposition and intelligent parameter optimization are both indispensable, jointly forging extremely high model stability. Performance comparison of different ablation models. Performance comparison in the ablation study.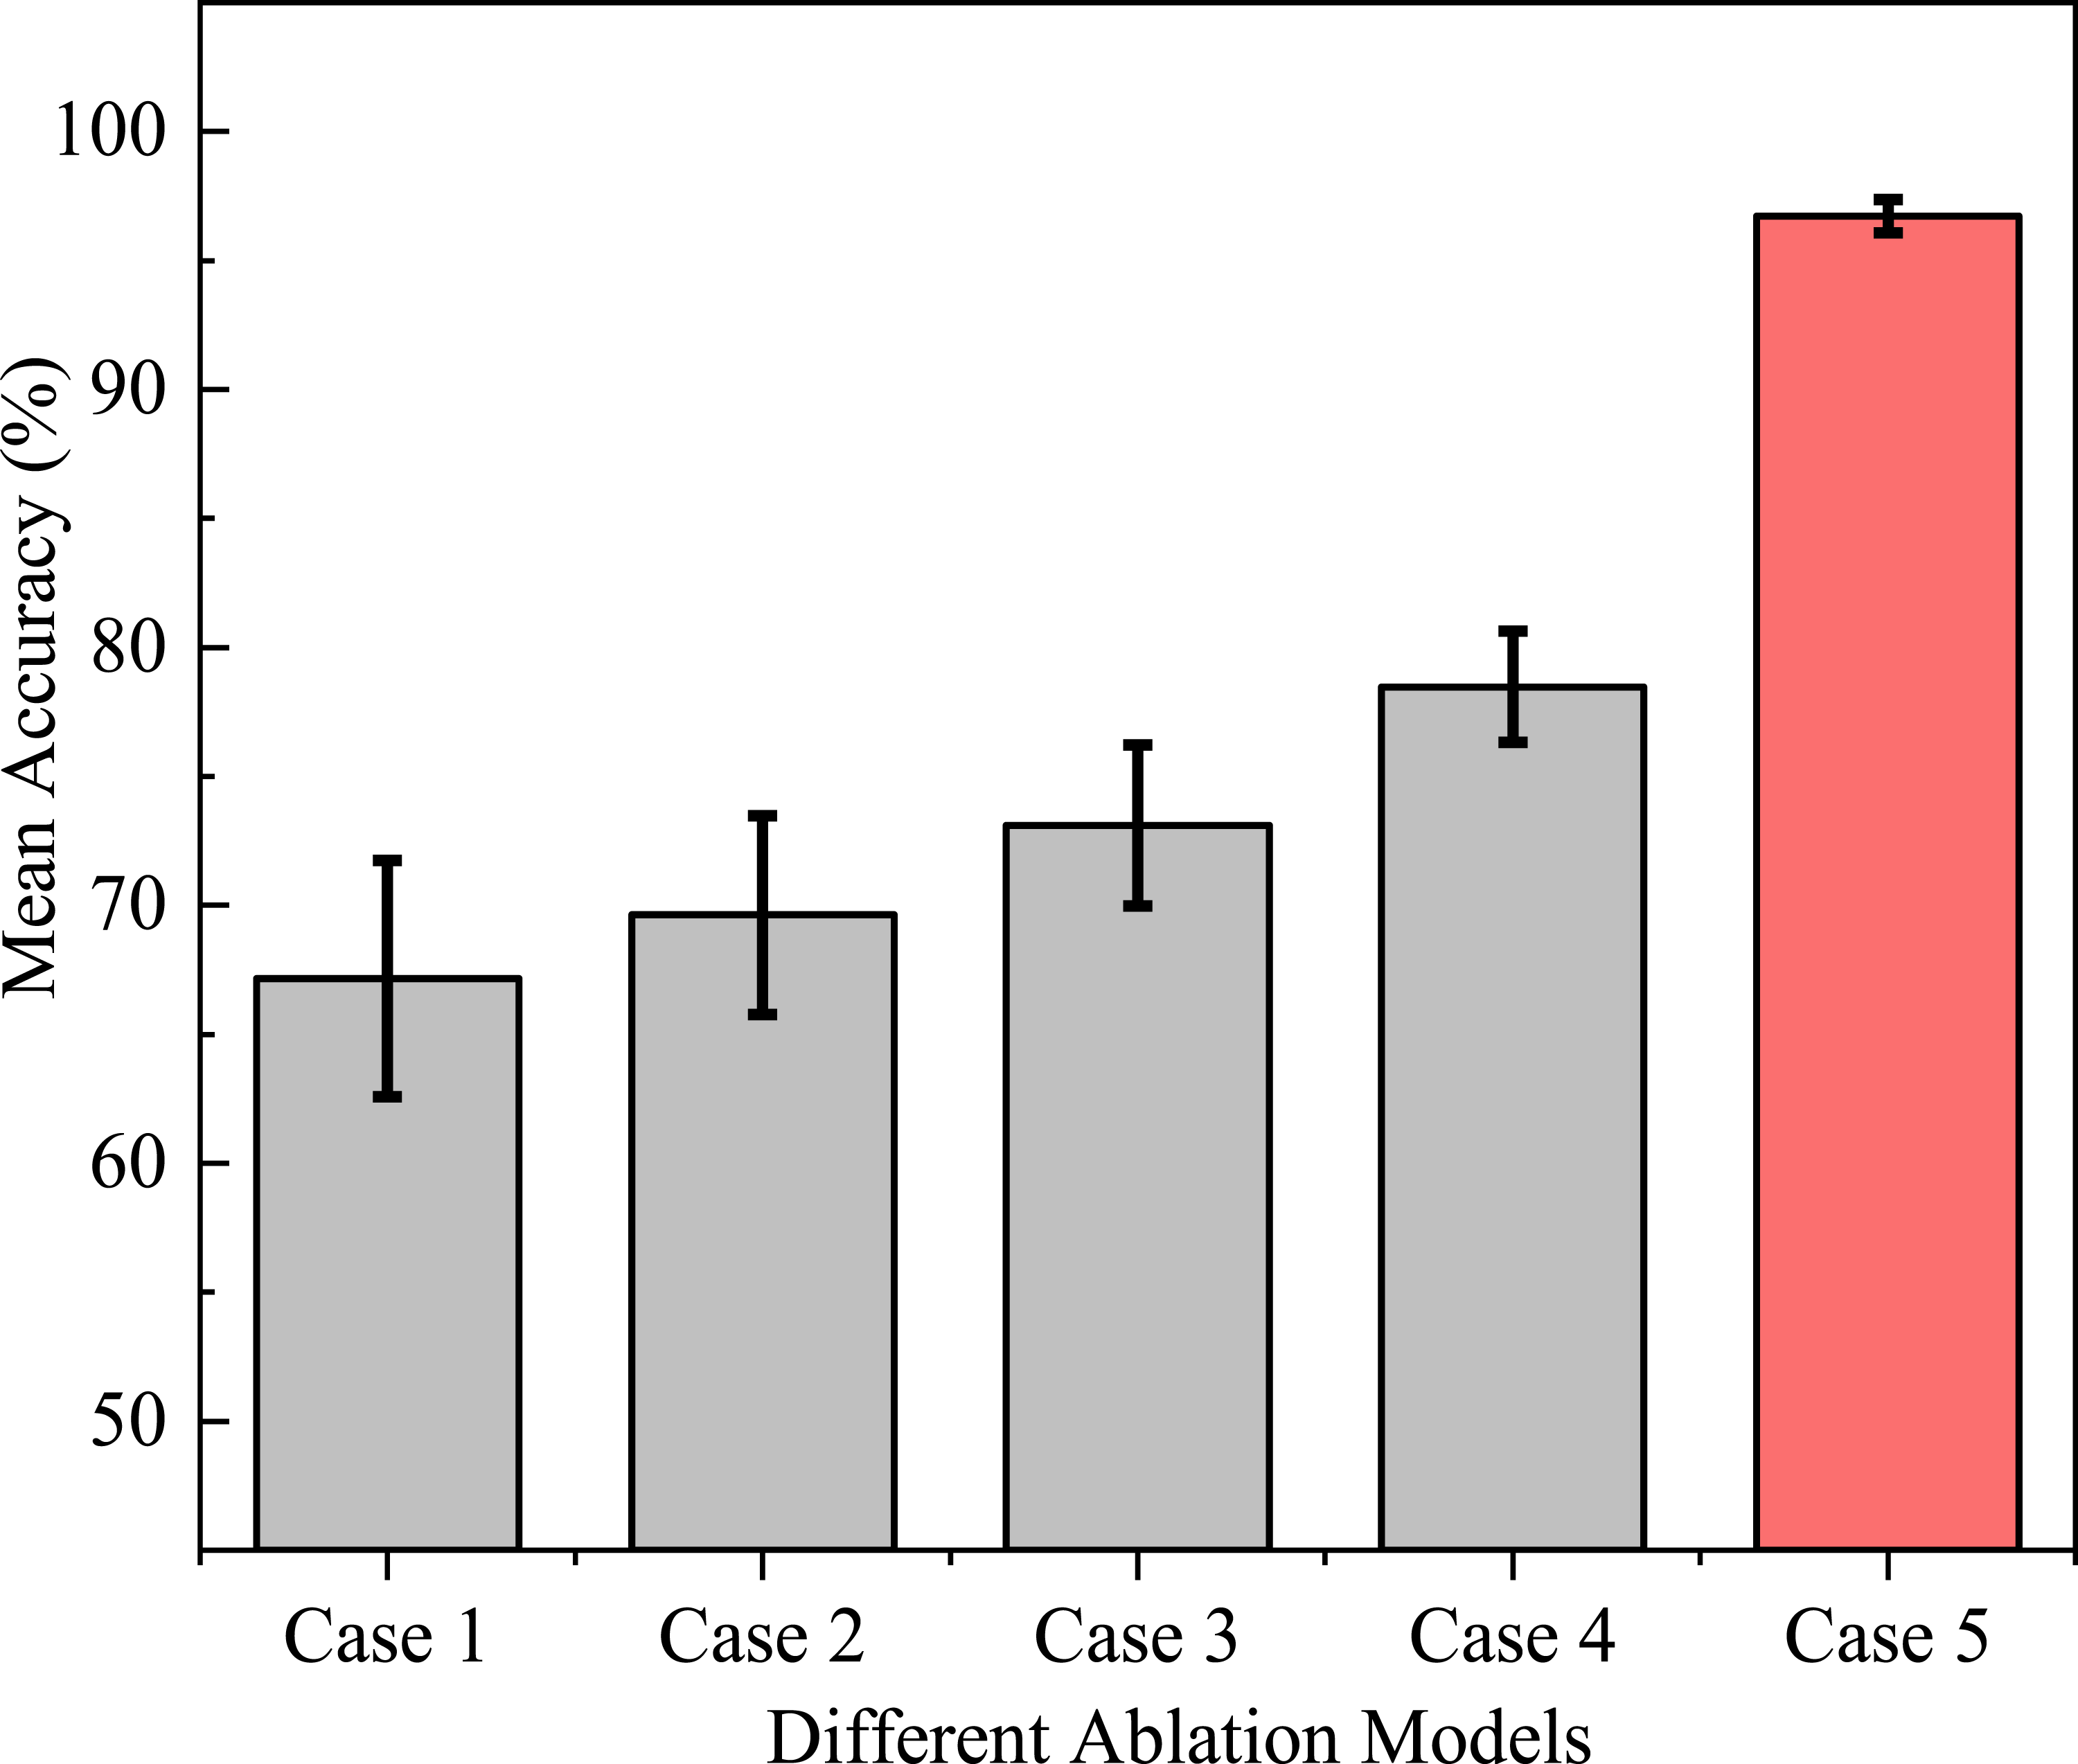
4.4.3. Feature extraction layer ablation and computational complexity analysis
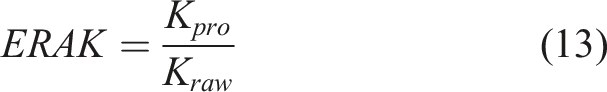
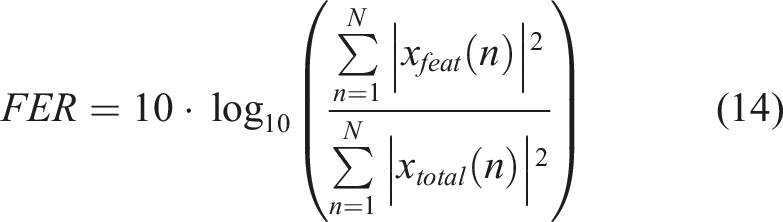
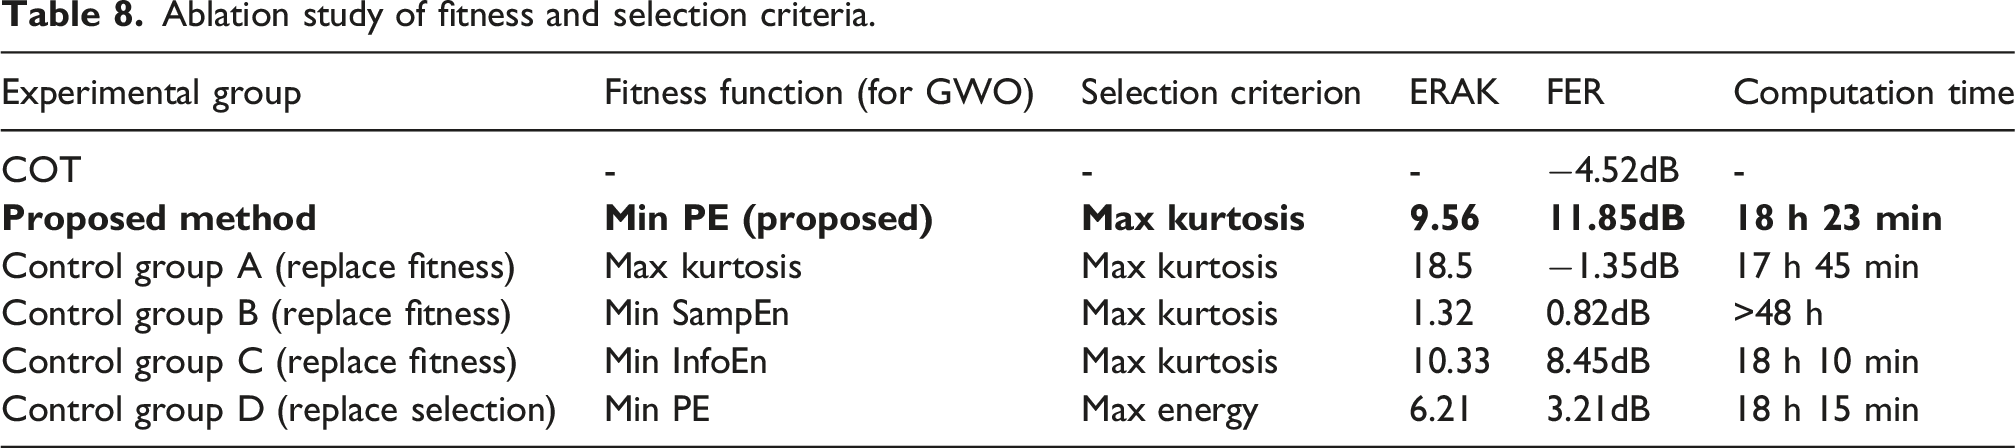
To further dissect the internal mechanisms of the proposed method, this section evaluates the “fitness function” and “selection criterion” using a dual-metric system. Inspired by the standard quantitative indicators widely established in rotating machinery diagnostics (Antoni, 2006; Smith and Randall, 2015), the Angular Kurtosis Enhancement Ratio (ERAK) and Feature Energy Ratio (FER) are defined to quantify the feature enhancement and noise suppression capabilities, respectively: (1) ERAK: Measures the enhancement of impulsive fault features, calculated as (2) FER: Evaluates the energy proportion of the extracted components relative to the total signal energy in decibels (dB):
Under this evaluation framework, commonly used complexity metrics, including Sample Entropy (SampEn) (Li et al., 2025) and Information Entropy (InfoEn) (Expert Systems with Applications, 2024), are selected as alternative fitness functions for a comprehensive ablation analysis.
Ablation study of fitness and selection criteria.
4.4.4. Optimization algorithms comparison and statistical significance tests
Finally, to rigorously demonstrate the superiority of the GWO algorithm and the statistical significance of the overall performance enhancement, several state-of-the-art swarm intelligence algorithms are selected as baselines for an in-depth comparative analysis. These include the Sparrow Search Algorithm (SSA) (Electrochimica Acta, 2024), Dung Beetle Optimizer (DBO) (He et al., 2024), and Whale Optimization Algorithm (WOA) (Nadimi-Shahraki et al., 2023).
Performance comparison of optimization algorithms.
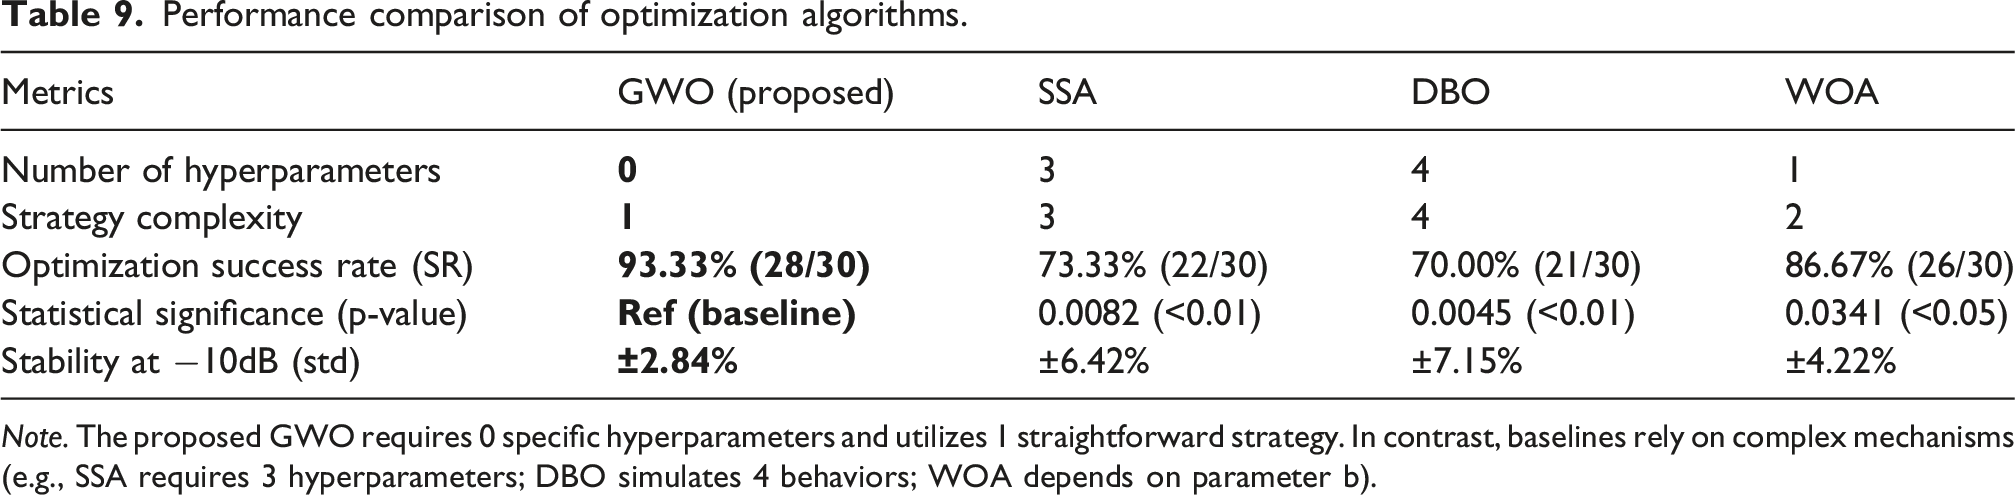
Note. The proposed GWO requires 0 specific hyperparameters and utilizes 1 straightforward strategy. In contrast, baselines rely on complex mechanisms (e.g., SSA requires 3 hyperparameters; DBO simulates 4 behaviors; WOA depends on parameter b).
5. Conclusions
This paper proposes a parameter-adaptive ED-GAFMD method, validated by the Ottawa variable-speed dataset. The main contributions and conclusions are as follows: (1) Superior adaptability to time-varying conditions. By combining angular resampling with a “coarse-to-fine” cascade strategy, the method addresses frequency blurring and energy leakage, achieving signal stationarization. Experiments confirm stable feature extraction under coupled strong noise and rapid speed fluctuations, effectively overcoming the limitations of traditional methods in non-stationary conditions. (2) Precise enhancement of weak fault features. Addressing incomplete filtering in AFMD and limited decomposition in GWO-VMD/FMD, ED-GAFMD employs a refined optimization strategy. It effectively suppresses broadband noise while maximally preserving fault impulses. The resulting envelope order spectra display distinct target fault orders and harmonics with significantly reduced spurious interference. (3) Intelligent parameter optimization mechanism. A PE-based GWO loop is established to adaptively optimize the mode number (n), filter number (K), and length (L). This mechanism automatically adjusts the filtering structure according to signal physics (e.g., impulse bandwidth and noise level), ensuring robustness and stability in dynamic environments. (4) Experimental results across varying noise levels (−2 to −10dB) demonstrate that ED-GAFMD effectively improves feature separability. Specifically, a lightweight 1D-CNN classifier achieves an average accuracy of 96.52%, peaking at 99.72% (−2dB) and maintaining 91.46% under severe noise (−10dB). This confirms the proposed method’s reliability for fault diagnosis in complex industrial environments.
These results indicate that the proposed method has strong potential for practical deployment in real-world industrial systems, such as wind turbines, railway equipment, and rotating machinery operating under variable-speed conditions.
However, despite its robust performance under strong noise, this study has limitations. First, although the PE-driven optimization is executed offline without affecting the rapid online diagnosis, it remains computationally intensive for massive datasets; future work will explore lighter fitness indicators. More importantly, beyond the Ottawa dataset, the framework’s transferability to more complex equipment—such as planetary gearboxes under multi-fault conditions—requires further verification.
Footnotes
Funding
The authors disclosed receipt of the following financial support for the research, authorship, and/or publication of this article: This work was supported by the National Natural Science Foundation of China (Grant No. 62241307) and the Lanzhou Science and Technology Support Program (Grant No. 2024-3-47).
Declaration of conflicting interests
The authors declared no potential conflicts of interest with respect to the research, authorship, and/or publication of this article.