






Abstract
Reliable fault diagnosis in rotating machinery demands accurate prediction of their condition before failure occurs. Model-based diagnosis of faults in rotating machinery is an effective method to overcome the high cost of experimental investigation. This work develops and validates experimentally two complementary dynamic models of a coupled bearing–gear pair transmission system: a 15-degrees-of-freedom physics-based model formulated in MATLAB/Simulink, which captures nonlinear bearing contact and time-varying gear mesh stiffness, and a high-fidelity CAD-based multi-body model built in MSC ADAMS to closely replicate the physical configuration. Defects are intentionally introduced into the bearing subsystem in both simulations and a machine-fault simulator. Responses of the systems acquired in the load zone are processed using short-time synchronous averaging (related to fault characteristics time) to suppress non-synchronous disturbances (not related to faulty conditions), followed by envelope analysis to extract bearing characteristic frequencies. A comparative evaluation (qualitative and quantitative) across different faulty conditions of the system’s bearing demonstrates strong agreement between the simulated and experimental fault signatures. The study confirms that both models serve as effective virtual platforms, significantly reducing reliance on time-consuming, costly experimental campaigns and enabling the scalable development of condition-monitoring strategies for rotating machinery.
1. Introduction
Incipient fault detection of machine components is essential for preventing machinery failure. Investigation of bearing characteristic frequencies (BCFs) in the response spectra is crucial for identifying defects in ball bearings. In most applications, structural vibration and external disturbances contaminate the mechanical system’s response, and several signal-processing stages are used to eliminate them. Subsequently, post-processing techniques are employed to identify fault-related frequencies. Advanced signal processing methods such as spectral kurtosis (Antoni, 2007), SKRgram-based demodulation (Wang et al., 2016), angle/time synchronous averaging (Mishra et al., 2016; Sharma and Parey, 2016), wavelet de-noising (Mishra et al., 2017a), time–frequency decomposition techniques including variational mode decomposition (Jiang et al., 2018; Li et al., 2017; Ni et al., 2022), adaptive dynamic mode decomposition (Ma et al., 2022), etc., have significantly improved defect detectability under different operating conditions. However, many of these approaches rely heavily on experimentally acquired signals, whereas physics-based modelling studies have attempted to provide deeper insight into the underlying vibration mechanisms (Sassi et al., 2007; Govardhan and Choudhury, 2021).
Early foundational frameworks for the development of rolling element bearing models by Harris and Kotzalas (2006) and Gupta (1979) are based on Hertzian contact theory, rolling element kinematics, and nonlinear load–displacement relationships, providing the basis for subsequent nonlinear dynamic formulations. Building upon this foundation, several studies have advanced defect-oriented and system-level modelling approaches in recent years. Recent studies have further emphasized the importance of rotor flexibility and nonlinear contact forces for accurate vibration prediction (Liu et al., 2022). Qin et al. (2020) proposed an 11-DOF dynamic model incorporating localized surface defects, including ball–cage interactions, to simulate fault-induced vibration responses. Gao et al. (2021) developed a 4-DOF dynamic formulation that captures vibration characteristics arising from multiple raceway defects. Li et al. (2020) investigated the effect of flexible cage dynamics and wear on bearing stability.
Subsequently, Liu et al. (2021) presented a combined acoustic–dynamic model to correlate structural vibration with radiated sound for defective bearings. Houpert et al. (2023) introduced an advanced quasi-static and fully dynamic simulation framework incorporating detailed contact kinematics, lubrication rheology, sliding effects, and cage dynamics for high-fidelity bearing performance prediction. Guo et al. (2026) studied the effect of lubrication on a roller-floating bush-pin (RFBP) structure. Subsequent studies have further advanced bearing modelling, including the development of flexible cage models for variable-speed operation (Ma et al., 2024) and stiffness-based approaches linking subsurface crack evolution to vibration response (Li et al., 2023). Incorporating detailed contact mechanics and defect geometry significantly improves the accurate representation of fault-induced spectral features and their evolution (Cheng et al., 2023; Liu and Shao, 2018). Liu et al. (2025) investigated vibration characteristics of single and dual rotor–bearing–casing systems with localized defects. Shi et al. (2025) developed a stiffness-equivalent dynamic model for cylindrical roller bearings with raceway cracks. Guan et al. (2025) and Li et al. (2025) examined the influence of misalignment and slip on the overall nonlinear bearing dynamics. Peng et al. (2025) further proposed a dynamic model for angular contact ball bearings (ACBBs) with mild outer-race defects by incorporating edge impact and mixed lubrication effects.
In parallel with contributions to developing high-fidelity bearing models, substantial efforts are devoted to developing models of various types of gear pairs. In the mathematical modelling of gear pairs, time-varying mesh stiffness (TVMS) is widely recognized as the primary internal excitation that governs vibration behaviour (Theodossiades and Natsiavas, 2000; Chen and Shao, 2013). Howard et al. (2001) proposed a nonlinear lumped-parameter model of gear pairs that accounts for stiffness variation, transmission error, backlash, and friction to investigate fault-induced dynamic response. Some recent works include the influence of crack parameters on TVMS (Liu et al., 2024) and compound faults (crack and pitting) on overall TVMS (Yang et al., 2024), as well as extensions toward dynamic-model-based RUL prediction (Yu et al., 2024), influence of herringbone tooth profile (Liang et al., 2025), evolving contact characteristics (Zeng et al., 2025), etc. A procedure for the optimal design of a system, including material selection, handling dynamic loads, and energy absorption to reduce noise and vibration, is proposed by Alfouneh and Tong (2016) and Alfouneh and Keshtegar (2023). Improving model fidelity in representing an actual system is another area for exploration (Forghani et al., 2023).
Although several studies have explored gear pair–bearing interaction modelling (Sawalhi and Randall, 2008; Bai et al., 2019; Dai et al., 2023), recent investigations have shown that fault-induced vibration transmission in coupled gear pair–bearing systems is strongly influenced by structural flexibility and interaction dynamics between subsystems (Liu and Yuan, 2021). Moreover, the majority of reported formulations are based on lumped-parameter analytical models, which limit geometric fidelity and the ability to model actual faults. High-fidelity three-dimensional multi-body models capable of incorporating realistic geometric fault morphologies within fully integrated gear pair–bearing systems remain comparatively scarce. Understanding the transmission and interaction of defect-induced excitations across coupled gear pair–bearing subsystems remains a critical challenge for accurate diagnostics.
Most of the existing literature on modelling coupled bearing-gear pairs for bearing fault diagnosis oversimplifies the dynamics of gear pairs and transmission systems. To address these limitations, this study develops and compares two complementary virtual representations of a coupled gear pair–bearing transmission system, including the dynamics of gear pairs, bearings, connecting shafts and the transmission system under a fault scenario. The first is a 15-degrees-of-freedom (15-DOF) physics-based model implemented in MATLAB-Simulink, constructed by coupling the previously reported bearing (Mandal et al., 2026; Mishra et al., 2017b) and gear pair (Kumar et al., 2023) dynamic sub-models, with the addition of a power transmission system. The motor power is transmitted to the gear pairs via a belt drive, and the overall system response with bearing faults is evaluated. Thus, integrating the subsystems reformulates the governing equations of the inner race of the bearing and the pinion of the shaft, and increases the overall system DOF by adding four additional DOFs from shaft dynamics (two each for the bearing and pinion shafts), enabling a fully coupled simulation of gear-pair–bearing interactions within a unified transmission framework. The model incorporates nonlinear bearing contact dynamics and, unlike the reported coupled models, which overly simplify gear-pair interactions and connecting pairs, it considers detailed time-varying bevel gear mesh stiffness, belt-drive transmission, and shaft flexibility within a computationally tractable framework. The second representation is a high-fidelity three-dimensional CAD-based multi-body model developed in MSC ADAMS, enabling realistic geometric fault representation and can be further extended to irregular fault geometries, unlike the planar analytical models. In model development, detailed contact interactions among bearing parts, bevel gears, belt drives, and connecting shafts are considered. The modelling strategies for both models are distinct as they capture the simultaneous interactions between the connecting shaft and inner race of the bearing with fault-induced vibration, and between the pinion shaft and pinion of the gear pair with variable excitation generated by TVMS and belt drives. This enables a realistic representation of the power transfer of the proposed system to the structure.
By facilitating systematic cross-validation between reduced-order physics-based modelling and geometrically detailed multi-body simulation under a unified experimental benchmarking framework, the proposed approach establishes a comprehensive virtual platform for vibration-based fault diagnosis and provides practical insight into selecting appropriate modelling strategies for predictive maintenance applications. The characteristic frequencies of the bearings used in the experiments are near rotor shaft harmonics; therefore, short-time synchronous averaging-based envelope analysis is used as the signal processing tool for interpreting the bearings’ actual condition.
2. Experimental setup
Spectra Quest® machine fault simulator (MFS) is used for experiments and it comprises of several key components: an induction motor (1 HP Marathon three-phase), a VFD, a flexible coupling (connects the rotor of the motor to the driven shaft (3/4” diameter)), two deep groove ball bearings (MB-ER-12K) for supporting the driven shaft, a loader, one single stage bevel gearbox, two bearings (NSK 6202) for supporting the pinion and gear shafts, and, two v-belt drives (Figure 1(a)). Fault simulator: (a) Experimental setup and (b) its equivalent schematic.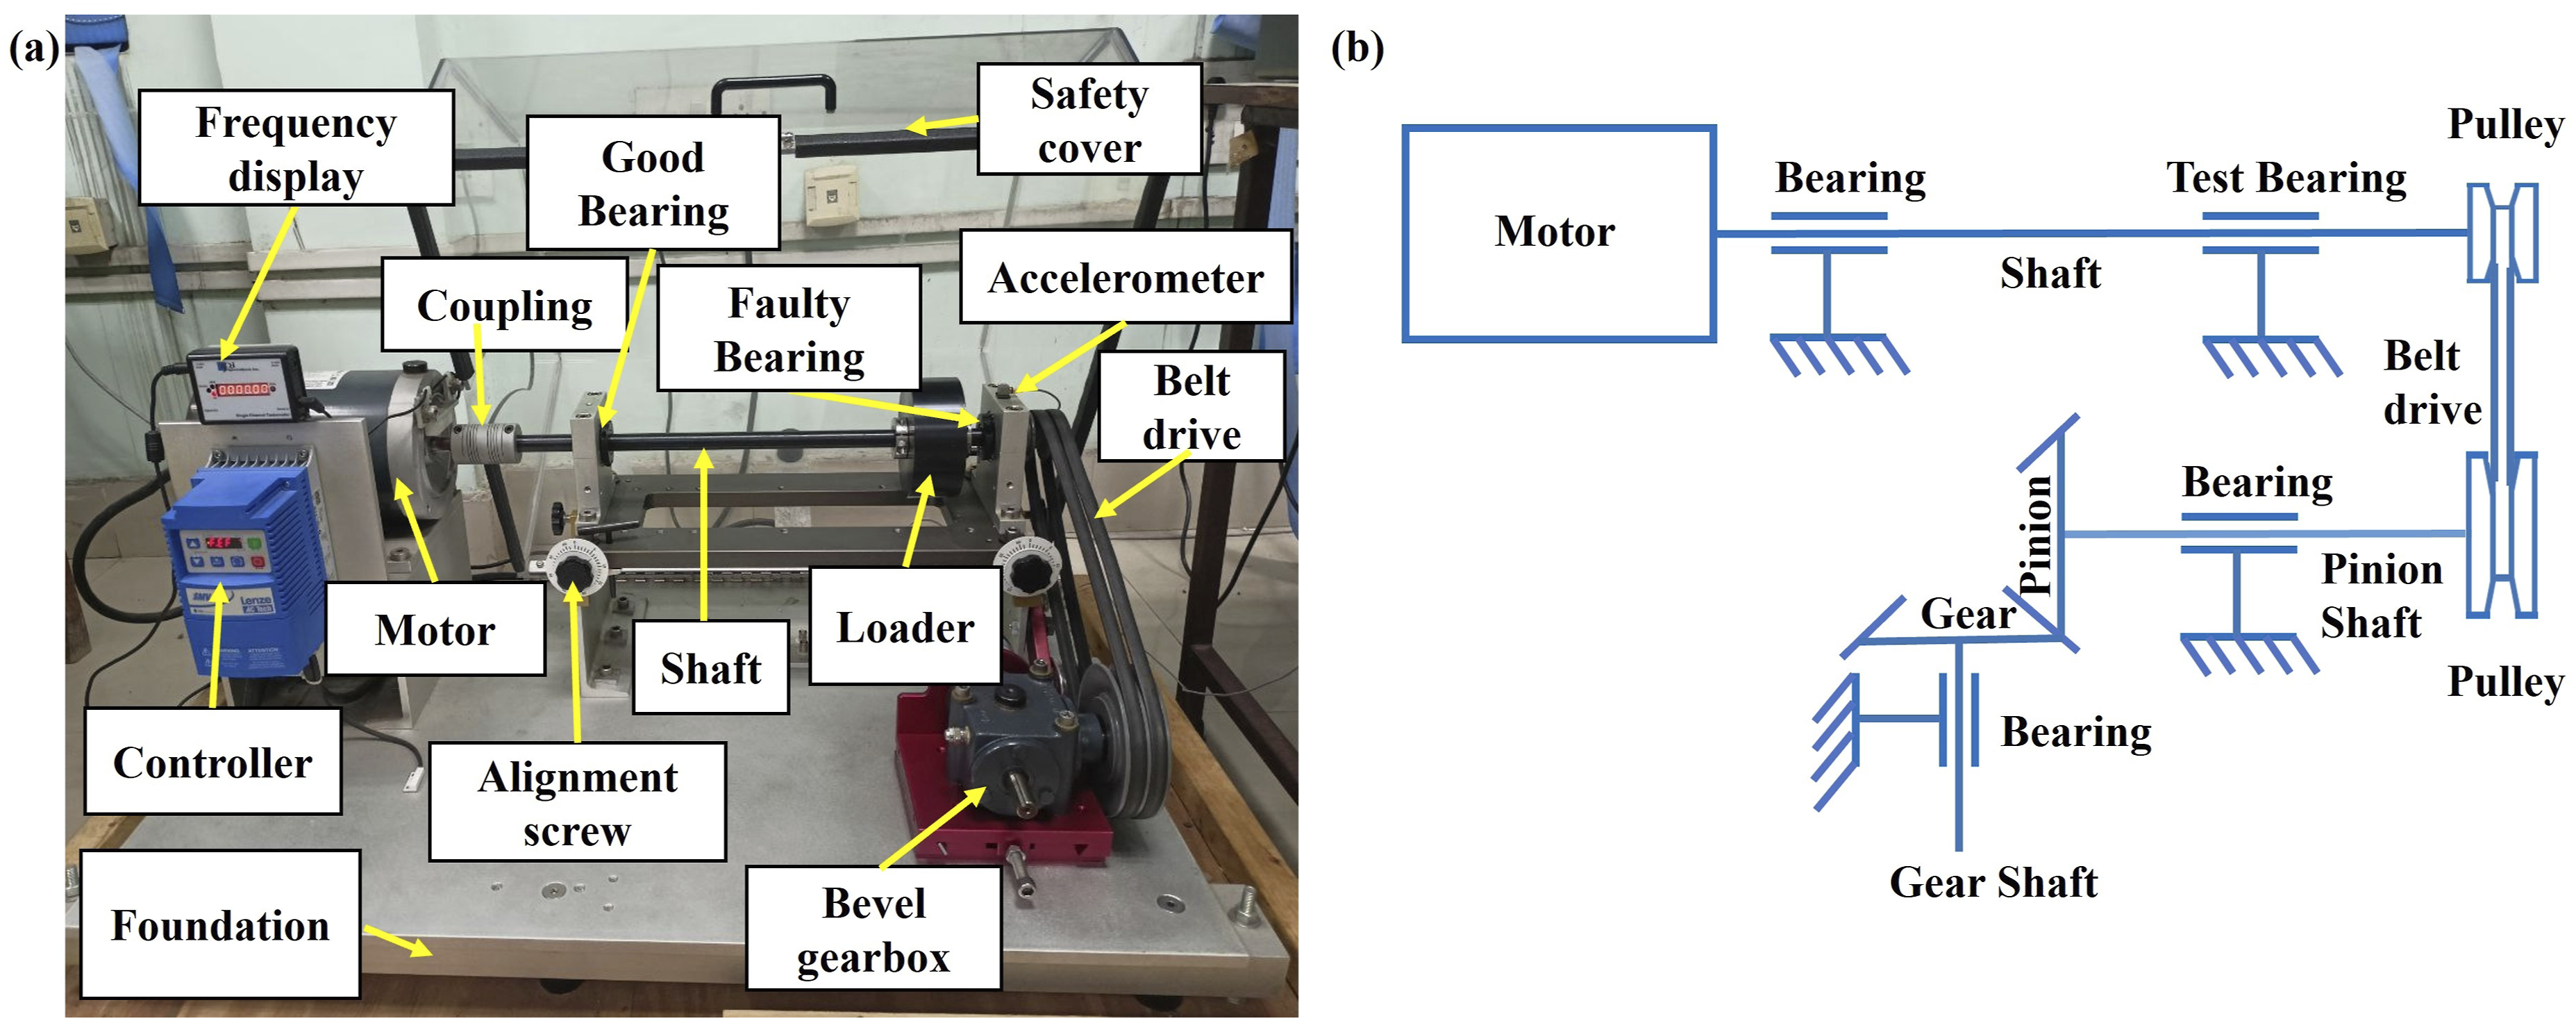
The entire setup is mounted on a specially designed table intended to minimize external disturbances. A healthy and a faulty ball bearing are positioned at the near and far ends of the induction motor. A loader (5 kg) is used to transmit radial force on the system and is positioned near the test bearing. Two pulleys with V-belt drives transfer motion from the motor to the gear system. The MFS system consists of a single-stage bevel gear system with a pinion (18 teeth) and a gear (27 teeth), along with pinion and gear shafts, and two deep groove ball bearings (NSK 6202) as its major components. Brüel & Kjaer make DeltaTron® (Type 4507) accelerometer is used as a transducer for data acquisition. Data is collected over 10 seconds at a sampling rate of 16,384, while the motor shaft rotates at a cyclo-stationary frequency of 15 Hz. Various pre-fabricated faults, such as defects in the inner (IRF) and outer races (ORF) and the ball (BF), are used for experimentation. A data acquisition card (4-channel NI-USB-9234) is used to collect data in the LabVIEW interface, and the data is stored on a computer hard drive for subsequent pre- and post-processing.
3. Models of mechanical systems
3.1. Physics-based 15-DOF model of mechanical system
The 15-DOF mechanical system proposed in this work is a physics-based model and an improved version of earlier reported work (Sawalhi and Randall, 2008; Mishra et al., 2017b; Kumar et al., 2023), in which each component is treated as a separate subsystem. The proposed model is a simplified form of the schematic diagram (Figure 1(b)).
3.1.1. Bearing subsystem of the mechanical system
The bearing subsystem considered in the present work has 7 DOF. In addition to the earlier reported work (Sawalhi and Randall, 2008; Mishra et al., 2017b), where the planar model of ball bearing has 2-DOF each for inner race with driver shaft and outer race and a 1-DOF for the sprung mass (imparting high-frequency structural vibration), the present work considers the driver shaft as a separate entity and considers its translation in a plane. Thus, an additional 2 DOF for the rotor shaft are considered in the model development. This rotor shaft also transfers motion from the motor to the gear system via a belt drive, assuming no slippage. Due to a change in the diameters of the pulleys connected to the rotor and pinion shafts, there is a corresponding change in the speed of the shaft connected to the motor and pinion. In the model development, the inertia of the outer race, inner race and rotor shaft are taken into consideration, whereas the effects due to the cage and ball inertias are neglected. This model assumes constant angular spacing between balls and constant angular speeds of rotation for the cage and the balls. All the principal elements of this bearing model are assumed as a spring-mass-damper system (Figure 2). Hertzian contact (surface contact) theory is used to model contact between the balls and races. Ball bearing sub-model (7-DOF system) of the mechanical system.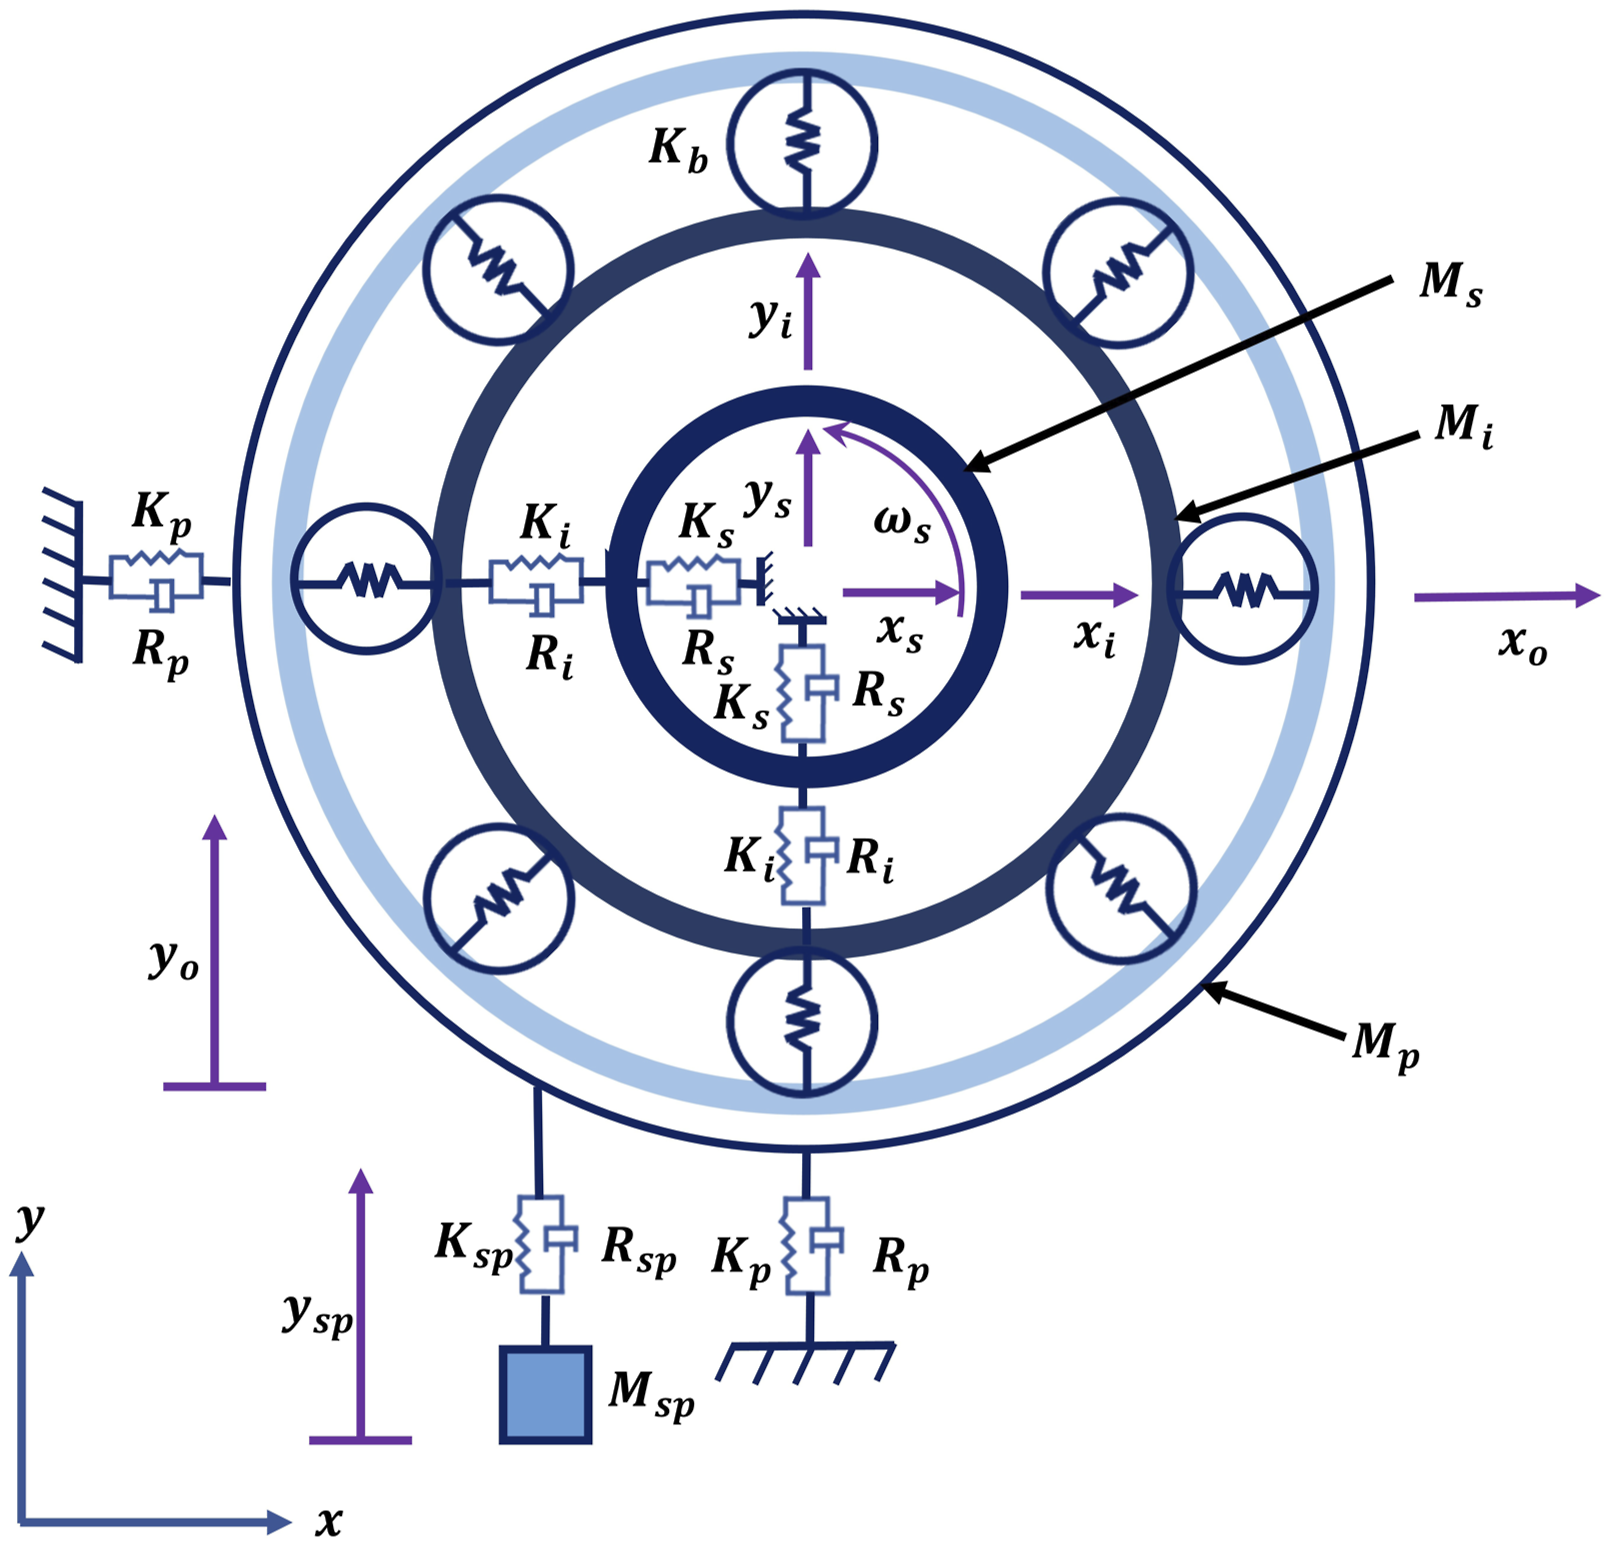
The expression for the angular location of ball i

3.1.1.1. Equations that govern motion
The rotor shaft, inner race and outer race with its foundation/pedestal allow translation in a plane along






The sprung mass attached to the outer race imparts structural vibration. The equation that allows translation of the sprung mass is expressed as:

In these expressions,
3.1.1.2. Contact force modelling
The ball models are assumed to be nonlinear springs, and the contact forces between balls and raceways are calculated by assuming surface contact (Hertzian contact) between the connecting bodies. Thus, the component of contact force (Harris and Kotzalas, 2006) along the horizontal and vertical directions (


The deformation due to contact (

3.1.1.3. Modelling of localized fault in the bearing
This model considers distinct rectangular faults by assuming faults with constant depth (
Model of outer and inner race fault:
This model considers a fixed outer race with housing, whereas the inner race is driven by the connecting driven shaft and moves at the same speed as the driven shaft (no slip). Therefore, the angular location of the fault at the outer race is constant, whereas it is variable with time for the fault at the inner race. The instantaneous angular location of the fault

The faults in outer as well as inner races are modelled as rectangular spalls (Figure 3). When a ball reaches a particular angular location (

and location A ball is about to encounter a defect: on the (a) outer and (b) inner races.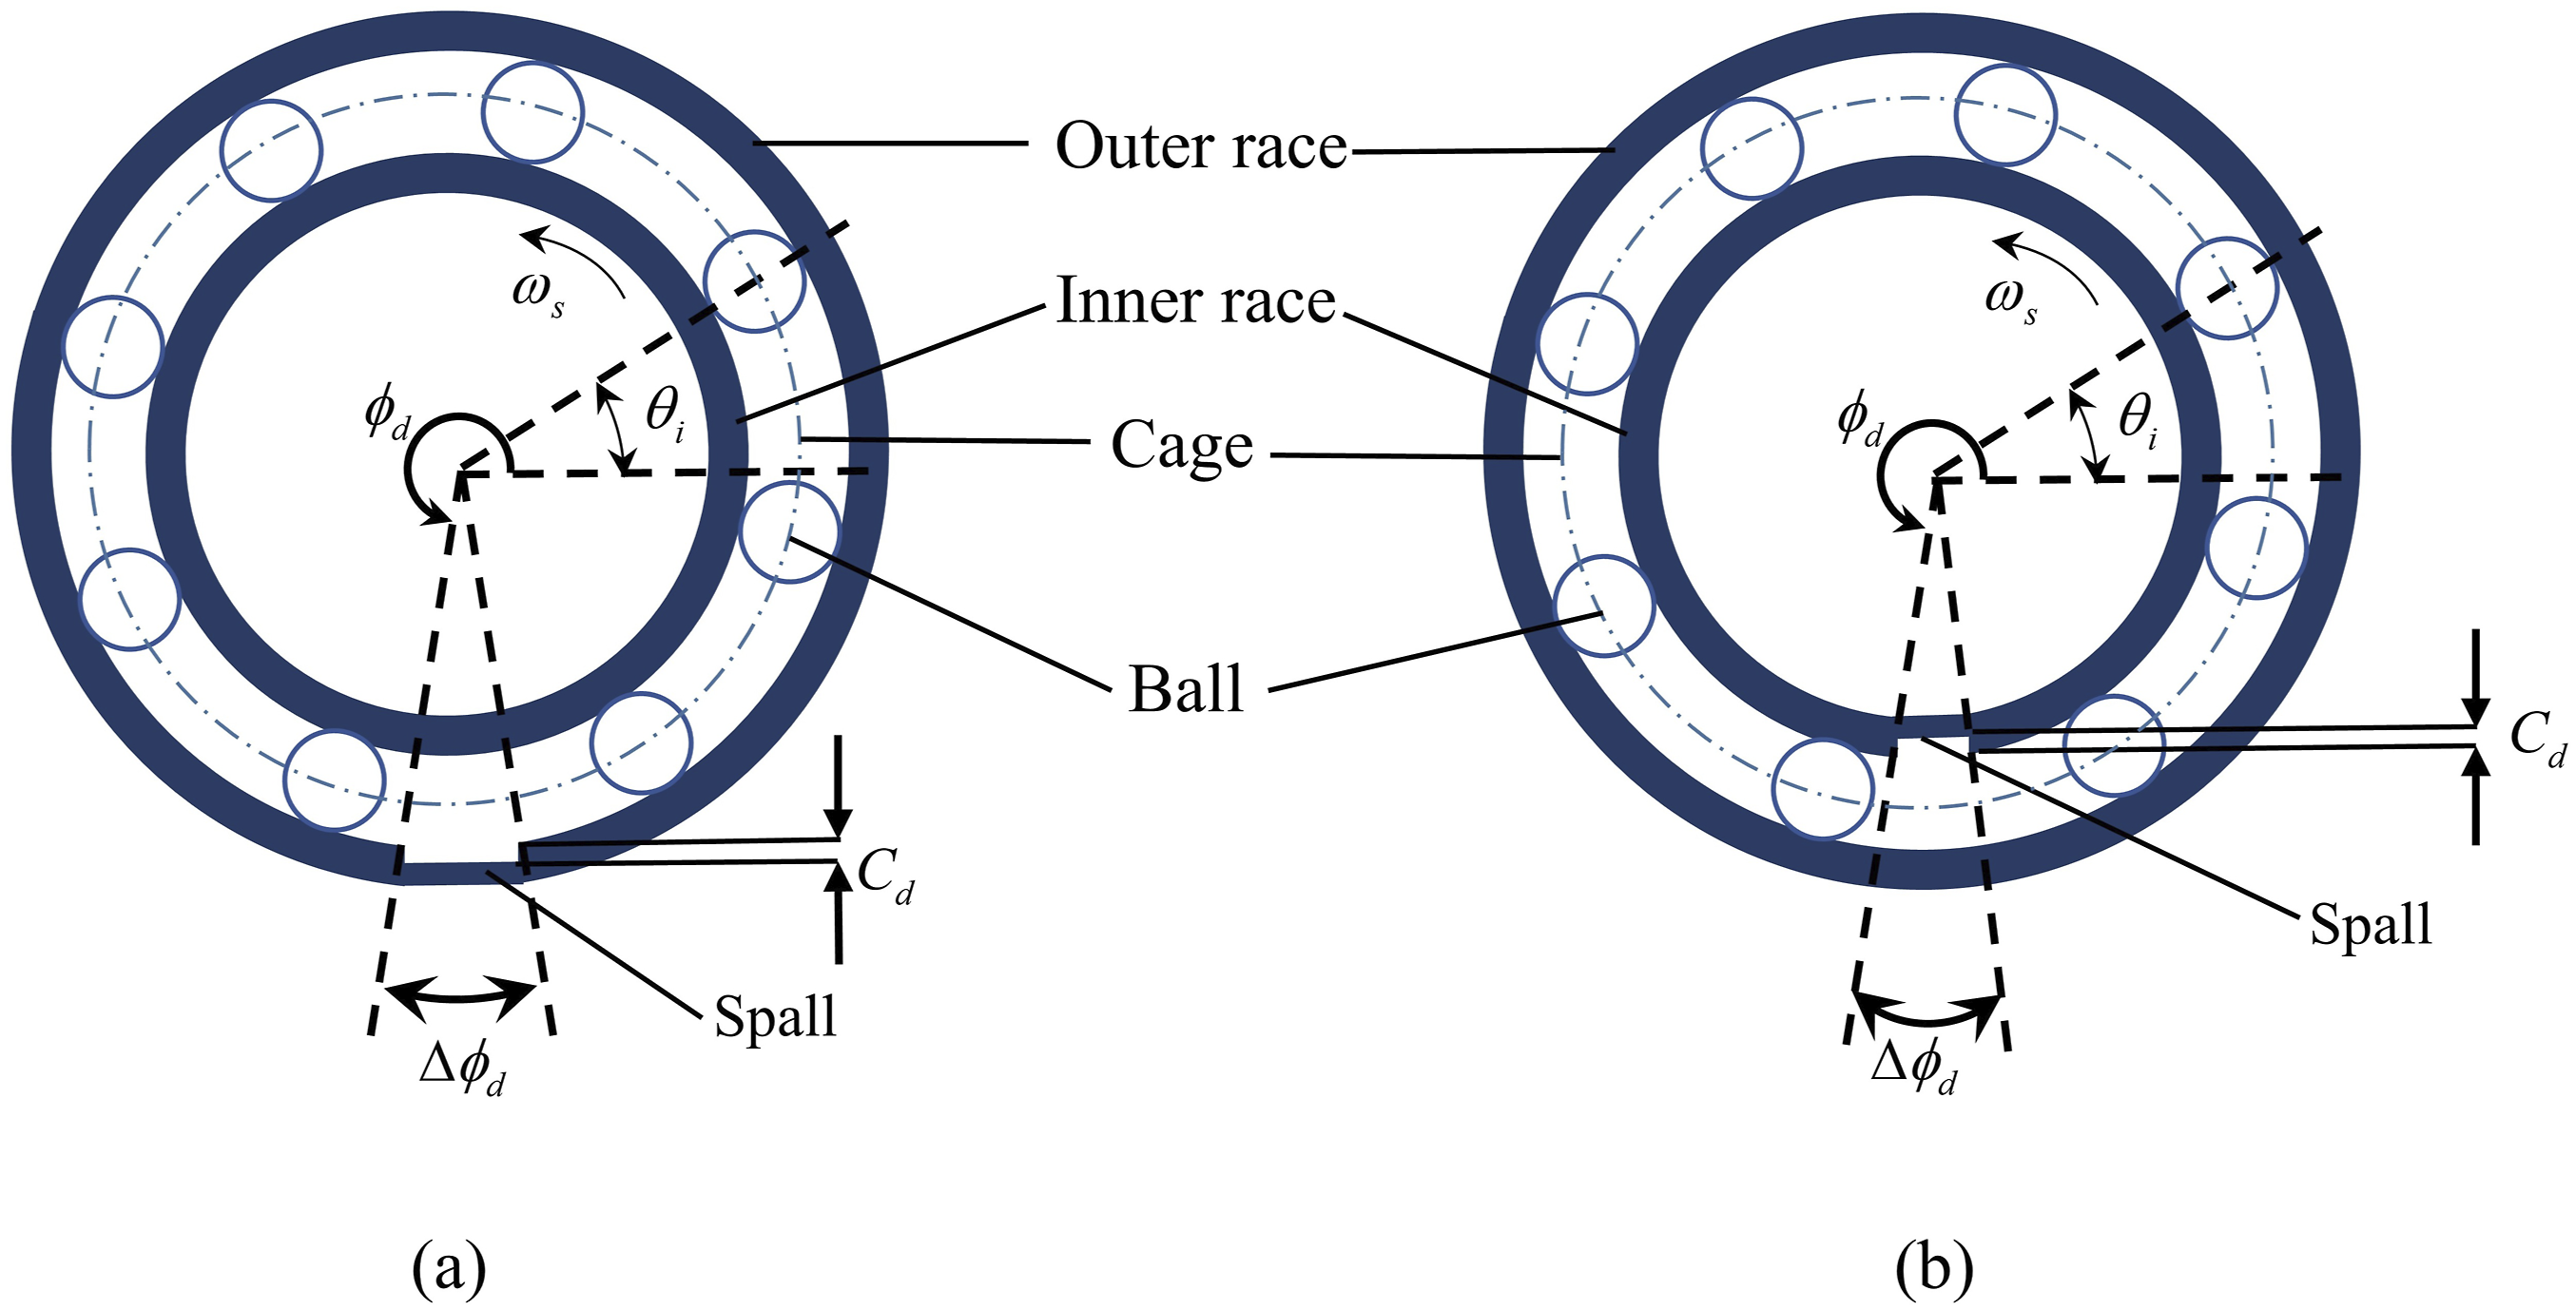
Model of ball fault:
Balls rotate opposite to the direction of the inner race rotation, and their angular speed is calculated by using the kinematic formulation. A spall in one ball is considered a ball fault. During modelling, it is assumed that the ball with spall rotates with the same angular speed as the other balls. The location of spall (in terms of angle) as a function of time and initial angular location

The angular width of faults ( Width of spall (angular) as a function of parameters of inner and outer races.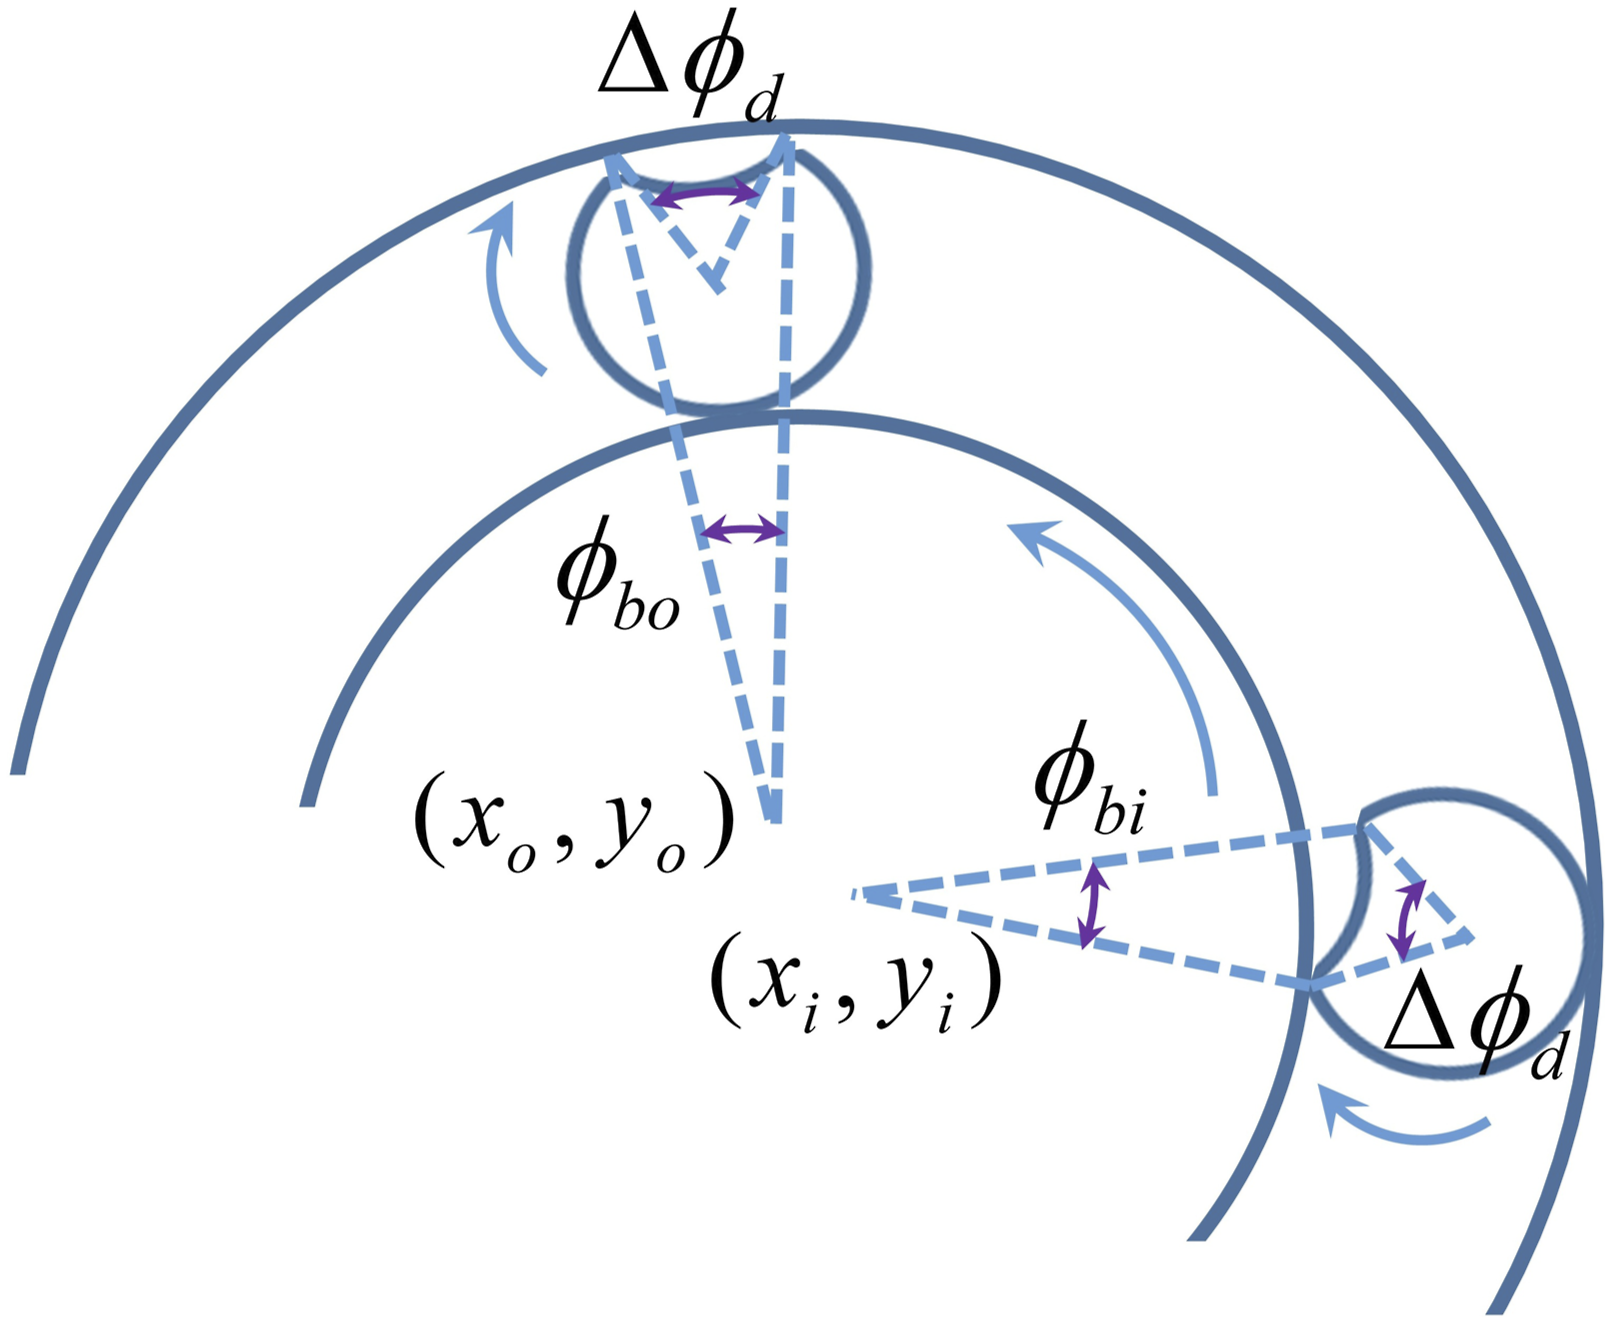


During a complete rotation of a faulty ball, contact is lost twice with the races: once when the fault passes the inner race and the other when the fault passes the outer race. Because the races (outer and inner) have distinct curvatures, the two contact losses exhibit different angular fault widths.
Thus, the spall depth (

Considering

3.1.1.4. Integrated sub-model of the bearing
The Simulink block diagram of the ball bearing is shown in Figure 5. This subsystem is further integrated into the gear subsystem to form the proposed mechanical system. Simulink block diagram of bearing (7-DOF) subsystem.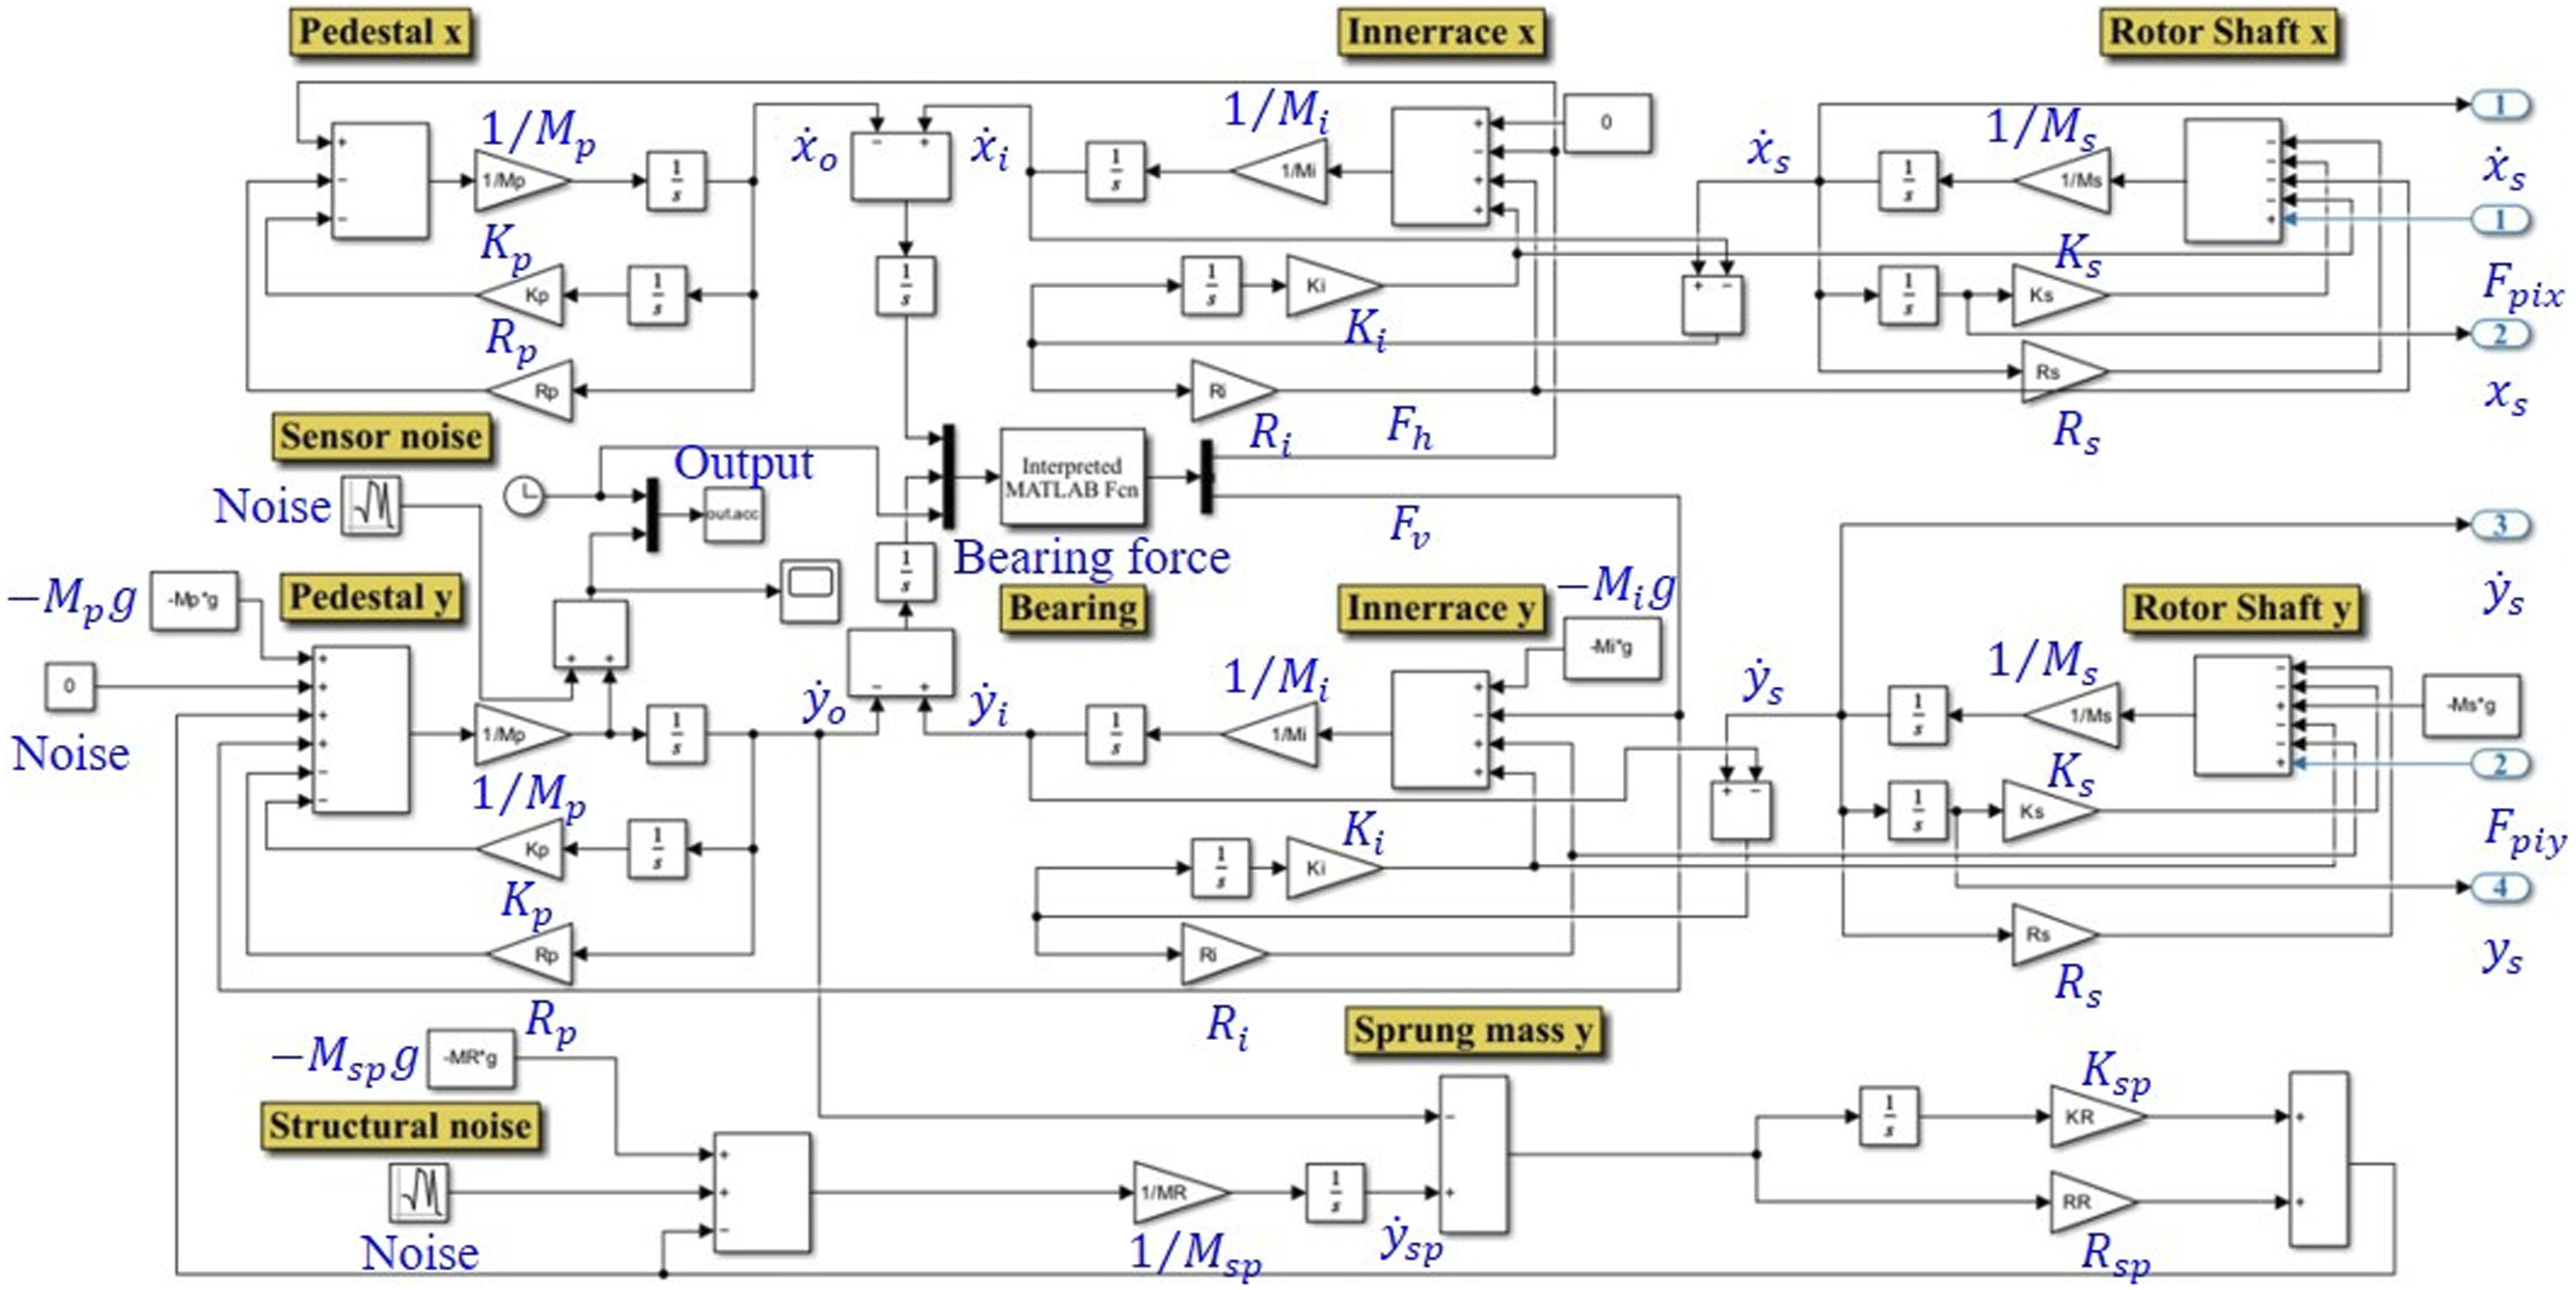
3.1.2. Gear subsystem of the mechanical system
3.1.2.1. Governing equations of motion
The mechanical system for this analysis has a bevel gear subsystem. Power from the motor is transferred to the pinion shaft of the bevel gear pair with the help of belt pulley arrangements. During model development, it is considered that the pinion of the bevel gear system rotates at the same speed as the pinion shaft (no slip). The bevel gear subsystem (Figure 6(a)) is modelled as an 8-DOF system, consisting of a pinion and a gear, each with 3-DOF (one rotational and two translational), and an additional 2-DOF for the pinion shaft. Assuming both the pinion and gear as the spring-mass-damper system, mass, stiffness and damping for the pinion and gear in the bevel gear subsystem are represented by Single-stage bevel gear system: (a) schematic and (b) 8-DOF spring mass damper system.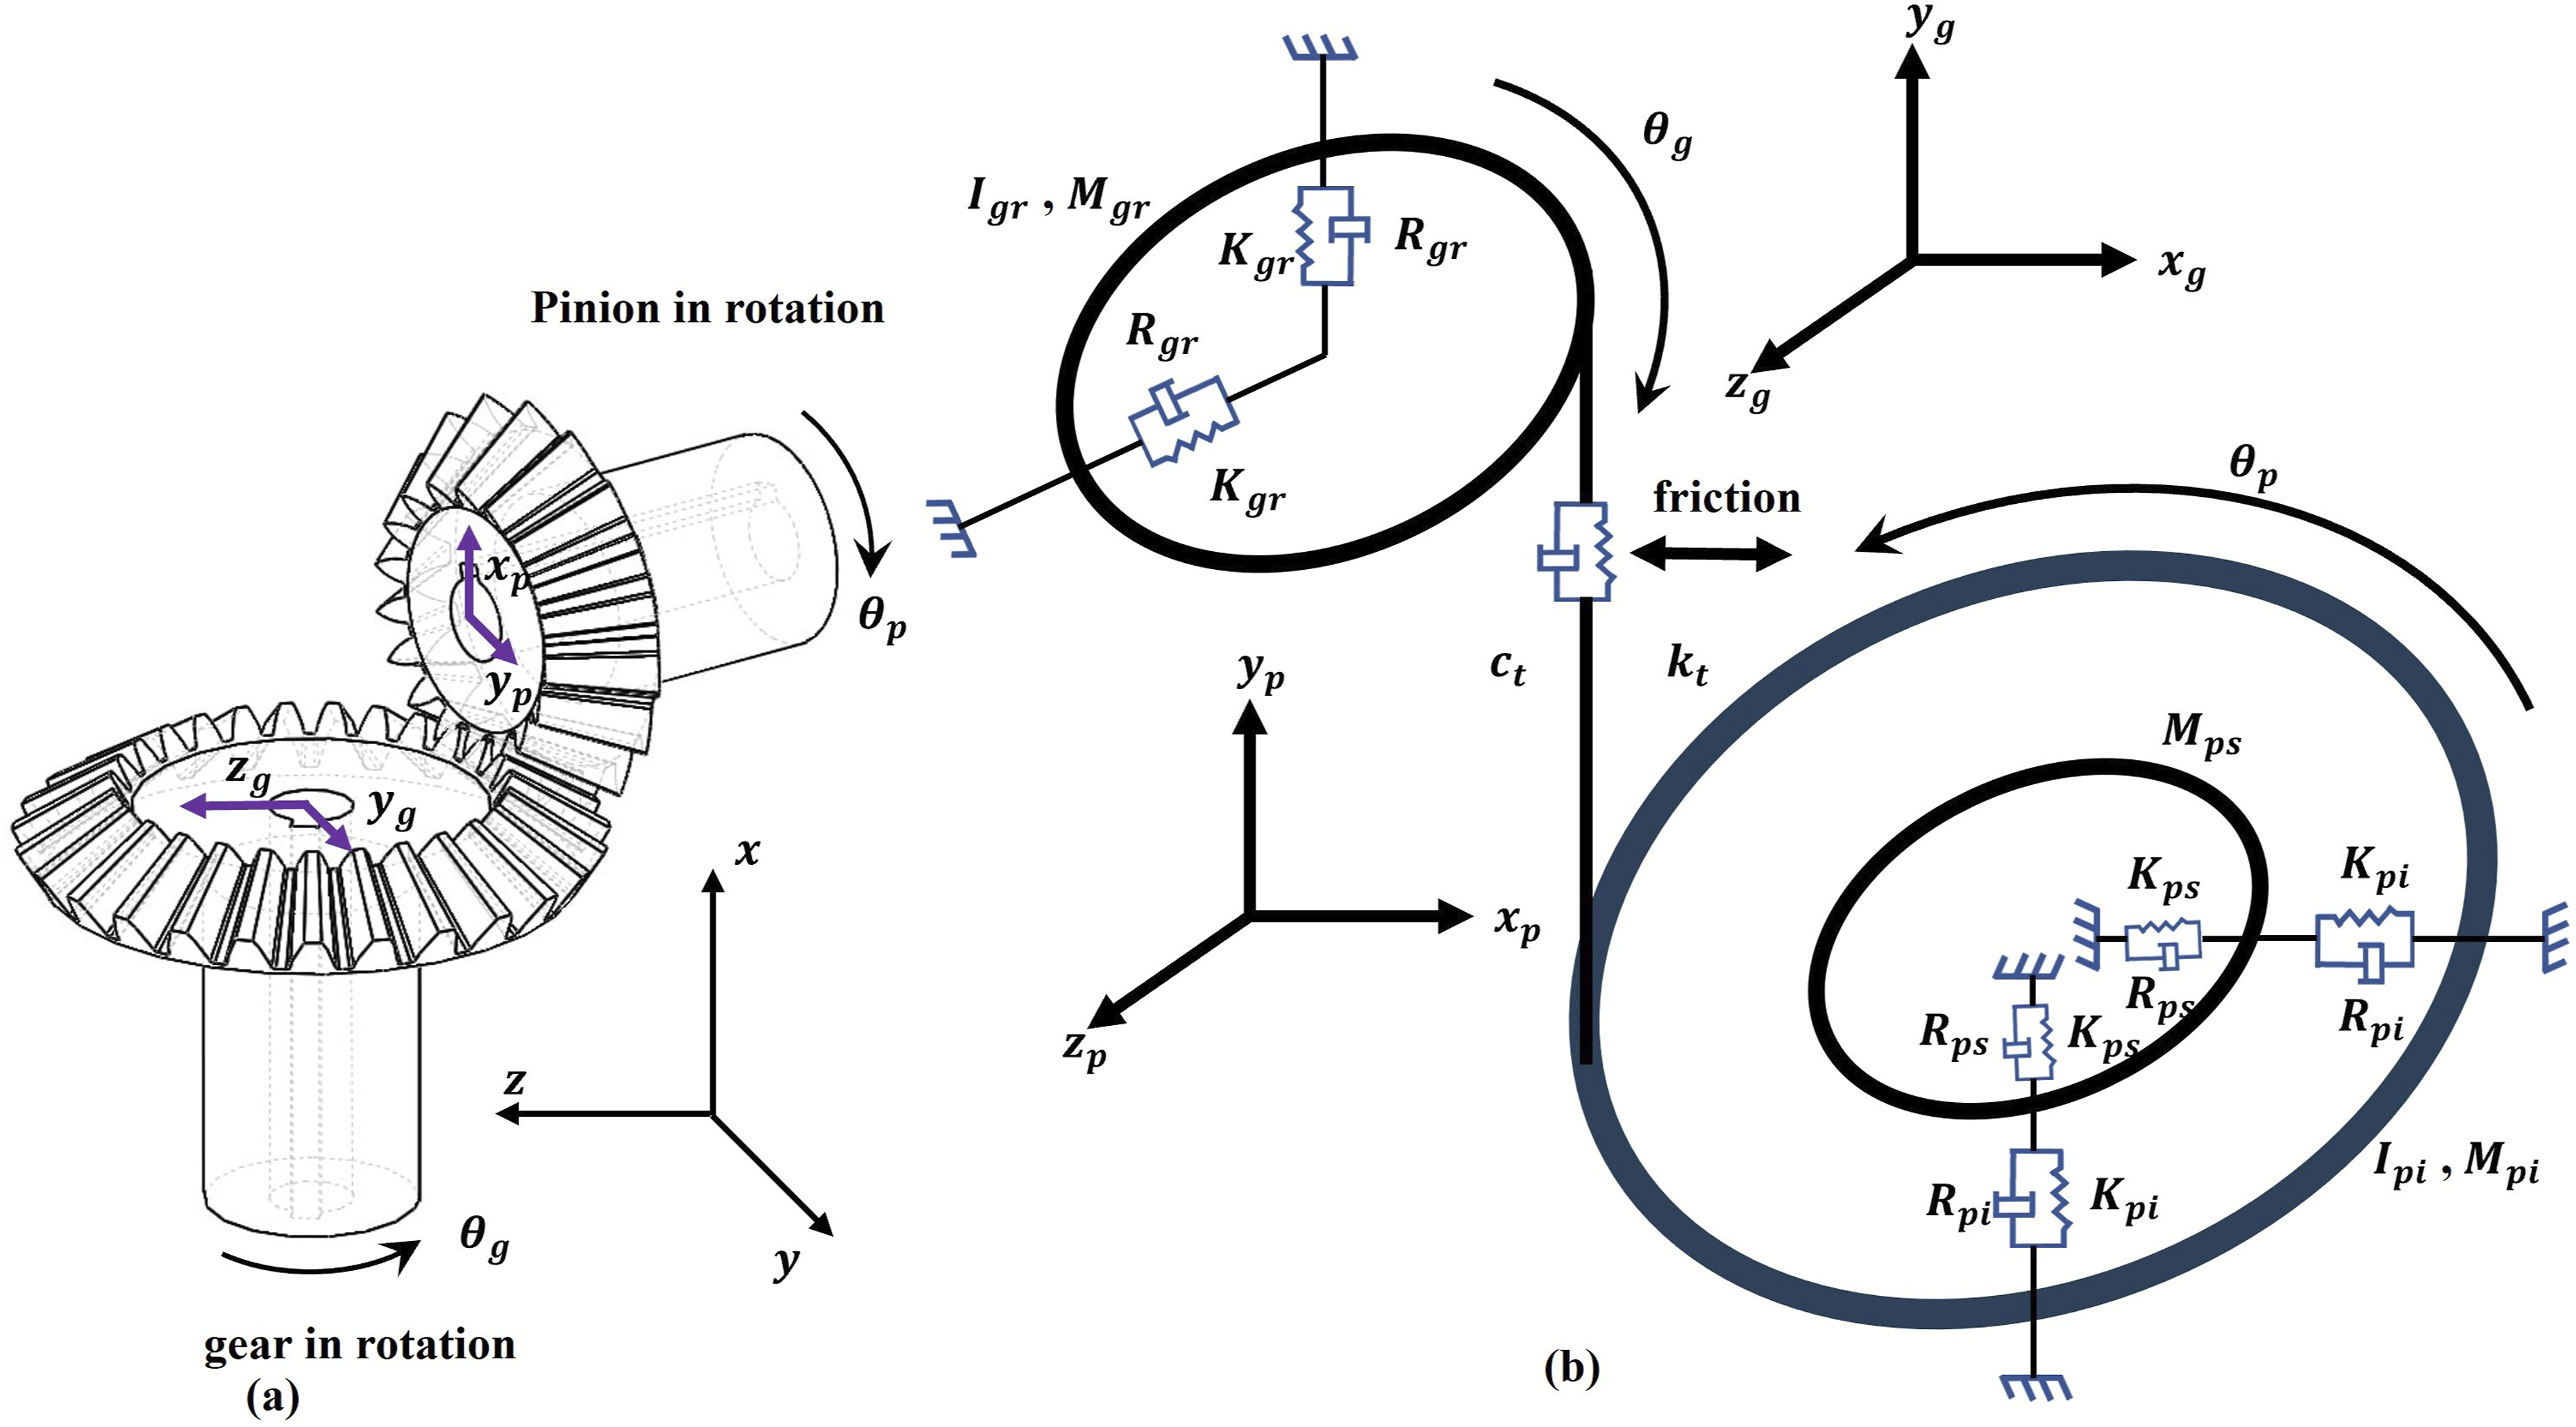








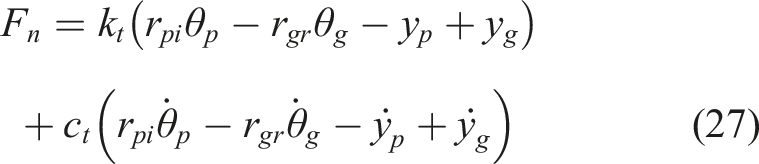
The other variables used in equations (19)–(27) are defined as follows:
3.1.2.2. TVMS of contact teeth
The dynamic characteristics of the gear pairs are significantly influenced by the TVMS. Bevel gears have more complex tooth geometries than spur gears, which pose a challenge for estimating variations in their contact-mesh stiffness over time. To address this challenge, this study employs the “Tredgold approximation (Elkholy et al., 1998)” for estimating the time-varying stiffness. This approximation is based on the assumption that the profile of the teeth on the back-cone of a bevel gear is similar to a spur gear, particularly when the pitch radius is determined at the larger heel. The bevel gear is conceptualized as a collection of virtual spur gears that are obtained by slicing it with a finite number of slicing planes. The alignment of these slicing planes parallels the plane of projection. Each slice of the bevel gear is treated as an independent spur gear and possesses the same number of teeth with the same tooth width. The tooth width of a single virtual gear (Lafi et al., 2021) may be computed as Virtual spur gear tooth geometry. Coefficients (in equation (33)) used to calculate the fillet foundation stiffness (Kumar et al., 2023).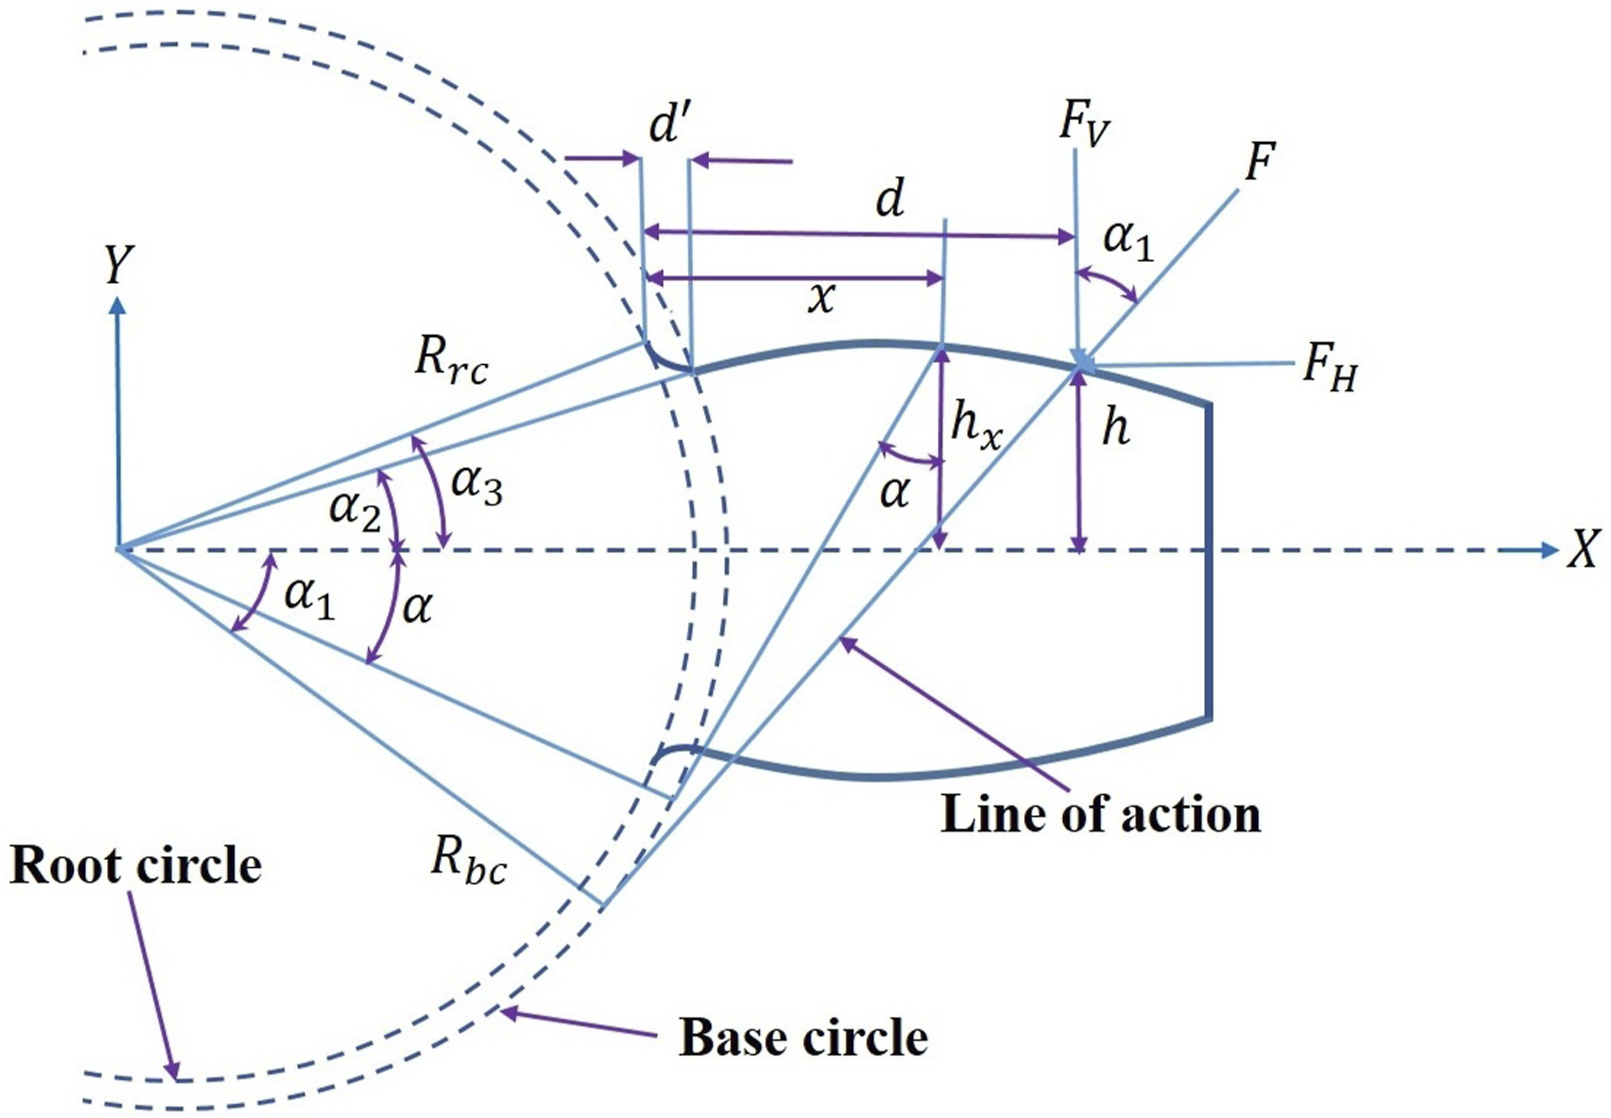


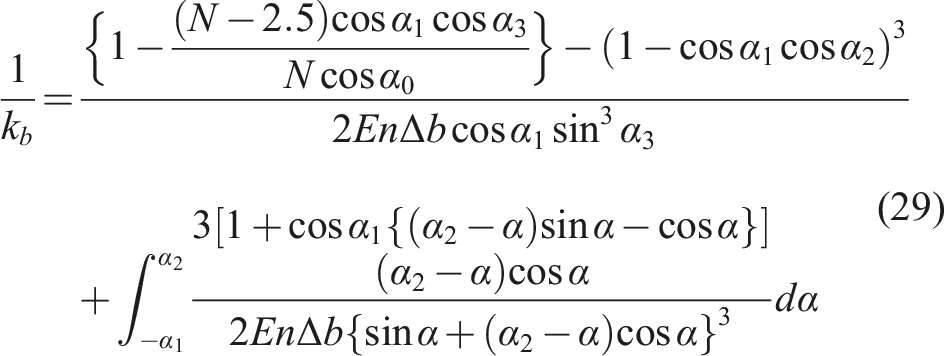
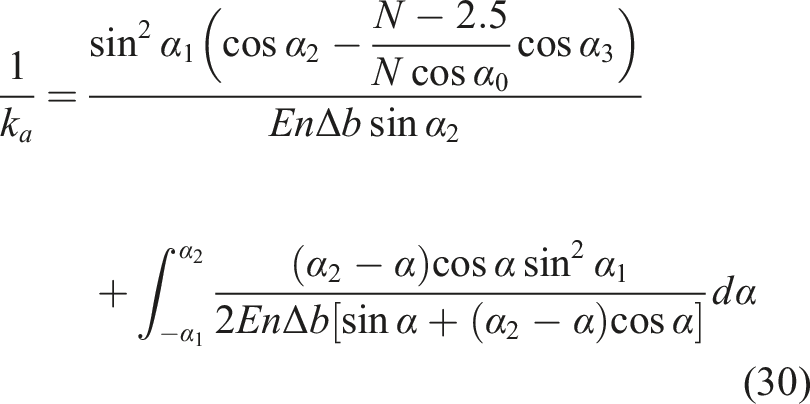
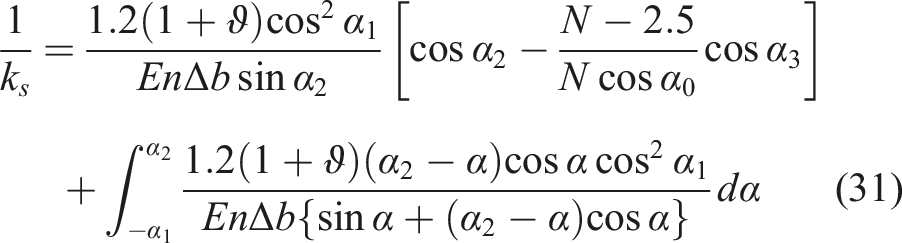


Thus, for a single tooth pair in contact, TVMS can be calculated from the following relation:
For multiple gear tooth pairs in contact, the TVMS can be determined using the following equation: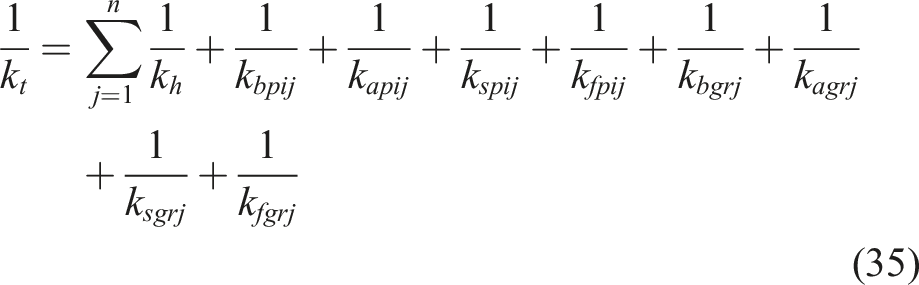
3.1.2.3. Integrated sub-model of the bevel gear system
Figure 8 illustrates the Simulink block diagram of the bevel gear subsystem within the mechanical system. The pinion and gear shafts are secured by using two bearings. Power is transferred from the motor to the gear system by using pulley arrangements and belt drives. Simulink block diagram of the bevel gear pair.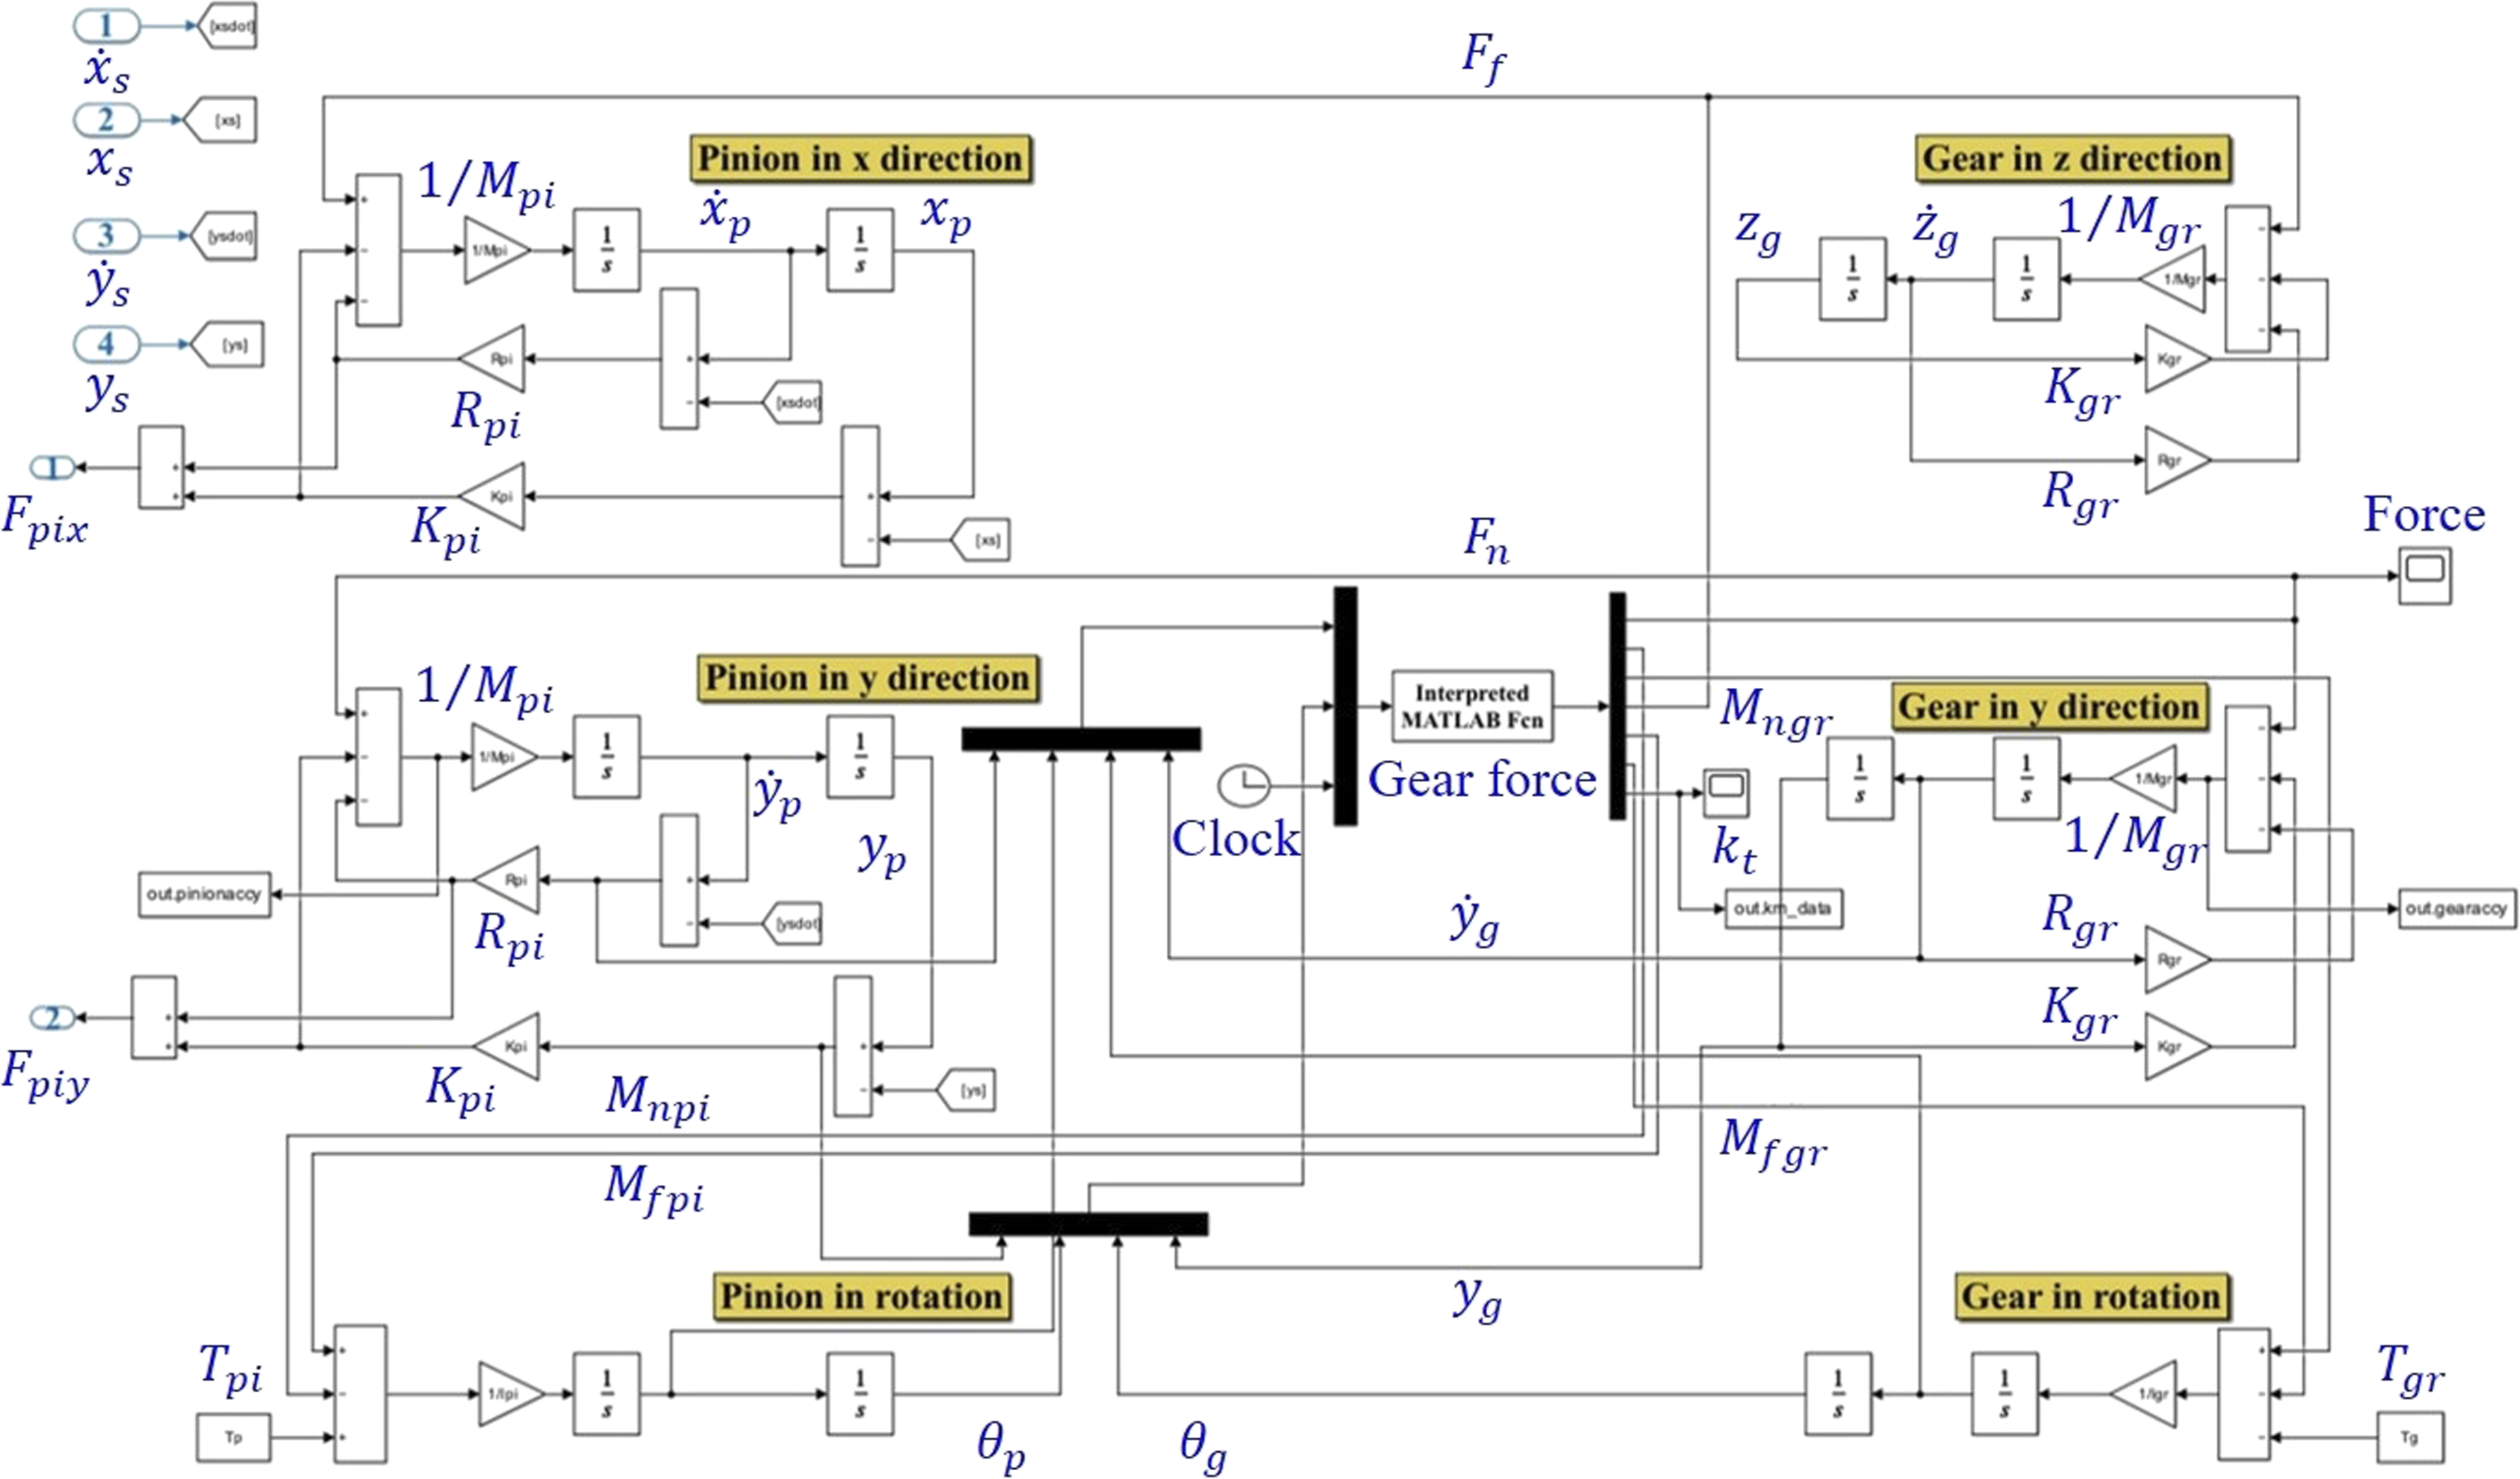
3.1.3. Integrated model of mechanical system
The integrated mechanical system model is illustrated in Figure 9. The driven shaft powers the bearing subsystem, which is then further transferred to the gear subsystem through pulleys and belt drives. The overall dynamic response of the mechanical system is the sum of the individual responses of its subsystems (bearings, gears, belt drives, pulleys, etc.). Integrated model of the mechanical system.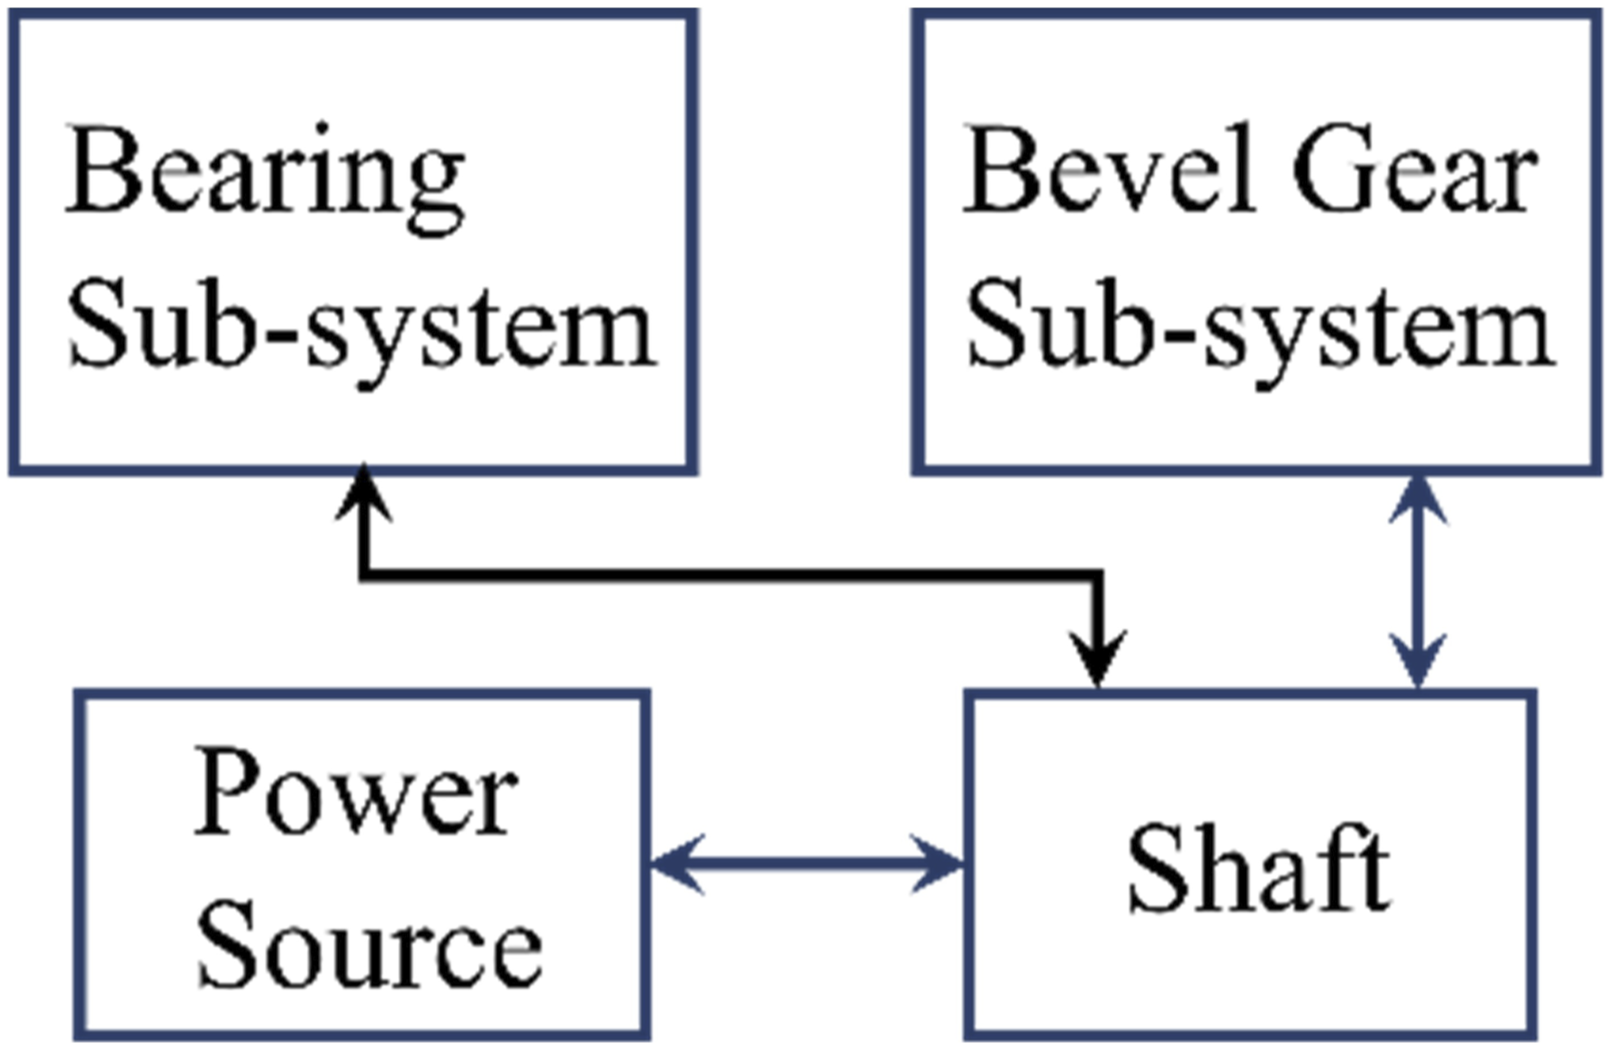
3.1.4. Simulation setup
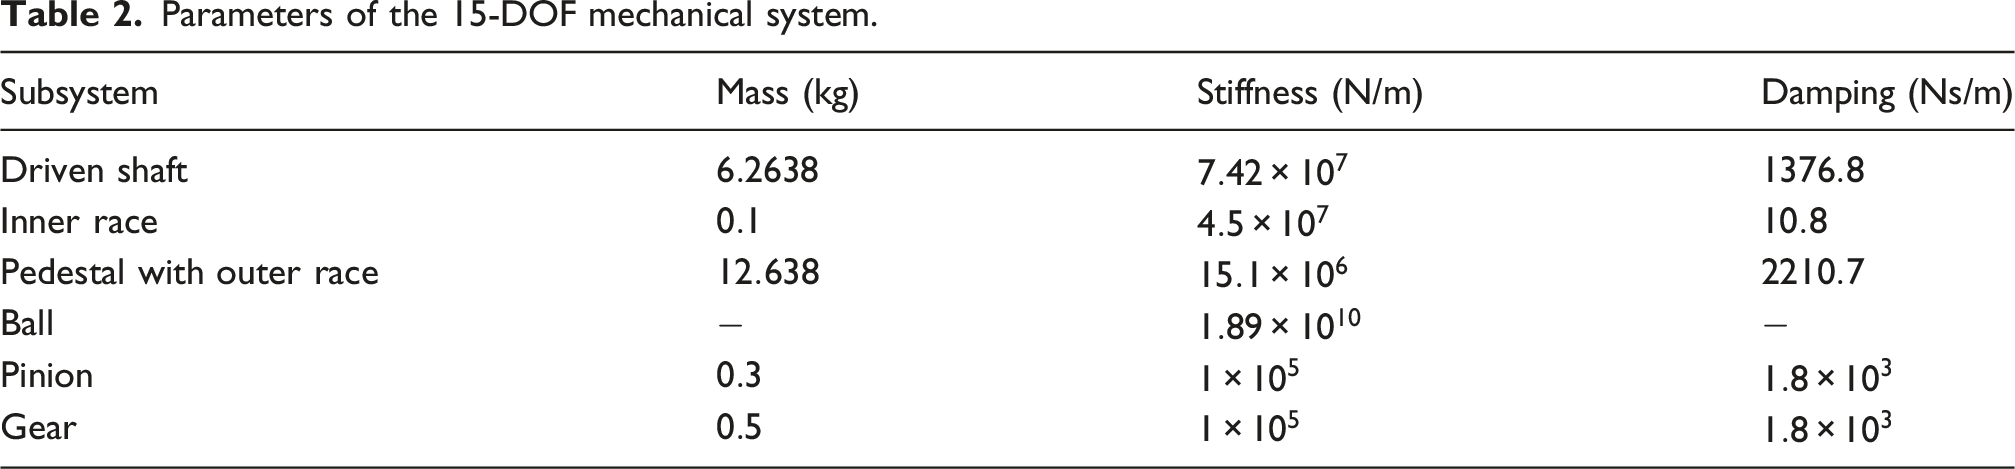
Parameters of the 15-DOF mechanical system.
3.2. Multi-body CAD model of mechanical system using MBS ADAMS
Different analytical models typically assume uniform fault profiles (in terms of width and depth), which limits their applicability. In contrast, 3D simulation software is flexible to model realistic fault profiles resulting from wear, indentation, and other imperfections. MBS ADAMS (a commercially available dynamics simulation software) is used to simulate real-time imperfections in the mechanical system by altering the CAD geometry to fabricate a fault.
3.2.1. Modelling of critical components of the mechanical system
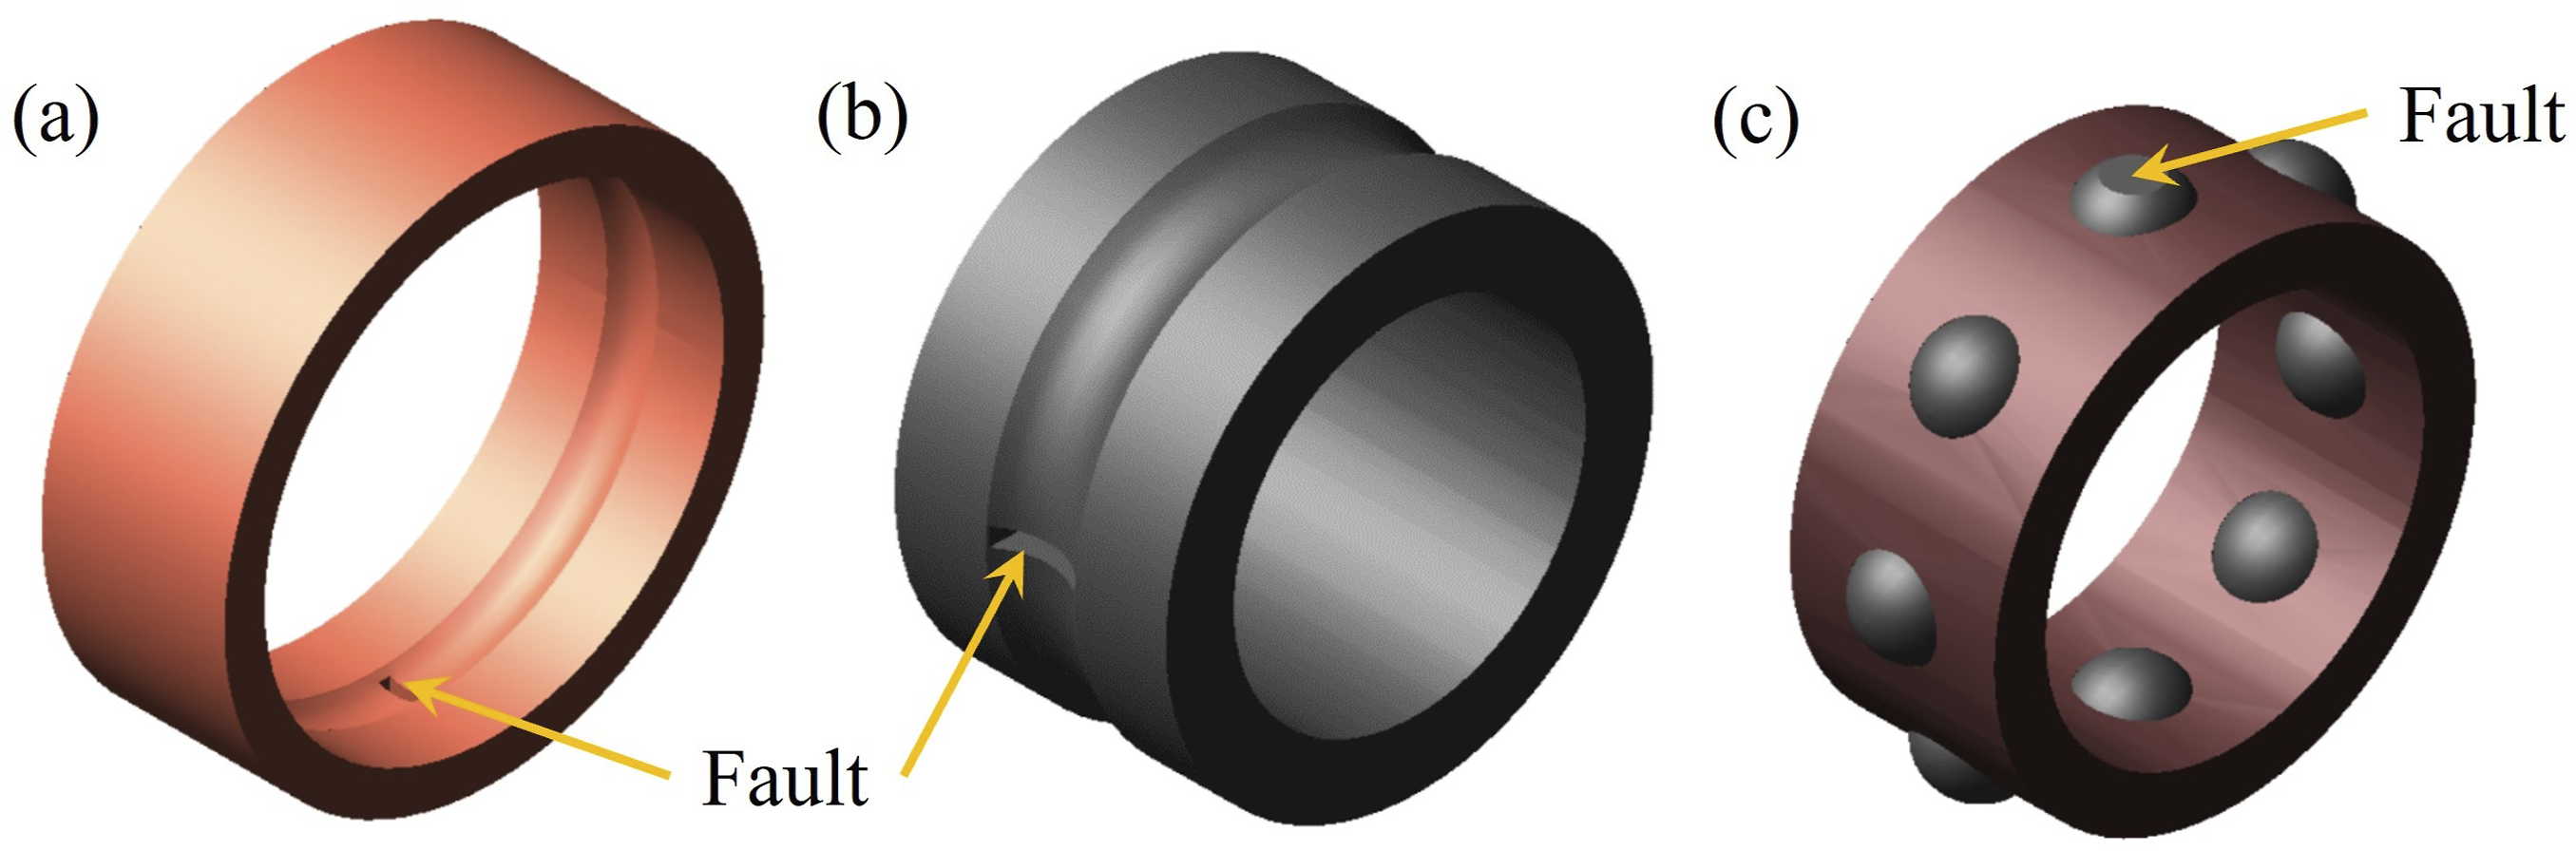
Figure 10 illustrates the graphical depiction of the ball bearing-gear model developed, similar to the experimental setup. It comprises one motor, a rotor shaft (considered rigid in both bending and torsion) connected to the motor via a flexible coupling, two deep groove ball bearings supporting the rotor shaft, a loader, one bevel gear pair, one pinion and one gear shaft, two additional groove ball bearings supporting the pinion and gear shaft, one belt drive, and four pedestals. A fixed joint connects the loader to the rotor shaft, limiting its motion. A fixed joint also connects the inner race to the driven shaft. Mountings of bearings on pedestals impart structural stiffness and damping to the outer races and are represented by spring-damper systems. This model considers the cage as a floating object. The function of the cage is to hold balls at constant angular separations. CAD models of faulty outer and inner races and cage with a faulty ball are shown in Figures 11 (a)–(c), respectively. CAD-based model of the proposed mechanical system. CAD models: (a) faulty outer race, (b) faulty inner race, and (c) cage with a faulty ball.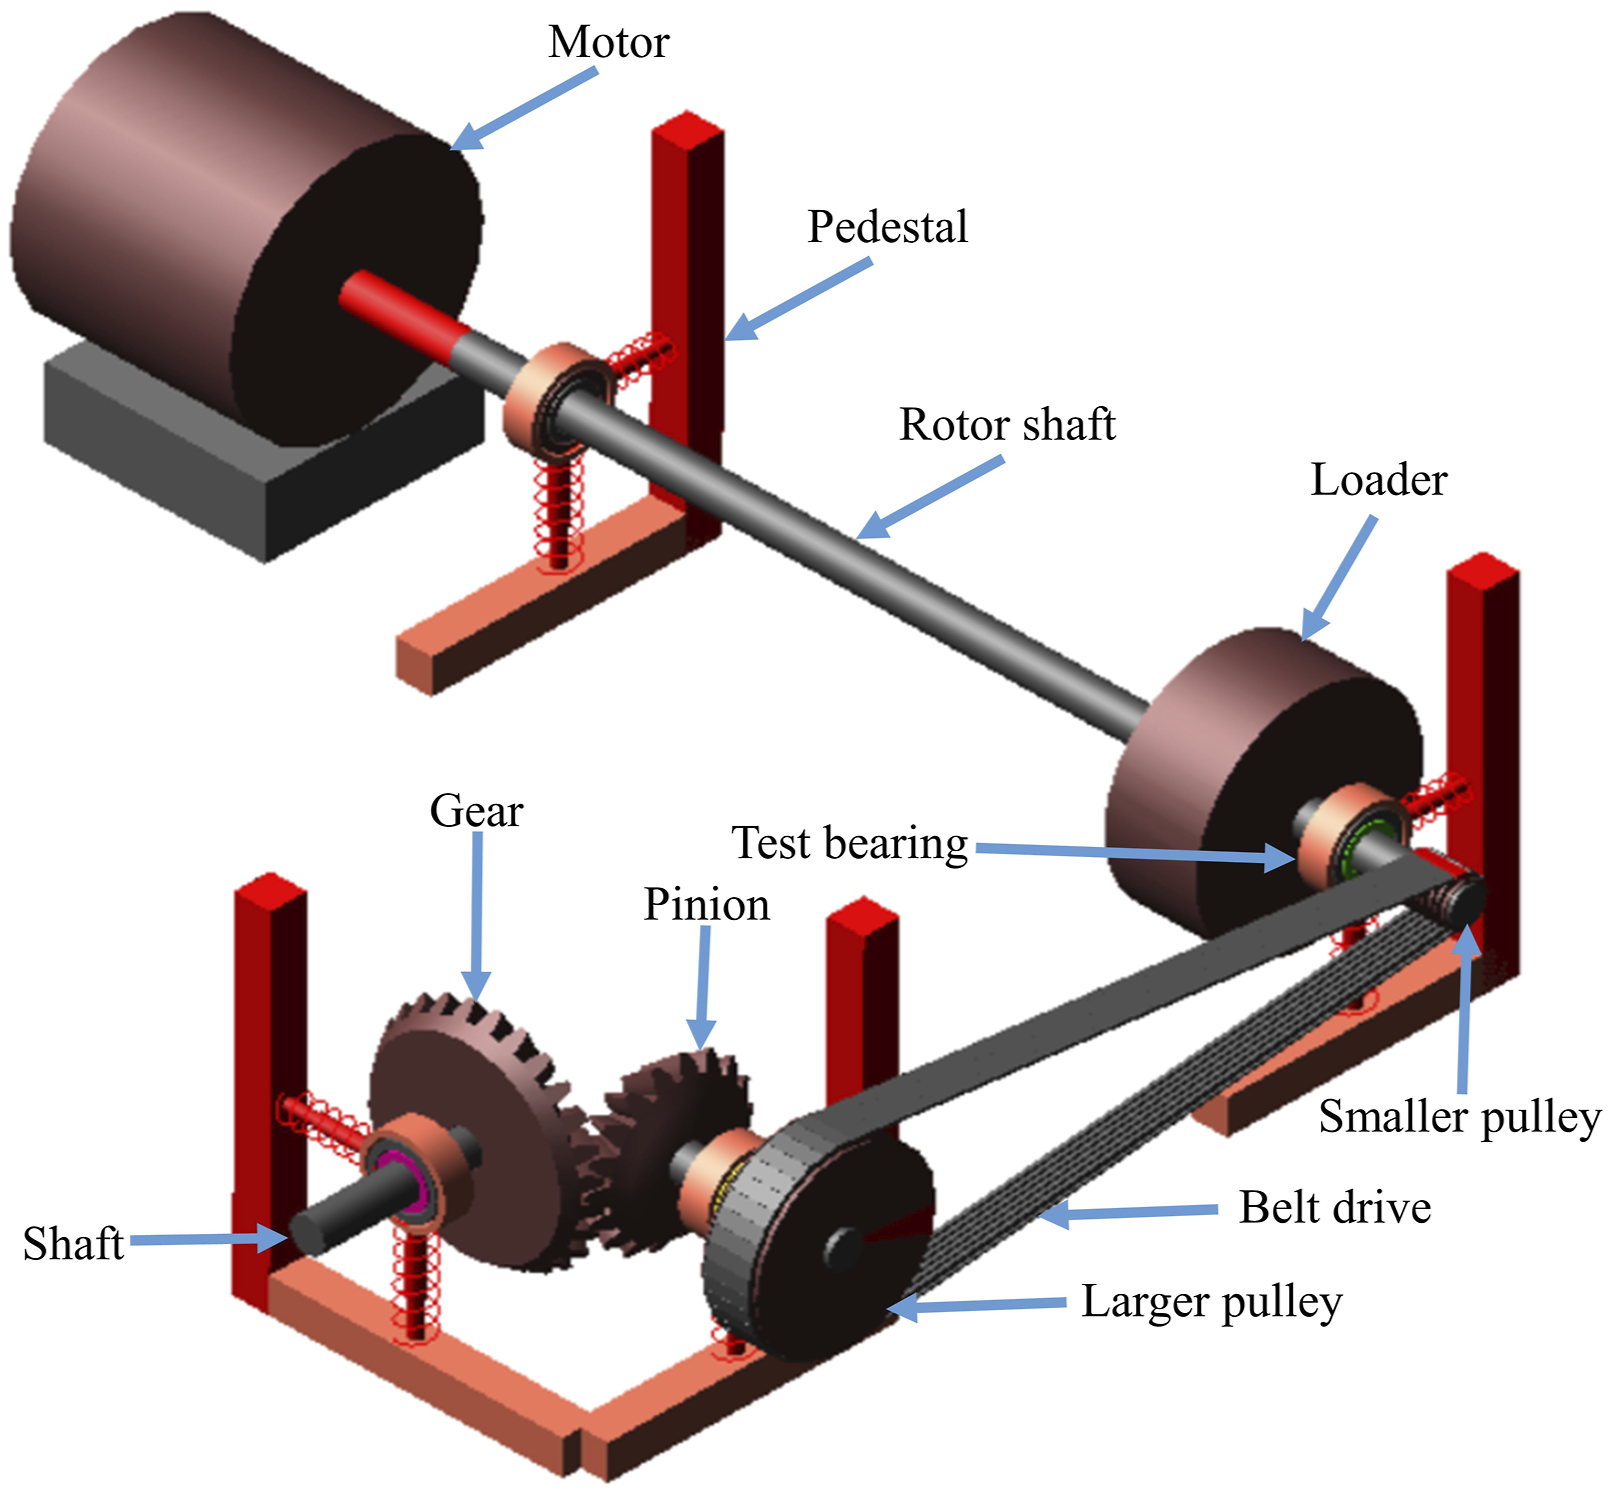
In gear subsystem modelling, planar joints are used on the gear and pinion shafts to restrict their rotation around their axes. To transfer motion/torque from the respective pinion and gear shafts to the pinion and gear, fixed joints are used, and thus, the pinion and the gear rotate at the same speed as that of the pinion and gear shafts. It is assumed that the solid-to-solid contact between the pinion and gear and the teeth of the pinion and gear are flexible. A belt drive with driver and driven pulleys of 41.5 mm and 102 mm, respectively, and a fixed width of 30 mm, is used to transmit power from the rotor shaft to the pinion shaft. The dimensions of the various components are selected to achieve an equivalent mass for the CAD gear pair-bearing model that matches the actual mass of the bearing used in the experiment. Steel material is chosen for modelling important parts. In the bearing system, masses of the outer race, inner race, cage, and balls are
Solid-to-solid contact is assumed for contact between the mating surfaces of subsystems. In all the models, the normal force produced during contact is determined by assuming surface contact between the mating surfaces (Hertzian contact), whereas the frictional force (traction/tangential force) between mating pairs is calculated using Coulomb’s friction theory. All CAD-based sub-models are developed with intrinsic mechanical parameters, Young’s Modulus, Poisson’s ratio and density
3.2.2. Modelling of faults in the test bearing
Most of the literature on rolling element bearing fault modelling often portrays localized faults in rolling element bearings as small triangular or rectangular notches. However, imperfections in industrial applications often have irregular geometry. Various studies have concluded that fault shape and size have a limited influence on the numerical value of the characteristic defect frequencies. Therefore, the races and balls are modelled with regular faults similar to the faulty bearings used in MFS system for experimentation.
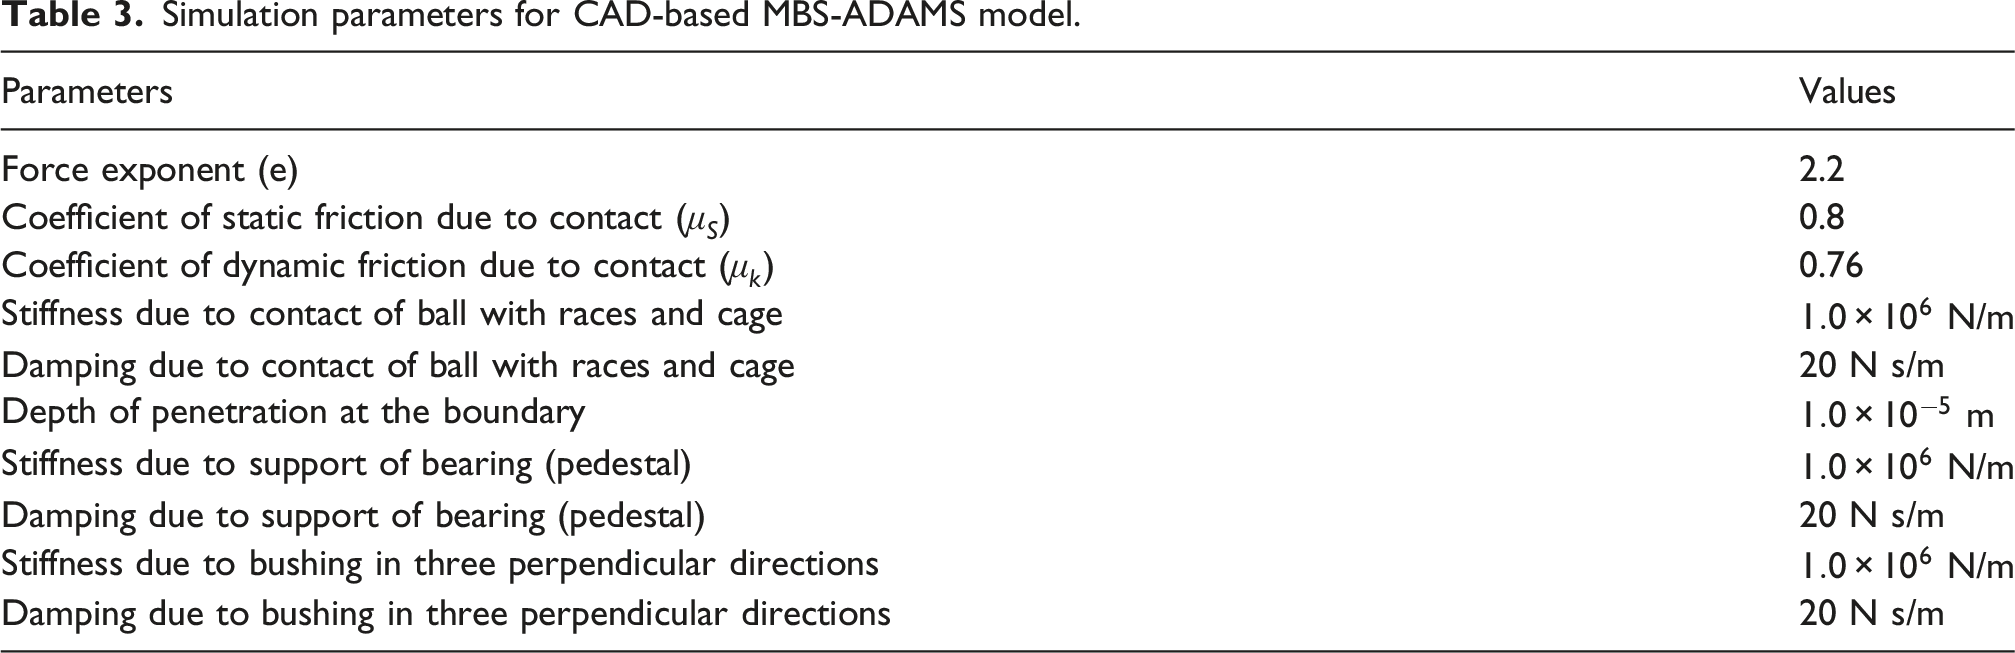
3.2.3. Simulation setup
Simulation parameters for CAD-based MBS-ADAMS model.
4. Diagnosis scheme
The conventional approach, such as the FFT, fails to adequately disclose the BCFs when the energy within the BCFs range is minimal, and noise predominates. Thus, signals contaminated by noise need pre-processing prior to analysis. This article utilizes short-time synchronous averaging (STSA) based envelope analysis for defect diagnosis.
Signal demodulation using the envelope spectrum is a widely used method for diagnosing machinery faults. Bearing degradation and damage progression can be inferred by analyzing envelope spectra (a high number of harmonics indicates degradation and more pronounced sidebands for damage progression).
The BSFs of the bearing used for experimental work are very close to shaft harmonics and should be reverified. Moreover, sensor and environmental noises are aperiodic with respect to shaft rotation, and thus, averaging the collected data with multiples of a specific time cancels the zero-mean noise from the signal. Therefore, the peak search algorithm (Mishra et al., 2016) is adopted for synchronous averaging of data. Let the data contain measurements for at least 

Initially, the obtained experimental signals, recorded at 15 Hz for 10 seconds, are pre-processed by normalizing (by the peak absolute value and subtracting the mean to eliminate DC bias, or zero frequency components). Bearing fault frequencies are isolated using STSA with averaging at different fault time intervals, which also suppresses non-synchronous vibrations and random noise. A padding sequence is then added at the start of the signal, after an initial set of transient data points is eliminated, to compensate for data loss due to averaging. This stage enhances the periodicity of the signal and ensures that the final averaged waveform is not distorted by any transient effects. After isolating fault-related frequencies with a bandpass filter, the envelope is extracted using the Hilbert transform, emphasizing amplitude modulations indicative of bearing faults. In order to examine the frequency patterns and identify indications of faults associated with different test bearing fault locations, the FFT is finally computed. In the present context, the design of an equiripple bandpass filter is based on the FIR algorithm to isolate the frequency band between 900 and 1800 Hz (within the range of structural resonance), thereby mitigating the signal’s low and high-frequency content. The first and second stopband attenuations for the filter design are set to 60 and 80 dB, respectively, with a passband ripple of 1 dB. Figure 12(a) illustrates the flowchart of the diagnosis scheme. A test case of the proposed diagnosis scheme is shown in Figure 12(b). (a) Flow chart of the diagnosis scheme and (b) its application (zoomed view) ((i) original signal, (ii) signal after applying TSA, (iii) bandpass filtered TSA signal, and (iv) envelope of the filtered signal).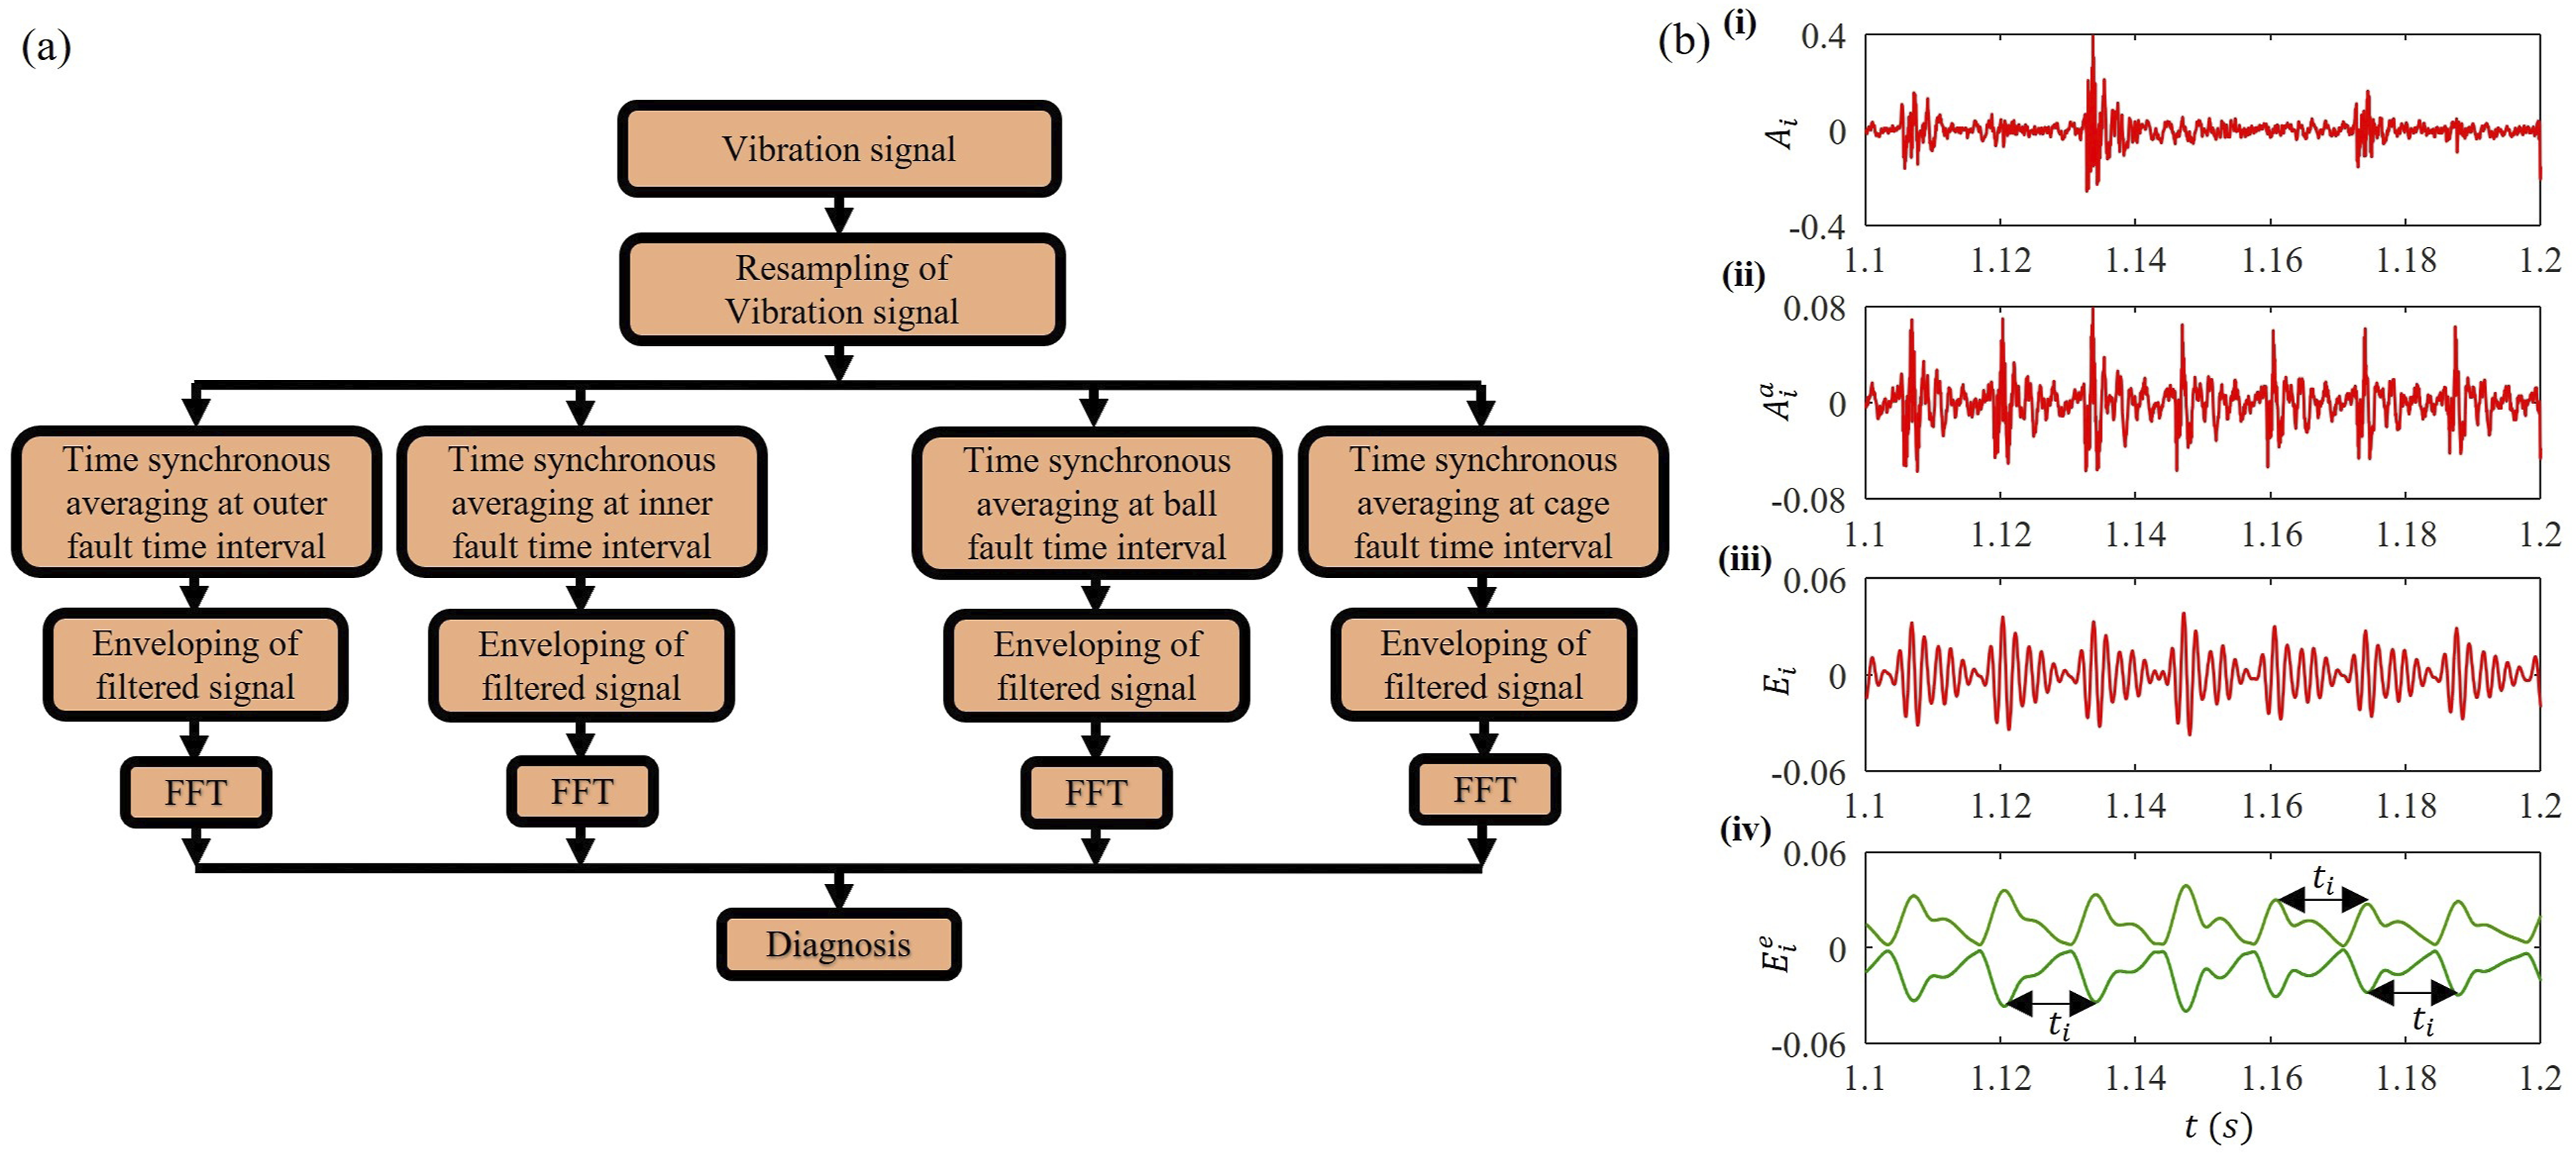
Figure 12(b) shows a zoomed-in view (0.1 s) of the various stages of the signal using the adopted signal processing method for analysis. Here, term
5. Results and discussion
The geometric data of the test bearing is replicated in the simulations. The BCFs at the shaft frequency
For analysis, both simulated and experimental data are gathered for 10 seconds at a sampling rate of 16,384 Hz. In Figure 13, the zoomed normalized responses of the pedestals of the test bearings, with fault types, are represented by A zoomed view (one second) of the normalized signal of bearing with ORF (a–c), IRF (d–f), and BF (g–i). Envelope spectra of the corresponding signal of Figure 13.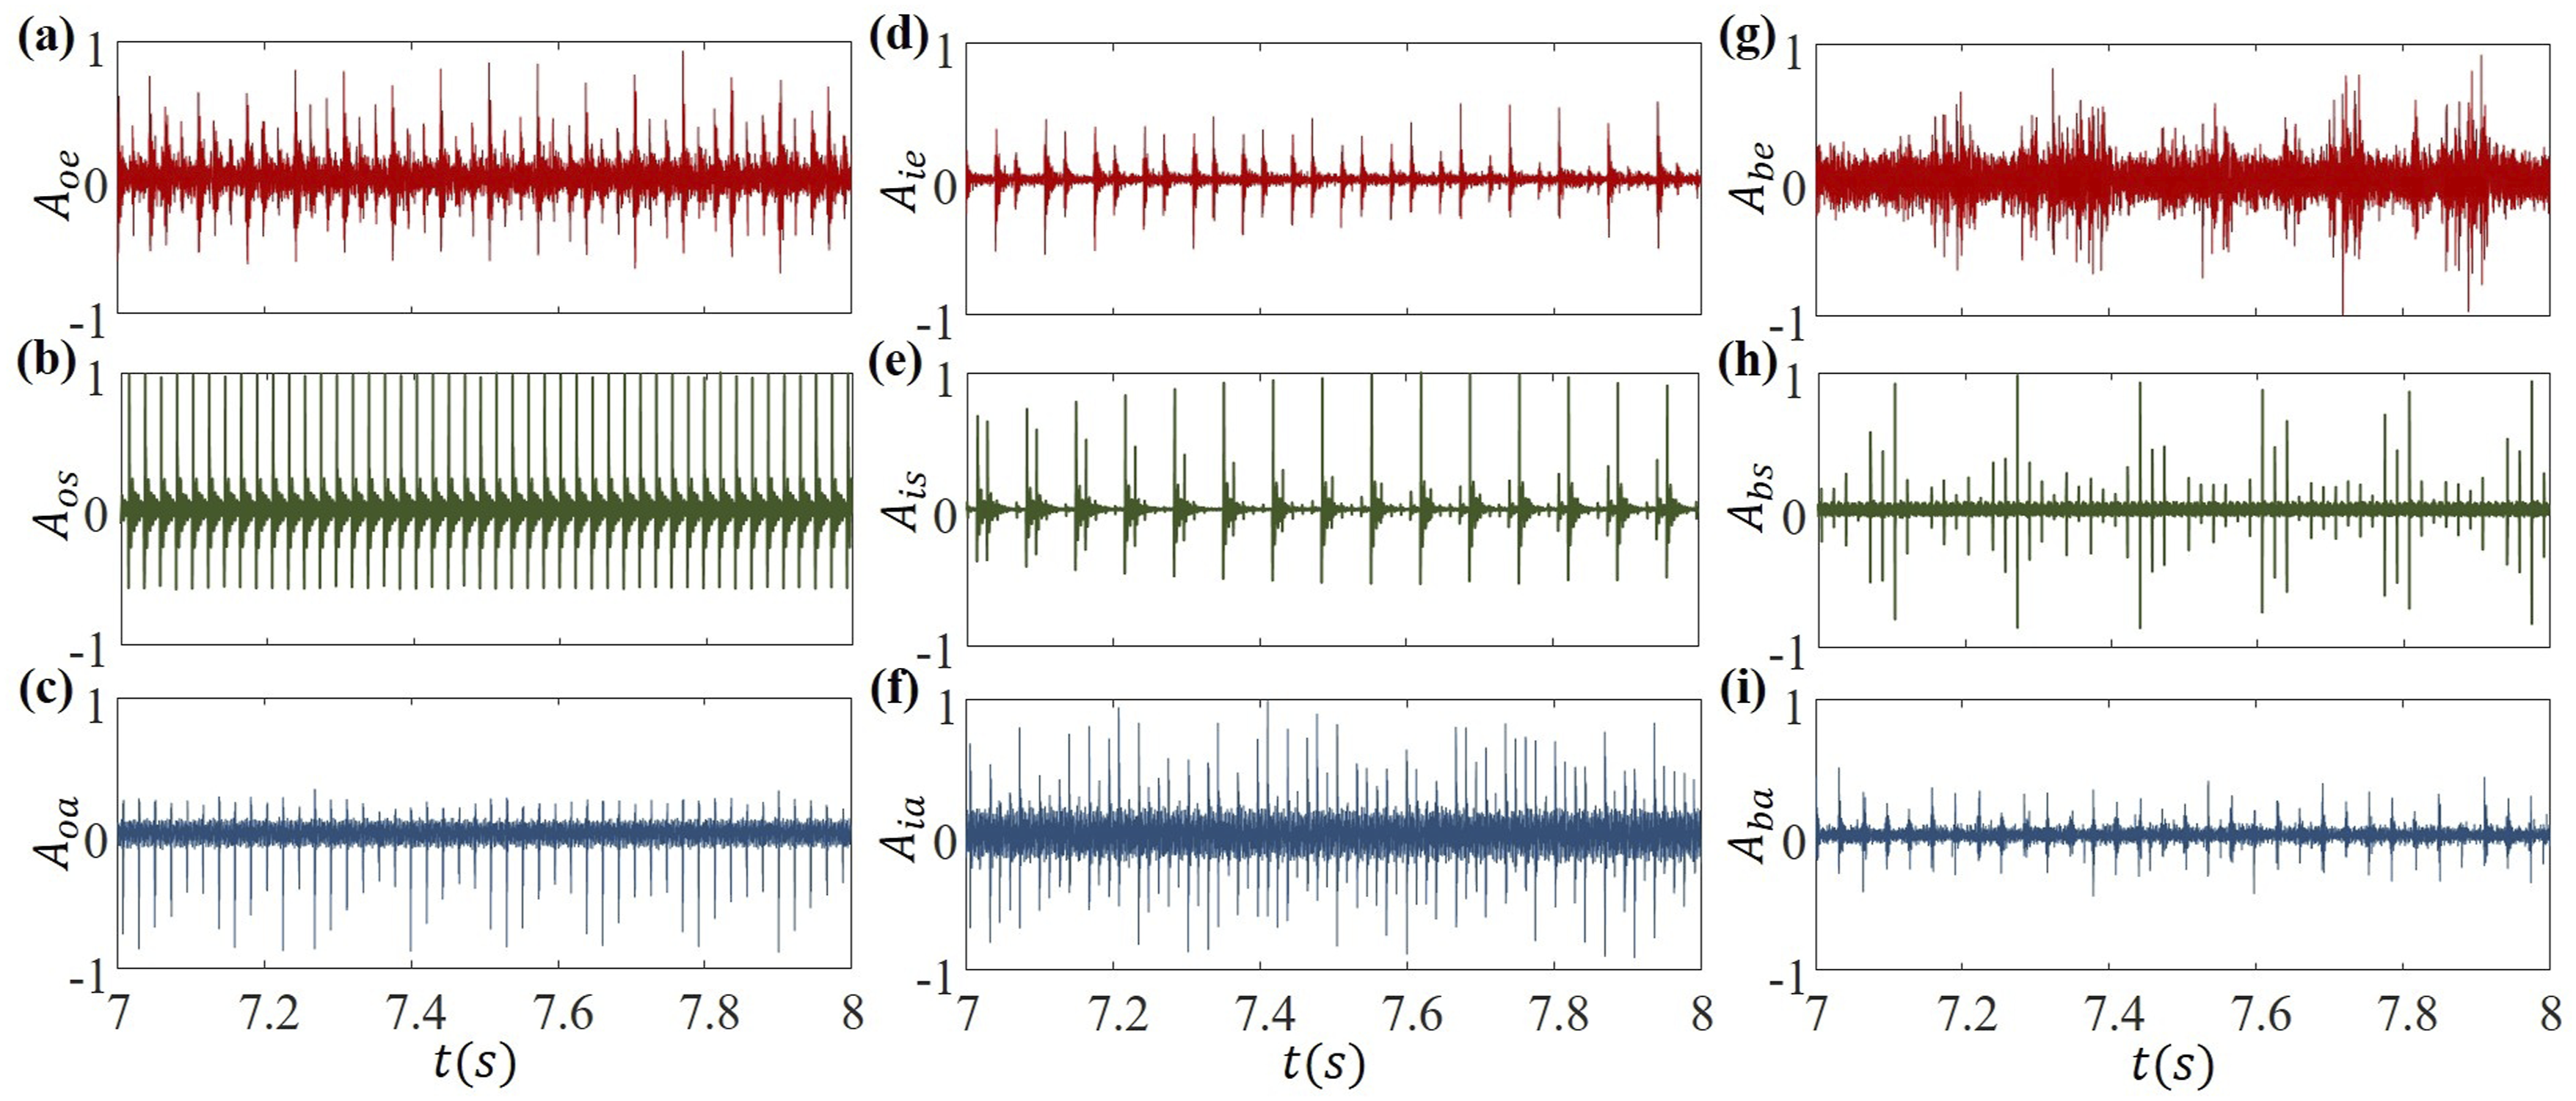
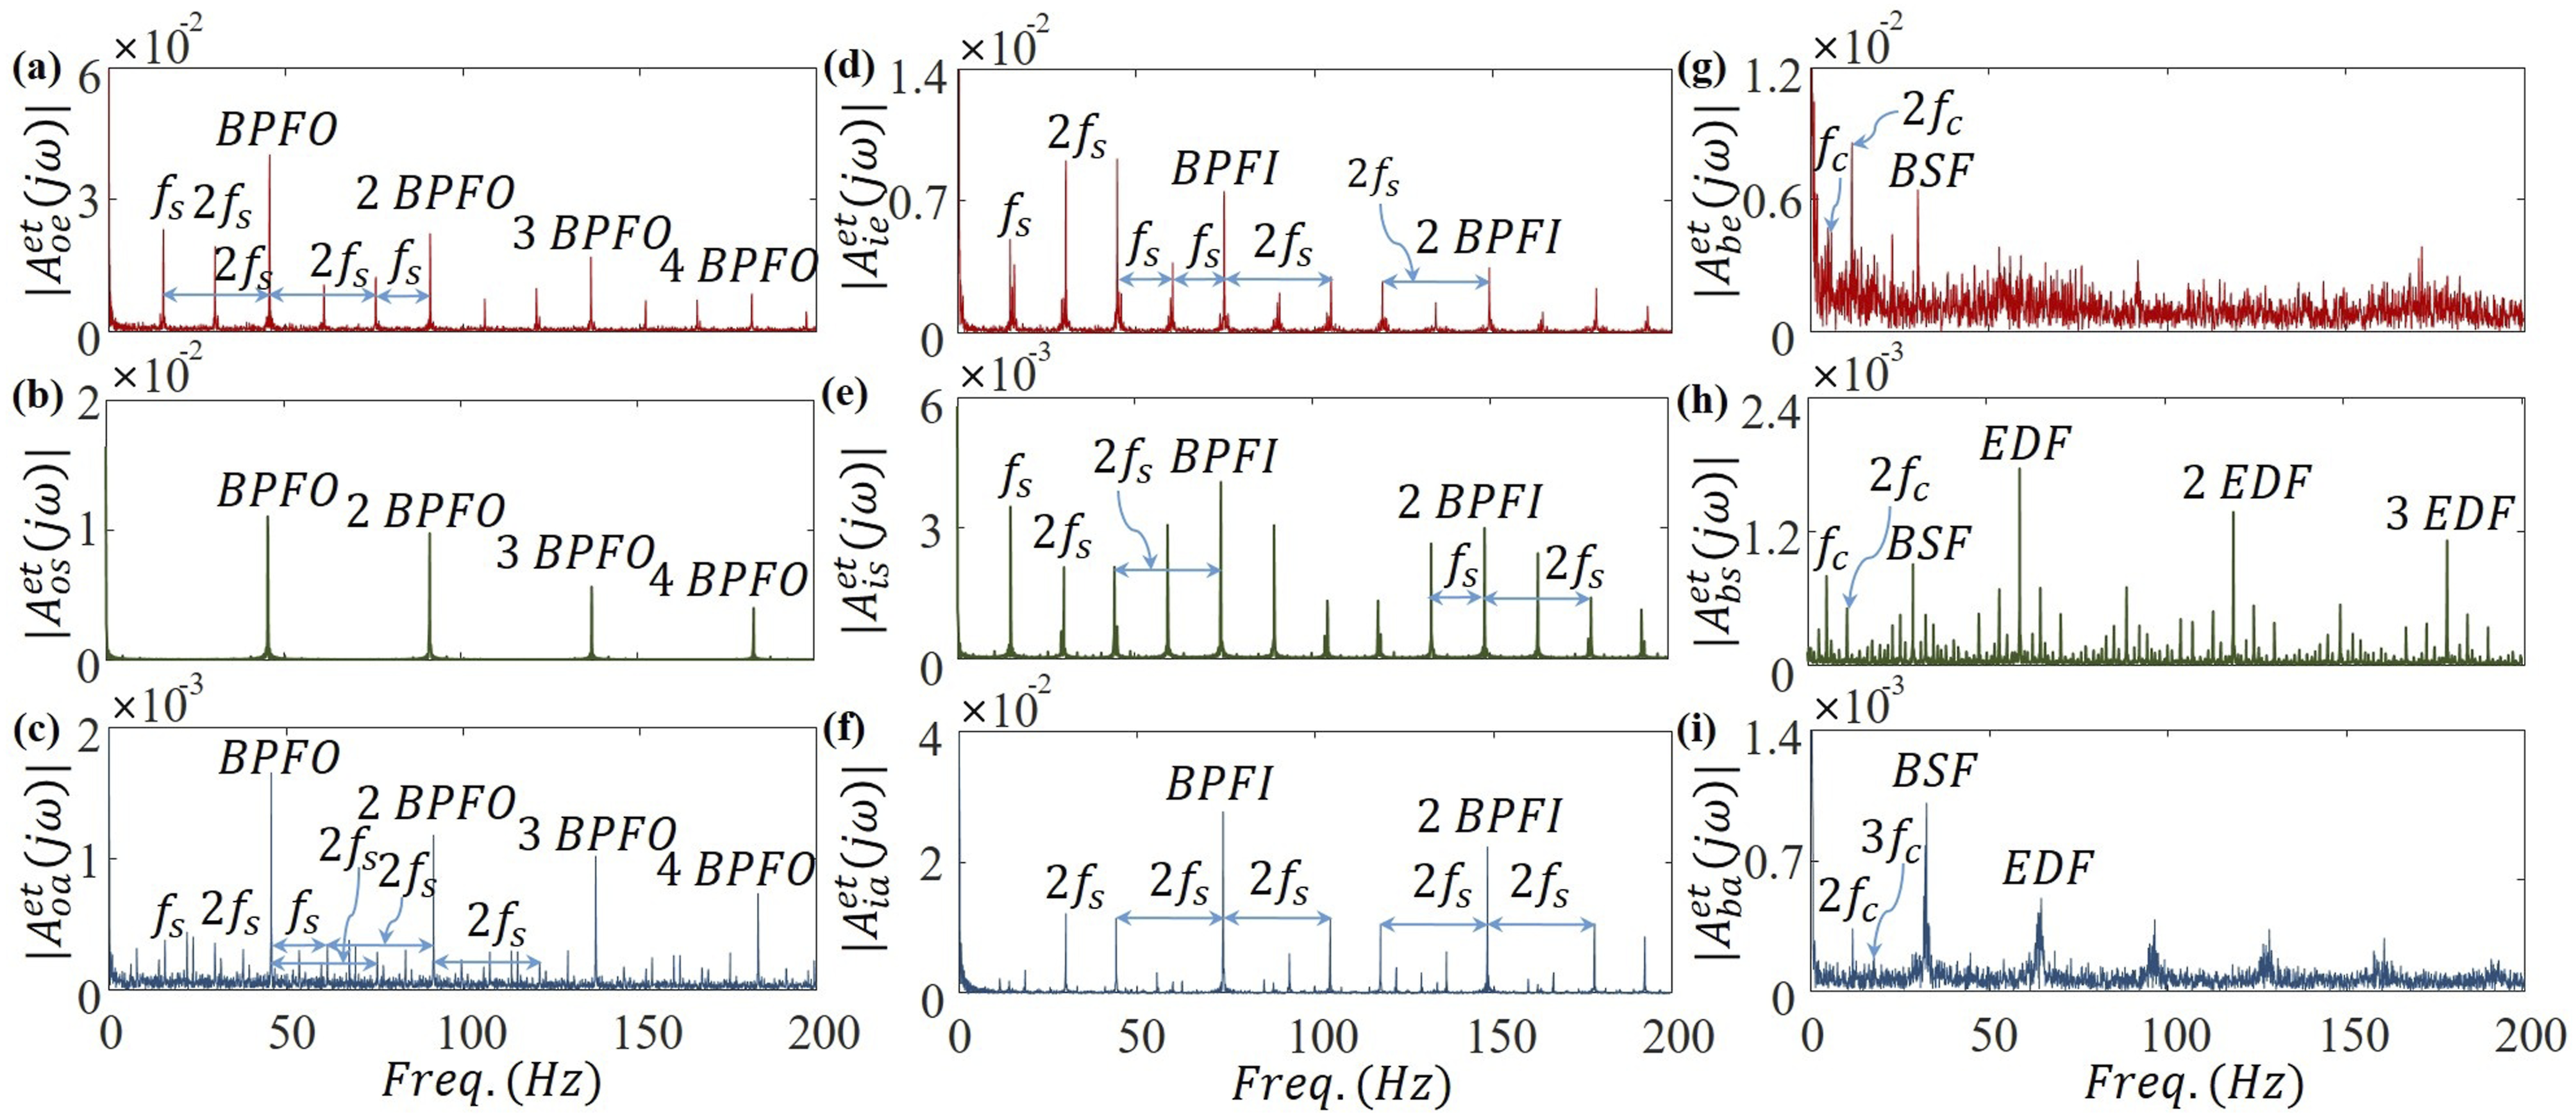
In Figures 14 (a)–(c), BPFO and its harmonics are evident in both experimental and simulated signals. The primary distinction across these spectra is that
Both models are sufficiently successful at capturing basic fault-induced information. However, the experimental envelope spectra align more closely with the simulation results from the MBS ADAMS model for a bearing with outer-race and ball faults. Between the proposed models, the MBS ADAMS model is computationally expensive. However, its advantages, such as design flexibility, real-time fault modelling, and the ability to capture the complex 3-D dynamics, make it physically distinct.
As stated earlier, the BPFO and BPFI for a faulty bearing are very close to the harmonics of shaft speed; thus, short-duration synchronous averaging is applied to check for any aberration. Experimental signals are used to reflect the actual condition of the mechanical system’s bearing by applying the diagnosis scheme. Figure 15 shows the envelope spectra of the experimental signals for three bearing conditions, obtained by using the diagnosis scheme, where the superscript Envelope spectra of experimental signals of the system with a fault at: (a) outer race, (b) inner race, and (c) one ball, after STSA at corresponding time intervals between impacts.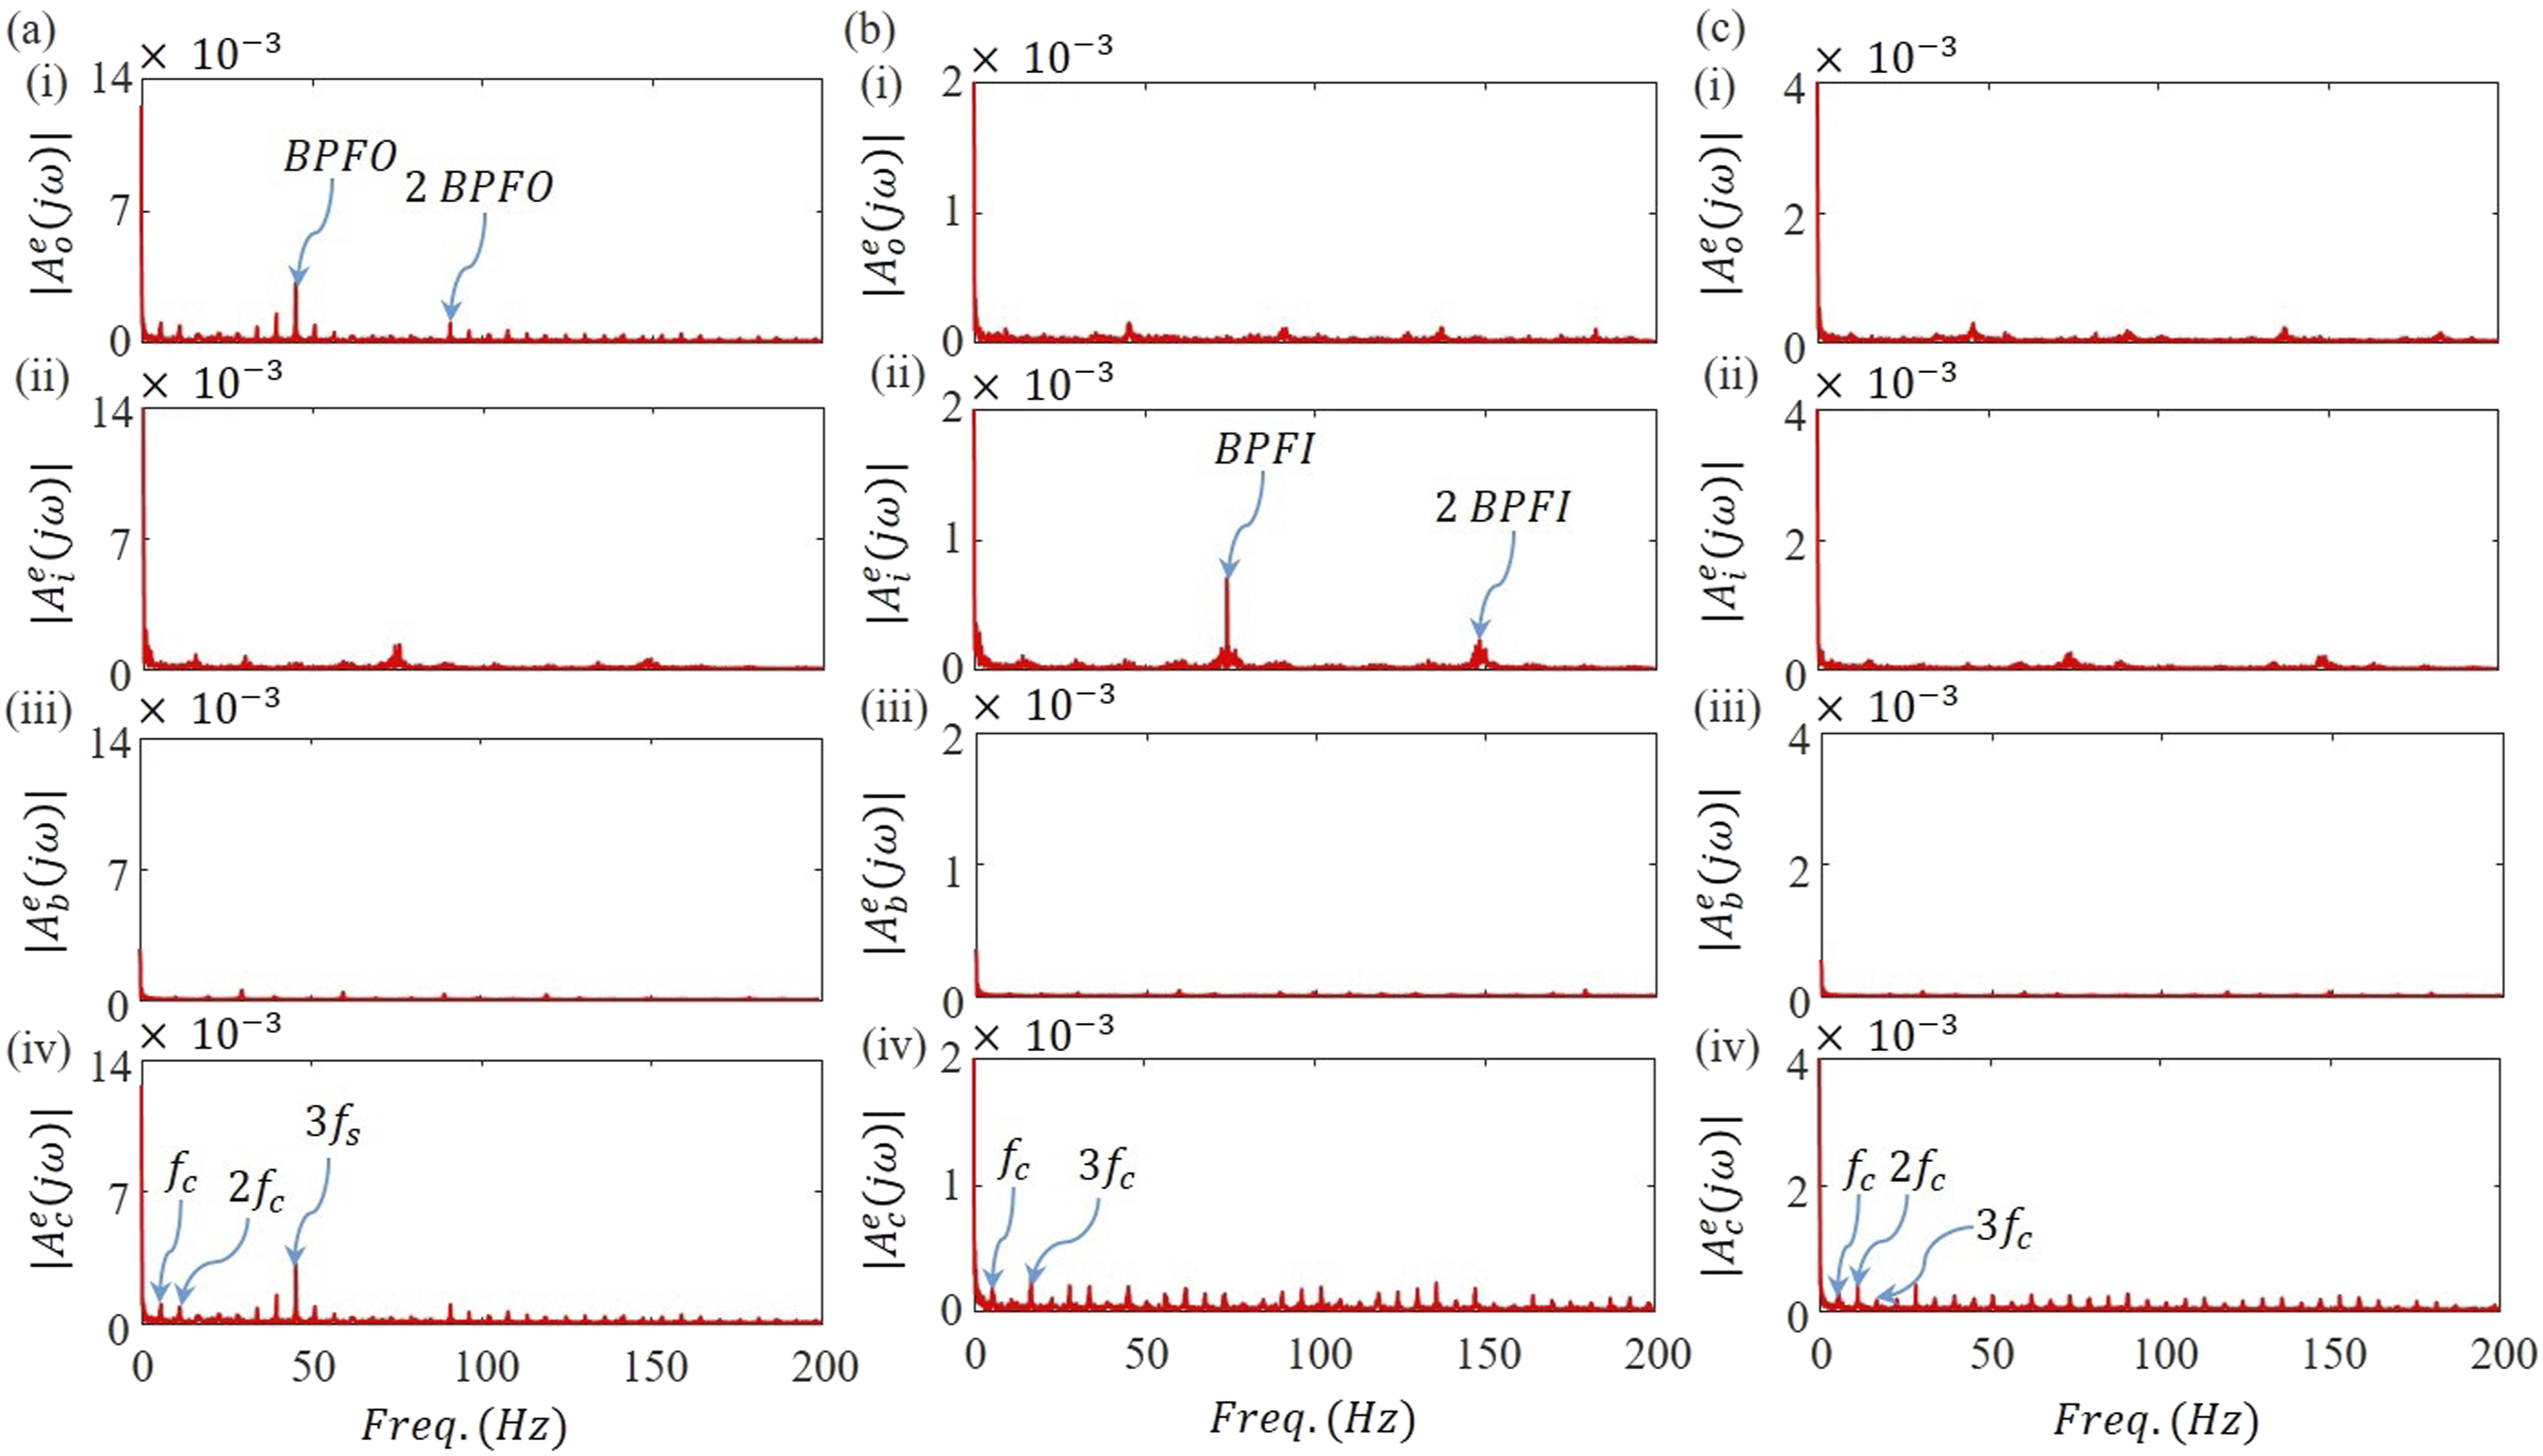
Distinct peaks can be observed for the outer race experimental signal when averaged at the time interval of the ORF (Figure 15(a)), and no such peak is observed when averaged at the time interval of either the IRF or the BF. However, when the signal is averaged at the time interval of the cage fault, the cage frequency and its harmonics are exposed. This is because the cage frequency is a modulation of the ORF. Thus, the outer race fault is clearly identified, unlike the results obtained in Figure 14(a), where, along with the outer race fault symptoms, the shaft frequency and its harmonics and side bands are observed in the envelope spectrum.
Similarly, BPFI and its harmonics are exposed for the experimental signal averaged at a time interval of the inner race fault, and no such peak is observed when averaged at a time interval of the outer race fault or ball fault (Figure 15(b)). Here, signal averaging over the cage fault time interval, the cage frequency, and its harmonics is shown. For the experimental signal with a ball fault (Figure 15(c)), the cage frequency and its harmonics are exposed in the envelope spectra when the signal is averaged at a time interval of cage fault, and no such peaks are observed when averaged with a time interval of outer/inner/ball faults.
In condition-monitoring applications, quantitative validation primarily focuses on reproducing characteristic fault frequencies, modulation sidebands, and dynamic response trends. Signals in the time domain are highly sensitive to phase shifts, amplitude scaling, and minor temporal misalignments, which significantly reduce correlation even when the underlying fault-related information is identical. In contrast, the envelope spectrum effectively captures modulation energy at characteristic defect frequencies and their harmonics. In the present work, the quantitative assessment of simulation and experimental results is performed by comparing the correlation coefficients (Pearson and cross correlation) and the error estimates (root mean square error (RMSE) and normalized root mean square error (NRMSE) in percentage) of the envelope spectra. Computing these on envelope-spectra amplitudes within the 0–200 Hz defect-frequency band yields a phase-independent and time-shift-robust similarity measure that preserves fault-related spectral features.
Quantitative assessment of simulation versus experimental responses.
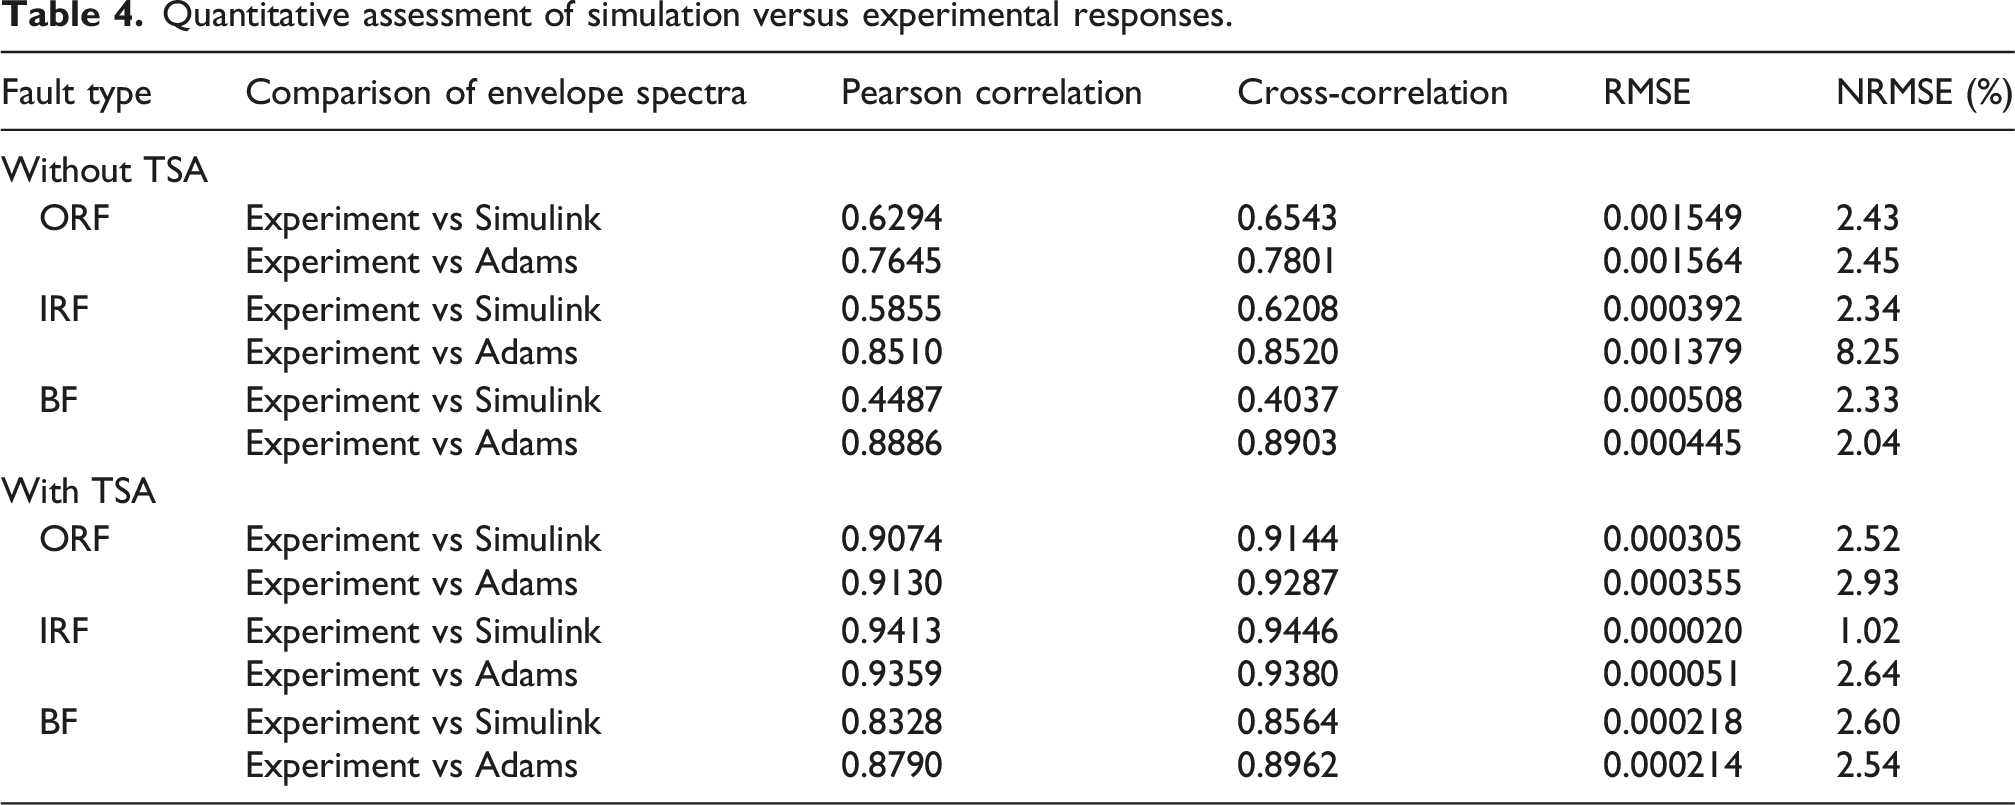
A substantial improvement in quantitative indicators is observed for both modelling approaches after using STSA-based envelope spectra. The Pearson correlation coefficients increase to 0.9130 and 0.9359 for ORF and IRF cases, demonstrating the effectiveness of TSA in suppressing noise and enhancing fault-related periodic components. In contrast, for the IRF case, the Simulink model achieves a marginally higher Pearson correlation coefficient (0.9413) than the ADAMS model, accompanied by lower RMSE and NRMSE values. This behaviour suggests that TSA attenuates many of the nonlinear and stochastic components captured by the multi-body model, thereby emphasizing that the deterministic fault characteristics are effectively represented by the analytical models. Overall, across all the quantitative indicators, both models perform satisfactorily (well within the prescribed limit).
6. Conclusions and scope of future work
This study presents and validates two complementary virtual models of a rotating mechanical system for bearing fault diagnosis: a simplified yet computationally efficient 15-DOF physics-based model in MATLAB/Simulink, and a high-fidelity CAD-based multi-body dynamics model in MSC ADAMS. Both models successfully replicate the dynamic behaviour of bearings with localized defects and demonstrate strong agreement with experimental measurements obtained from a machine fault simulator. Short-time synchronous averaging-based envelope analysis effectively extracts BCFs under weak and noise-dominated conditions. Across outer-race, inner-race, and rolling-element faults, the simulated signatures exhibit strong correlation with experimental observations for extracting basic fault-induced information, confirming the accuracy and diagnostic capability of both models. However, the 3-D simulation-based MSC ADAMS model can be used to generate data, with high design flexibility, real-time fault modelling, and the study of complex 3-D interactions and energy transfer phenomena.
7. Major contributions and findings
• The 15-DOF model effectively captures the coupled dynamics of bearings and bevel gears, providing fast and reliable fault signature prediction. • The Simulink model provides a unified formulation to account for contact dynamics in both bearing and bevel gear subsystems. • The CAD-based ADAMS model enables realistic 3-D fault representation and incorporates the dynamics of cage, rolling elements, belt drive, connecting rod/shafts, and gear transmission. • Qualitative and quantitative assessment across multiple fault conditions of envelope spectra from the models align well with experimentally observed characteristic defect frequencies, demonstrating their diagnostic capability. • The capability of both models to serve as virtual data generators reduces dependence on costly and labour-intensive experimental campaigns.
8. Future work may include
• A detailed sensitivity analysis of the developed models can be performed to identify the dominant parameters, quantify uncertainty and enable robust fault diagnosis. • Development of a reduced-order modelling strategy for decreasing computational burden. • A detailed convergence check for predicting precise physical quantities. • A detailed study of the quantitative separation of individual components of the coupled system. • Development of robust fault diagnosis schemes for challenging operating conditions. • Further enhancement of the CAD model to represent complex real-world imperfections, including cage ovality, ball shape deviation, and oversized/undersized rolling elements. • Integration with emerging signal processing and machine learning techniques for automated fault identification under non-stationary operating conditions. • Real-time digital twin development for online condition-monitoring applications.
Footnotes

Funding
The authors received no financial support for the research, authorship, and/or publication of this article.
Declaration of conflicting interests
The authors declared no potential conflicts of interest with respect to the research, authorship, and/or publication of this article.
Data Availability Statement
The results are derived from models and/or experiments. The data used in this study are available from the corresponding author upon reasonable request.