






Abstract
Specialty providers claim to offer a new competitive benchmark for efficient delivery of health care. This article explores this view by examining evidence for price competition between ambulatory surgery centers (ASCs) and hospital outpatient departments (HOPDs). I studied the impact of ASC market presence on actual prices paid to HOPDs during 2007-2010 for four common surgical procedures that were performed in both provider types. For the procedures examined, HOPDs received payments from commercial insurers in the range of 3.25% to 5.15% lower for each additional ASC per 100,000 persons in a market. HOPDs may have less negotiating leverage with commercial insurers on price in markets with high ASC market penetration, resulting in relatively lower prices.
Keywords
Rising health care costs are a growing threat to both public and private health insurance programs in the United States. Because nearly one third of health care spending in the United States is paid in the private market by commercial insurers, an important and timely issue for study is the direction of economic forces. As markets develop within the new regulatory framework, technological advances are driving growth of new organizational forms for health care delivery that are affecting services traditionally performed in acute care hospitals. Ambulatory surgery centers (ASCs), freestanding facilities that specialize in surgical procedures that do not require an overnight stay, are major players among these new delivery systems. While ASCs have been a part of the delivery landscape since 1970 when the first ASC opened in Phoenix, Arizona, they have experienced robust growth in recent years; the number of Medicare-certified ASCs grew 49% between 2002 and 2012 (Medicare Payment Advisory Commission [MedPAC], 2014). While their growth rate has slowed more recently, in 2014 there were 5,414 Medicare-certified ASCs in the United States (MedPAC, 2015), exceeding the number of acute care hospitals.
Underlying the rapid expansion of ASCs is the question of their impact on the market for outpatient surgery. While research on this topic is limited, there is recent evidence suggesting that ASCs actively compete with hospital outpatient departments (HOPDs). Increased market penetration of ASCs has been found to be associated with reduced HOPD surgical volume (Bian & Morrisey, 2007; Courtemanche & Plotzke, 2010) and with lower revenues, costs, and profits (Carey, Burgess, & Young, 2011). ASCs may compete with lower costs owing to specialization which allows for more suitable facility design, less operating room down time, and more efficient management of staff (Trentman, Mueller, Gray, Pockaj, & Simula, 2010). Surgical procedures also have been found to be provided in ASCs in less time than the same procedures when provided in HOPDs (Munnich & Parente, 2014). Moreover, ASCs do not share in the cost of the most expensive technologies, treat healthier patients, and do not face the problem of uncompensated care. While the differences between ASCs and HOPDs is generally well understood, very little is known about how ASCs affect prices for outpatient services.
New Contribution
In the United States, most surgical services are reimbursed by commercial insurers based on prices negotiated privately between insurers and providers. Higher prices, due largely to greater provider bargaining power, may signify market failure leading to higher prices and contribute to health care spending (Gaynor, 2014). Concern is mounting in recent years as (a) consolidation among providers is growing (Ginsburg & Pawlson, 2014) and (b) many consumers are demanding that certain reportedly high-quality hospitals be included in their networks (Berenson, Ginsburg, & Kemper, 2012). In this environment, if ASCs can compete with HOPDs by convenient and efficient service provided at a lower price, HOPD bargaining power may be reduced, putting downward pressure on prices.
This study tests this hypothesis. It is premised on the notion that higher prices are driving higher U.S. health care spending (Anderson, Reinhardt, Hussey, & Petrosyan, 2003; Oberlander & White, 2009), and extends the previous ASC literature by focusing on price competition. A recent comparison of ASC and HOPD prices for services provided in both provider types revealed no evidence of ASC pressure on HOPD prices (Carey, 2015). However, that analysis was of trends examined at the national level only, and did not examine market-level effects. This study focuses the issue more deeply by going within specific markets, and is the first to address the question of whether ASCs are having a positive impact by exerting competitive pressure on HOPD prices. It examines HOPD prices for four common surgical procedures that are provided in both provider types. Results provide evidence of a downward effect on prices associated with ASC presence.
Method
Data
The key data set is years 2007-2010 of MarketScan® Commercial Claims and Encounters, a commercial insurance claims database distributed by Truven Health Analytics. MarketScan assembles complete insurance claims for approximately 100 medium-size and large employers covering nearly 40 million lives in 2010. The data include patient clinical, demographic, provider, insurance plan, and geographic information. The MarketScan financial component includes payments to providers, after applying negotiated discounts, both inclusive of and exclusive of patient copayments, coinsurance, and deductibles. These data are actual transaction prices, which generally are considered highly confidential, and therefore not included in most research databases.
MarketScan is a convenience sample that may not generalize to the entire U.S. population. However, the claims used in this study contain observations from all 50 states and from the District of Columbia, which should be adequate for capturing patterns of price variation across different regions of the United States. The MarketScan data were merged with data from the Area Health Resource File (AHRF), a national health resources information database compiled by the Health Resources and Services Administration. The AHRF contains information on health facilities, health professions, and socioeconomic and environmental characteristics by geographic area.
Selection of Services
Most ASCs focus on a relatively small set of surgical services within a single specialty. Criteria for selection of surgical services for this study were that they (a) were performed in both ASCs and HOPDs (b) experienced high procedure volume, and (c) represented the three main ASC specialties: gastroenterology, ophthalmology, and orthopedic surgery. Based on these considerations, I focused on four surgical services: upper gastrointestinal (GI) endoscopy (CPT code 43239), diagnostic colonoscopy (CPT code 45378), extracapsular cataract removal with insertion of intraocular lens (CPT code 66984), and arthroscopic knee surgery with meniscectomy, medial or lateral (CPT code 29881). The data were pooled observations from the years 2007-2010. Price measures were inflated to 2010 dollars using the outpatient hospital services component of the consumer price index (U.S. Bureau of Labor Statistics, 2015).
Market Definition
Markets are defined as counties located in metropolitan statistical areas. Markets based on geographic boundaries are somewhat arbitrary; however, MarketScan does not identify providers, and there is no data set containing transaction price information on which patient flow models (such as the Dartmouth Atlas Hospital Referral Regions or Health Service Areas) can be constructed. The county is a reasonable measure of the market for ASC services as patients generally do not travel great distances for these procedures (Courtemanche & Plotzke, 2010).
Variables
The dependent variable is price, measured as the actual price transacted (payment) for the procedure. The measure is total payment received by the provider after applying discounts, including any coinsurance or copayment, but excluding deductibles, which do not directly associate with the procedure being examined. MarketScan outpatient data are not organized by visit; rather, each outpatient service record contains a single procedure (such as diagnostic colonoscopy) that is linked to total payment values. I excluded claims for which the plan type is coded as Health Maintenance Organization or Capitated/Partially Capitated Point of Service. These plans do not generate claims for reimbursement of prepaid capitated services; rather, encounter records that contain limited financial information. Only 9% of claims in the database are coded as capitated; 91% are fee-for-service. 1
The key independent variable is the number of ASCs per capita in the market in the given year. This was contained in the AHRF; it was obtained from the Centers for Medicare and Medicaid Services (CMS) Provider of Services File, and includes ASCs that have participating provider agreements with CMS. I adjusted for risk using age and gender. 2 Previous literature suggests that insurance plan type explains variation in hospital prices (Dor, Grossman, & Koroukian, 2004; Dor, Koroukian, & Grossman, 2004). Patient benefit plan type was controlled using four categorical variables constructed from the remaining seven plan types, organized to represent traditional indemnity insurance in which there is no incentive to use a particular provider, managed care, and consumer-driven approaches to coverage: (a) basic medical or comprehensive, (b) exclusive provider organization or noncapitated point-of-service, (c) preferred provider organization, and (d) consumer-driven health plan or high deductible health plan.
The models also included AHRF variables as market-level controls: the number of HOPDs in the market per capita, the number per capita of general surgeons plus gastroenterology, ophthalmology, or orthopedic specialty surgeons in the market, average income, and the unemployment rate. Finally, because the costs of inputs to hospital services production vary geographically and are expected to be reflected in negotiated prices, I adjusted for labor input prices using the Medicare Wage Index, the CMS geographic adjustment used in hospital outpatient reimbursement. I used a proxy variable to control for capital input prices: county median home value, which AHRF compiles from the American Community Survey Summary File, U.S. Census Bureau.
Empirical Model
For each procedure, I conducted a regression analysis using a generalized linear model in which the dependent variable was the natural logarithm of total HOPD payment for the procedure. The key independent variable was number of ASCs per 100,000 persons in the county. Patient-level risk adjusters were age (in years), gender, and plan type. Market-level covariates were the number of HOPDs and of surgeons (general plus specialty) in the county per 100,000 persons, average income, unemployment rate, the Medicare Wage Index, and median home value. To account for correlation among the error terms, standard errors were clustered at the level of the county. It is assumed that capital was fixed over the period of study, and therefore that HOPD price, ASCs per capita, and HOPDs per capita are exogenous variables. The generalized linear models used the log link function with gamma distribution and were estimated in SAS v9.4, PROC GENMOD.
As a validity test, I estimated two auxiliary regressions on services for which ASC presence would be expected to have no effect on price. For these counterfactual models, I used the same specification to estimate the relationship between ASC presence and hospital inpatient prices for two surgical procedures that also are high volume but that are provided only in inpatient settings: laparoscopic cholecystectomy (MS-DRG 419) and major joint replacement or reattachment of lower extremity (MS-DRG 470). To the extent that the estimated associations between ASC presence and price are similar in the main regression models compared with the auxiliary models, it is likely that some unobserved factor is affecting prices in HOPDs.
Results
Table 1 presents descriptive statistics on the total number of ASCs, the average number of ASCs per county, and the average number of ASCs per 100,000 persons per county, by year. There was little entry between 2007 and 2010; the total number of ASCs grew only 1.2% (from 884 to 895). The mean number of ASCs per county was 5.04 in 2007 and 5.38 in 2010. While the number of ASCs did not grow significantly over the 4 years, there was a wide distribution across counties. Approximately one third of counties had no ASCs; 10% had 12 or more ASCs in 2007 and 13 or more in 2008-2010. Preliminary regression analyses that included county-level fixed effects indicated that there was too little variation in the ASC variable over time to generate estimable results. 3
Distribution of Ambulatory Surgery Centers (ASCs) Across Counties by Year.
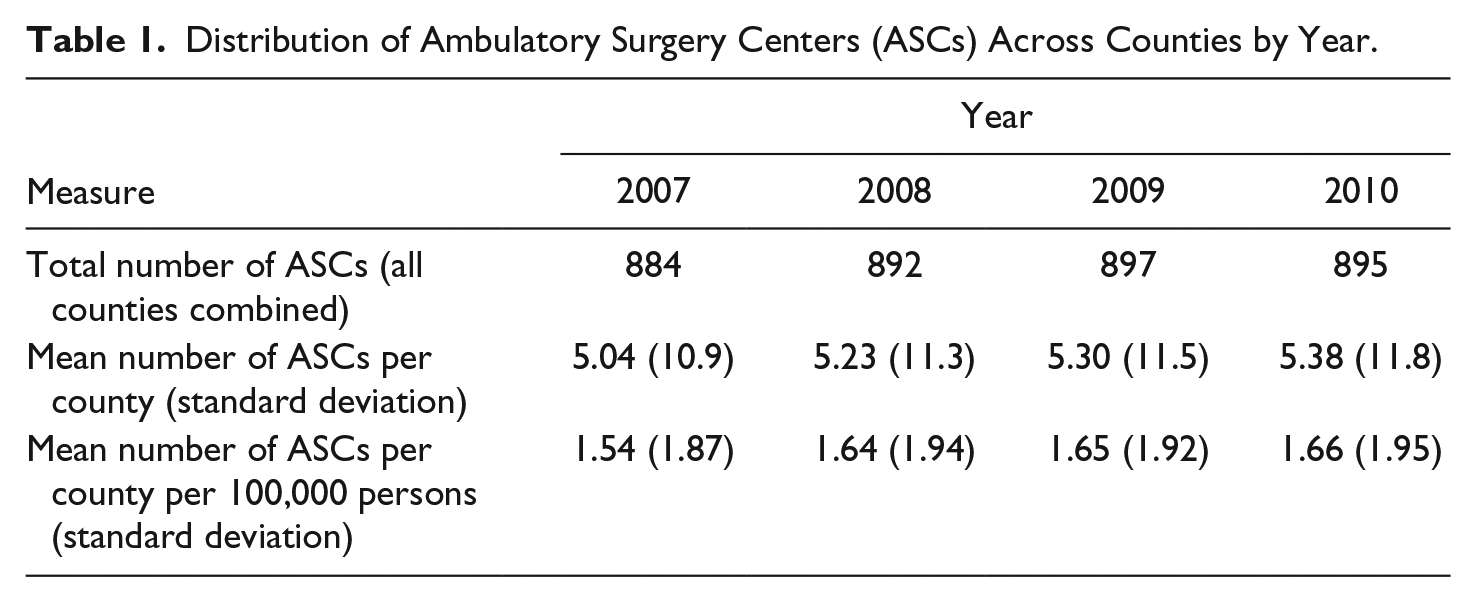
Table 2 displays descriptive statistics by procedure. Price, measured in 2010 dollars, ranges from a low of $1,088 for upper GI endoscopy to $2,139 for knee arthroscopy. The number of ASCs per 100,000 persons in the county is in the range of 1.69 (cataract surgery) to 1.98 (knee arthroscopy).
Descriptive Statistics: Mean (Standard Deviation) by Procedure.

Note. ASC = ambulatory surgery center; HOPD = hospital outpatient department; GI = gastrointestinal; IOL, intraocular lens.
The full set of generalized linear model parameter estimates are displayed in Table 3. The key independent variable, number of ASCs per 100,000 persons, was negatively and significantly associated with price in all four cases, indicating that HOPDs located in markets with higher ASC presence had lower prices than markets with relatively low ASC presence, as shown in Columns 2 to 5. In the counterfactual models indicated in Columns 6 and 7, however, there was no association between prices and ASC presence.
Results of Regression of Hospital Outpatient Department Prices on Number of Ambulatory Surgery Centers (ASCs) in the Market: Mean (Standard Deviation).
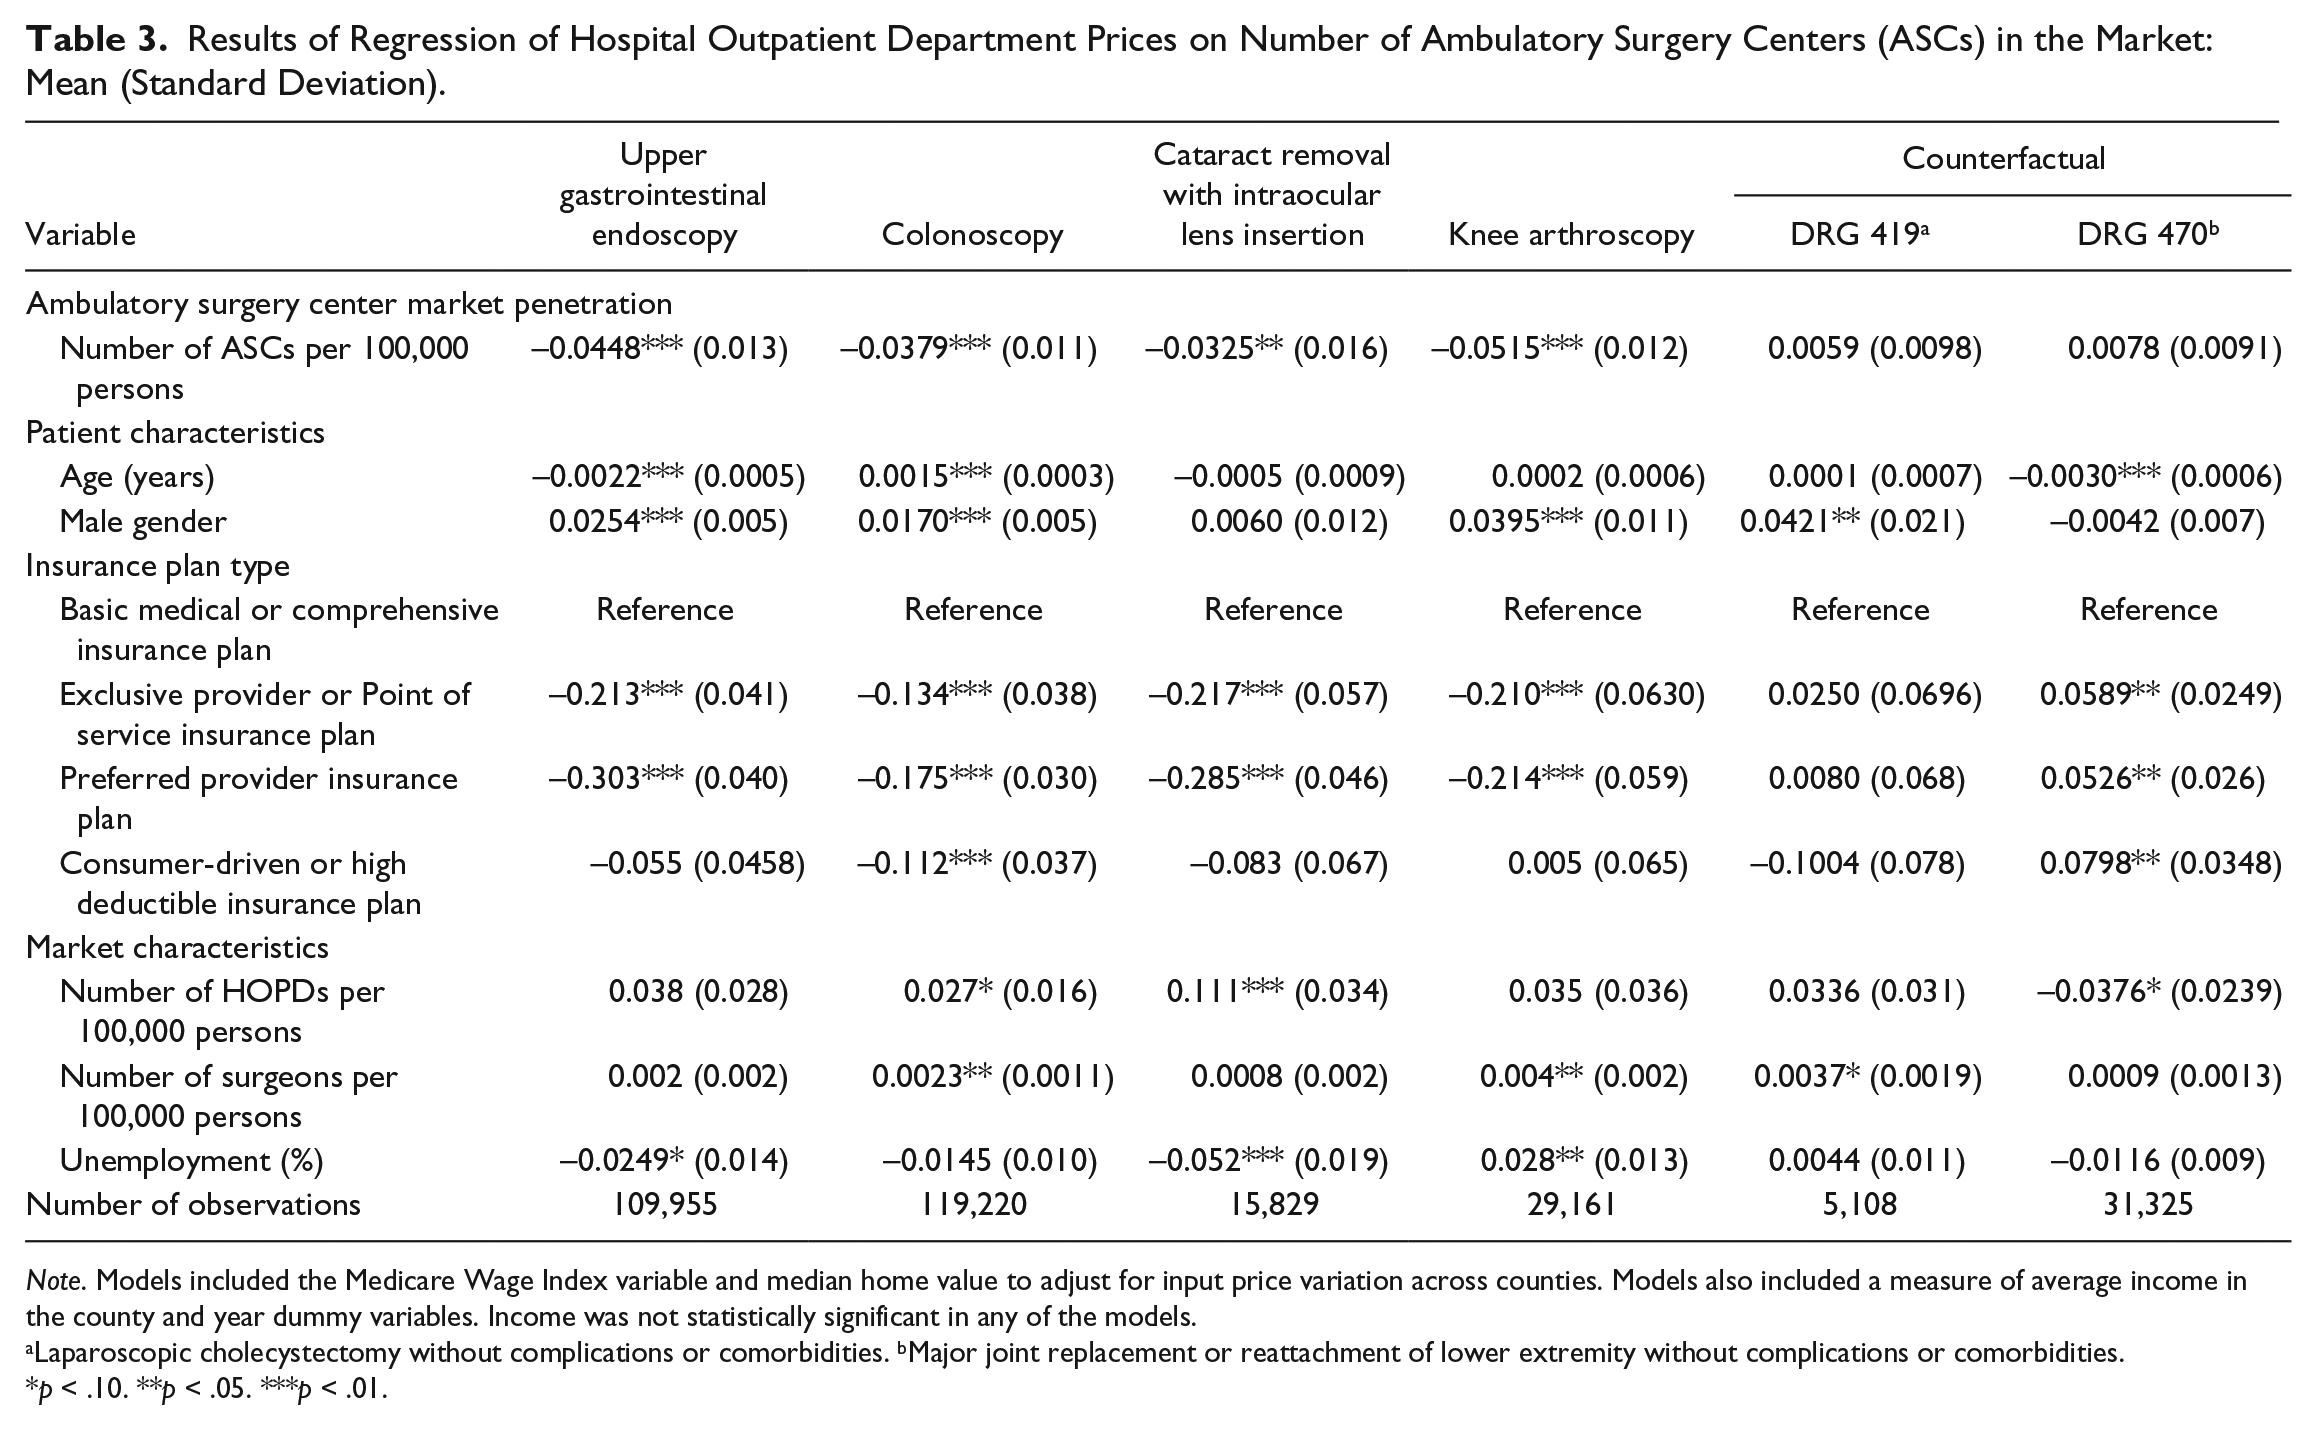
Note. Models included the Medicare Wage Index variable and median home value to adjust for input price variation across counties. Models also included a measure of average income in the county and year dummy variables. Income was not statistically significant in any of the models.
Laparoscopic cholecystectomy without complications or comorbidities. bMajor joint replacement or reattachment of lower extremity without complications or comorbidities.
p < .10. **p < .05. ***p < .01.
Table 4 presents an interpretation of results for variables that were significantly associated with price at a confidence level of 90% or greater. The main interest is in the marginal effect of ASCs on price. Because price is measured in natural logarithm, the estimate can be interpreted as the proportional difference in price associated with a one-unit increase in the number of ASCs per 100,000 persons. This translates to lower prices in HOPDs associated with ASC presence. For a one-unit increase in the number of ASCs per 100,000 persons, we observe 4.48% lower prices for upper GI endoscopy, 3.79% lower prices for colonoscopy, 3.25% lower prices for cataract surgery, and 5.15% lower prices for knee arthroscopy. Taking upper GI endoscopy for an example, the mean value of ASCs is 1.77 per 100,000 persons: A HOPD located in a county with 2.77 ASCs per 100,000 persons (a one-unit increase over the mean value) would be expected to have upper GI prices that were 4.48% lower than a county with the mean number of ASCs, controlling for patient and market characteristics.
Association of Ambulatory Surgery Center (ASC) Presence on Prices Paid to Hospital Outpatient Departments.
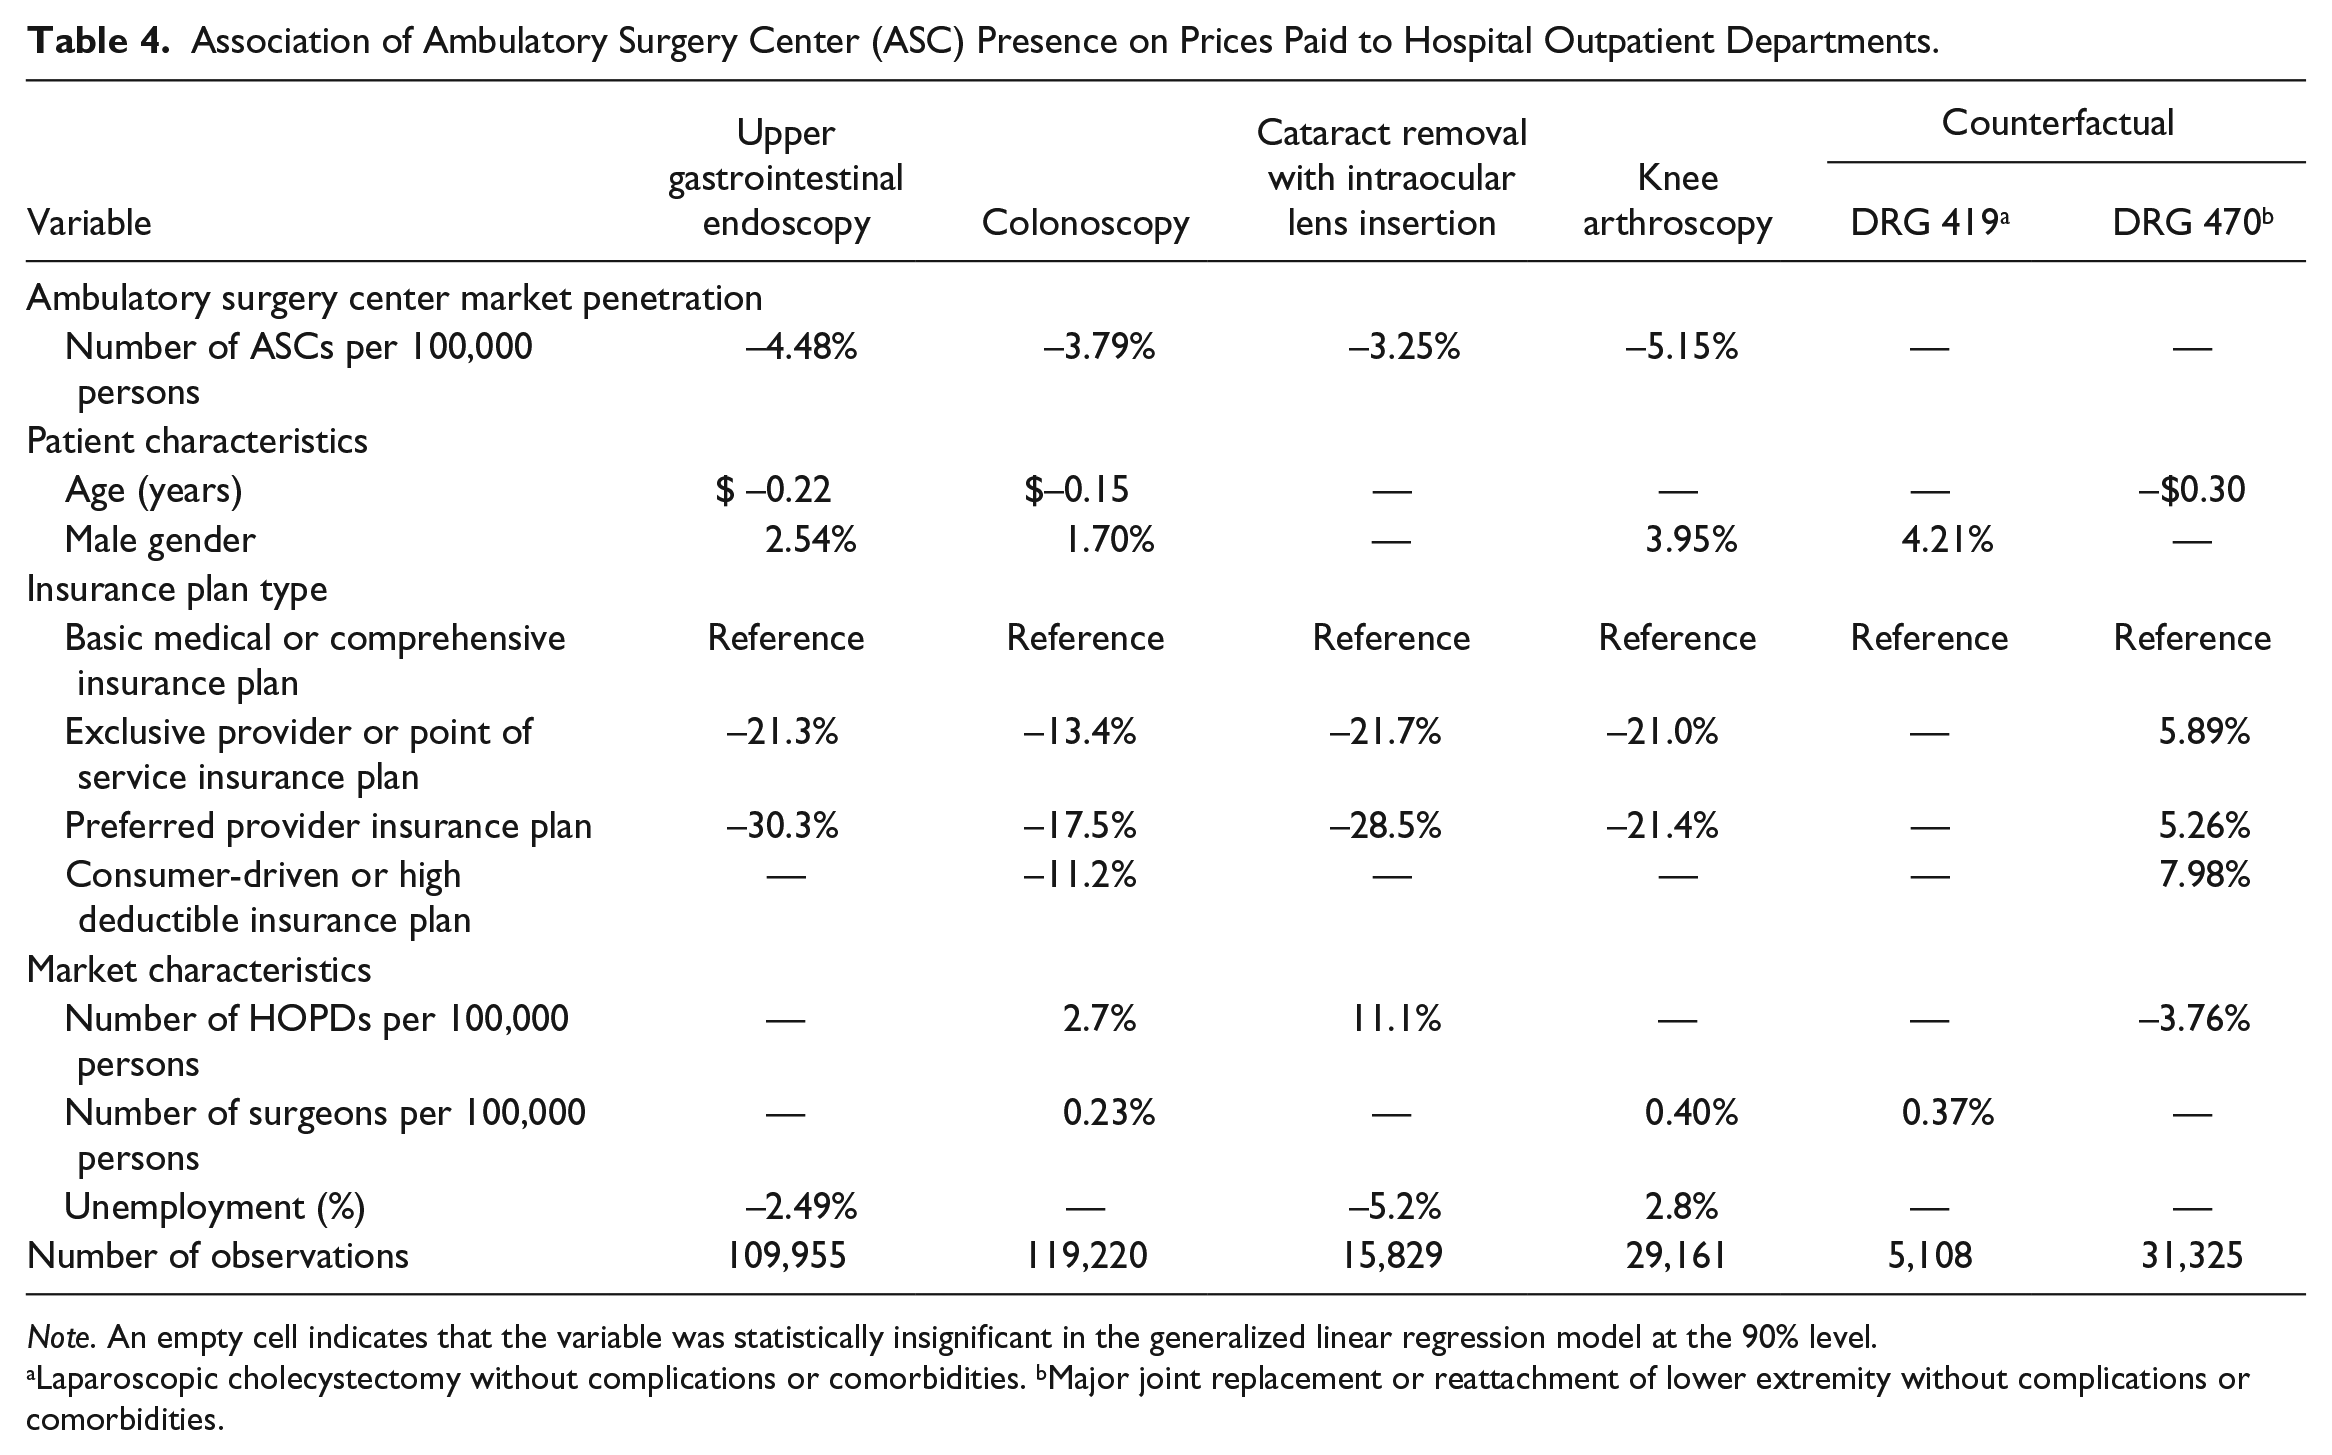
Note. An empty cell indicates that the variable was statistically insignificant in the generalized linear regression model at the 90% level.
Laparoscopic cholecystectomy without complications or comorbidities. bMajor joint replacement or reattachment of lower extremity without complications or comorbidities.
In the main regressions, age was negatively associated with price for endoscopy and colonoscopy, but not by a meaningful magnitude. Prices for male patients were higher than for female patients for three of the four procedures. Prices for exclusive provider, point of service, or preferred provider plans ranged from 13.4% to 30.3% lower than prices in traditional health plans (excluded reference group), as expected. Consumer-driven and high deductible plans had lower prices only for colonoscopy: 11.2% lower than for traditional health plans.
Among market-level variables, in the interest of price competition, HOPD and surgeon market concentration are of particular relevance. For HOPD concentration, there was a positive association with price for colonoscopy and for cataract surgery. Colonoscopy prices in an HOPD located in a county with 2.12 HOPDs per 100,000 persons are estimated to be 2.7% higher than in an HOPD located in a county with the mean value of 1.12 HOPDs per 100,000 persons. For cataract surgery, a HOPD located in a county with 2.18 HOPDs per 100,000 persons is estimated to have prices that are 11.1% higher than HOPDs located in counties at the mean value of 1.18 HOPDs per population. The number of surgeons (general plus orthopedic) per 100,000 persons in the county was associated with a small (0.20%) increase in colonoscopy prices and a small (0.40%) increase in cataract surgery prices, but was not significantly associated with prices for the other two procedures.
Discussion
The shape of competition in the hospital industry is changing. Providers who specialize in services that traditionally were provided only in full-service hospitals are an important part of that landscape. Supporters are making the claim that by focusing on a single disease or line of service, specialty providers can achieve greater efficiencies and lower costs than full-service hospitals, and that they represent a new competitive benchmark for efficient delivery of health care (Carey et al., 2011; Schactman, 2005). But specialty providers are not without their critics, who point out that they largely are owned by the physicians who practice in them, select less complex patients (Barro, Huckman, & Kessler, 2006; Cram, Rosenthal, & Vaughan-Sarrazin, 2005; Hollingsworth et al., 2009; Trybou, De Regge, Gemmel, Duyck, & Annemans, 2014), and may drive utilization (Courtemanche & Plotzke, 2010; Mitchell, 2007). To date, the case that specialty providers are a meaningful force in promoting improved performance in full-service competitors has not been made.
ASCs are key players in the growing wave of specialty providers. Recent studies have found production cost efficiencies in ASCs (Munnich & Parente, 2014; Trentman et al., 2010) and there is some evidence of ASC spillover effects driving lower costs in competing HOPDs in three states (Carey et al., 2011). This study has taken a fresh look at the impact of ASCs by examining whether there is evidence of price competition between ASCs and HOPDs, using a sample that includes markets from all 50 states. To the extent that a market has high ASC penetration, a HOPD may have less negotiating leverage with commercial insurers on price, resulting in relatively lower HOPD prices. For all four procedures examined, I found lower prices in markets with more ASCs per capita. However, two counterfactual exercises found no differences in prices across counties with different levels of ASC presence. Taken together, these results provide moderate support for the presence of price competition between ASCs and HOPDs.
There are limitations to this work owing to restrictions in the data. First, the measure of number of ASCs in a market includes all ASCs, not the number of ASCs specializing in gastroenterology, ophthalmology, or orthopedic surgery. Second, for approximately 16% of ASCs, a hospital or hospital system has partial ownership in a joint venture with physician owners, according to the best available estimate, and for 3%, a hospital has total ownership (Ambulatory Surgery Center Association, 2007). For such facilities, competitive model incentives may diverge from the conceptual framework. However, given the relatively small number, I consider this to be a minor threat to validity. Third, the data did not contain information on insurance market concentration, a supply side factor that could account for a portion of variation in prices across markets.
Finally, from a methods perspective, it should be noted that these are the results of an observational study. Absent a randomized controlled experiment, examining the effect of variables of interest on outcome variables is subject to bias to the extent of correlation between measured variables and omitted variables that are significantly associated with the outcomes variables. The counterfactual exercise addresses this issue, but not fully. Moreover, because of data availability, the time period of study here was restricted to 4 years during which there was only a small amount of ASC market entry, limiting the longitudinal variation in ASC presence from which effects could be inferred. Further research that uses a longer time span during which there was more ASC entry would go farther toward establishing causality as it would purge any endogeneity bias stemming from county characteristics that were stable over time.
While these results provide evidence in support of the competitive potential of ASCs to exert downward pressure on prices paid to HOPDs, some cautionary notes are in order. This study has not examined prices in ASCs, which may relate to relatively high profitability. One study found that higher profit surgeries have a higher probability of being performed in an ASC than in a HOPD (Plotzke & Courtemanche, 2011). In Pennsylvania, for which ASC profit margins are publicly available, the statewide average operating margin in fiscal year 2011 was 24.9%. It is unclear to what extent ASC growth relates to relatively high ASC prices. Moreover, ASCs have not been subject to the Stark laws that limit physician referrals, and an emerging literature provides evidence of higher utilization by ASCs (Hollingsworth, Krein, Ye, Kim, & Hollenbeck, 2011; Yee, 2011) and of selection of less complex patients into ASCs (Meyerhofer, Colby, & McFetridge, 2012; Yee, 2011).
To date, the majority of studies of specialty providers have focused on the Medicare population, for which payments are set administratively. The role of the commercially insured has received relatively little attention in the empirical literature. Because less than 20% of ASC revenue comes from Medicare, ASCs provide an informative setting for studying private sector price competition from specialty providers. Successful market function is going to be critical in achieving sustainability of health care reform. As price competition is at the dynamic core of that process, further study of the private sector role in the economics of health care reform will be very valuable.
Footnotes
Acknowledgements
The author acknowledges the comments of Stephen Parente and of Deborah Haas-Wilson.
Author’s Note
This study was approved by the Boston University Medical Center Institutional Review Board.
Declaration of Conflicting Interests
The author(s) declared no potential conflicts of interest with respect to the research, authorship, and/or publication of this article.
Funding
The author(s) disclosed receipt of the following financial support for the research, authorship, and/or publication of this article: This study was funded by a grant from the Agency for Health Care Research and Quality (Grant No. 1R03-HS23780-01; Kathleen Carey, principal investigator).