
Abstract
As hospitals’ interest in nurse practitioners (NPs) and physician assistants (PAs) grows, their leadership is eager to know how their medical staffing privileging policies for these professionals compare to peer hospitals. This study assesses the extent of variation of these policies in four clinical areas and examines whether the differences are associated with state scope of practice laws for NPs and PAs. We also examine the relationship of NP and PA privileging policies to each other. Our analysis finds no evidence that hospital privileging is associated with state scope of practice, and indeed within-state variation is more significant than cross-state variation. We also find a strong correlation between NP and PA privileging in all four clinical areas. These results suggest the need for additional research to understand the institutional-level variables and human dynamics at the level of medical staffing committees that may explain the dramatic variation in privileging policies and, ultimately, the effects of different privileging levels on costs and quality.
Introduction
Demand for hospital services continues to grow in the United States, despite payment reforms aimed at shifting care from hospitals to primary care and home-based settings (Center for Medicaid and Medicare Services [CMS], 2015). This increase raises multiple policy concerns, not the least of which is the shortage of nearly all types of physicians (Association of American Medical Colleges, 2016). In this context, expanded use of nurse practitioners (NPs) and physician assistants (PAs) is one way health care organizations are responding to the challenge of delivering high-quality care in a manner that ensures access and cost efficiency (Auerbach et al., 2013; Cronenwett & Dzau, 2010; Dunker, Krofah, & Isasi, 2014; Gottlieb & Emanuel, 2013; Health Resources and Services Administration, 2013).
For hospitals, the evidence supporting privileging of NPs and PAs as a medically safe policy is robust (Block & Norton, 2008; Haan et al., 2007; Kawar & DiGiovine, 2011; Oswanski, Sharma, & Raj, 2004; Shah et al., 2015; Singh et al., 2011). This phenomenon is facilitated by the increasing availability of NPs and PAs. Between 2006 and 2016, NP graduation rates more than tripled (from about 7,500 to 25,600), and those of PAs almost doubled (4,600 to almost 8,000) (Salsberg, 2015). A key driver of their increased utilization in hospitals was initially the limitation of residency workhours, enacted by the Accreditation Council for Graduate Medical Education in 2011 (Pastores et al., 2011). Expansion of capitation and shared-risk contracts, such as Accountable Care Organizations, between hospitals and payers may also be increasing the interest in NPs and PAs, because the reduced payment for these providers’ services (85% for Medicare) becomes less relevant in the context of valued-based payment arrangements. Understanding how to incorporate these professionals into health care teams is therefore of great interest to hospital administrators.
Until now, most of the policy debate on integrating these providers has focused on reforming state scope of practice (SOP) laws, viewed by many as the primary barrier hindering NPs’ and PAs’ ability to practice at the top of their education (Dunker et al., 2014; Fairman, Rowe, Hassmiller, & Shalala, 2011; Institute of Medicine, 2011). The growing pressure to reform SOP laws was heightened by the 2010 Institute of Medicine report on the Future of Nursing, which recommended full SOP for nurses. Since then, the number of states with full SOP for NPs has gone from 16 to 22, and many other states have made incremental reforms moving them beyond restricted practice (American Association of Nurse Practitioners, 2017). Similarly, PAs’ SOP has expanded, with significant actions taken in nine states in 2016 and a new focus by PA professional organizations to change state SOPs in order to allow PAs to work collaboratively in teams without the requirement to have a specific relationship with a physician in order to practice (Walker, 2016).
As more states reform their SOP laws, the question becomes whether health care organizations are actually changing the way they use PAs and NPs. Major leadership organizations are recommending expansion of privileging to these professionals, as well as their inclusion on the medical staff committees that make these decisions (Brush et al., 2015; Haan et al., 2007; National Governors Association, 2014). Empirically, however, we still know very little about whether the significant progress in the area of state SOP laws is changing the extent to which organizations privilege NPs and PAs. Several qualitative studies at the primary care level concluded that organizational policies may matter as much as, if not more, than legal SOP barriers in determining how these professionals are utilized (Poghosyan, Nannini, Smaldone, et al., 2013; Poghosyan, Nannini, Stone, & Smaldone, 2013; Schadewaldt, McInnes, Hiller, & Gardner, 2013; Yee, Boukus, Cross, & Samuel, 2013). But evidence on hospital privileging of NPs and PAs remains scarce. To our knowledge, there is just one recent study on privileging. Using the National Sample Survey of NPs, a study prepared for the Office of the Assistant Secretary for Planning and Evaluation found that approximately 14% of NPs in urban areas and 23% of NPs working in isolated rural towns were estimated to have hospital admitting privileges. Other types of privileges were not included. Notably, the authors did not find an association between admitting privileges and SOP laws (Westat, 2015).
As hospitals’ interest in NPs and PAs has grown, hospitals are expressing interest in learning how their privileging policies compare with those of peer hospitals. Indeed, this was the impetus for the creation of The Center for Advancing Provider Practices (CAP2) in 2014 by the Illinois Health and Hospital Association and Vizient, Inc., now solely operated by Vizient.
New Contribution
In this study, we provide a first glimpse into the complex topic of “who is allowed to do what” as a result of our access to the unique proprietary data developed by CAP2. Clinical and operational executives developed CAP2 to inventory where and how NPs and PAs were being used and to benchmark themselves against other hospitals. The initiative included longitudinal surveys of participating hospitals interested in benchmarking their NP and PA management policies against one another. We used one of their five survey instruments in this study, which focused specifically on core and specialty privileging for NPs and PAs. Other CAP2 instruments include organizational assessments for advanced practice professionals in acute care, ambulatory care and practice sites, and an assessment of advanced practice leadership structures.
These data allow us to better understand the variation in NP and PA roles in acute care settings across the country. As detailed below, we use the data to develope our own set of privileging scales in four clinical areas. We were thus able to describe the variation within and across states by clinical areas, analyze the relationship of SOP laws to privileging policies, and measure the association of privileging accorded to the two professions in the four clinical areas.
Conceptual Framework
This study focuses on the extent and the variation of hospital privileging for NPs and PAs and whether there is a relationship between state SOP laws for these professions and hospital privileging practices. Secondarily, we examine the relationship between privileging for these two types of advanced practice providers. At the center of these issues lie the concepts of professionalism and how organizations sustain professional dominance (Friedson, 1970a).
The sociological theory of professions posits that a profession is a self-conscious group with control over its work (Friedson, 1970a). Medicine meets the definition of a profession because it maintains minimal educational standards for acceptance into the field and control over the technical expertise of medicine. Medicine has maintained control of the technical aspect of its work through policies that protect autonomy of judgment for the technical aspect of medicine, as well as through self-regulation.
Within health care, medicine is the dominant profession, providing its control over the activities of other professions (Friedson, 1970b). Because of the technical expertise they must adquire, doctors have been granted a special status that provides them with the exclusive right to practice medicine. This right gives doctors and their professional organizations control over the social and economic organization of the work associated with medical care. With this control, doctors and their professional organizations have significant influence on the division of labor and the functions of other health professions.
The theory of professions postulates that key to the maintenance of a dominant profession, such as physicians, is the development of rules that exclude or control other professionals, or in this case providers (Friedson, 1970a). Control over the division of labor occurs at multiple policy levels. Whereas certifications are functions that are usually delegated by government to professional organizations, and specific changes to practice laws must be approved by state legislatures, hospitals are still responsible for credentialing professionals and, once credentialed, determining whether an individual is allowed to carry out specific patient care services (Hravnak & Baldisseri, 1997). If physicians are dominant in these spheres of influence, one might expect, for example, that the SOP and organizational policies within a state would be consistent, and that the two professions (PAs and NPs) would be handled similarly.
Wide variation in the decisions of medical staff across hospitals with regard to privileging policies would suggest, however, that other contextual and interprofessional dynamics may also be at play. For example, the relative numbers of physicians, NPs, and PAs in a clinical unit; their length of time working together; and the gender and age distribution of each profession, among other factors, may influence the ways in which privileging policies are made. The resulting interprofessional dynamics could be compatible with the theory of professions, but would suggest the need for continued development of this framework in a more nuanced manner.
In this study, we are interested in examining the relationship of different levels of SOP laws with privileging policies, examining the degree of variation in privileging within and across states, and measuring the relationship of privileging between NPs and PAs in different clinical areas. Our expectation is that if there is no apparent relationship between SOP and privileging, and if there is wider variation in privileging policies within states than across states, then additional sociological aspects of interprofessional relations at the hospital level may be important explanatory factors. Although the purpose of this study is not to measure those additional variables, our findings will lay the groundwork for additional research that can examine how those dynamics vary across hospital settings, and identify key organizational variables associated with privileging of NPs and PAs.
Method
To address the question of variation in privileging across hospitals, we compiled 2014 data from three sources. The first is the CAP2 survey, which provides data on privileging by clinical area and certain hospital characteristics. As detailed above, CAP2 is a survey administered to hospitals that voluntarily participate in a program of benchmarking and technical assistance related to the appropriate management of NPs and PAs, including but not limited to their privileging. It is therefore a convenience sample. The data used for this study consisted of 213 hospitals spanning 34 states.
When compared with the American Hospital Association’s Annual Survey of Hospitals, our sample consists of hospitals that are larger than the national average (an average of 375 beds in CAP2 compared with 150 in all American Hospital Association hospitals), have a higher percentage of nonprofit hospitals (82% vs. 68%), and include fewer government hospitals (12% vs. 24%). Although the sample is not generalizable to all hospitals in the United States, this is not critical to our objective, which is focused primarily on the question of whether and how much variation exists in relation to SOP laws.
Within the CAP2 annual survey data, our study focuses on four clinical areas: (1) core (which includes general privileges that may apply to all providers), (2) emergency department (ED), (3) cardiology, and (4) orthopedics. These four were selected because they involve medical activities/procedures with a wide range of complexity and because they are known to be services that increasingly use NPs and PAs (Fraser, Morgan, & Johnson, 2016; Morgan, Everett, Humeniuk, & Valentin, 2016).
For information on NP SOP laws, we used the Pearson Report, a proprietary, state-by-state analysis of laws commonly used in NP SOP research (Pearson, 2014). For PA SOP laws, we used the American Academy of Physician Assistants’ (AAPA) Six Key Elements of State PA Laws (AAPA, 2016). Each profession’s SOP was categorized into a three-level categorical variable, recognizing that within these categories there is considerable variation. For NPs, the categorical variable depicting the degree of restrictiveness was based on whether physician involvement is needed to diagnose, treat, or prescribe (where 1 = least restrictive, no physician involvement required; 2 = moderate restriction, physician involvement needed to prescribe but not to diagnose or treat; and 3 = most restrictive, physician involvement need to prescribe, diagnose, and/or treat). See Supplemental Digital Content 1 for state SOP laws for NPs and PAs (Supplemental Digital Contents are available in the online version of the article).
For PAs, the AAPA has defined Six Key Elements that they believe should be a part of every state PA practice act. They are licensure as the regulatory term; full prescriptive authority; SOP determined at the practice level; adaptable supervision requirements; chart—signature requirements determined at the practice level; and the number of PAs a physician may supervise determined at the practice level. For each state, we created a continuous variable depicting the total number of key elements legislated by that state. We then categorized the number of key elements into “least restrictive” (five or six key elements), “moderately restrictive” (three or four key elements), and “most restrictive” (zero to two key elements). See Supplemental Digital Content 1 for state SOP laws for NPs and PAs.
For each institution, we calculated the total number of privileges included on the privilege list for PAs and NPs for each profession and each clinical area (core = 13, ED = 28, cardiology = 11, orthopedics = 10). See Supplemental Digital Content 2 for details on privileging. We report both absolute values and the percentage of the full score that is theoretically attainable for each profession in each clinical area.
We estimated the mean numbers and standard deviations of the privileging scores, as well as the mean privileging scores achieved as a percentage of the maximum possible scores (as defined in our scales), in each clinical area for each profession. We performed analysis of variance (ANOVA) tests to examine whether there were differences in mean scores among different levels of state SOP in each clinical area for NPs and PAs. Significance level was set at .05, with two-tail tests.
To assess whether the mean number of privileges for NPs and PAs varies significantly both across states and within states, we constructed multilevel regression models, controlling for hospital characteristics. This standard statistical approach allows us to understand how much of the variation of the mean privileges occurs at each level (i.e., state, organization, and specialty) (Leyland & Goldstein, 2001). Using robust standard errors, we controlled for hospital-level variables that were available in the data set: hospital bed size (small size: beds <100, medium size: beds ≥100 and <500, and large size: beds ≥=500); hospital ownership (nonprofit, for-profit, or government owned); whether or not a hospital functions as a teaching hospital; and whether or not it has Magnet Recognition status. About 7% of U.S. hospitals have Magnet status (American Nurses Credentialing Center, 2017), an accreditation that is awarded to hospitals that satisfy a set of criteria designed to measure the strength and quality of their nursing. We also controlled for the effect of NP and PA SOP on hospital privileges.
To evaluate the association between NP and PA privileging at hospital level, we conducted a multivariate linear regression analysis to model NP mean privileges in each clinical area as a function of PA mean privileges, controlling for NP and PA SOP, Magnet status, teaching status, and ownership. Models were weighted by number of beds to account for the effect of hospital size. Standard errors were clustered by hospital. Significance levels for all regression models were set at .05, .01 and .001, with two-tail tests.
Limitations
There are several limitations to this study. First, because we used a convenience sample with a relatively small number of hospitals, the findings are not generalizable. Because our sample is based on CAP2 hospitals that by definition have volunteered to participate in the benchmarking of NP and PA privileging and have expressed interest in receiving technical assistance on this issue, it is possible that the sample is biased in favor of higher privileging scores.
A second limitation is that the hospital characteristics are relatively limited; ideally we should have data on the composition of medical staffing committees, for example, profession, specialty, gender, age, as well as other organizational variables.
A third limitation of the CAP2 data is that though our focus was on NPs and PAs, the survey asks about advanced practice registered nurses in general. The CAP2 team acknowledges that this could include a few clinical nurse specialists (CNS)—another type of advanced practice nurse—who would not be distinguished in the data from NPs. However, reports on CNS’ areas of specialty suggest that it is rare for CNS to be working in the clinical areas that are the focus of this study (American Association of Nurse Practitioners, 2016; National Association of Clinical Nurse Specialists, 2004). Similarly, no certified nurse midwives would be included in the selected clinical areas.
A fourth limitation is that the CAP2 data are self-reported by hospitals. Despite the self-reporting, however, the CAP2 team believes that hospitals have no incentive to bias their response in either direction, because they have elected to be part of this learning collaborative and its primary purpose is to provide access to confidential benchmarking and technical assistance.
A final limitation is the use of a summative measure for privileging, which may not capture the relative importance of particular tasks within the measure. To address this, we conducted sensitivity analyses on the privileging measures to determine if specific types of tasks within the privileging categories (i.e., invasive vs. noninvasive procedures) disproportionately affected our results. The results from these analyses show that this is not the case, lending validity to our summative privileging measures.
Results
State SOP Laws and Hospital Privileging by Clinical Areas
Table 1 displays descriptive statistics by state SOP (least, moderately, and most restrictive), clinical areas, and professions. The results of this cross-tabulation suggest, first, that the average NP and PA privileging levels in 2014 in this sample are far below the levels allowable by the education of these professionals in all four clinical areas, although there are individual hospitals that achieved full scores (data not shown). Second, the descriptive analysis does not reveal a relationship between less restrictive SOP and less restrictive privileging policies; that is, in states with the most-restrictive SOP laws, we do not observe more restrictions on privileging, nor do we see a higher average number of privileges for NPs or PAs in states with the most permissive SOP laws.
Descriptive Analysis of Hospital Privileging and SOP Status, by Profession and Clinical Areas, 2014.
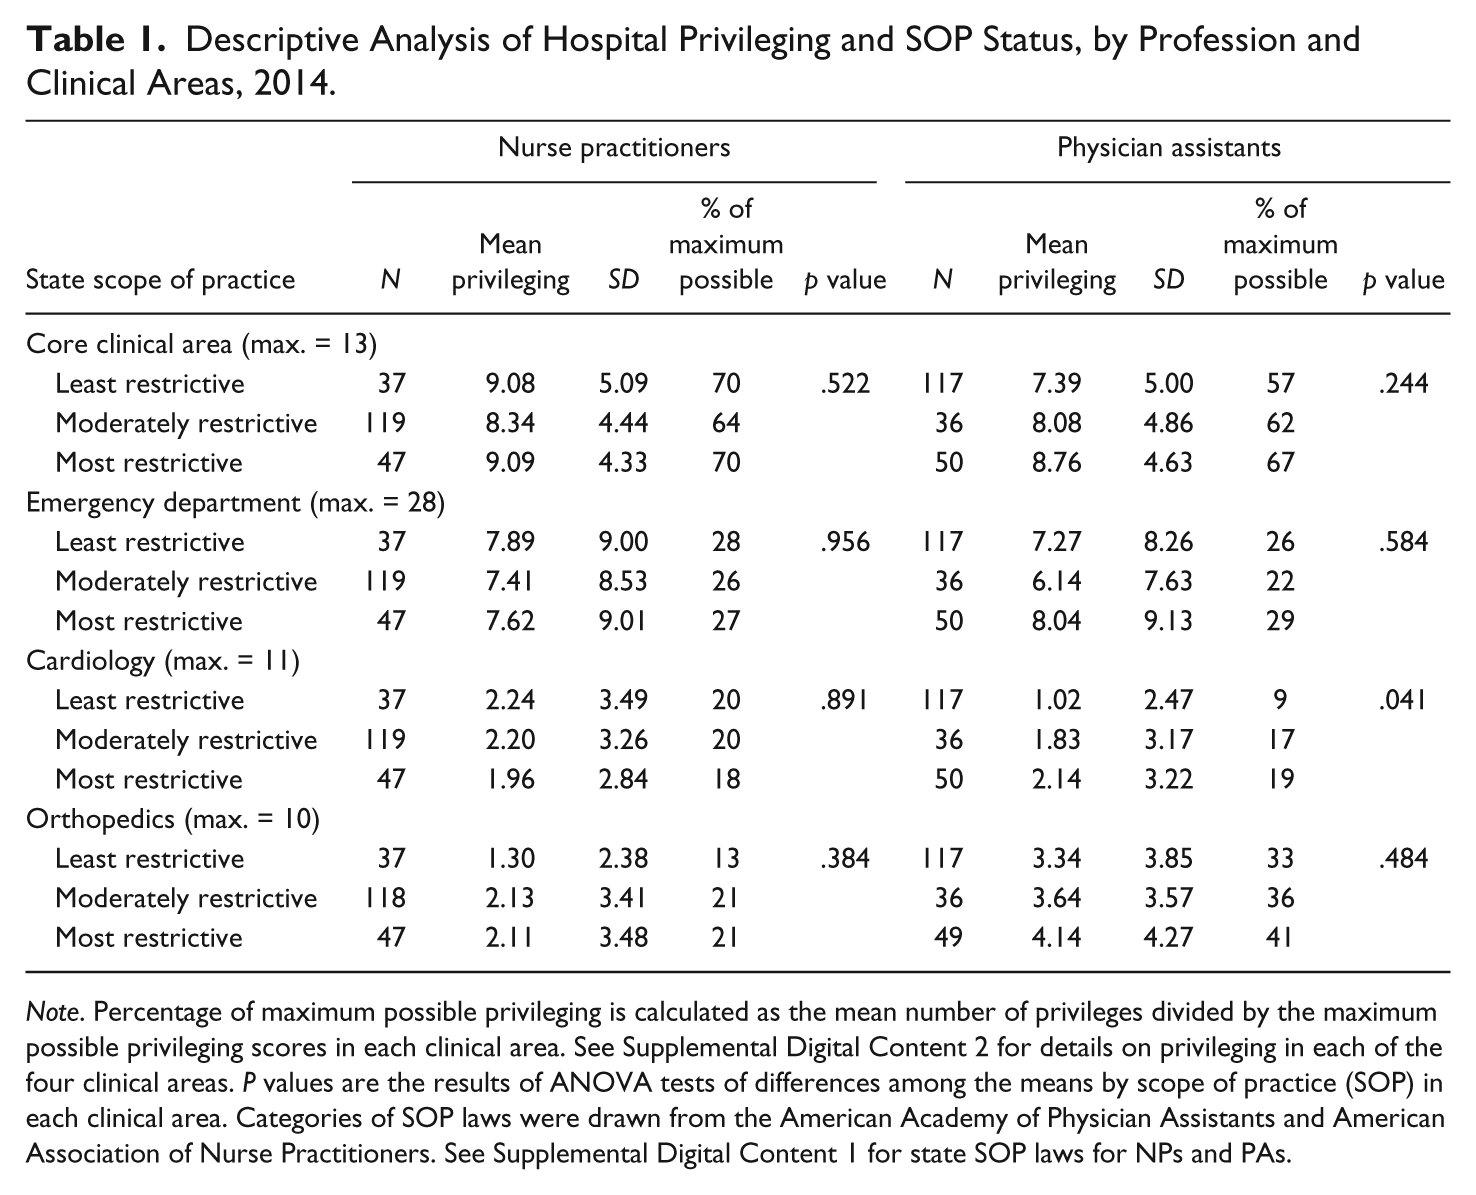
Note. Percentage of maximum possible privileging is calculated as the mean number of privileges divided by the maximum possible privileging scores in each clinical area. See Supplemental Digital Content 2 for details on privileging in each of the four clinical areas. P values are the results of ANOVA tests of differences among the means by scope of practice (SOP) in each clinical area. Categories of SOP laws were drawn from the American Academy of Physician Assistants and American Association of Nurse Practitioners. See Supplemental Digital Content 1 for state SOP laws for NPs and PAs.
To facilitate the comparison across clinical areas, in addition to the number of privileges in each area, we also report privileges as a percentage of the total number of privileges possible based on the scales we developed (see Supplemental Digital Content on Privileging), and we provide data on the standard deviations of the means within each category of state SOP by clinical area and profession.
As seen in Table 1, we find that “core” privileging has the highest scores for both professions in this sample, ranging from 57% to 70%, with NPs receiving slightly higher privileging than PAs. ED follows, with scores ranging from 22% to 29%. Orthopedics allows just 13% to 21% for NPs, whereas PAs score higher at 33% to 41%. Cardiology has the lowest privileging scores for both groups, with NPs again slightly higher than PAs. Within clinical areas, only PA privileging in cardiology has significant differences across states by SOP laws, but the relationship appears to be the inverse of what might be expected; that is, the least-restrictive SOP states have the lowest, rather than the highest, privileging scores.
Variation in Hospital Privileging Scores Within and Across States
In Table 2 we further explore the variation in hospital privileging policies within and across states using a multilevel model, controlling for hospital characteristics and state SOP. We find significant variations across hospitals within states for all four clinical areas in our sample. Cross-state variations are only significant for PA privileges in core and ED. Consistent with the results from the descriptive analysis, we do not find significant results of the effect of state SOP on either NP or PA mean privileges, despite a marginal significant effect of NP SOP on PA privileges in ED. Whereas hospital bed size, magnet status, and teaching status are significant in some areas, ownership status is not significant in any area. These results suggest that hospital-level factors that we are not able to account for in this data set, such as organizational and interprofessional factors, and possibly additional contextual factors, may be important determinants of hospital privileging for NPs and PAs.
Multilevel Regression Analysis of Within- and Across-State Variations in Hospital Privileging Scores by Professionals, 2014.
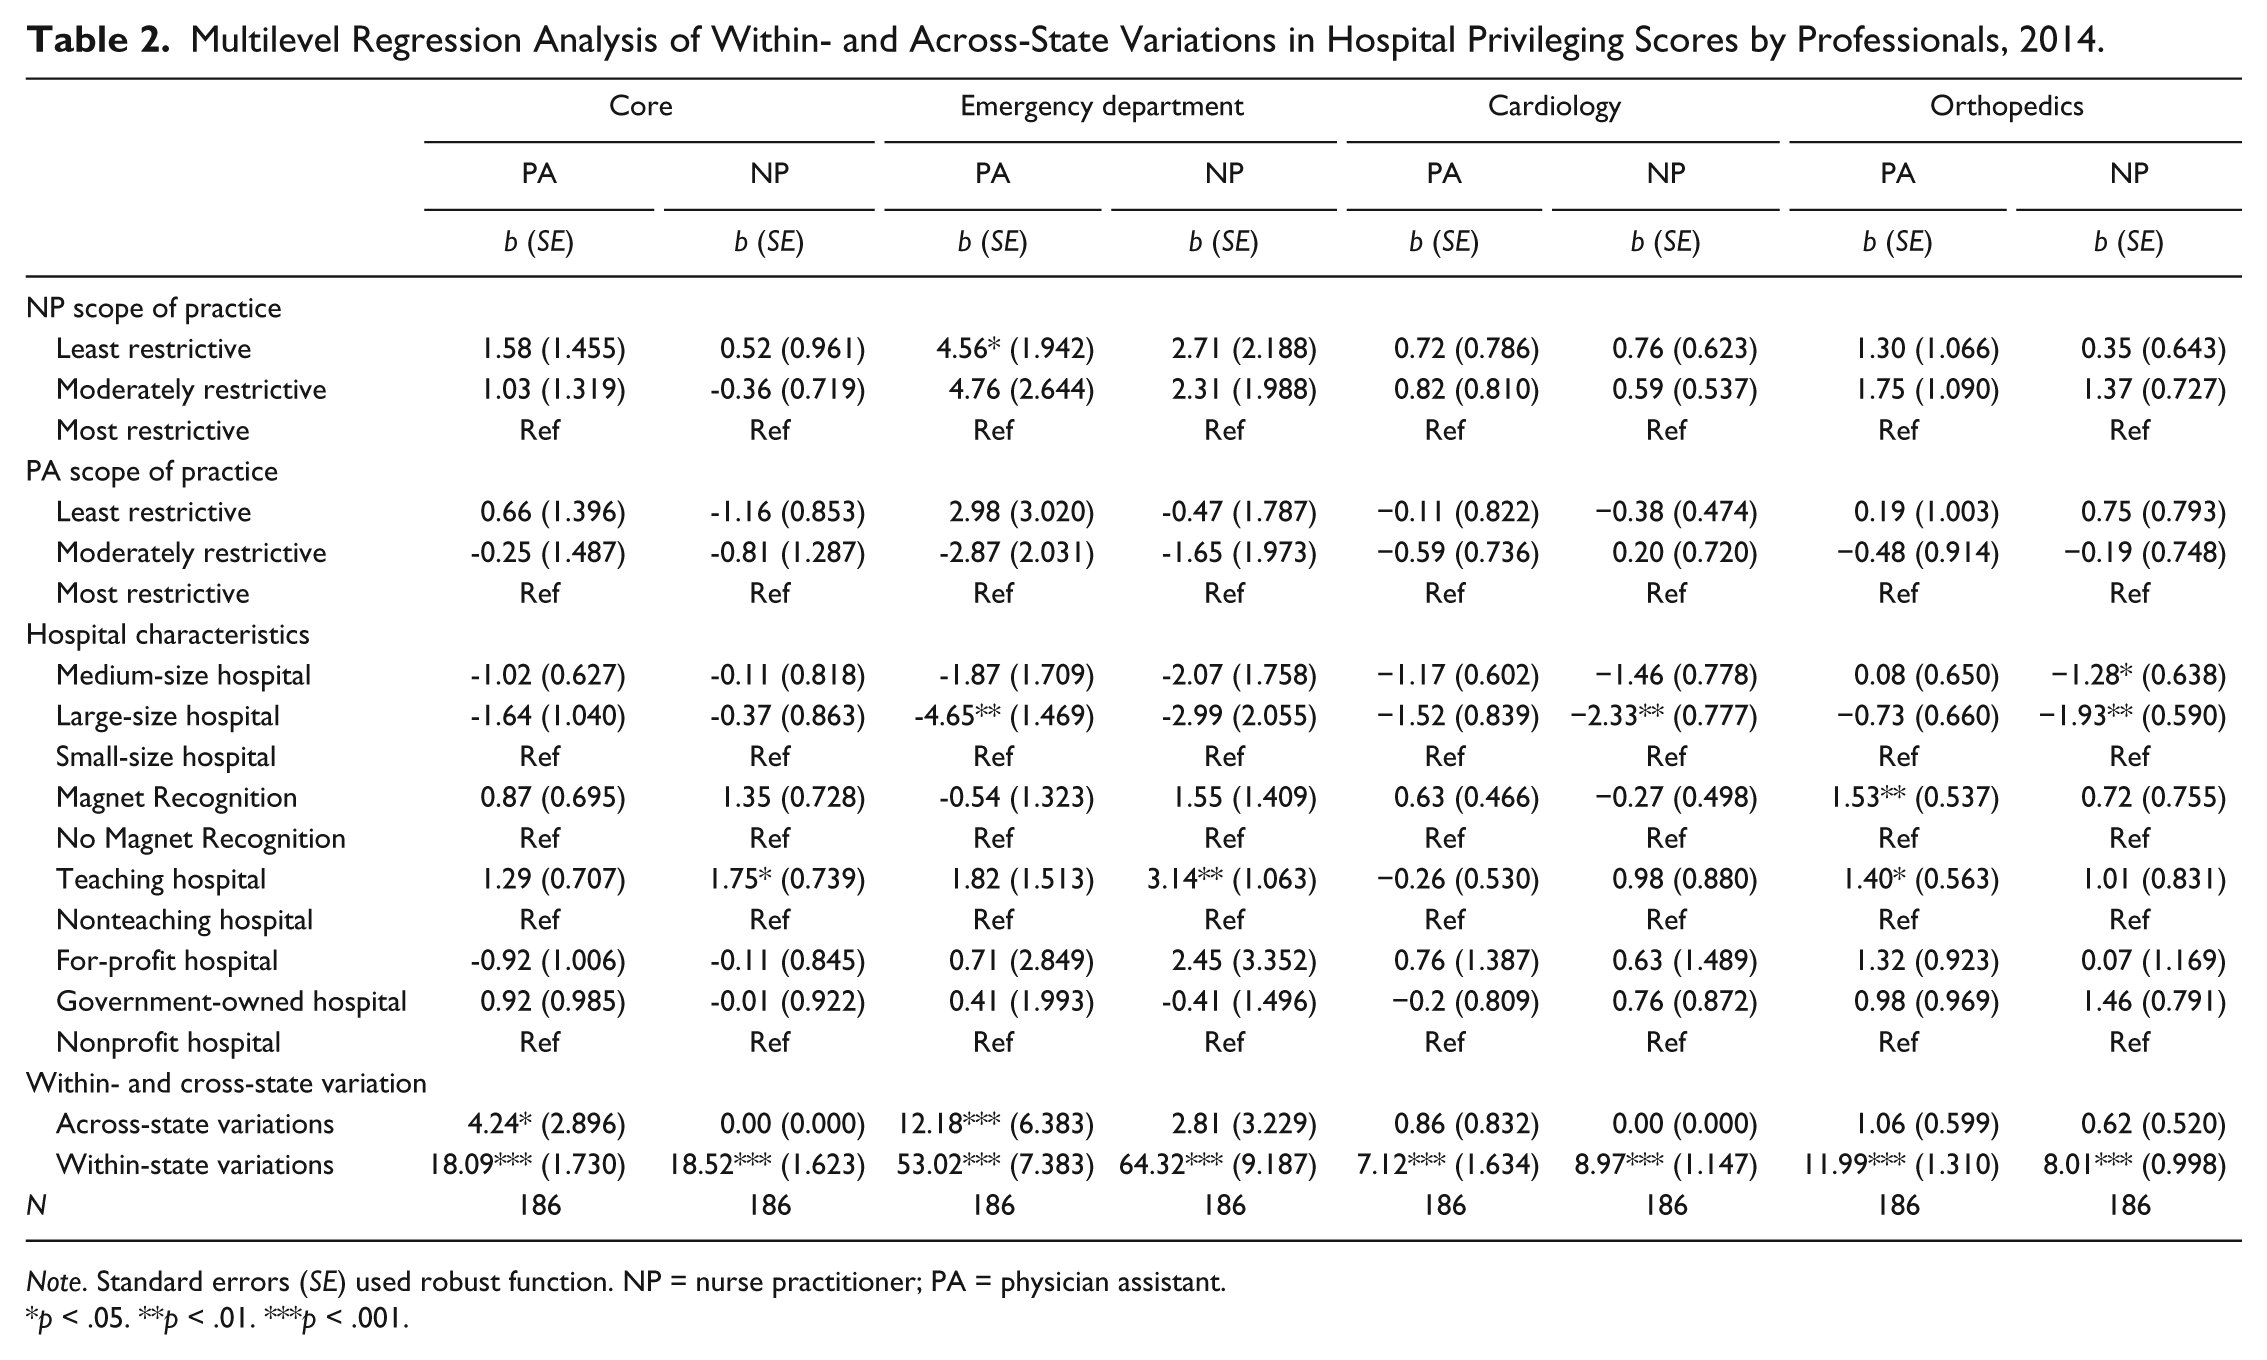
Note. Standard errors (SE) used robust function. NP = nurse practitioner; PA = physician assistant.
p < .05. **p < .01. ***p < .001.
The Relationship Between NP and PA Privileging
Our final analysis examines the relationship between NP and PA privileging at the hospital level. As presented in Table 3, the results of our multivariate regression analysis indicate a robust relationship between the privileging policies for the two professions in all four clinical areas, after accounting for hospital characteristics and state SOP. Almost no significant results were found in terms of the effects of state SOP and hospital characteristics on NP privileging. The overall adjusted r2 values demonstrate that about 40% to 60% of the variations in outcomes are not explained by these models.
Multivariate Regression Results of the Association Between NP and PA Privileging by Clinical Areas, 2014.
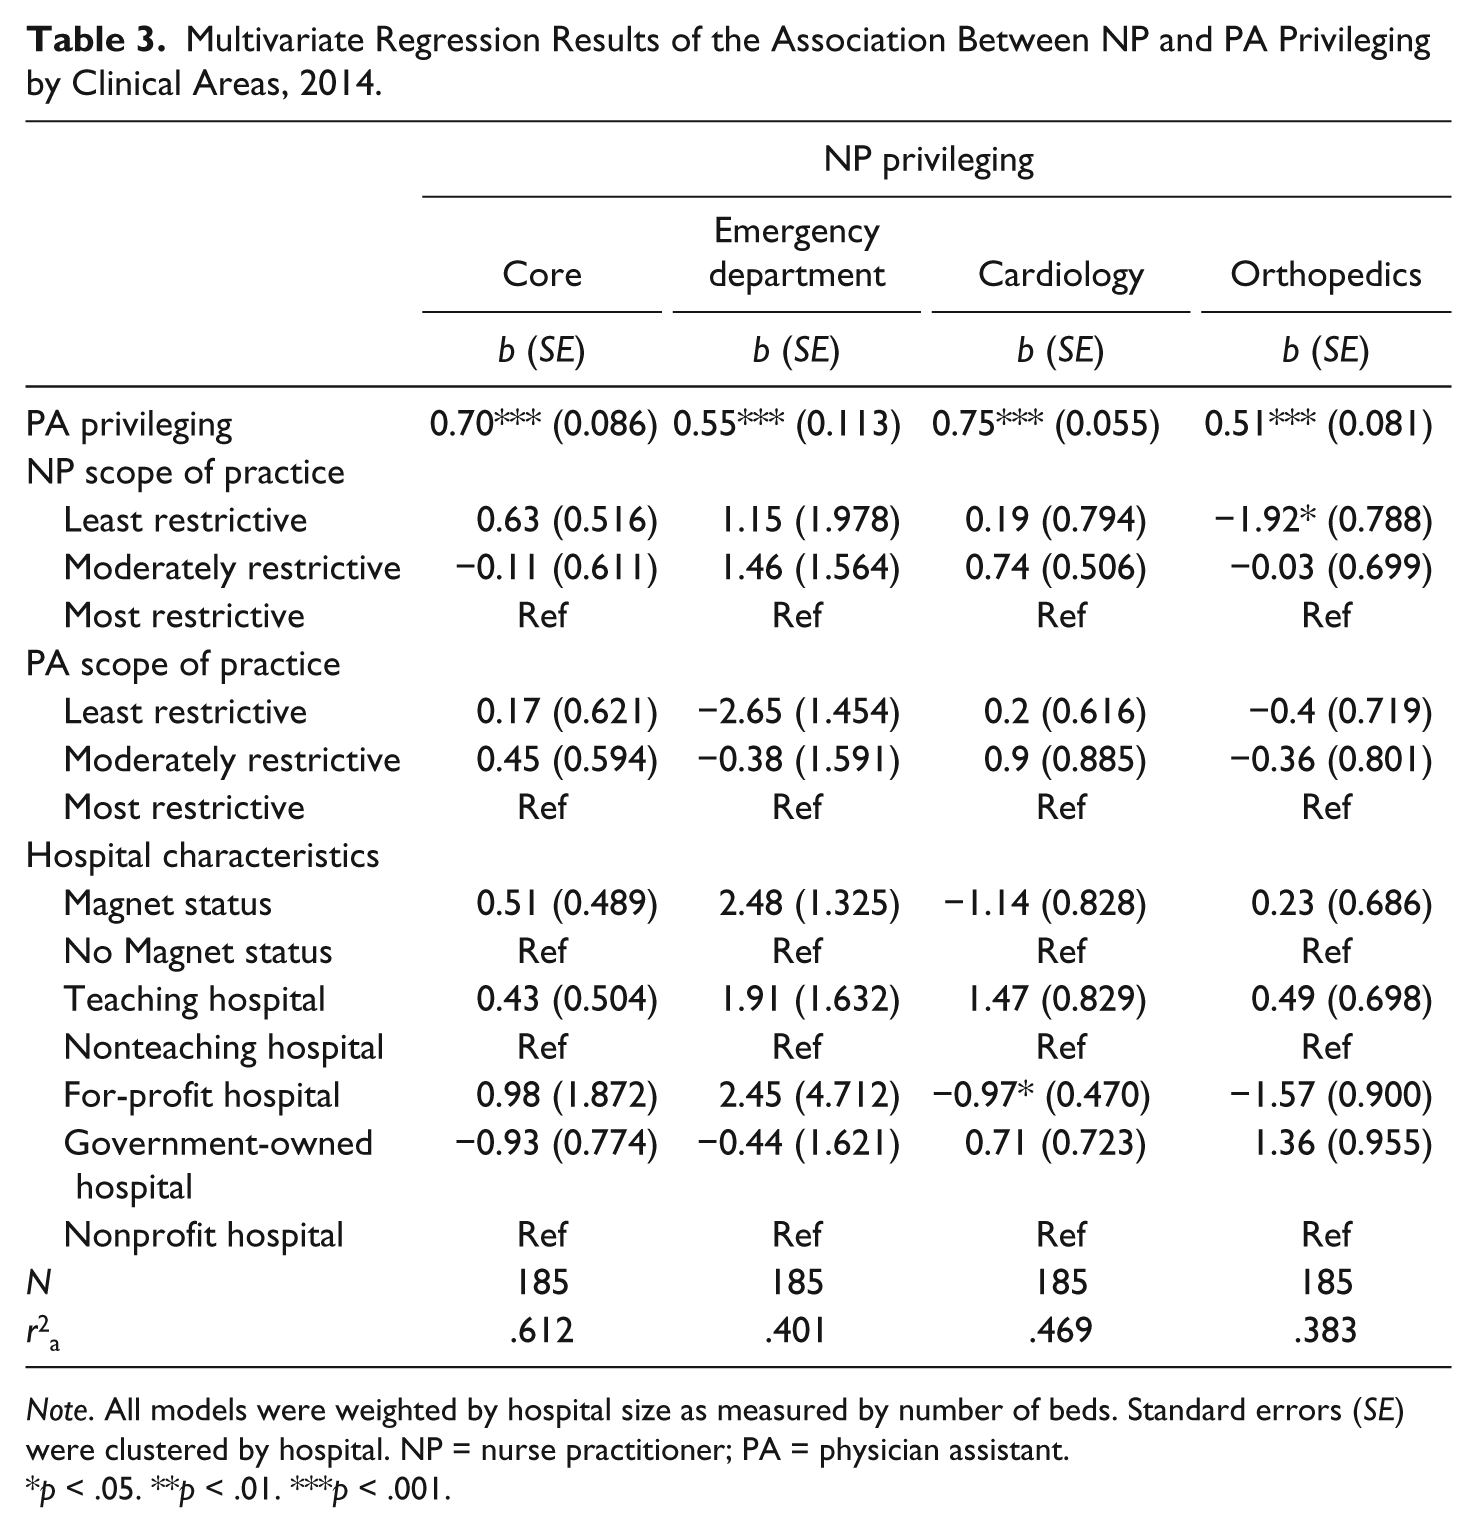
Note. All models were weighted by hospital size as measured by number of beds. Standard errors (SE) were clustered by hospital. NP = nurse practitioner; PA = physician assistant.
p < .05. **p < .01. ***p < .001.
Discussion
The CAP2 data provide a unique source of information that allows us to assess hospitals’ privileging policies. Within this sample, we find wide variation in hospital privileging policies for NPs and PAs at the hospital level and no evidence that SOP laws are associated with privileging policies. Across all states and all four clinical areas studied, NP and PA hospital privileging scores are far below their potential from the perspective of what is allowable based on their education. Not surprisingly, the highest privileging scores are in the core clinical area, given that these are not tasks associated with any one specialty area. Cardiology is the area in which we find the lowest scores for both professions. Although a partial explanation may be that procedures are more complex in specialty areas (leading medical staffing committees to be more conservative in their decisions), this would not explain the wide variation in specialty privileging levels across hospitals.
The absence of evidence of a relationship between state SOP levels and hospital privileging scores for either NPs or PAs is striking. Indeed, some hospitals in the least-restrictive states have highly restrictive privileging practices, and conversely, some of the highest number of privileges are granted by hospitals in states with the most-restrictive SOP laws. The possible exception is for NPs in orthopedics and EDs in moderately restrictive states. It is possible that the higher percentage of PAs as compared to NPs in orthopedics could lead to physicians being more comfortable working with PAs in this model of care and granting them more privileges (AAPA, 2016; Morgan et al., 2016). Because this is the only area in which differences are significant, we assume that there may be other factors at play in moderately restrictive SOP states, such as local supply of NPs and PAs, as well hospital-level variables, such as the percentage of NPs and PAs on the staff and medical staffing committee composition. Our multivariate regression analysis further does suggest that the variation in privileging scores may be explained by factors that are not in our models.
Both findings—the overall low scores and the absence of evidence that SOP laws are correlated with privileging—are consistent with our conceptual framework. To the extent that medicine is a dominant profession, physicians influence not just the regulatory environment but also the practice environment. At the individual and team levels, physicians may be reluctant to cede specific services that have economic value and prestige.
At the same time, the roles of NPs and PAs appear to vary in different care models, possibly as a result of the physician leadership’s views, which may in turn have multiple associated factors. In some models, the more invasive and higher-risk procedures may simply be reserved for those physicians with the most training and experience in those areas, whereas NPs and PAs play other roles that involve less complex procedures. It is feasible that where physician leadership is more open to change, particularly within medical staffing committees, NP and PA roles could be expanding (Brassard & Smolenski, 2011; Heathcoat, 2015). Similarly, medical staffing committees that include NPs and PAs have been assumed to be associated with expanded privileging for these professionals (Brassard & Smolenski, 2011; Heathcoat, 2015).
Other factors, not related to our framework, are also possible. For example, there may simply be varying degrees of awareness by medical staff leaders (who may have themselves practiced in different states) of the state’s SOP laws. A related explanation could be the continuous incremental reforms of SOP within states from year to year, which may make it difficult for medical staff leaders to keep pace with the changes and to update their bylaws and policies. Last, the ongoing complexity of CMS, state, and payer requirements with regard to who is allowed to perform specific procedures may cause confusion and result in a high degree of caution. For instance, CMS regulations allow NPs to perform a lumbar puncture and prescribe a Schedule II narcotic, but do not allow them to prescribe diabetic boots or home care. Rather than wade through these complex rules, medical staff leaders may opt for a conservative approach across the board.
Our findings also suggest that NPs and PAs are treated similarly in hospitals and that the privileging scores of these two professions are significantly related to each other. This would be consistent with Friedson’s theory of professions, because the dynamics of medical dominance (exclusion of other professions) would trump an examination of any differences in the educational preparation and practice experience of NPs and PAs. The practical implication of this is that efforts to expand NP and PA privileging practices should be addressed together.
These findings are important in light of the growing presence of NPs and PAs in acute care. Hospital leadership is increasingly interested in learning how best to deploy these professionals. Where in the past, organizations likely hired NPs and PAs without thoughtful planning for their utilization, alternative payment models are underscoring the value of NPs and PAs and making it clear that more and better information about how to integrate these professionals is needed. Opportunities to better utilize NPs and PAs in hospital settings, regardless of state SOP laws, may be enhanced through technical assistance that educates hospital boards, credentialing committees, and medical staffs about the practice of NPs and PAs and encourages them to update medical staff bylaws and involve more NPs and PAs on hospital and medical staff committees. Further research that elucidates the associated contextual and hospital-level factors that influence privileging policies would help inform institutional efforts to modernize the use of PAs and NPs in U.S. hospitals.
Footnotes
Declaration of Conflicting Interests
The author(s) declared the following potential conflicts of interest with respect to the research, authorship, and/or publication of this article: The authors declare that there is no conflict of interest but would like to note that coauthor Debra McElroy formed part of CAP2 team at the time of the analysis.
Funding
The author(s) received no financial support for the research, authorship, and/or publication of this article.
References
Supplementary Material
Please find the following supplemental material available below.
For Open Access articles published under a Creative Commons License, all supplemental material carries the same license as the article it is associated with.
For non-Open Access articles published, all supplemental material carries a non-exclusive license, and permission requests for re-use of supplemental material or any part of supplemental material shall be sent directly to the copyright owner as specified in the copyright notice associated with the article.