
Abstract
Health care providers face fixed reimbursement rates from government sources and need to carefully adjust staffing to achieve the highest quality within a given cost structure. With data from the Certification and Survey Provider Enhanced Reports (1999-2015), this study holistically examined how staffing levels affect two publicly reported measures of quality in the nursing home industry, the number of deficiency citations and the deficiency score. While higher staffing consistently yielded better quality, the largest quality improvements resulted from increasing administrative registered nurses and social service staffing. After adjusting for wages, the most cost-effective investment for improving overall deficiency outcomes was increasing social services. Deficiencies related to quality of care were improved most by increasing administrative nursing and social service staff. Quality of life deficiencies were improved most by increasing social service and activities staff. Approaches to improve quality through staffing adjustments should target specific types of staff to maximize return on investment.
Introduction
Efficiency-minded health care administrators want to employ a low-cost mix of medical and other ancillary staff that produce the highest level of quality. This objective has become more important as the recent promotion of the public reporting of quality has motivated health care providers to improve publicly reported quality ratings in order to increase their market share (Bundorf, Chun, Goda, & Kessler, 2009; Dafny & Dranove, 2008). Yet providers may lose some flexibility to employ the optimal mix of staff that achieves this goal when regulations target only one type of staff, such as nurse-to-patient ratios (Cook, Gaynor, Stephens, & Taylor, 2012).
The nursing home (NH) industry is an industry where this situation occurs, as NH residents cannot easily verify quality because they are often physically and cognitively impaired. NHs may exploit these impairments to reduce quality and increase profits (Chou, 2002). In recognition of these quality concerns, the Centers for Medicare and Medicaid Services (CMS) began publicly reporting quality in 1998, which eventually led to the Nursing Home Compare website that currently uses a 5-star quality rating system. While a number of articles have examined if public reporting of quality by NHs changes market share and improves quality (Grabowski & Town, 2011; Lu, 2012; Mukamel, Weimer, Spector, Ladd, & Zinn, 2008; Werner et al., 2009; Werner, Norton, Konetzka, & Polsky, 2012), these studies do not address how to improve quality ratings. Since staffing is the key contributing factor in NH quality, it is important to gain a more comprehensive understanding of how staffing adjustments can lead to better quality.
NH providers may face significant financial risk when increasing staffing levels to improve quality ratings due to the lack of evidence to guide decision making. Profitability may be somewhat unpredictable, as a substantial portion of revenue is subject to policy changes and reimbursements, which are determined by government programs such as Medicare and Medicaid, rather than the facility’s cost of care. A recent article examining a policy change in Medicaid reimbursement showed that increases in Medicaid reimbursement, the primary source of revenue for NHs, led to higher nursing staffing levels, while decreased reimbursement lowered nurse staffing levels (Bowblis & Applebaum, 2017). Thus, decisions related to investments in staffing must be weighed carefully, within the context of fixed government reimbursements.
Furthermore, facilities must divide a set amount of resources across many types of staff. When we consider the issue of limited reimbursement and how regulations typically focus on only one type of staff, NHs may direct resources toward meeting a staffing regulation. This practice could divert resources from other types of staff who also contribute to improving the quality of the facility. For example, mandated increases in direct care nurse staffing in Florida were followed by a reduction in indirect care staff (Thomas, Hyer, Andel, & Weech-Maldonado, 2010). However, indirect care staff such as activities and housekeeping also make important contributions to NH residents’ quality of life. As a result, regulations that mandate NHs to have a minimum amount of nurse staffing, may cause some NHs to have staffing mixes that do not cost-effectively produce quality. Therefore, a comprehensive examination of how each type of staff contributes to improving the facility quality from a cost-effective perspective is needed to assist providers in allocating resources in a way that has the best likelihood of increasing quality ratings.
In this article, we examine which types of NH staff would have a more cost-effective impact on quality, if NHs made a small increase in staffing at current levels. We include two well-established measures of quality used by CMS: the number of deficiency citations and a deficiency score that weights each deficiency for severity and scope. We focus on these two measures because they are of great interest to NH providers and policy makers, as CMS initially publicly reported the number of deficiencies in 1998, and then moved to the deficiency score (since 2008), which is used to calculate a facility’s 5-star rating of quality. Distinct from the existing literature, which primarily focuses only on nurse staffing levels, this article also examines the staffing levels of nonmedical ancillary services, such as social support services (e.g., social services and activities staff) and other types of nonmedical services (e.g., housekeeping and food service). Finally, using the national wages of NH workers, we estimate which type of staff, if increased at the margin, would improve these deficiency outcomes the most cost-effectively.
Background on Nursing Home Deficiencies and Staffing
NHs are residential facilities that provide care to individuals with physical and cognitive impairment who need around-the-clock care. Within NHs, residents are vulnerable to abuse, neglect, and exploitation due to behavioral, cognitive, or functional limitations that limit their ability to care for themselves (Gibbs & Mosqueda, 2004; Lachs & Pillemer, 1995). Furthermore, NH residents are dependent on staff for care and often do not report abuse, neglect, or exploitation out of a fear of retaliation or other negative consequences to daily life (Hayley, Cassel, Snyder, & Rudberg, 1996). To ensure high quality and prevent abuse and neglect, all NHs that receive Medicare and/or Medicaid funding are required to be independently audited and recertified every 9 to 15 months. As part of this recertification, state inspection teams determine if each facility is meeting federal regulatory standards and issue a deficiency citation if standards are not met (CMS, 2015). Since quality is multidimensional (Castle & Ferguson, 2010), there are currently more than 15 different regulations that correspond to more than 170 specific deficiency citations, also known as F-tags (see CMS, 2016b). These regulatory standards capture the breadth of NH quality, which can be broadly categorized to capture aspects of quality of life, quality of care, and the administration of the facility (Harrington, Zimmerman, Karon, Robinson, & Beutel, 2000).
Given the role publicly reported quality measures play in attracting consumers, NHs that want to improve these measures must focus on modifiable factors. Since nurses provide direct care to residents and comprise a significant share of total NH staffing, nurses are the focus of most quality improvement efforts that target staffing. Furthermore, many states have implemented minimum nurse staffing requirements for licensed nurses and direct care nurses, with the net result of increasing nurse staffing levels (Bowblis, 2011; Park & Stearns, 2009). Yet, other types of ancillary staff such as food services, housekeeping, activities, and social services play a vital role in providing care to residents. Within each facility, these ancillary staff are typically responsible for the quality of food and nutrition, the cleanliness of the facility, and the psychological and social well-being of residents. Recent work suggests that when minimum nurse staffing requirements are increased, staffing of these ancillary services often decreases (Bowblis & Hyer, 2013), which can lead to staffing mixes that inefficiently produce quality.
New Contribution
Even though many studies show that higher nurse staffing levels are associated with fewer deficiencies, the literature has not examined all NH staffing holistically, nor are there any studies that examine which type of staff provides the highest quality for the lowest cost. Nurses seem like the obvious choice for improving quality because they provide direct care to residents. Yet, quality is multidimensional and not all deficiency citations are directly related to nurse staffing but instead fall under the responsibilities of nonmedical ancillary staff. Furthermore, staffing can suffer from the law of diminishing marginal return, which implies that for each additional staff hired of the same type, the improvement in quality is expected be smaller than the previous hire. Since nurses dominate the staffing in most NHs, this could mean that the return on investment for ancillary staff may be larger than for nurses. And while it may be assumed that higher staffing levels among all types staff would lead to better quality, increasing staffing across all departments may not be feasible.
In this study, we take a practical approach focused on how NH providers can make better informed decisions about how they can most cost-effectively invest in staffing. First, we examine how current staffing levels across multiple types of staff affect quality, to compare how these different types of staff contribute to quality. Second and most importantly, we test which type of staff are the most cost-effective investments to increase quality, if the increase in staff is small and made at current level of staffing.
Analytic Strategy and Data
The primary goal of this study is to holistically examine which types of staff are more cost-effective in improving quality if current staffing levels are increased incrementally. While there are a number of studies that use policy changes to causally identify the effect of a single type of staff (e.g., Lin, 2014), there are no policy changes that affect all types of NH staff. Therefore, our analysis must draw on estimation techniques that allow for identification of the effect of various types of staff in a single regression but may not necessarily guarantee causal identification. To accomplish this task, we use data with the unit of observation being the NH to estimate a fixed effect panel regression. The key advantage of this approach is the ability to identify an effect for each type of staff and control for factors that may influence deficiency outcomes that do not change over time, including observable factors such as geographic location, and unobserved factors, such as the facility’s floor plan.
In the fixed effect panel regression, statistical identification is obtained through the variation in staffing levels across facilities and time, either through changes in number of staff employed or the number of residents in the facility. While this approach does address unobserved factors that do not change over time, a disadvantage of the fixed effect model is that time-varying unobserved factors could be correlated with the variation in staffing levels and deficiency outcomes. To address this, our model also includes a number of time-varying control variables and year trend variables. By including time-varying control variables in our model and attempting to saturate the model with varying types of trends, it is possible to draw inference as to which type of staffing has larger effects on deficiency outcomes. While we cannot completely rule out the possibility of the potential influence of an unobserved factor on the coefficient estimates, several robustness checks were completed to mitigate concerns associated with any potential bias. In the robustness check section, we argue and provide evidence that if there are unobserved factors that bias our results, they are toward finding larger effects.
Given this framework, we use a facility-level data set that contains information on deficiencies, staffing levels, and other facility and resident characteristics for all NHs in the United States that are certified for Medicare or Medicaid. We examine the period from 1999 through 2015, with the data source for the 1999 through 2008 being the Online Survey Certification and Reporting (OSCAR) and for the remainder of the study period OSCAR’s successor database, the Certification and Survey Provider Enhanced Reports (CASPER). Both data sets are collected in the same manner and report the same information from the annual recertification process. These data are merged with county-level information from the Area Health Resource File to construct a panel data set of 221,499 inspections in 15,949 unique facilities. This sample includes all free-standing NHs in the United States and the District of Columbia with at least 10 beds and at least two observations in the study period.
Our baseline specification is the following panel model:
where
Dependent Variables
Our dependent variables are various measures of deficiencies. While the number of deficiencies was the first publicly reported measure on the Nursing Home Compare website, a simple count of deficiencies treats a violation that can lead to no harm the same way as a deficiency that might put a resident’s health and safety into immediate jeopardy. With the adoption of Nursing Home Compare’s 5-star ratings to measure quality, CMS (2016a) utilizes a point system (e.g., deficiency score) to measure the severity and scope of each deficiency, in which higher scores indicate more deficiency citations of greater severity and scope (see Supplemental Appendix Table A, available with the online version of the article, for details on scoring). Therefore, the two ways we measure deficiency outcomes are the total number of deficiency citations received during the recertification inspection and the deficiency score, which accounts for the number of deficiencies, weighted by the severity and scope of each deficiency citation. 2
Our main analysis focuses on the number of deficiencies and deficiency score for all deficiencies the facility received during the recertification inspection. While these measures encompass the multidimensional nature of NH quality, are validated by CMS, and are used for public reporting during the study period, examining all deficiency outcomes can obscure the fact that some regulations focus on different aspects of quality that may fall under the responsibilities of a specific type of staff (e.g., sanitation regulations and housekeeping). For this reason, we follow the literature and also present a more nuanced examination of the number of deficiencies and the deficiency score for two broad categories of deficiencies: quality of care and quality of life (Harrington et al., 2000; Kim, Kovner, Harrington, Greene, & Mezey, 2009; Akosa Antwi & Bowblis, 2018). 3 The specific regulatory codes that define each broad categorization are in the Supplemental Appendix Table B (available with the online version of the article).
Staffing Measures
The OSCAR/CASPER data sets report the number of full-time equivalent (FTEs) for various types of staff each NH employed in the 14-day period prior the recertification inspection. In operationalizing the staffing measures, staffing levels are converted to hours per resident day (HPRD), a unit of measure that theoretically captures the amount of staff time available for each resident in the facility. The HPRD are calculated using the following formula that is standard to these data: HPRD = (FTE × 70)/(14 × number of residents). This formula assumes that staffing is measured over a 2-week period and that an FTE works 70 hours over that period (Konetzka, Stearns, & Park, 2008; Lin, 2014). While state inspectors verify OSCAR/CASPER data, the staffing variables are self-reported and coding errors may occur. To address this issue, observations are dropped that are found to have more than 24 HPRD, and among the remaining observations are four standard deviations from the mean. Facilities that report no nurses are excluded from the sample.
While the staffing information is collected during the inspection process, is verified by state inspectors, and is considered valid for research methods (Feng, Katz, Intrator, Karuza, & Mor, 2005), there are reports that NHs may increase staffing just ahead of recertification inspections during our study period. Though the inspections are supposed to be random and unannounced, facilities may be able to anticipate inspections implying that staffing levels reported in the data are higher than what is typical for the rest of the year. Overall, this not a concern in our application because our objective is to understand how staffing affects quality based on the information available to the inspector at the time deficiencies are issued, though we do report a number of robustness check to examine how sensitive our results are to this issue.
The first type of staff examined is nursing staff. Nurses and nurse aides are the primary staff in NHs, which include registered nurses (RNs), licensed practical nurses (LPNs), and certified nurse aides (CNAs). There is a general agreement that there is a relationship between nursing staff and deficiency outcomes (e.g., Kim et al., 2009). In addition to RNs that primarily provide direct care to residents, some RNs have administrative roles through care coordination, supervision, and ensuring professional oversight of direct care provided to residents. LPNs are usually responsible for administering treatments and medicine whereas CNAs are the lowest paid and provide the majority of direct care to residents. To capture how each type of nurse has different responsibilities, education, and licensure, our modeling includes separate staffing-level variables for each type of nurse. We also delineate between RNs with administrative duties and those who primarily provide care to residents. We operationalize RNs with administrative duties to include all RNs who manage and supervise nursing services or primarily focus on administrative duties, such as the Director of Nursing. All other RNs are assumed to provide direct care to residents.
NHs are also required to hire employees who are responsible for providing ancillary services in the form of social services and activities. Social service staff focus on improving the social and emotional functioning of residents. Their responsibilities include completing psychosocial assessments and care planning, implementing psychosocial interventions or making referrals, and helping residents and families to cope with transitions into and out of NH care. Social workers and others working in social services also help residents maintain and enhance their physical and mental health to promote the highest possible quality of life (Bern-Klug & Kramer, 2013; Vourlekis, Zlotnik, & Simons, 2005), and previous work finds an association between social services staffing and deficiency outcomes (Vongxaiburana, Thomas, Fraham, & Hyer, 2011).
To our knowledge, we are unaware of any studies that connect activities staffing levels to deficiency outcomes, yet activities staff also promote quality of life and help residents attain optimal physical, social, and emotional well-being. Activities staff assist residents by providing or arranging for social, recreational, and leisure activities designed to maximize the functional capabilities of residents. Furthermore, therapeutic goals accomplished through individual and group activities for residents can increase social interaction, provide physical or cognitive stimulation, or promote relaxation. This implies that activities staff can affect a resident’s quality of life, but because activities staff may see residents in different settings they may affect quality of care by helping to identify changes in cognitive and physical functioning.
This final group of staff analyzed includes food services (e.g., dietitians and dietary service workers) and housekeeping. Staff in these nonmedical departments primarily affect quality of life but may also have an impact on resident health and have been found to affect deficiency outcomes related to their roles in NHs (Smith, Thomas, Johnson, Meng, & Hyer, 2019). For example, food service staff are responsible for providing nutritious meals according to sanitary food preparation practices and preparing food in different ways according to resident needs (e.g., difficulty swallowing). Issues in food services may directly affect health through food-borne illnesses, poor nutrition, or unintended weight loss/gain. Similarly, housekeeping’s main responsibility is to maintain the cleanliness of the facility to ensure a safe and comfortable living environment. However, improper cleaning and maintenance can affect the quality of care by increasing the risk of infection or hazards that could lead to falls.
Control Variables
Observable time-varying control variables common to the literature are included in the model, including facility-level measures of the structure, financial resources, staffing, and resident characteristics. They are included in the model because they are expected to influence the number of deficiencies and the deficiency score that a facility would receive. Facility characteristics include ownership, chain membership, being part of a continuing care retirement community, and number of beds. The financial resources available are captured by the occupancy rate and payer-mix variables (i.e., proportion Medicaid, Medicare, and private pay). To account for other staffing factors, we include which type of medical team a NH employs, presence of any staff with a specialization in mental health, and if the NH has a special care unit for dementia or other specialized services. A set of facility-level case-mix controls are included: physical acuity level as measured by the Acuindex (Cowles, 2010), as well as the proportion of residents with dementia, psychiatric illness, depression, and developmental disabilities. Finally, we include four county-level variables: number of NHs to proxy for level of competition, Medicare managed care penetration rate, 4 per capita income, and unemployment rate. Summary statistics for control variables are reported in Table 1.
Summary Statistics for Control Variables.
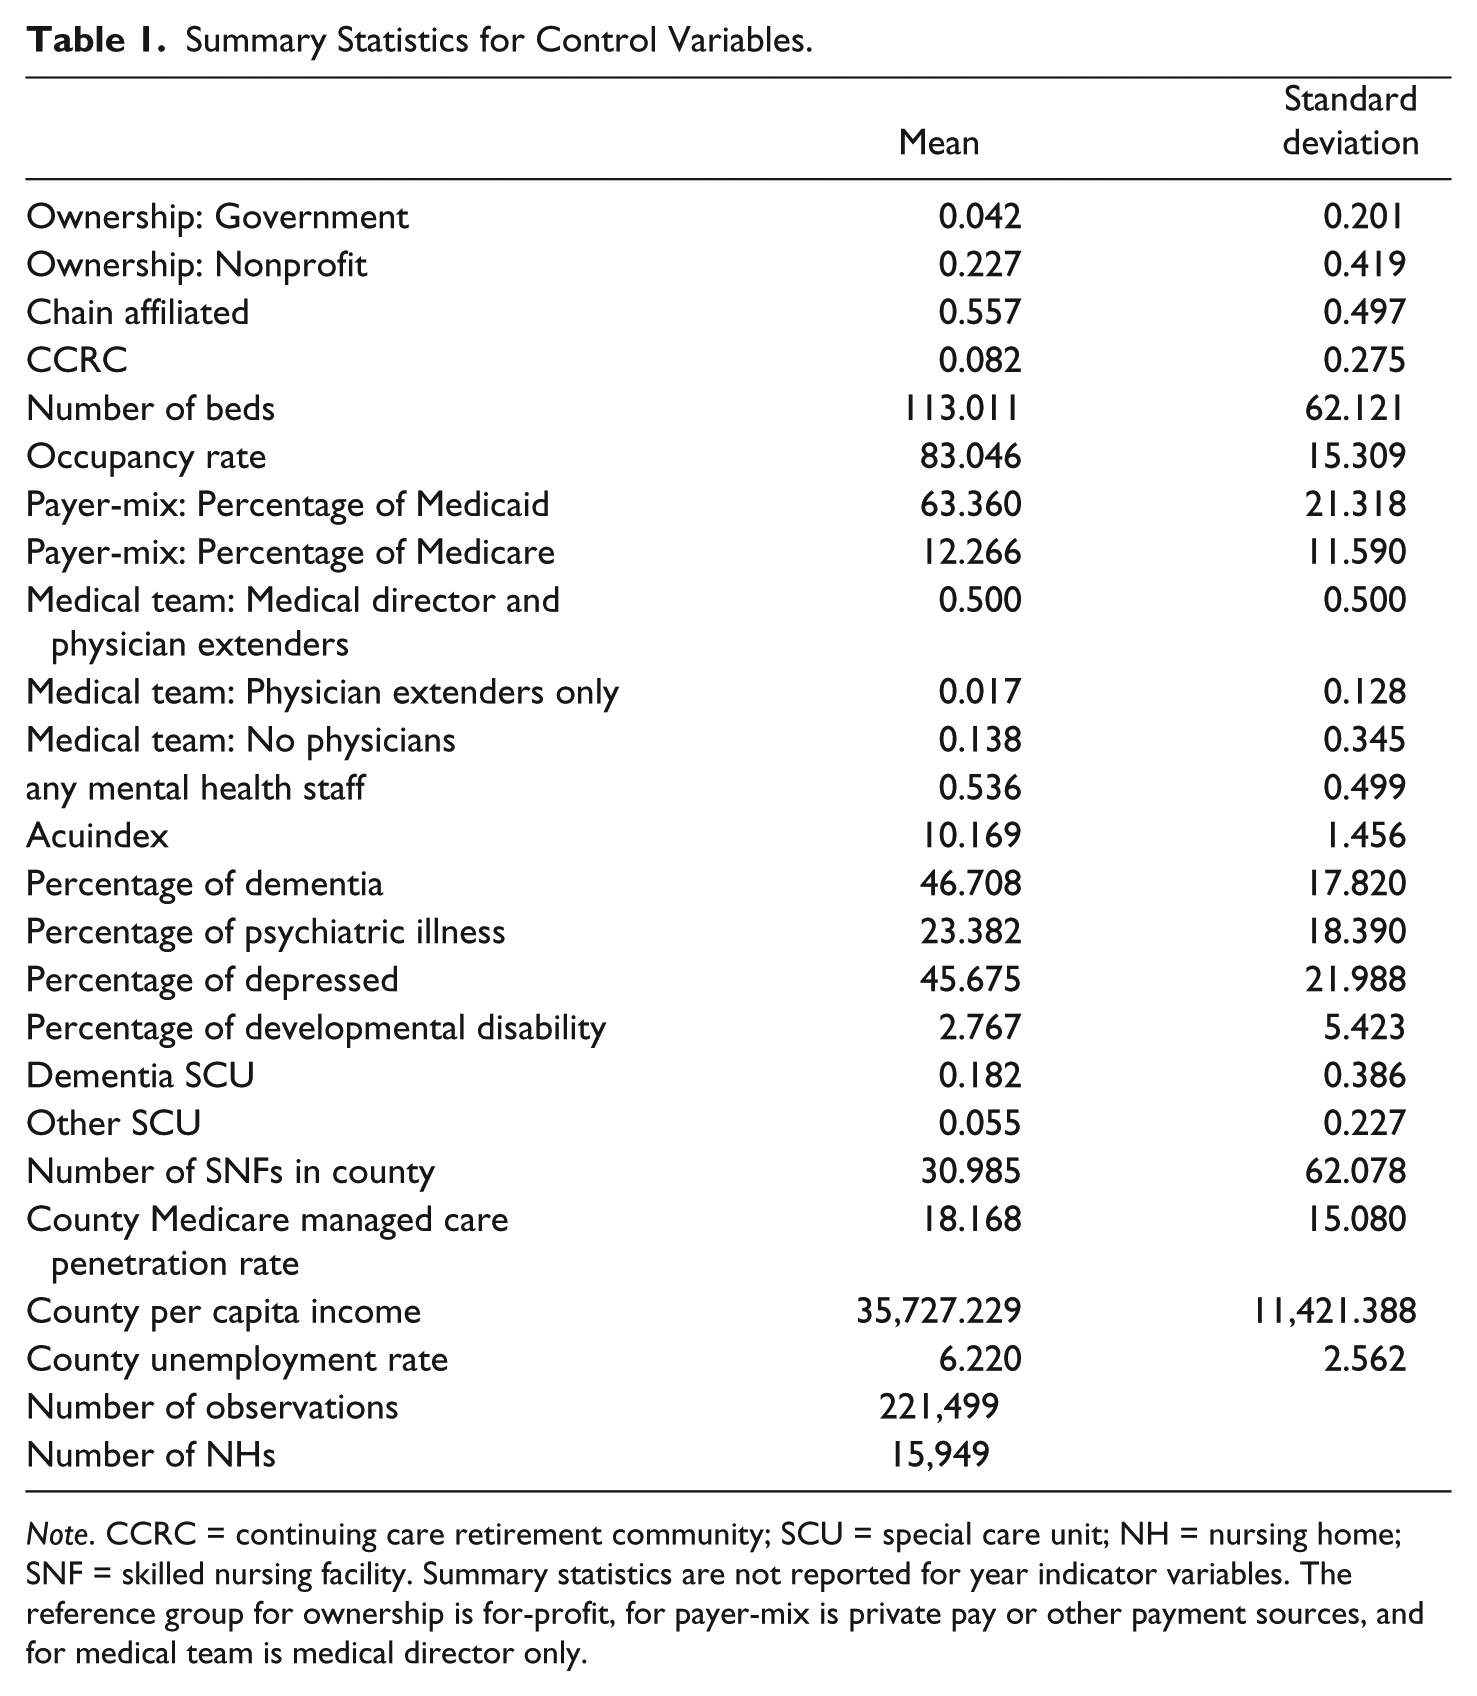
Note. CCRC = continuing care retirement community; SCU = special care unit; NH = nursing home; SNF = skilled nursing facility. Summary statistics are not reported for year indicator variables. The reference group for ownership is for-profit, for payer-mix is private pay or other payment sources, and for medical team is medical director only.
Results
Baseline Results for Deficiencies
For all deficiency measures, patterns are countercyclical with economic growth; as all measures initially increase, decline from 2001 to 2004, peak again right before the Great Recession, where they remain lower until the last few quarters in the study period. In contrast, staffing levels steadily increase over the study period though the increases are not uniform across all staffing types. Staffing of administrative RNs increased by 38.6%, compared with about a 32.0% increase for RNs and LPNs. Social service staff increased by 20% from a low base of 0.09 HPRD and activities staff increased by 21.5% from a base of 0.15 HPRD. 5
The relationship between total deficiency outcomes and staffing levels are reported in Table 2. The first column in Table 2 reports the mean and standard deviation for the staffing level variables. The first two rows in Table 2 report summary statistics for the number of deficiencies and the deficiency score. The remaining items in the table report the coefficient estimates and standard errors for the effect of staffing on total number of deficiencies, deficiency score, and their logged transformations. Since deficiencies capture the failure to meet regulatory standards, coefficient estimates that are negative indicate improvements in each outcome. In the models where the dependent variable is log-transformed, the coefficient estimates the approximate percentage reduction in the deficiency measure for a unit change for continuous explanatory variables, such as the staffing measures. 6
Relationship Between Nursing Home Staffing and Total Deficiency Outcomes.
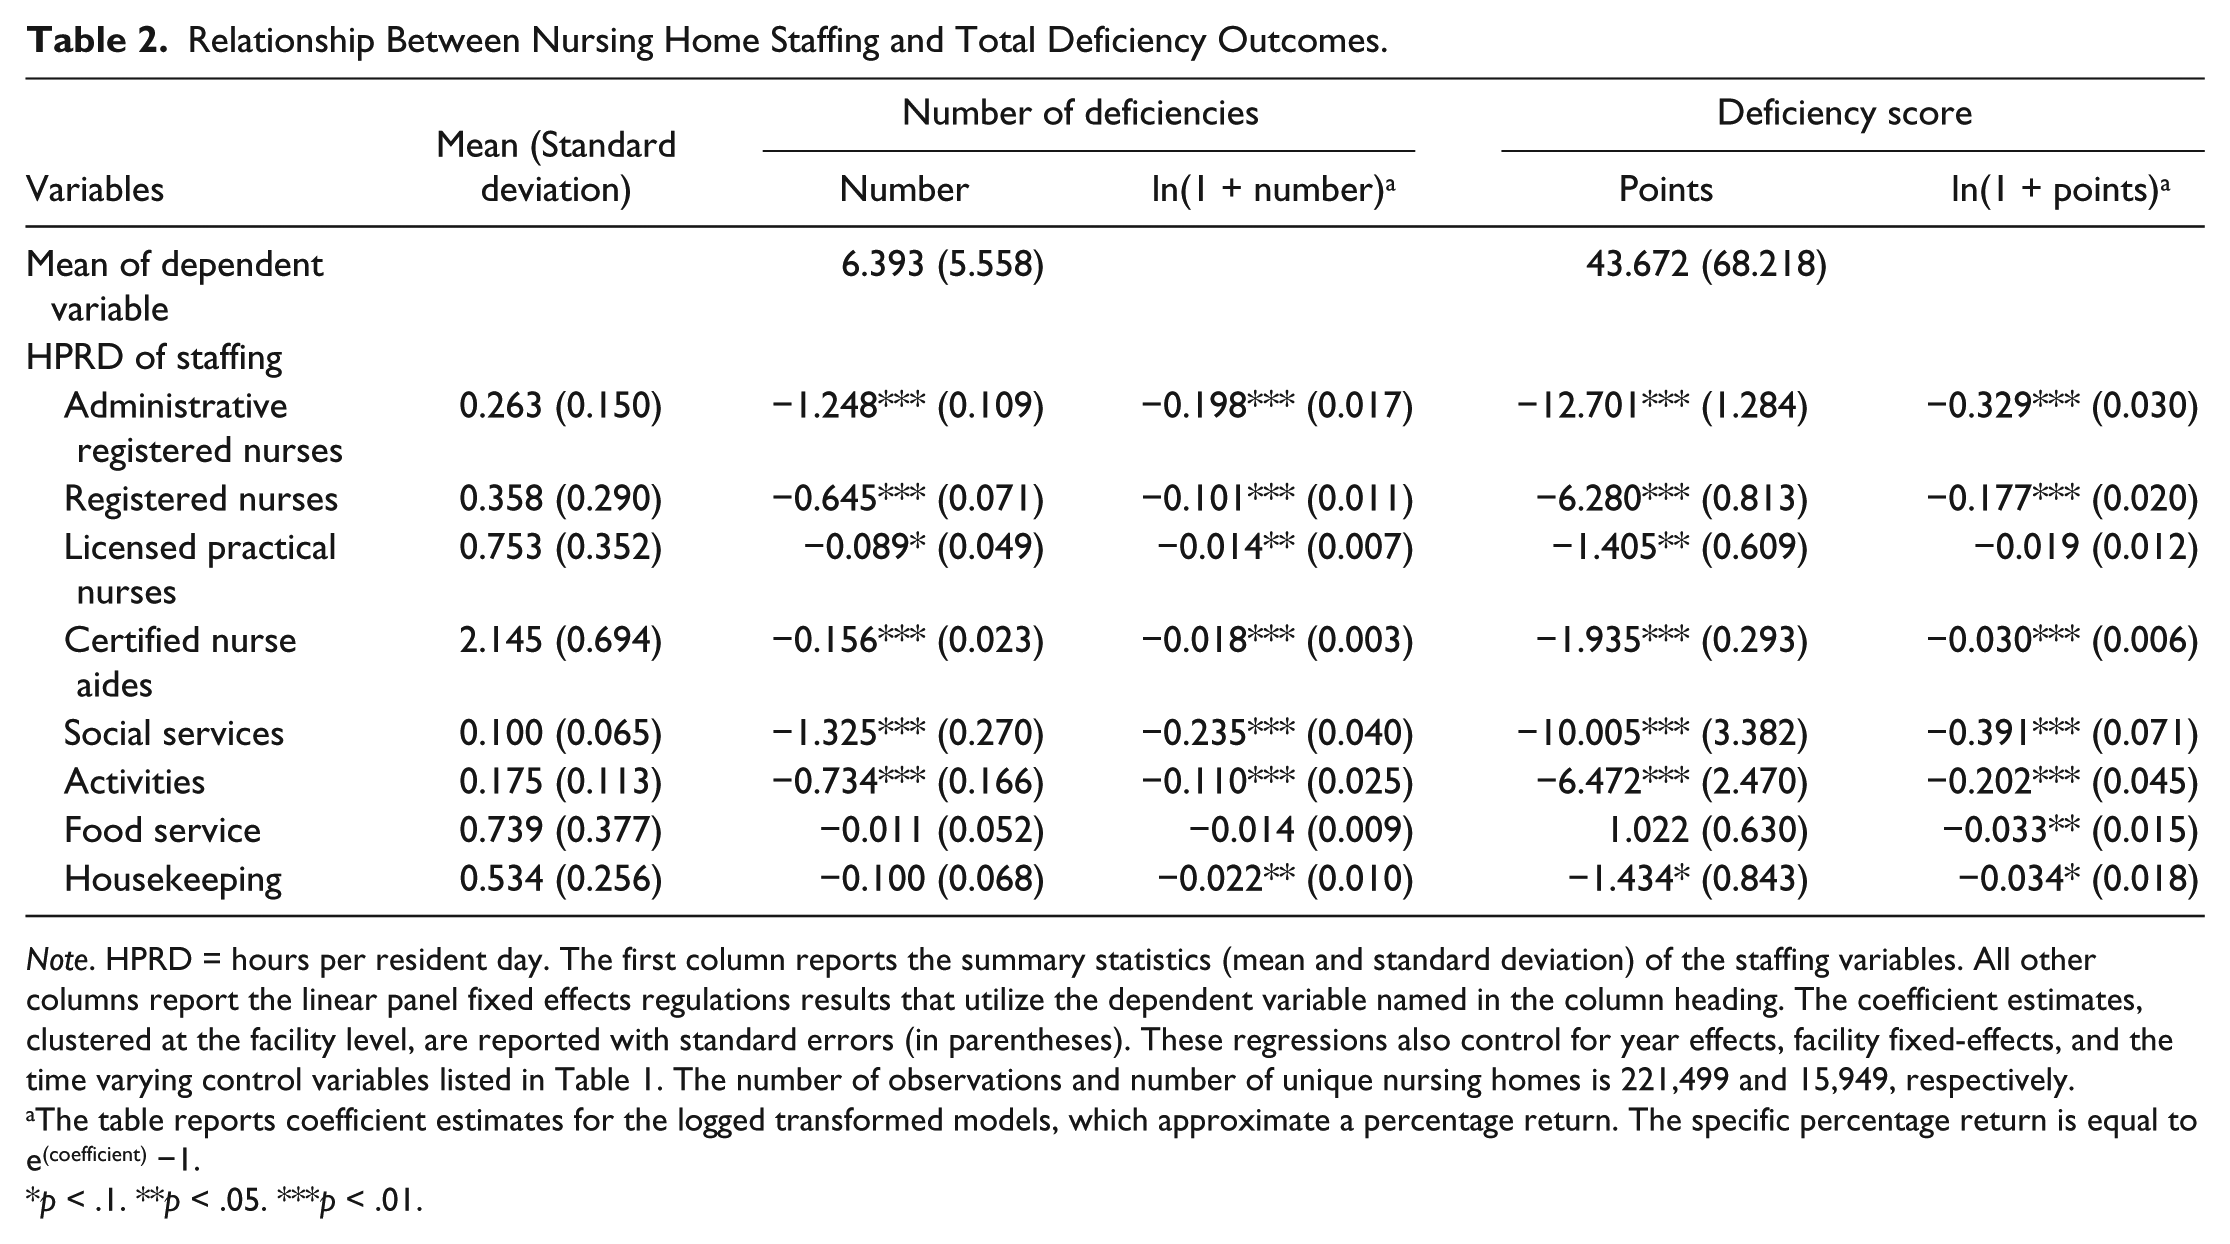
Note. HPRD = hours per resident day. The first column reports the summary statistics (mean and standard deviation) of the staffing variables. All other columns report the linear panel fixed effects regulations results that utilize the dependent variable named in the column heading. The coefficient estimates, clustered at the facility level, are reported with standard errors (in parentheses). These regressions also control for year effects, facility fixed-effects, and the time varying control variables listed in Table 1. The number of observations and number of unique nursing homes is 221,499 and 15,949, respectively.
The table reports coefficient estimates for the logged transformed models, which approximate a percentage return. The specific percentage return is equal to e(coefficient) −1.
p < .1. **p < .05. ***p < .01.
For all deficiencies, the coefficient estimates for most staffing types are negative across all four regression specifications, indicating that higher staffing levels are associated with better deficiency outcomes. In terms of number of deficiencies, higher staffing levels for administrative RNs, RNs, LPNs, CNAs, social service staff, and activities staff are found to be statistically associated with fewer deficiencies. In terms of relative size, the largest reductions in the number deficiencies are for social services (−1.33 deficiencies for a HPRD increase), administrative RNs (−1.25 deficiencies), and then activities staff (−0.73 deficiencies). 7 In the logged transformed models, social service and administrative RNs have the largest reductions in number of deficiencies (−20.9% and −18.0%, respectively), followed by activities staff and RNs (−10.4% and −9.6%). The effect of LPN staffing is among the smallest effect and similar to the effect for CNAs (−1.4% and −1.8%, respectively).
When severity and scope of the deficiencies are taken into account, the results tend be rather similar to the number of deficiencies. Administrative RNs and social service staff are found to be associated with the largest declines in deficiency scores. A HPRD increase in administrative RNs would result in a 12.7-point reduction in the deficiency score compared with a 10.0-point reduction for social service staff. In the logged transformed version of the model, social service staff are found to have a slightly larger effect (−32.4% vs. −28.0%). The next largest improvement in deficiency scores is among RNs and activities staff, as both staff types reduce deficiency scores by 6 to 7 deficiency points per HPRD of staffing.
Effects for Broad Deficiency Categories
To determine whether staffing that focuses on the diverse needs of resident only affects certain domains of regulatory standards, Table 3 reports the relationship between NH staffing and deficiency outcomes in quality of care and quality of life. Administrative RNs and social service staff have the largest effects on the number and deficiency scores for the quality of care deficiencies. The next largest effects are for RNs and activities staff, followed by CNAs. The results for quality of care may be similar to the results for all deficiencies because quality of care deficiencies is the most commonly issued deficiency category, averaging 4.2 deficiencies per inspection compared with 6.4 deficiencies across all regulatory standards. In contrast, quality of life deficiencies find different types of staff are more effective at improving both deficiency outcomes. Social service staff and administrative RNs are found to be most effective, followed by activities staff that are about 2/3rds as effective as social service staff.
Relationship Between Nursing Home Staffing and Deficiencies in Quality of Care and Quality of Life.
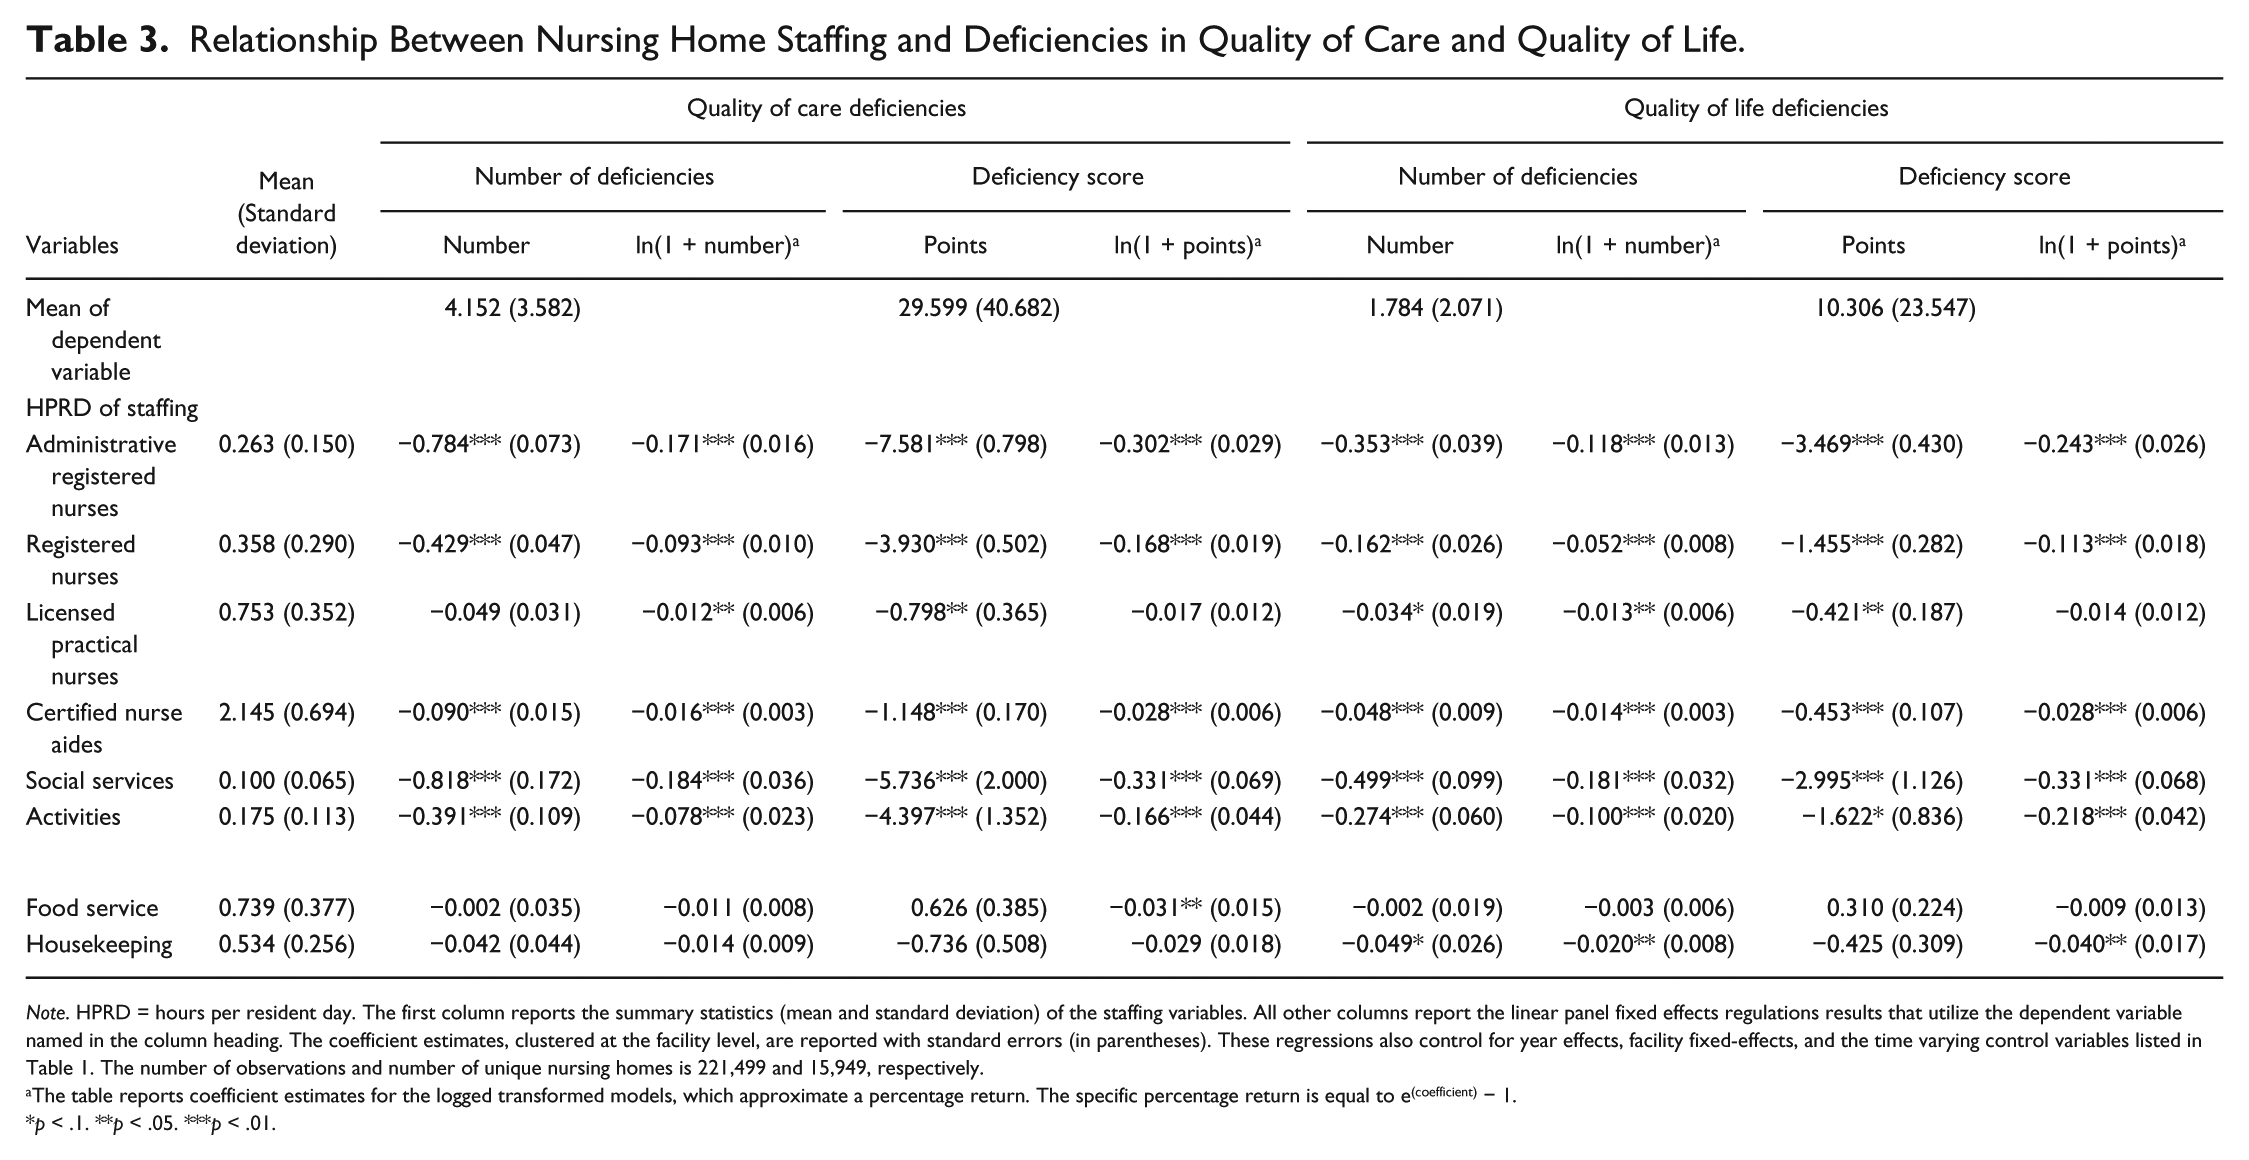
Note. HPRD = hours per resident day. The first column reports the summary statistics (mean and standard deviation) of the staffing variables. All other columns report the linear panel fixed effects regulations results that utilize the dependent variable named in the column heading. The coefficient estimates, clustered at the facility level, are reported with standard errors (in parentheses). These regressions also control for year effects, facility fixed-effects, and the time varying control variables listed in Table 1. The number of observations and number of unique nursing homes is 221,499 and 15,949, respectively.
The table reports coefficient estimates for the logged transformed models, which approximate a percentage return. The specific percentage return is equal to e(coefficient) − 1.
p < .1. **p < .05. ***p < .01.
Simulation of Cost-Effectiveness
While administrative RNs and social service staff are among the most effective at improving deficiency outcomes, the difference in wage rates of various types of staff may imply it is more economical to hire staff associated with smaller improvements in outcomes but are paid lower wage rates. To account for these differences in wages, Table 4 reports the percentage reduction in the deficiency measures if a facility invested an additional $100 per hour for each type of staff. To calculate this, the national hourly wage rates were obtained from the Bureau of Labor Statistics to determine the number of additional staff that could be hired for $100 per hour. 8 Converting this into HPRD for the typical facility 9 and using the coefficient estimates from the logged transformed regression models reported in Table 3, we calculated the percentage change in the number of deficiency citations and the deficiency score associated with a $100 per hour investment in each type of staff.
Reduction in Deficiencies for a $100 per Hour Investment in Staffing for a 100-Resident Facility.
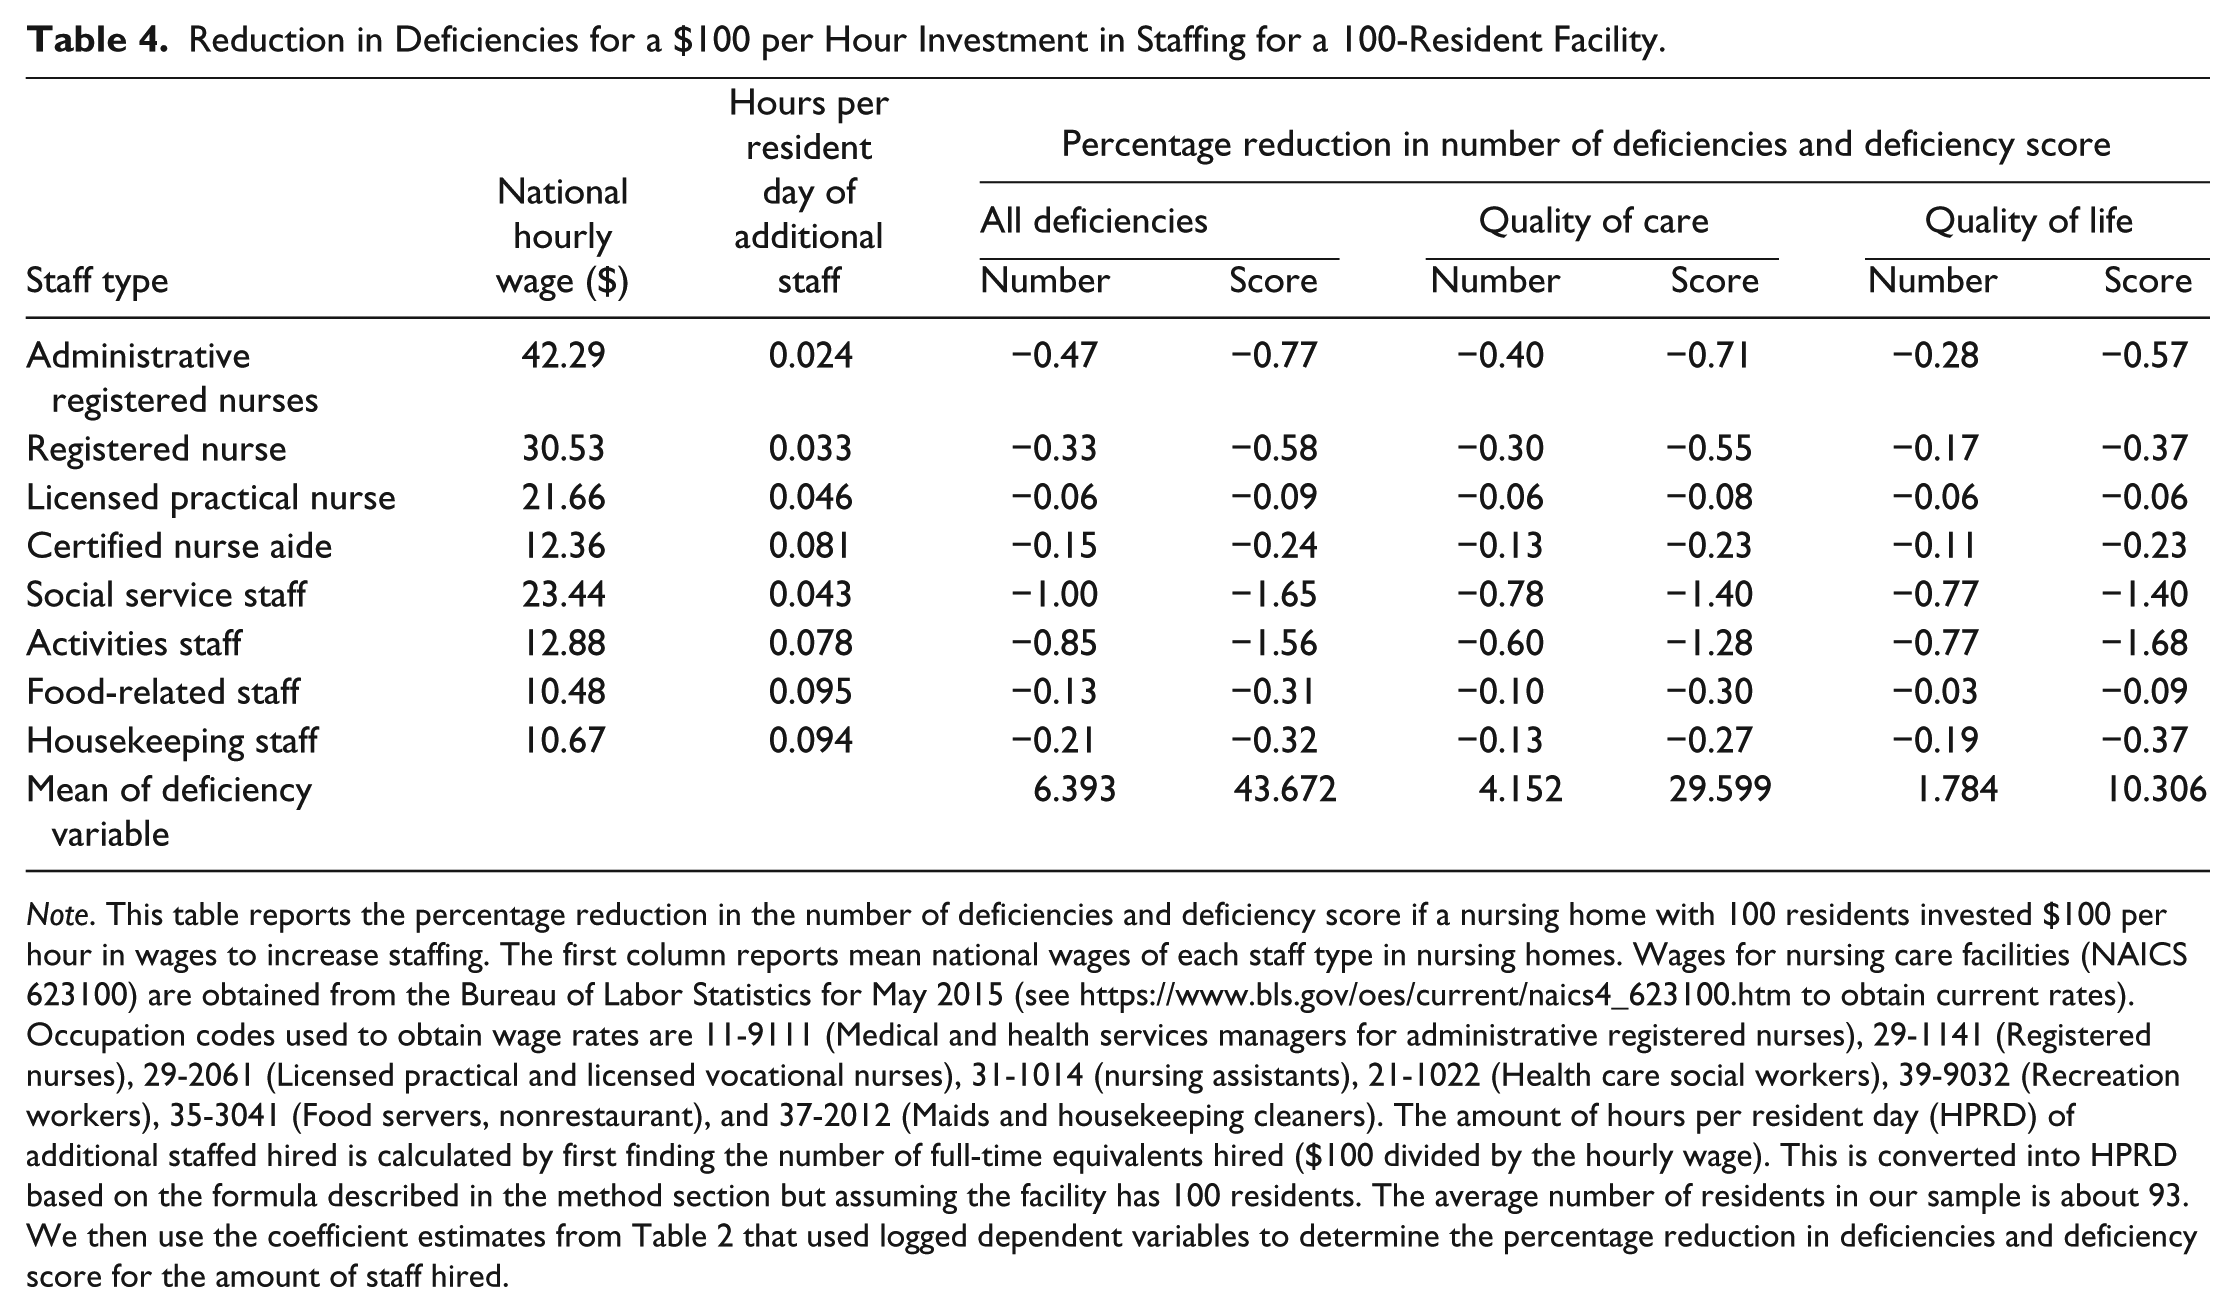
Note. This table reports the percentage reduction in the number of deficiencies and deficiency score if a nursing home with 100 residents invested $100 per hour in wages to increase staffing. The first column reports mean national wages of each staff type in nursing homes. Wages for nursing care facilities (NAICS 623100) are obtained from the Bureau of Labor Statistics for May 2015 (see https://www.bls.gov/oes/current/naics4_623100.htm to obtain current rates). Occupation codes used to obtain wage rates are 11-9111 (Medical and health services managers for administrative registered nurses), 29-1141 (Registered nurses), 29-2061 (Licensed practical and licensed vocational nurses), 31-1014 (nursing assistants), 21-1022 (Health care social workers), 39-9032 (Recreation workers), 35-3041 (Food servers, nonrestaurant), and 37-2012 (Maids and housekeeping cleaners). The amount of hours per resident day (HPRD) of additional staffed hired is calculated by first finding the number of full-time equivalents hired ($100 divided by the hourly wage). This is converted into HPRD based on the formula described in the method section but assuming the facility has 100 residents. The average number of residents in our sample is about 93. We then use the coefficient estimates from Table 2 that used logged dependent variables to determine the percentage reduction in deficiencies and deficiency score for the amount of staff hired.
While a one HPRD increase in administrative RNs had one of the largest effects on deficiency outcomes, their hourly wage is high, causing their cost-effectiveness to be near the middle of all types of staff analyzed. Among nursing staff for total number of deficiencies, an additional HPRD of a RN was found to have an effect that is almost 4 times the size as a CNA. After adjusting for wages, a $100 per hour investment in staff found that RNs still have a higher return than CNAs, though the difference has narrowed. This is due to CNA wages being 59.7% lower than those of a RN. A similar pattern was found for social services and activities staff. While an HPRD of social service staffing resulted in some of the largest reductions in the deficiency outcomes, after adjusting for wages, activities staffing are nearly as cost-effective. A salient finding is social service and activities staff are over two to three times more cost-effective than nurses without administrative duties depending on the measure examined.
Robustness of Baseline Specification
To address the sensitivity of our model to alternative specifications, a number of robustness checks were performed and are reported for the logged transformed regressions in Supplemental Appendix Tables C and D (available with the online version of the article). In the first robustness check, state linear time trends are added, and though not reported, we also estimated models with quadratic time trends. We add these time trends, in addition to national year effects, to capture any unobserved trends that may be occurring within each state. The results are robust to the inclusion of these time trends.
In the second and third robustness checks, separate regressions are estimated for the period of 1999 to 2008 and 2009 to 2015. One of the reasons we estimate separate models for each period is CMS began public reporting of NH quality using the 5-star rating system in 2008, whereas prior to this period, scores for each quality measure were reported. Because the 5-star rating system made it easier for consumers to compare NHs based on one measure, NHs are believed to have a stronger incentive to game the system after 2008, including potentially “ramping-up” staffing before inspections (Sharma, Konetzka, & Smieliausaks, 2018). This would imply that the earlier period is more likely to reflect true effect of staffing on the number of deficiencies, and the smaller effects would be found for the 2009 to 2015 period, indicating attenuation bias in our baseline specification. For the earlier period, the effects for most staffing are similar to the baseline specification, though the effect for RNs is smaller. When the sample is restricted to the 2009 to 2015, the effect sizes for administrative RNs, social services, and activities staff are smaller when compared to the baseline specification. These results would be consistent with potential gaming by NHs, particularly after 2008.
To determine how this gaming may bias the results, we compared the results for the same two periods for the deficiency score outcome. Since CMS only publicly reported the number of deficiencies prior to 2008 and the deficiency scoring system did not exist until after 2008, NHs had no incentive to game a nonexistent scoring system in the earlier period. This implies that examining deficiency scores for the 1999-2008 period are likely to find coefficient estimates that were not affected by gaming, allowing us to determine the magnitude of any attenuation bias from gaming by comparing the coefficient estimates for the two periods. For the 1999 to 2008 period, the effect sizes for administrative RNs, social services and activities staff are larger than the baseline specification, though the effects for RNs are about half the size. For the 2009-2015 period, administrative RNs, social service, and activities staff are found to have significantly smaller effects, though RN staffing is similar to the baseline. Since this period also saw a rapid expansion of NHs moving into providing postacute care, we examined the results without payer-mix and occupancy rates as controls and find results closer to the baseline but consistent with our findings.
Overall, these results suggest that gaming may be occurring, especially in the later period, but baseline specification may be underestimating the effect for most staff. While this can affect the actual “returns” NHs may face from hiring additional staff, these robustness checks suggest that the relative ordering of which type of staff have larger effects on deficiency outcomes are consistent with the baseline specification. In conclusion, the evidence supports the interpretation of our main finding that administrative RNs and social service staffing are the most effective at improving deficiency outcomes compared with other staff before accounting for wages.
Finally, we also explored whether the effects were different by payer-mix, as NHs that are more heavily reliant on Medicaid are known to have lower quality. To do this, we created an indicator variable for low and high Medicaid payer-mix, defined as having a percentage of residents below (above) the sample median of 66.9% and interacted this variable with each staffing type. Supplemental Appendix Table E (available with the online version of the article) reports the effect of increasing staffing for NHs with a low Medicaid payer-mix and the interaction term, which reports the differences for high Medicaid payer-mix NHs. For both number of deficiencies and total deficiencies, NHs with high Medicaid payer-mix are found to have a higher return on investment for RNs and food service staff relative to low Medicaid payer-mix NHs. There are almost no statistical differences in the effects by payer-mix for other staffing types.
Discussion
Advocates for NH quality have argued that in general, staffing levels in NHs are too low even after adjusting for resident’s level of need. When NH staffing levels are examined in the literature, it is almost exclusively for nursing. In NHs, nurse staffing is crucial due to the residents’ need for direct care assistance and the medical expertise required to manage complicated health issues. Because nurses are uniquely qualified to provide this kind of care, strategies to improve quality often focus on the staffing levels and qualifications of nurses. However, NHs require a team of different types of staff in order to provide high-quality care across a variety of dimensions. Our findings consistently support a relationship between higher staffing levels, fewer deficiency citations, and lower deficiency scores.
Within the context of limited government reimbursement and other financial constraints, this study highlights information that providers can use to identify which kinds of investments in specific departments are most likely to lead to quality improvements, measured by reductions in the number of deficiency citations and the severity of the deficiency score a facility receives at its next annual recertification. For a facility to have the largest effect in improving quality, the authors recommend that providers consider making small increases in social services, activities, and administrative RN staff. After considering wages, the least expensive strategy to improve deficiency outcomes involves increasing social service staff and/or activities staff. The findings of this study reinforce the idea that social support staff and the other ancillary services make valuable contributions to NH quality. And while we find some variation by payer-mix, such as higher return on investment for RNs and food service staff in high Medicaid reliant facilities, the general conclusions we find are supported across all NHs.
Furthermore, providers can adjust their staffing approaches to target specific categories of deficiency outcomes, such as quality of care and quality of life. Within the domain of quality of care, modestly increasing the level of social services staffing and administrative RN staffing had the biggest impact on reducing the number of deficiencies and the severity of the deficiency score. While both of these staff are among the most effective at improving quality, social services is the most cost-efficient. One plausible explanation is that since the majority of a NH’s staffing is within the nursing department, there may be diminishing marginal returns. For the quality of life domain, social services staff were also among the most effective in improving quality. After adjusting for wages, social services and/or activities staff yielded the most cost-efficient strategy to improve quality.
Another major implication of this work is that regulations need to focus beyond nurse staffing levels to understand how staffing holistically affects all aspects of quality, including quality of care and quality of life. Social service and activities staffing guidelines have not kept pace with regulations for direct nursing care that specify a minimum level of staffing per resident. For social services, there are some suggestions on what appropriate staffing levels should be (e.g., Bern-Klug, Kramer, Sharr, & Cruz, 2010), to determine a realistic caseload, although more work is needed to determine the optimal staffing level for these departments, which significantly affect residents’ quality of care and quality of life.
While this study is limited to a statistical identification strategy that used variation in staffing and number of residents to estimate the effect of staffing levels on deficiency measures, there are currently no studies that holistically examine all types of staffing and NH quality. By being the first to comprehensively examine the cost-effectiveness of various types of staffing, this study clearly shows that all types of staff play an important role in providing high quality of care as part of an interdisciplinary team. Additionally, these findings offer practical recommendations for NHs interested in making efficient investments to improve the quality of services and enhance market position due to the public reporting of NH quality measures. Though our study provides evidence that NH regulations need to focus beyond nurse staffing levels, further research is needed to better understand how staffing holistically affects all aspects of quality.
Supplemental Material
Alternative_Appendix_File – Supplemental material for Cost-Effective Adjustments to Nursing Home Staffing to Improve Quality
Supplemental material, Alternative_Appendix_File for Cost-Effective Adjustments to Nursing Home Staffing to Improve Quality by John R. Bowblis and Amy Restorick Roberts in Medical Care Research and Review
Footnotes
Declaration of Conflicting Interests
The author(s) declared no potential conflicts of interest with respect to the research, authorship, and/or publication of this article.
Funding
The author(s) disclosed receipt of the following financial support for the research, authorship, and/or publication of this article: This study has been supported by The Retirement Research Foundation of Chicago: RRF No. 2017-168.
Notes
Supplemental Material
Supplementary material for this article is available online.
References
Supplementary Material
Please find the following supplemental material available below.
For Open Access articles published under a Creative Commons License, all supplemental material carries the same license as the article it is associated with.
For non-Open Access articles published, all supplemental material carries a non-exclusive license, and permission requests for re-use of supplemental material or any part of supplemental material shall be sent directly to the copyright owner as specified in the copyright notice associated with the article.