
Abstract
This article examines minority participation in hospital senior management and how participation varies across areas in response to demographic and other market influences. We use data from Equal Employment Opportunity Commission, United States from 2008 to 2014 reported by private hospitals in the United States, grouped into 381 metropolitan areas. Analysis shows minority participation is sensitive to some local market factors including total population, share of minorities in the population, relative number of minorities with bachelor’s degrees in the population, and the concentration of local hospital markets. But, unlike markets for other hospital jobs (professionals, middle managers, and other jobs), changes in these factors create only small changes in minority participation for senior managers. Our results demonstrate that minority participation in senior management is not going to improve very much from future increases in minority populations and from educational parity. Public policies and deliberate organizational strategies will be required to make substantial improvements in diversity of senior management.
Introduction
Minority participation on senior management teams of U.S. hospitals is very limited and by 2014 did not improve since the Equal Employment Opportunity Commission (EEOC), United States began to collect information on this category of workers in 2007. Overall, about 9 in 10 senior manager jobs continue to be held by White employees, a proportion that has not changed very much in recent years. As we show below, this makes senior management teams in hospitals less diverse than is true for two important comparison groups: all other health industry organizations and all private business organizations in the country outside health care. While there is, of course, considerable variation within the hospital industry on diversity, there has been no study of what market forces promote or impede minority participation in senior management of hospitals. We limit our study to only the senior manager group, ignoring other senior leaders of interest, for example, CEOs or boards of trustees—because EEOC does not collect data on these other leadership positions.
Leading professional and Industry groups have long been concerned about the level of racial and ethnic diversity in hospital leadership (e.g., American College of Healthcare Executives [ACHE], 2002; American Hospital Association [AHA], 2008; Dreachslin & Curtis, 2004; Kalev, 2009; Moore, 1997; Weber, 2000). This long-standing industry attention to the presence of racial and ethnic leadership in hospitals is grounded “in studies showing diversity in health care leadership can enhance quality of care, quality of life in the workplace, community relations and the ability to affect community health status” (ACHE, 2020). And the issue now enjoins broader diversity concerns such as demographic trends in the country, underlying health disparities facing minorities, and business objectives of better serving the growing minority client base. The lack of leadership opportunities in large, prominent community institutions like hospitals may also limit aspirations of young people, may limit adoption of institutional policies that would improve minority health, and may limit other career opportunities for future minority workers in hospitals (Gee & Ford, 2011).
While there have been numerous descriptive studies of the patterns of diversity in hospital management and governance (e.g., see ACHE, 2002; AHA, 2015), there has not been a study of diversity in hospital senior management positions that examines patterns of employment as they relate to basic market and demographic influences. This article begins to fill this gap. Since 2007, the EEOC has required private institutions to report data on senior managers separately (prior to 2007, senior and lower level managers were combined in a single “Officials and Managers” category). Using these data for 2008 to 2014, we describe how the racial composition of hospital senior management teams has changed over time (replicating in many ways the ACHE and AHA surveys). We also examine the association of basic market and demographic variables with variations in minority participation in senior management jobs and—by way of comparison—in other hospital job categories, including professionals, middle-level managers, and all other hospital workers.
New Contributions
The literature on racial disparities in hospital management contains extensive, important contributions but offers little guidance on how market and demographic factors are related to the diversity of senior management teams. Using EEOC data in 381 U.S. metropolitan areas from 2008 to 2014, this is the first study of how labor market factors may be influencing minority participation in hospital senior management teams in private hospitals in the United States. The results demonstrate that labor market and community factors do explain some of the community to community variation in diversity of senior managers, but the effect size of these market forces are quite small for senior managers and even large changes in demographics going forward will not bring about substantial changes in the racial profile of senior managers. By contrast, the effect of these demographic factors on minority participation in other hospital jobs (professionals, middle managers, and others) is larger. Our results demonstrate that increasing minority participation in senior hospital leadership will require public policies and deliberate organizational strategies to increase diversity.
Literature on Racial Disparities in Hospital Management
There is a rich literature of efforts to measure diversity in management and governance in hospitals. ACHE, working with National Association of Health Services Executives, in 1992 did what appears to be the earliest survey of career attainment and race among health care executives. The findings were summarized a few years later (ACHE, 2002): The 1992 study was a “call to action” for three health care organizations—AHA, ACHE, and National Association of Health Services Executives—to unite and create the Institute for Diversity in Health Management in 1994, under whose auspices subsequent surveys were undertaken every 5 years (1997, 2002, 2008, and 2014). ACHE, Asian Healthcare Leaders Forum, Institute for Diversity and Health Equity, National Association of Health Services Executives, and National Forum for Latino Healthcare Executives (2015) found that the proportion of responding White men in top hospital positions (CEO, COO, and SVPs) in 2008 (56%) had declined relative to 2002 levels (62%), signaling an improvement in CEO diversity (ACHE, Asian Healthcare Leaders Forum, Institute for Diversity and Health Equity, National Association of Health Services Executives, & National Forum for Latino Healthcare Executives, 2015).
The Institute for Diversity in Health Management also performed a series of special benchmarking studies on disparities between 2009 and 2015. The most recently published report (AHA, 2015) found that hospitals had not made much progress (if any) in increasing the diversity of their leadership either at the most senior management levels or on boards. Drawing on these IHDM surveys, Livingston (2018) shows that—between 2011 and 2015—minority representation in executive leadership in hospitals has actually shrunk a bit (12% to 11%), while minority representation among other management staff has actually increased from 15% to 19%.
The National Association for the Advancement of Colored People did a survey of six major health care firms in the United States to examine performance in recruiting, retaining, and advancing people of color in health care (Asante-Muhammad, et al., 2015). The most common “grade” for diversity on boards and in senior management was C or lower. Yet the recruitment firm Witt/Kieffer (2015) reports that relative to prior surveys (2006, 2011), health care respondents believed that their organizations have been more often effective in closing the diversity gap than was reported in a prior survey 5 years earlier. But there was no test of whether respondents’ own institutions actually had closed the gap.
Despite task forces, policy statements, and a modicum of research, the current the situation in senior management inclusiveness remains not much different than in the past. We know there is clearly underrepresentation of minorities in management of hospitals, in relation to their population proportions: the minority population (Black, Hispanic, Asian, and other) is 40% of the total population (United States Census Bureau, 2019). But we by and large do not know the covariates that are associated with different levels of diversity performance.
Figure 1 show our estimate of the minority representation among senior managers, comparing trends in hospitals to two other industry groups: nonhospital health care organizations and all other EEOC reporting institutions outside health care. Hospitals have the lowest percentage of minority senior managers of all three groups in all years. Nonhospital health care organizations have the highest. This comparison may mean less than it seems, given all the differences among these three groups in size, structure, and so on. But, a deeper look at factors associated with low-minority participation in senior management in hospitals seems warranted.
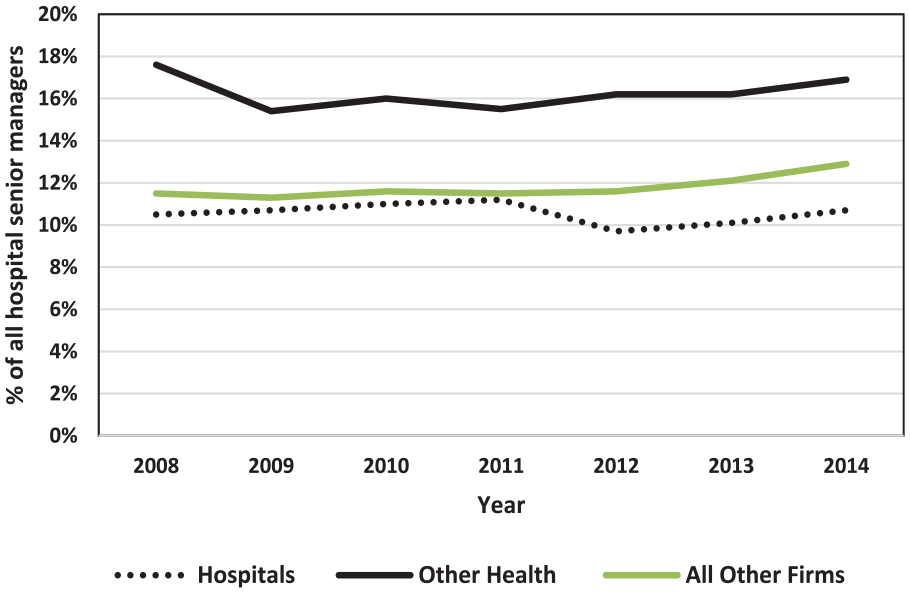
Percentage of minority senior managers in U.S. firms.
There are few reasons offered in the literature to explain why the underrepresentation of minorities (and women) in hospital senior management is occurring. 1 Industry leaders mention organizational factors, including lack of commitment to diverse talent development, ineffective mentoring programs, and inadequate pipeline of interested and prepared candidates (Henkel, 2016). This may be circular—if minority representation in hospital senior management is low, promising young people may be less interested in hospital management careers, as they do not see enough “people like me” in such hospital leadership jobs. But the supply issue, if true, appears not to be due to low enrollments of minorities in accredited programs for master’s degrees in health care management. Both Commission on Accreditation of Health Management Education (CAHME) and Association of University Programs in Healthcare Administration (AUPHA) reported more recently that minority graduate student enrollments in 2018 for programs these organizations accredit exceeded 40% of all students (ACHE, 2020), similar to minority population proportions.
Only two studies have tried to understand the role of market forces in the patterns of variation in minority management participation across markets and hospitals. Gaumer and Coulam (2009) found minority participation in all management levels combined (not just senior managers) was systematically related to size of the total population, proportion of minorities in the population, proportion of minorities with a college degree, and level of hospital competition in the MSA. 2 In a hospital-level analysis of professional employees (a category that excludes managers), Skaggs and Kmec (2012) found the percentage of minority professionals in a large sample of West Coast hospitals was positively related to, among other things: (1) the proportion of minorities in the patient population; (2) the percentage of hospital managers who were minority; (3) hospital characteristics, such as size, the degree of specialization, and the level of competition among hospitals; and (4) the state legal environment. Both Skaggs and Kmec (2012) and Gaumer and Coulam (2009) found that the presence of teaching hospital status had no impact. Neither of these articles examined senior managers directly.
EEO-1 data since 2007 provide an important opportunity to focus on the diversity of senior managers in private hospitals. But no published study uses EEO-1 data to analyze the racial diversity of senior management of hospitals, in relation to area market and demographic factors. Indeed, there are only two published studies using EEO-1 data to study diversity in senior management (Kurtulus & Tomaskovic-Devey, 2012; and Kmec & Skaggs, 2014), but these are studies of industries generally (not just hospitals) and focus on gender (not race/ethnicity). Of the studies that focus on racial/ethnic diversity in hospital or health care employment, one (Skaggs & Kmec, 2012) looks at hospital professionals (e.g., nurses and employed doctors) but not managers or senior managers. One study (Kalev, 2009) examines how organizational conditions and practices affect minority representation in managerial and professional positions in health care organizations generally, not just in hospitals. The study shows that, controlling for several measures of labor supply, the policies and practices of health service organizations—such as targeted recruitment programs for minorities, employer-provided training, and work/family accommodations—have a significant effect on the diversity of their professionals and managers (the Kalev study focuses on all managers, as the 30-year longitudinal data set on which this study is based predates the separate reporting of senior managers in EEO-1).
Methods and Data
Conceptual Model
Our objective is to understand minority representation in hospital senior management positions in the United States., and the extent to which demographic and other market forces have been influencing these patterns. Hiring and promotion decisions are, of course, a product of myriad factors. We are in no position to analyze that complex process itself, as fine-grained data that would reveal patterns of hiring and promotion are not available. But aggregated data are available on how minority representation in senior management varies across metropolitan areas, as are data on market and demographic factors in those areas. A market model of supply and demand guides this work. Where the relative supply of minority labor is greater, we would expect the minority participation rate would be higher, and vice versa. We would also expect to see other differences across markets. Generally, when the hospital industry in a place is large, broad in scope, including teaching, we would expect to find larger institutions, more senior manager positions, and more active markets for senior manager recruiting. Such markets would be expected to provide more opportunities for making changes in minority participation in senior jobs (relative to markets with few senior managers, and less turnover). Markets endowed with more minorities and more minorities with college degrees are likely to have more internal candidates for open senior positions, and a larger pipeline for minorities in general. Market power of hospitals would also be expected to influence hiring practices. Following the economic theory of discrimination (Becker, 1971), we would expect that hospitals facing low-profit margins (due to competitive pressures) would be pressured to make hiring decisions more strictly on the basis of expected productivity and would not be able to forego maximum productivity in order to satisfy discriminatory tastes of senior officials, other workers, clients, or other stakeholders.
Research Questions
The research questions we examine about the market influences on minority participation in senior management are as follows:
Primary Data
The EEOC requires nongovernment employers with ≥100 employees and certain other employers to report workforce statistics annually by job category, race/ethnicity, and gender for each of their “establishments” with a separate physical address. These so-called EEO-1 Reports submitted from 2008 to 2014 are the primary data source here. 3 The definition of hospitals used in these data are based on the North American Industry Classification System code 622, which includes all inpatient facilities providing medical, diagnostic, and treatment services. There are three main omissions from EEO-1 data for our purposes:
Public hospitals: More than 20% of all U.S. hospitals do not submit EEO-1 reports because they are federal, state, and local government hospitals (AHA, 2020). Staffing of public hospitals may have a different profile, so our estimates for private hospitals not represent the diversity of all U.S. hospitals.
Small hospitals: Some hospitals are excluded from the study because they have less than 100 employees and are unlikely to submit EEO-1 reports if they are freestanding. This means that very small hospitals, likely less than 25 beds or so, are excluded unless they are part of a larger hospital organization. These exclusions are likely less than 10% of all hospital beds. 4
Contract workers: An EEO-1 “employee” must be on an employer’s payroll subject to Social Security tax, which means that most contract workers and employees of outsourced vendors are not included in the reports. The omission of contract workers might be especially important for studying certain job categories for which contract arrangements are common—such as physicians and emergency department staff—but is unlikely to be important for most senior levels of management, which contain few contract workers and are unlikely to be outsourced to another business.
In addition to these omissions in the data, the data themselves do not permit a practical crosswalk to American Hospital Association survey data on hospital characteristics or to Medicare data on case mix, services, and outcomes. This limitation constrains our options for testing the research questions, as it means that hospital-specific data from the AHA survey or Medicare is not available to crosswalk to EEO-1 data. EEOC data do not provide any provider-level information other than diversity, as is available from AHA and Medicare (e.g., volumes of care, casemix, service mix, costs and profitability, practice patterns).
As a result, most of our analyses in this study use a geographic (metropolitan area) unit of analysis. We group data for all hospitals and supporting units in each of 381 metropolitan areas, then analyze variations across these metropolitan areas. Our definition of metropolitan areas is based on the Core-Based Statistical Areas (CBSAs) defined by the U.S. Office of Management and Budget. We use the 381 metropolitan CBSAs existing in 2014 for computations in all years. 5 Of the 3,143 counties and county equivalents in the United States, 1,168 counties were in the 381 metropolitan CBSAs in 2014, containing more than 90% of U.S. population and hospital employment. This creates a fourth exclusion for our study:
4. Rural Hospitals: The 381 metropolitan markets we study exclude low population areas by design. However, the exclusion of low population areas means that we do not include rural counties and the hospitals in those places. These places represent nearly half of all U.S. counties. They have about 10% of the population, 7,254 hospital senior managers, and minority participation of 18.7%—a higher percentage than in metropolitan areas.
For some analyses not reported here, we do use the hospital as a unit of analysis—for example, in our description of how hospital senior management teams vary by the size of the management team (see Supplemental Table S1 [available online] and discussion of method for creating hospital units from EEOC reporting units).
Job Categories for Our Analysis
As noted, prior to 2007, EEO-1 used a single, inclusive “Officials and Managers” category to capture data on the diversity of management in reporting institutions. Starting in 2007, data for senior managers and mid-level managers were reported separately to EEOC by all industries, including hospitals (EEOC, 2006). “Senior level officials and managers” (hereinafter, “senior managers”) are . . . chief executive officers, chief operating officers, chief financial officers, line of business heads, presidents or executive vice presidents of functional areas or operating groups, chief information officers, chief human resources officers, chief marketing officers, chief legal officers, management directors and managing partners” and “ . . . [others] within two reporting levels of the CEO, whose responsibilities require frequent interaction with the CEO. (EEOC, 2006)
To provide useful comparisons to the patterns of diversity for senior managers, we calculate statistics and perform analyses on three more job categories:
Mid-level managers, who are all other managers and officials apart from the most senior managers.
Professionals, who have jobs that “require bachelor and graduate degrees, and/or professional certification.” In hospitals, the most important positions in this category are nurses and physicians, but this category also includes positions like dieticians, accountants, auditors, and computer programmers.
All other hospital employees, who are the remainder after subtracting senior managers, mid-level managers, and professionals from the total number of hospital employees. We summarize these results below and report the detailed table of results in Supplemental material, available online.
Race Categories
For our purposes, there are four important race categories reported in EEO-1: White (not Hispanic or Latino), Hispanic or Latino, Black/African American (not Hispanic or Latino), Asian (Not Hispanic or Latino). 6 To keep the analysis manageable, we frequently combine all three of the race categories into a minority category.
Use of Area Resource File for Market/Area Covariates
The regression models we use below draw on independent variables from the Area Resource File, a health resource information database maintained by U.S. Department of Health and Human Services, containing more than 6,000 variables for each of the nation’s counties. We selected independent variables in Area Resource File to describe characteristics of local labor markets and health systems that might influence hospital labor markets including minority participation at senior and other levels in hospitals. These were described above in our overview of our model. They include characteristics of the population (including educational attainment), health industry, hospitals, and services in the communities.
The specific measures we use to examine our research questions about market influence on minority participation rates are as follows:
Characteristics of the health industry, hospitals, and services that differ across places Region of country: There are some regional patterns of medical practice and hospital care (e.g., lengths of stay), insurance and payment differences, and availability of certain racial/ethnic populations. Hospital beds per 1,000 persons: Number of beds suggests overall level of demand for hospital care in the community. Interns + residents per 1000 beds: An indicator of teaching levels in the local community, hospital prestige, and incoming referral demand levels. Market structure of the hospital industry: Competitiveness of the hospital industry is expected to be associated with prices charged by hospitals, average size of hospital organizations, and degree of financial pressure on hospitals.
Characteristics of the population size and composition in the communities Total population in the metropolitan area: Influences overall demand for care in community, the demand for specialized hospital services, and the availability of applicants. Proportion of the minority population: Measure of the relative size of the minority base of hospital clients and the size of the potential minority applicant pool.
Availability of college educated persons in the communities Ratio of minority percentage to majority percentage with bachelor’s degrees: Indicator of availability of potentially qualified minority applicants in relation to majority applicants.
This study uses aggregated employment data reported by hospitals to the EEOC—the so-called EEO-1 reports—and community data compiled by the U.S. Department of Health and Human Services. No data on individuals is utilized in the research.
Market Concentration
To measure the market structure of the hospital industry in each CBSA, we employ an index of the degree of concentration of hospitals. Other things the same, is the industry dominated by one or two large hospitals, or a larger number of smaller organizations? To measure the degree of concentration of the hospital industry, we use a standard Herfindahl-Hirschman Index to measure the extent of concentration of total hospital employment in the CBSA. This index is commonly used by economists to describe the extent of monopoly power (or competition) in local markets. 7 Values range from 0 to 1. Values close to 1 for the index would characterize an industry composed of only one hospital, or a dominant hospital and several small competitors. (i.e., significant monopoly power). Values close to zero would occur in CBSAs with many smaller hospitals. An industry of two equal sized hospitals in a market would have a value of 0.5.
Regression Analyses
For analyses of the “percent minority senior managers,” it arguably is not appropriate to use simple regression because so many of the CBSAs have no senior managers (in 2014, 118 of 381 areas, or about one third, had zero minority senior managers, as shown in Table 1). Notably, this censoring of the dependent variable is an even bigger issue for analyzing participation by individual minority races/ethnicities, which have even higher proportions of empty cells.
Trends in U.S. Hospital Workforce, 2008 to 2014.
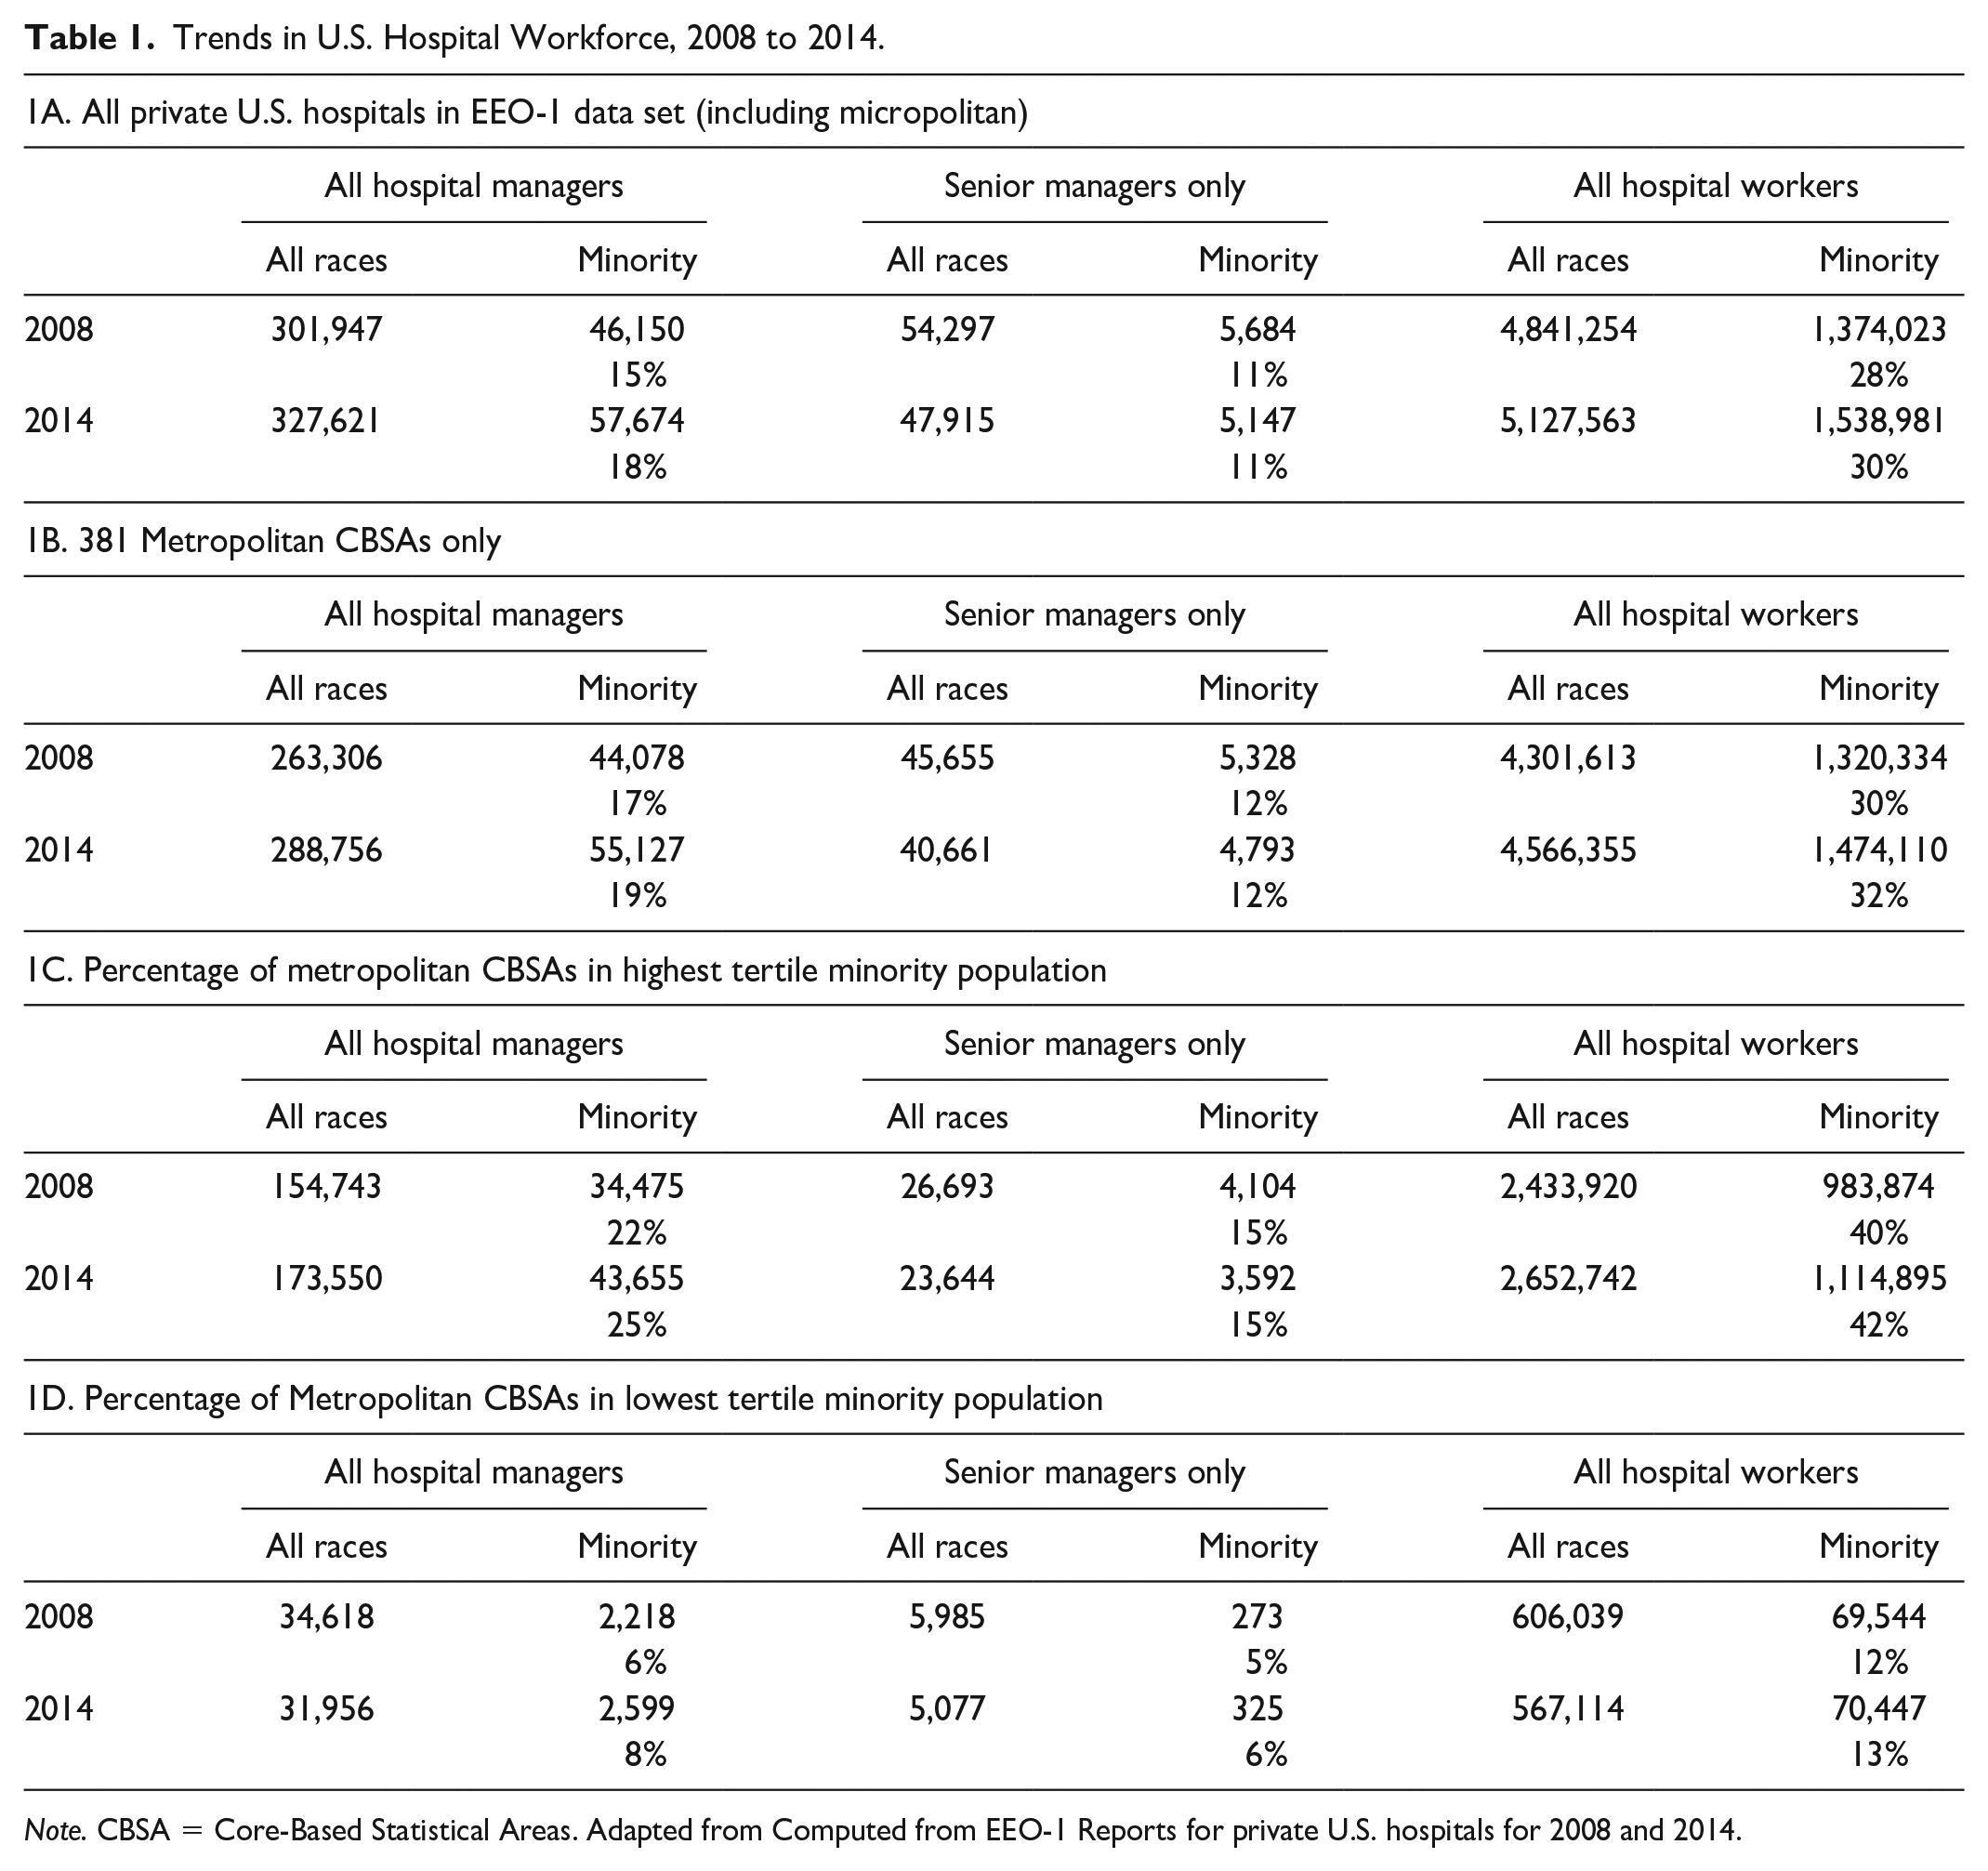
Note. CBSA = Core-Based Statistical Areas. Adapted from Computed from EEO-1 Reports for private U.S. hospitals for 2008 and 2014.
Two different types of regression models are used. To explore market and demographic factors associated with areas having at least one minority senior managers (as contrasted with zero minority senior managers), we used a logistic regression model (Table 2, Model 1) with a binary dependent variable indicating whether the number of minority senior managers in 2014 was zero (0), or more than zero (1). Second, to analyze the percentage of minority senior managers for areas that have more than one minority senior managers (Table 2, Models 2-5 in our results), we utilize negative binomial regression models from SAS Institute (2009) to overcome the biased estimates that arise from censoring in ordinary least squares (OLS) regression models. 8
Regressions for Senior Minority Manager Participation Percentage in Hospitals, 2014.
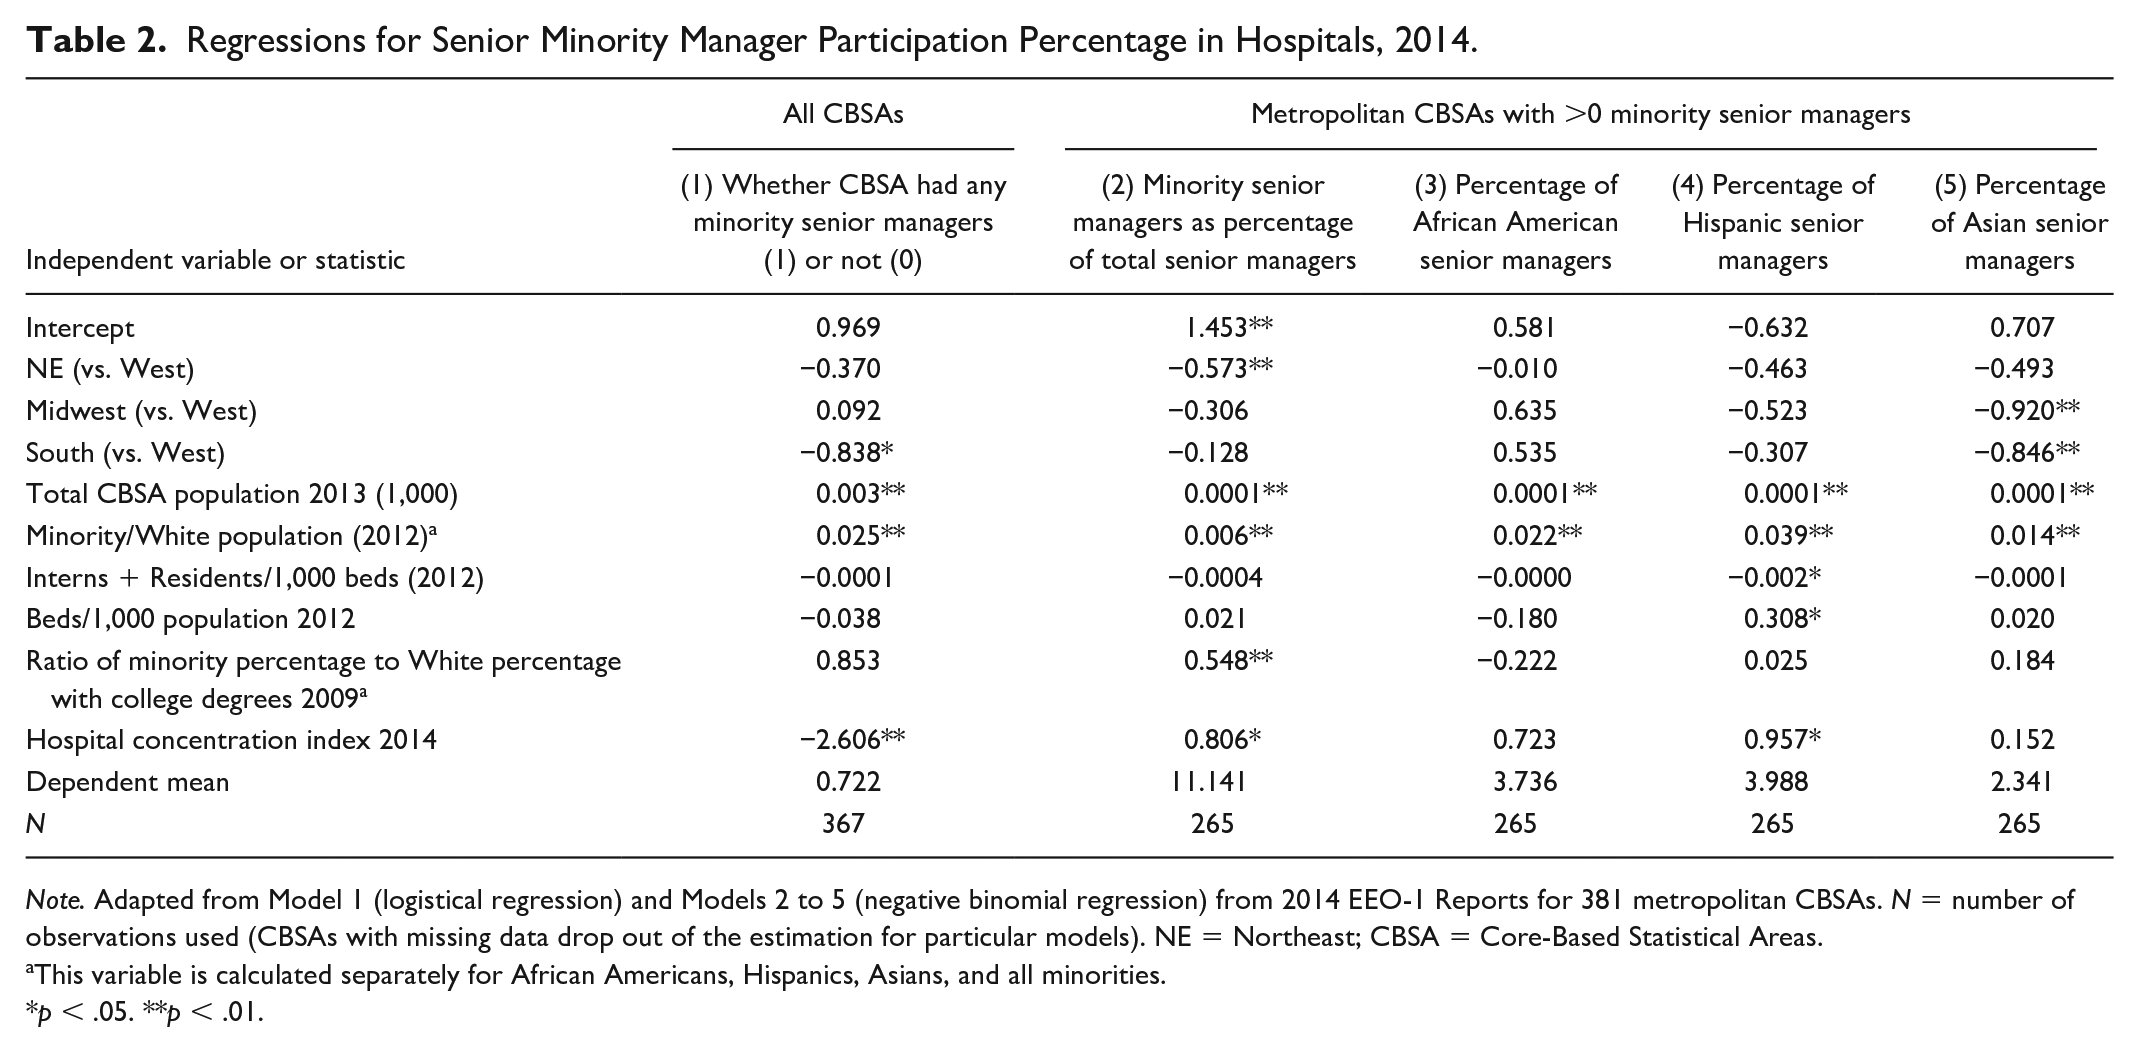
Note. Adapted from Model 1 (logistical regression) and Models 2 to 5 (negative binomial regression) from 2014 EEO-1 Reports for 381 metropolitan CBSAs. N = number of observations used (CBSAs with missing data drop out of the estimation for particular models). NE = Northeast; CBSA = Core-Based Statistical Areas.
This variable is calculated separately for African Americans, Hispanics, Asians, and all minorities.
p < .05. **p < .01.
We are also interested in factors associated with levels of minority participation in other job categories (mid-level managers, professionals, and all other hospital employees), because they provide important comparative results for the models on senior managers. Because all CBSAs in our data set have some minority employees in these broader categories, we do not have the censoring problems, so we use conventional OLS regression estimators. These models are shown in the Online Supplemental material.
Descriptive Findings
Table 1 shows the workforce in U.S. hospitals in 2008 and 2014. The top panel shows all U.S. private hospitals, rural and metropolitan. The bottom three panels show the workforce in the 381 metropolitan CBSAs. Based on EEO-1 reports, the private hospital industry was growing from 2008 through 2014, providing over 5 million jobs by 2014 (1A of Table 1). At the same time, the number of minority managers in private U.S. hospitals in total, across all levels of management (senior + middle/lower) was higher than ever before—almost 58,000 in 2014, up from 46,150 in 2008. The results for the 381 metropolitan CBSAs are similar (1B of Table 1) but show roughly a percentage point greater minority representation in the metropolitan areas.
However, the story about industry growth and minority participation in hospital management is somewhat different for senior managers.
The number of senior manager jobs for all races in U.S. hospitals actually declined continuously from 2008 to 2014, 9 from 54,297 to 47,915, possibly due to consolidation trends in the industry. 10 The decline was similar in magnitude in the metropolitan areas.
The number of minority senior managers declined as well, from 5,684 in 2008 to 5,147 in 2014, a reduction of about 10% (a slightly smaller percentage decline than for all races combined). The proportion of minority senior managers in 2014 (11%) was essentially unchanged from 2008. 11 (Results for metropolitan CBSAs are similar though again a percentage point higher.) It is fair to say that minorities held their own overall in the general reduction of senior management jobs from 2008 to 2014, but their position clearly did not improve.
1C and 1D of Table 1 look at the presence of minority senior managers for areas where minorities are a larger percentage of the population (1C—the upper third of CBSAs in terms of percentage of minority population) or a lower percentage of the population (1D—the lowest third of CBSAs). Tables 1C and 1D of Table 1 confirm the expected relationship. On average, communities with more minorities have a higher participation rate in senior management (approximately three percentage points higher than the average for all CBSAs combined). The communities with a smaller minority population have a lower minority participation rate in senior management (six percentage points lower than average).
What do senior management teams look like in private U.S. hospitals in 2014? We report in Supplemental material (available online) on the size structure of senior management teams, and their minority representation. Overall, only 43% of all 3,123 metropolitan hospitals have any minority senior managers at all. Senior management teams vary in size—about half the hospitals have teams with fewer than five senior managers, and 12% of metropolitan hospitals have teams composed of more than 25 senior managers. Only 23% of the smallest teams (1-5), but 87% of large teams (25 or more), have a minority senior manager. Thus, smaller management teams are less likely to have at least one minority senior manager.
Statistical Results
Using 2014 data on 381 metropolitan CBSAs, we estimate regression models on hospital minority employment to understand what particular hospital industry characteristics and labor market factors systematically influence the variation in minority participation in hospital employment.
In Table 2, we use logistic regression to explore the factors that are associated with a CBSA having any minority senior managers in any of its hospitals (Model 1). Then, to analyze the percentage of minority senior managers for the market areas that have one or more minority senior managers (Models 2-5), we utilize negative binomial regression models from SAS to overcome the biased estimates that come from censoring in OLS regression models.
Model 1: Whether the CBSA in 2014 Had One or More Minority Senior Managers in Area Hospitals, or Not
This Logit model examines the influence of hospital and labor market characteristics on the likelihood of a CBSA having any minority senior managers at all. Other things the same, CBSAs with larger populations and higher ratios of minorities to whites are more likely to have some minority senior managers—a result suggesting, plausibly enough, that the absence of minority hiring is sensitive to the size of the total population and proportion of the minority population. CBSAs in the South are less likely to have any minority senior managers, other things equal—our data do not tell us why that would be so, and previous surveys of minority representation (e.g., AHA, 2015, ACHE, Asian Healthcare Leaders Forum, Institute for Diversity and Health Equity, National Association of Health Services Executives, & National Forum for Latino Healthcare Executives, 2015) do not report results by region that might shed light on this result. Meanwhile, hospital markets that are more concentrated (i.e., more monopoly power and with fewer, larger facilities) are less likely to have any minority senior managers, a result possibly consistent with our earlier hypothesis (per Becker, 1971) that hospitals in more concentrated markets may have more financial latitude to exercise discretion to limit minority candidates. Put differently, these results show that, other things the same, less concentrated, more competitive hospital markets are more likely to have at least one minority senior manager than other CBSAs.
Models 2 to 5: Percentage of Minority Participation in Senior Management
These models take metropolitan areas with at least one senior manager in the CBSA and examine whether the variation in minority participation for different race/ethnic groups can be explained by hospital and labor market characteristics. The only regional differences that are statistically significant are found in the northeast region, where minority participation rates in senior management are, other things the same, about 5% lower than the reference region of the West (−0.573 lower in the northeast on a national base of about 12 percentage points). Larger populations, higher population ratios of minorities to Whites, and relative minority educational attainment are all also associated with more minority senior managers.
But the leverage of these factors on minority participation rates in senior management tends to be quite small. Increasing the minority population ratio relative to Whites from 40/60 to 50/50, for example, would increase the senior manager participation rate from about 12% to only about 12.2%. Relative educational attainment of minorities also has the expected effect: Higher relative college degree attainment by minorities is associated with higher minority participation in senior management. But again, the coefficient suggests that if the racial gap in baccalaureate educational parity for minorities were closed (from 0.76 to 1.0), this would increase minority participation rates in senior management from about 12.00% to only about 12.14%.
Model 2 also shows that in CBSAs with at least one minority senior managers, more concentrated hospital markets (fewer, larger facilities) are associated with more minority participation in senior management. This is in contrast with Model 1, where we find that more concentrated markets are less likely to have at least one minority senior manager. The best explanation for this inconsistency is that the CBSAs without any minority senior managers are different in important ways from CBSAs with at least one minority senior manager. Specifically, the places with no minority senior managers tend to be small markets—overall, they contain less than 10% of the total U.S. CBSA population, only a small percentage of all senior managers (4% to 5% of the total senior managers in all CBSAs), and only a small proportion of the total hospital bed capacity in our sample (10%). 12 They are still metropolitan areas according the CBSA definition, but they generally are not large ones.
African Americans Model 3
African American participation in senior hospital management is associated with only two population factors: The total population of the CBSA and the ratio of African Americans to the White population. Both are positive influences on the senior management participation rate.
Hispanics Model 4
Hispanic participation in senior hospital management is significantly influenced by five of the variables in the model. As with African Americans, Hispanic senior management participation is positively influenced by total population and by the relative size of the Hispanic population. But three hospital market variables also affect Hispanic participation: Greater hospital concentration and the number of beds per 1,000 have a positive effect on Hispanic presence; and interns + residents per 1,000 beds has a slightly negative effect.
Asians Model 5
Asian participation in hospital senior management is negatively influenced by two regional variables (Midwest and South coefficients, in relation to West), but, as for Blacks and Hispanics, positively influenced by total population size of the CBSA and the relative size of the Asian population to the White population. The availability of Asians with college degrees is positively related to employment, but the coefficient is not very significant (p < .10).
Four conclusions stand out from these results. For each of the three races and all minorities taken together, the size of the population and proportion of minorities in the population are associated with larger minority presence in senior management.
Relative educational attainment has a positive influence on the presence of minorities overall in senior manager jobs (positive sign on the coefficients) but is not significant (p < .05) for any racial group considered individually.
For all minorities taken together the Northeast region has lower minority senior management participation rates than the West. For minorities considered individually, the region variable is significant only for Asians, for whom the Midwest and the South are negatively associated with participation relative to the higher levels in the West region.
Greater hospital concentration is positively associated with representation for all minorities taken together, and for Hispanics.
As reference groups, Table 3 presents comparable models on the percentage of minority participation in other employment categories in hospitals (mid-level managers, professionals, and all other hospital workers). The minority percentages in these job categories are higher than for senior managers. In metropolitan hospitals in 2014, the minority participation rate for senior managers is only 12%, while the rates for other hospital job categories are mid-level managers (20%), professionals (16.5%), and all other hospital workers (32%).
Regressions of Minority Participation in Hospital Employment in Other Job Categories Across Metropolitan CBSAs in 2014.
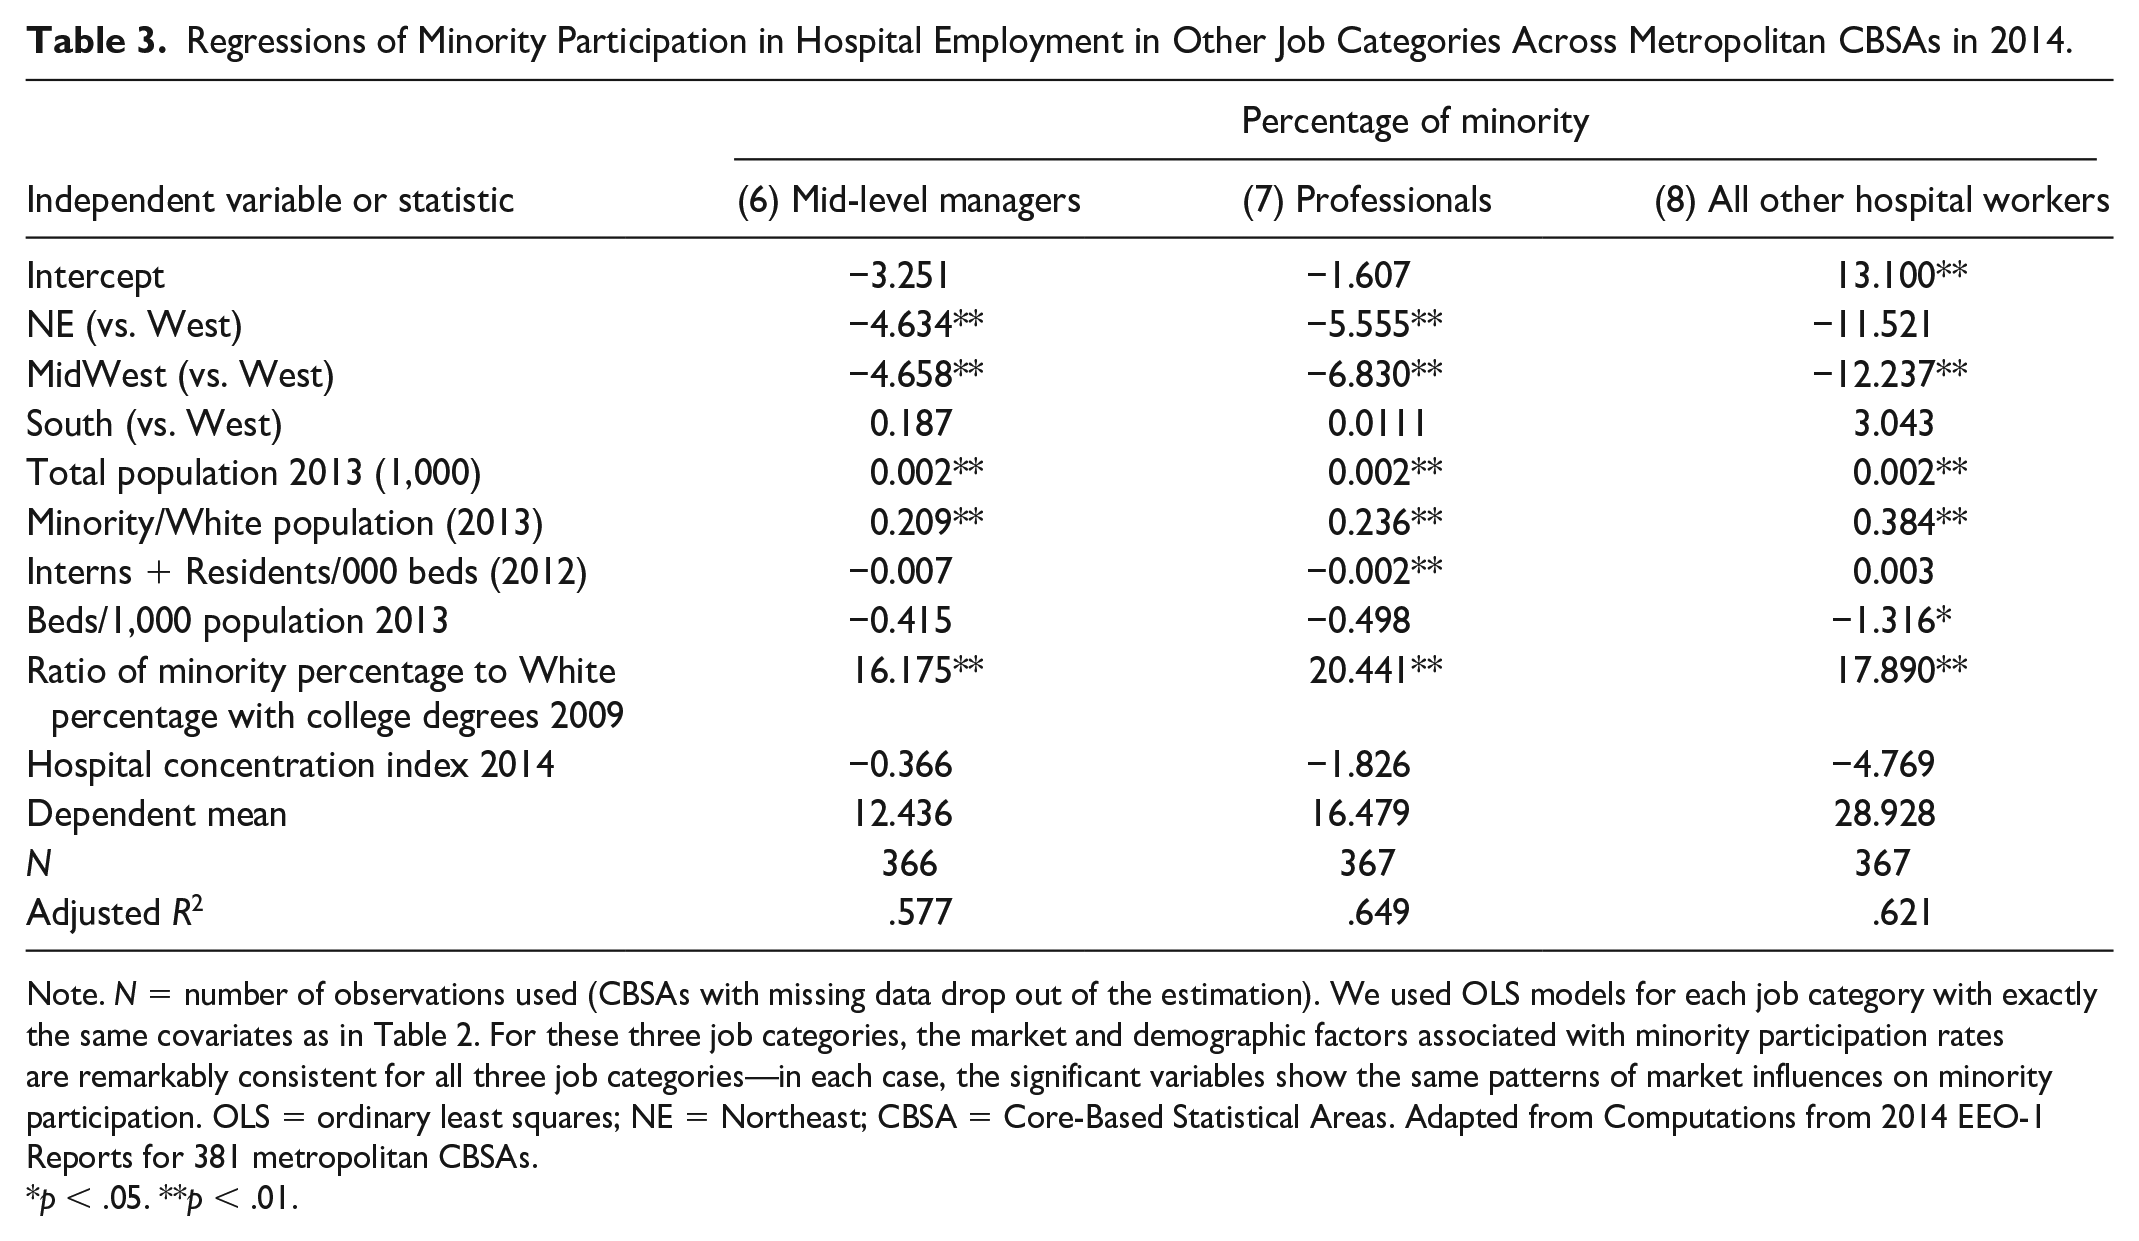
Note. N = number of observations used (CBSAs with missing data drop out of the estimation). We used OLS models for each job category with exactly the same covariates as in Table 2. For these three job categories, the market and demographic factors associated with minority participation rates are remarkably consistent for all three job categories—in each case, the significant variables show the same patterns of market influences on minority participation. OLS = ordinary least squares; NE = Northeast; CBSA = Core-Based Statistical Areas. Adapted from Computations from 2014 EEO-1 Reports for 381 metropolitan CBSAs.
p < .05. **p < .01.
We used OLS models for each job category with exactly the same covariates as in Table 2. For these three job categories, the market and demographic factors associated with minority participation rates are remarkably consistent for all three job categories—in each case, the significant variables show the same patterns of market influences on minority participation.
Northeast and Midwest have significantly lower minority participation in all three job categories.
Three factors are significant influences on minority participation for all three job categories: (1) total population size, (2) minority population in relation to the White population, and (3) relative college degree attainment for minorities.
The size of the effects (coefficients) of these three market factors on minority participation is notably larger for these three job categories than for senior managers. To illustrate: if the ratio of the minority population to the White population rose from today’s level (40/60) to be equal (50/50), the consequence for mid-level managers would be an increase from 20% minority participation to 27%; the effect for professionals would be a rise from 16.5% to over 24%; and the effect on minority participation for all other hospital jobs would go from 32% to about 45%. In contrast, Table 2 models show that this same population change would cause minority participation in senior management to increase minority participation from 12.00% to only 12.2%. Changes in demographics will not organically increase current low-participation rates for minorities.
Discussion
Minority participation in senior management teams of hospitals is very limited and has not really improved since the EEOC began to collect information on this category of workers in 2007. Overall, about nine in 10 senior manager jobs continue to be held by White employees. In the 381 metropolitan CBSAs studied here, there were about 48,000 senior management jobs, including 5,147 minorities (Table 1). The minorities are thinly distributed, across just 43% of the over 3,100 metropolitan hospitals. What this means is that most hospitals do not have any minority senior managers. Those that do have minority senior managers have only a few. The so-called C-suite of a typical private metropolitan hospital is largely or entirely White.
The minority representation in the senior manager category is markedly lower than in the other three hospital job categories we study here. As argued by Blau et al. (2010), the higher risk of making a very senior hire may make decision makers more wary, and more conservative, in high-level minority hiring practices, and factors ranging from prejudice to unfamiliarity may consciously or unconsciously contribute to appraisals and perceived risks of minority candidates. Some have suggested that the appraisals of risk for hiring high-level, leadership positions can be mitigated by long work experience or effective “mentoring” programs in institutions (Henkel, 2016) and by other deliberate strategies for attracting more qualified young people of color into organizations (Cunningham & Jackson, 2020).
During our study period from 2008 to 2014, total hospital employment grew by about 6%, while the share of all hospital jobs held by minority workers grew twice as fast, by 12%. While this was a period of general growth in the hospital business, it was also a period of rapid consolidation in the industry, and the number of senior hospital managers in U.S. private hospital sector fell from about 54,000 to less than 48,000, a reduction in number of senior manager positions of about 11%. In this period of consolidation, minorities actually did a bit better, with senior manager jobs held by minorities declining by a somewhat smaller amount (a reduction of less than 10%).
This relationship between industry consolidation and increasing opportunities for minority senior managers is somewhat complex in our statistical results. For hospital employees other than senior managers (Table 3), it is clear that minority participation is unrelated to the structure of the hospital industry, whether heavily consolidated or composed of smaller hospitals. For senior managers, on the other hand, we do find that industry structure influences senior manager staffing. We studied the influence of industry structure, comparing CBSAs with at least one minority senior manager (two thirds of the places) with those CBSAs that had not minority senior managers (about one third of the CBSAs). Hospital industries that were more concentrated (as when there are fewer, larger facilities) are less likely to have at least one minority manager in the CBSA (Table 2, Model 1). As noted, these CBSAs without any minority senior managers appear to be relatively small CBSAs, with relatively small hospitals.
On the other hand, results for the two thirds of CBSAs covering 90% of the U.S. population that have at least one minority senior manager in the CBSA (Table 2, Model 2) show a different pattern. Among these markets, more concentration is associated with more minority senior managers, other things the same. This finding for all minority senior managers is confirmed for Hispanics but not for African American or Asian senior managers. More concentrated markets being associated with more minority participation is encouraging, given the continuing trends toward industry consolidation. This is contrary to the economic theory of discrimination (Becker, 1971), where more concentrated (less competitive) markets would be expected to have lower minority participation. More research on the how market consolidation and hospital size changes contribute to minority participation in senior management is needed to explain this unexpected finding.
We also show that minority participation on senior management teams is sensitive to other market and industry characteristics often associated with the available “pipeline” of minority candidates. The market measures we study include total population size, the relative size of the minority population, and the relative number of minorities with bachelor’s degrees (an indicator of the ‘availability’ of an educated labor supply). Minority participation in senior management (as well as other hospital jobs) is positively related to these characteristics of markets. But our models suggest that variations in these market factors do not have a great deal of leverage on the rate of minority participation in senior management hiring. Substantial changes in the relative size of the minority population or the relative baccalaureate degree attainment have infinitesimal impacts on changes in senior management participation. By contrast, the effect of these variables on minority participation in other hospital jobs we study (professionals, middle managers, and all other hospital workers) is quite large. Thus, while market and demographic changes in the future can be expected to have rather small impacts on the diversity of hospital leadership, they will have much larger impacts on other categories of hospital workers.
One of the factors in our models—relative minority population size—has had mixed effects in studies of minority management hiring. It was found here to be positively associated with more minority hiring of senior managers (and consistent with the simple descriptive results on upper and lower tertiles in Table 1). Similarly, in a study of all hospital managers (Gaumer & Coulam, 2009), more minorities in the population led to more minority hospital jobs. By contrast, looking at managers across all industries, Cohen and Huffman (2007) found that a greater proportion of African Americans in the local labor market significantly increases the odds that Blacks will be more underrepresented in managerial roles in local firms.
So, if the minority participation rate for senior managers is responsive to total population size, minority population size, and educational attainment and is also responsive to more hospital consolidation, why are minorities still so underrepresented in senior management? Why isn’t the participation rate for minorities closer to 40%, roughly the proportion of minority representation in the U.S. population? Is the problem the inadequate pipeline of qualified candidates? Here we cannot say for sure. As noted earlier, AUPHA and CAHME have reported that minority enrollments in graduate health management programs has been improving over time and, by 2018, had already surpassed 40% of total enrollments (ACHE, 2020). Of course, senior management positions require more than a new master’s degree, but it does appear that the pipeline, or supply issue, is improving and may eventually improve senior management participation as young minority health managers get jobs, gain experience, and get promoted. But for the time being, minority participation in hospital leadership may be suffering from limited pipelines of trained and experienced managers and underdeveloped mentoring and other “talent development” programs aimed at increasing diversity (Henkel, 2016).
As we show, the continuing increases in minority populations and minority educational attainment will help create more diversity at the senior management level—but not by much. An organic evolution of demographics and market forces may not increase senior management diversity very fast. Public policies and/or deliberate management strategies to increase diversity of senior management are going to be needed to move faster.
Limitations
The somewhat stagnant situation in minority participation in senior manager positions in hospitals may not be unique. Other private industries (education, insurance, medicine, biotech, and others) may be similar or not. The EEOC has data on all private industries and could support research across a much wider spectrum than we have examined here. That other industries might be interesting to study is suggested by Figure 1, which shows better performance by other industries (more precisely, all other private industries combined) in hiring minorities into their senior management. The fact that the EEOC was only able to start tracking senior managers in organizations after 2007 limits the time span available for other studies. But research on these other markets might add an important perspective to the situation in hospitals.
This study is also limited in the availability of data about local marketplaces. Ideally, we would have liked to include information about the local hospital industry salary levels, export/import of patients from other CBSAs, a case mix measure, and a measure of graduation rates from local health administration or business master’s programs. A reviewer correctly points out that, by conducting the analysis at the CBSA level (rather than the hospital level), we likely omitted important hospital-level explanatory factors. This is certainly true, though to do this would be extremely difficult, given that there is no natural way to crosswalk AHA hospital survey and other data to the EEOC establishment-level data.
Supplemental Material
sj-pdf-1-mcr-10.1177_10775587211016605 – Supplemental material for Minority Participation of the Senior Management of Private U.S. Hospitals
Supplemental material, sj-pdf-1-mcr-10.1177_10775587211016605 for Minority Participation of the Senior Management of Private U.S. Hospitals by Gary Gaumer, Robert Coulam and Rose Desilets in Medical Care Research and Review
Footnotes
Declaration of Conflicting Interests
The author(s) declared no potential conflicts of interest with respect to the research, authorship, and/or publication of this article.
Funding
The author(s) received no financial support for the research, authorship, and/or publication of this article.
Supplemental Material
Supplemental material for this article is available online.
Notes
References
Supplementary Material
Please find the following supplemental material available below.
For Open Access articles published under a Creative Commons License, all supplemental material carries the same license as the article it is associated with.
For non-Open Access articles published, all supplemental material carries a non-exclusive license, and permission requests for re-use of supplemental material or any part of supplemental material shall be sent directly to the copyright owner as specified in the copyright notice associated with the article.