
Abstract
As of January 1, 2021, most U.S. hospitals are required to publish pricing information on their website to promote more informed decision making by consumers regarding their care. In a nationally representative sample of 470 hospitals, we analyzed whether hospitals met price transparency information reporting requirements and the extent to which complete reporting was associated with ownership status, bed size category, system affiliation, and location in a metropolitan area. Fewer than one quarter of sampled hospitals met the price transparency information requirements of the new rule, which include five types of standard charges in machine-readable form and the consumer-shoppable display of 300 shoppable services. Our analyses of hospital reporting by organizational and market attributes revealed limited differences, with some exceptions for nonprofit and system-member hospitals demonstrating greater responsiveness with respect to the consumer-shoppable aspects of the rule.
Introduction
Roughly three in five Americans are covered by private health insurance. Spending on the privately insured has increased 50% in the past decade, driven largely by growth in health care providers’ prices (Peterson-KFF, 2021). These prices are set via negotiations between providers and insurers and vary dramatically across hospitals (Cooper et al., 2019). Data on negotiated prices between hospitals and insurers are typically proprietary, limiting research and evidence-based policymaking. In November 2019, the Centers for Medicare and Medicaid Services (CMS) finalized the hospital price transparency rule. This rule requires hospitals to publish “standard charges,” including negotiated rates for (a) all services in a machine-readable format and (b) a list of 300 “shoppable services” in a “consumer shoppable format” along with a plain-language summary beginning on January 1, 2021 (Department of Health and Human Services, 2019).
New Contributions
In this Data and Trends article, we provide the first systematic investigation of CMS’ hospital price transparency rule for a nationally representative sample of general acute care hospitals. No peer-reviewed studies have described completeness of hospital reporting since the rule went into effect in 2021 or the extent to which completeness of reporting is associated with specific organizational or market attributes.
Study Data and Methods
We drew a random sample of hospitals from the universe of U.S. general acute care hospitals in the 2018 Healthcare Provider Cost Report Information System, made available by the RAND Corporation (2021). See online supplemental appendix for a list of sampled hospitals. To obtain a nationally representative sample of hospitals, we first took a 20% random sample of the 306 hospital referral regions (HRRs) defined by CMS for 2018 (CMS, 2020). We stratified the randomization so that 50% of the sampled HRRs had a total Medicare population of at least 100,000 per HRR to ensure adequate representation of large and small HRRs in the sample (see online supplemental appendix for a list of sampled HRRs). Within each of the 61 HRRs selected, we then took a random sample of half of the hospitals in the HRR. After excluding 16 hospitals because they were not subject to the rule (e.g., Indian Health Services and Veterans Affairs Hospitals) or had closed since 2018, our final sample consisted of 470 hospitals. Analyses were weighted to be nationally representative after accounting for the two-stage stratified sample design and performed using Stata 16.
For each sampled hospital, we used an internet search to access hospital price transparency data. We categorized hospital reporting in two domains. Domain 1 assessed the extent to which hospitals reported the five required data elements (gross charges, discounted prices for self-pay patients, de-identified minimum and maximum negotiated rates, and payer-specific rates) in a machine-readable format. We defined machine-readable formats as structured data files that could be “automatically read and processed by a computer” following established definitions (Open Knowledge Foundation, n.d.). For example, data with clearly labeled variable names in a CSV, JSON, or XML format would be machine readable, while tables or descriptive text in a PDF would not.
Domain 2 assessed the extent to which hospitals reported price data in a consumer-shoppable format, defined by CMS as providing either a price comparison tool or a worksheet-based file with 300 “shoppable” services described in plain language. We considered the hospital as having a price comparison tool if the hospital website included specific language referencing a “cost estimator tool” or “price estimator tool” and if the corresponding link brought the user to a site where one could search for and request information in real time about the price of particular services. In general, such tools appeared to be developed through electronic health record capabilities or other third-party vendors. Tools frequently included drop down menus or buttons to select service types using layperson language to facilitate searches. In some cases, tools also requested users to provide information about insurance benefit designs to facilitate the generation of out-of-pocket cost estimates for a given service.
We were unable to assess which services were listed through the tool and whether the services listed were in fact “shoppable”—defined as at least 70 nonemergency services for which consumers could compare prices ahead of time; instead, we focused on whether a plain-language description was provided. Hospitals providing a price comparison tool or a worksheet with plain-language descriptions were considered consumer shoppable. Additionally, we assessed whether the tool required consumers to enter personal information, such as their health insurance member identification number. Searches were conducted by three research assistants and one author (JA). Collected data were then reviewed a second time by other authors to assess accuracy and completeness of coding. A typical search required approximately 9 to 12 minutes.
All sampled hospitals were included in the analysis, including those that reported no machine-readable data (11.9%), those that did not meet the consumer-shoppable requirements (25.3%), and those that were missing both (4.8%).
In addition to assessing whether posted data met the requirements above, we also explored whether some types of hospitals were more likely to meet the requirements than others. To this end, we stratified our analyses by hospital size, ownership, rural status, and system affiliation. This analysis is important because of perceived burden in advance of the rule for specific hospital types, especially small and rural hospitals (Ehnes et al., 2020).
Study Results
Overall, hospitals’ early responses to the price transparency rule were limited (Figure 1). One in four (25.2%) hospitals reported all required data elements in a machine-readable format (Domain 1). Considerably more hospitals (73.5%) reported data in a consumer-shoppable format (Domain 2). Considering the two domains together, only 23.7% of hospitals reported all required price data.
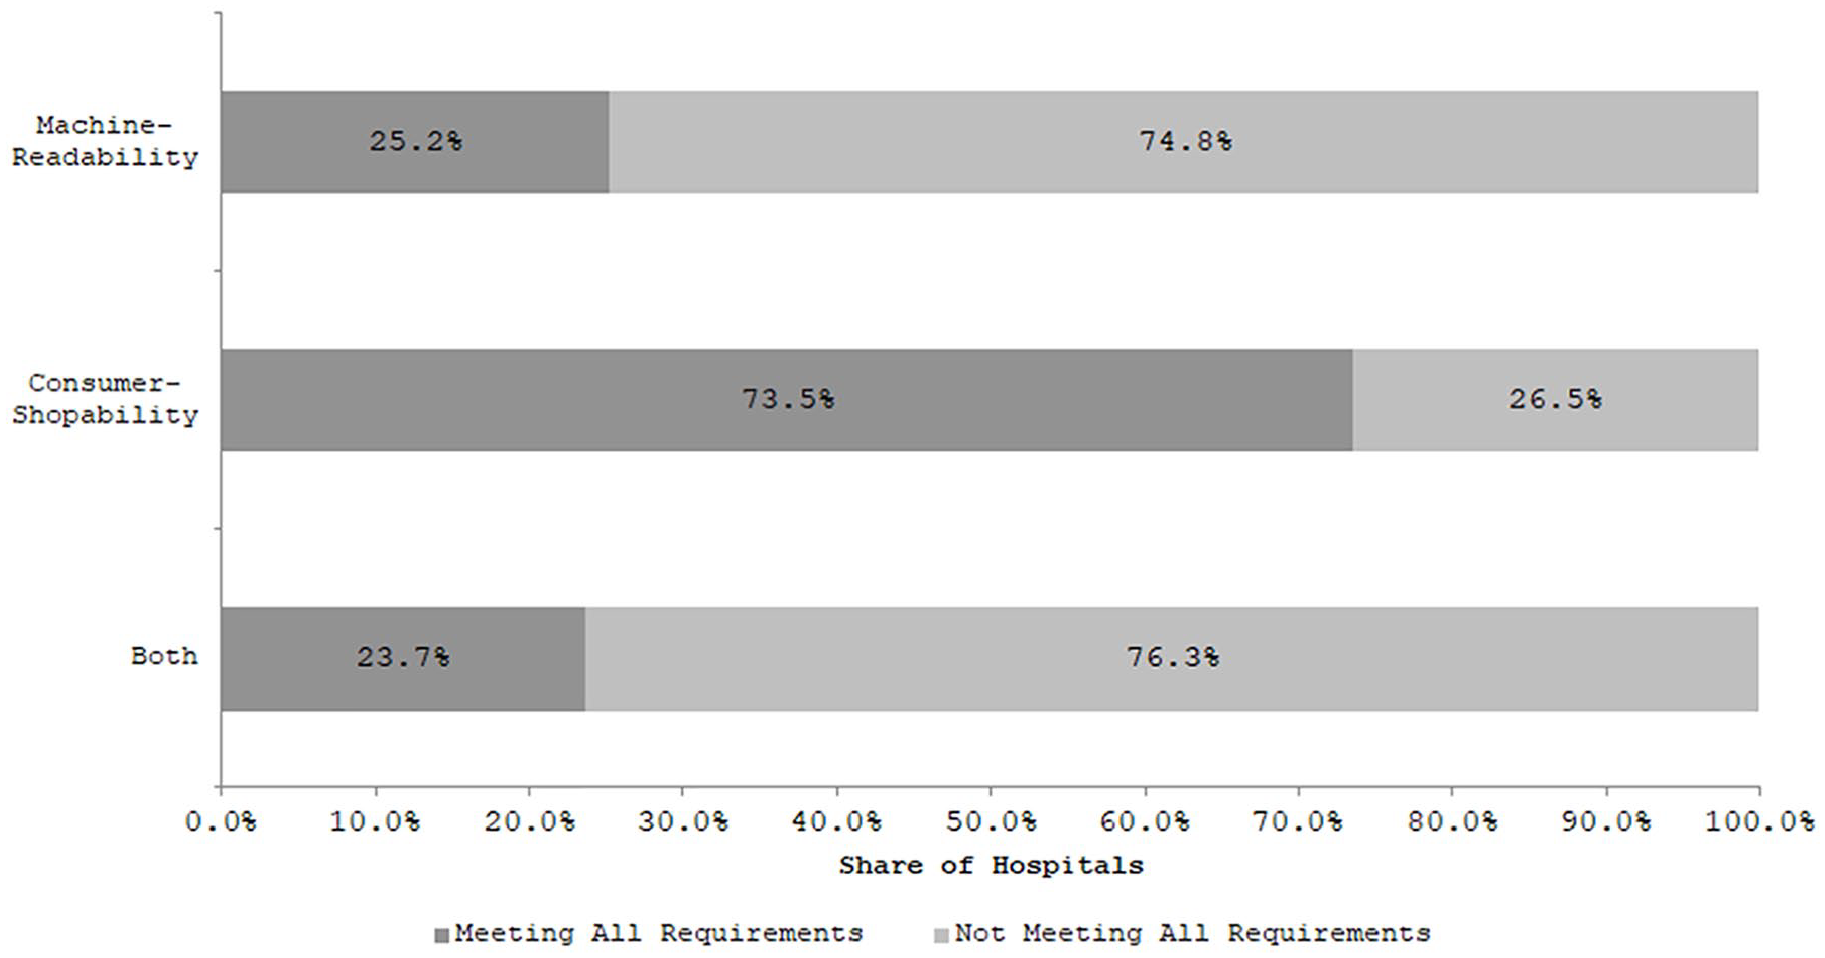
Share of sample hospitals meeting hospital price transparency requirements.
A large majority of hospitals reported some machine-readable data (87.4%), but far fewer provided payer-specific negotiated rates (Figure 2). Only 33.3% of hospitals provided any payer-specific price data, while 36.4% of hospitals reported minimum and maximum negotiated prices across payers. Of hospitals reporting payer-specific data, the number of unique payer plans ranged from 1 to 184 with a median of 15 (data not shown). Most hospitals reported information on gross charges (82.8%), and 43.7% of hospitals reported discounted cash prices faced by patients without insurance.
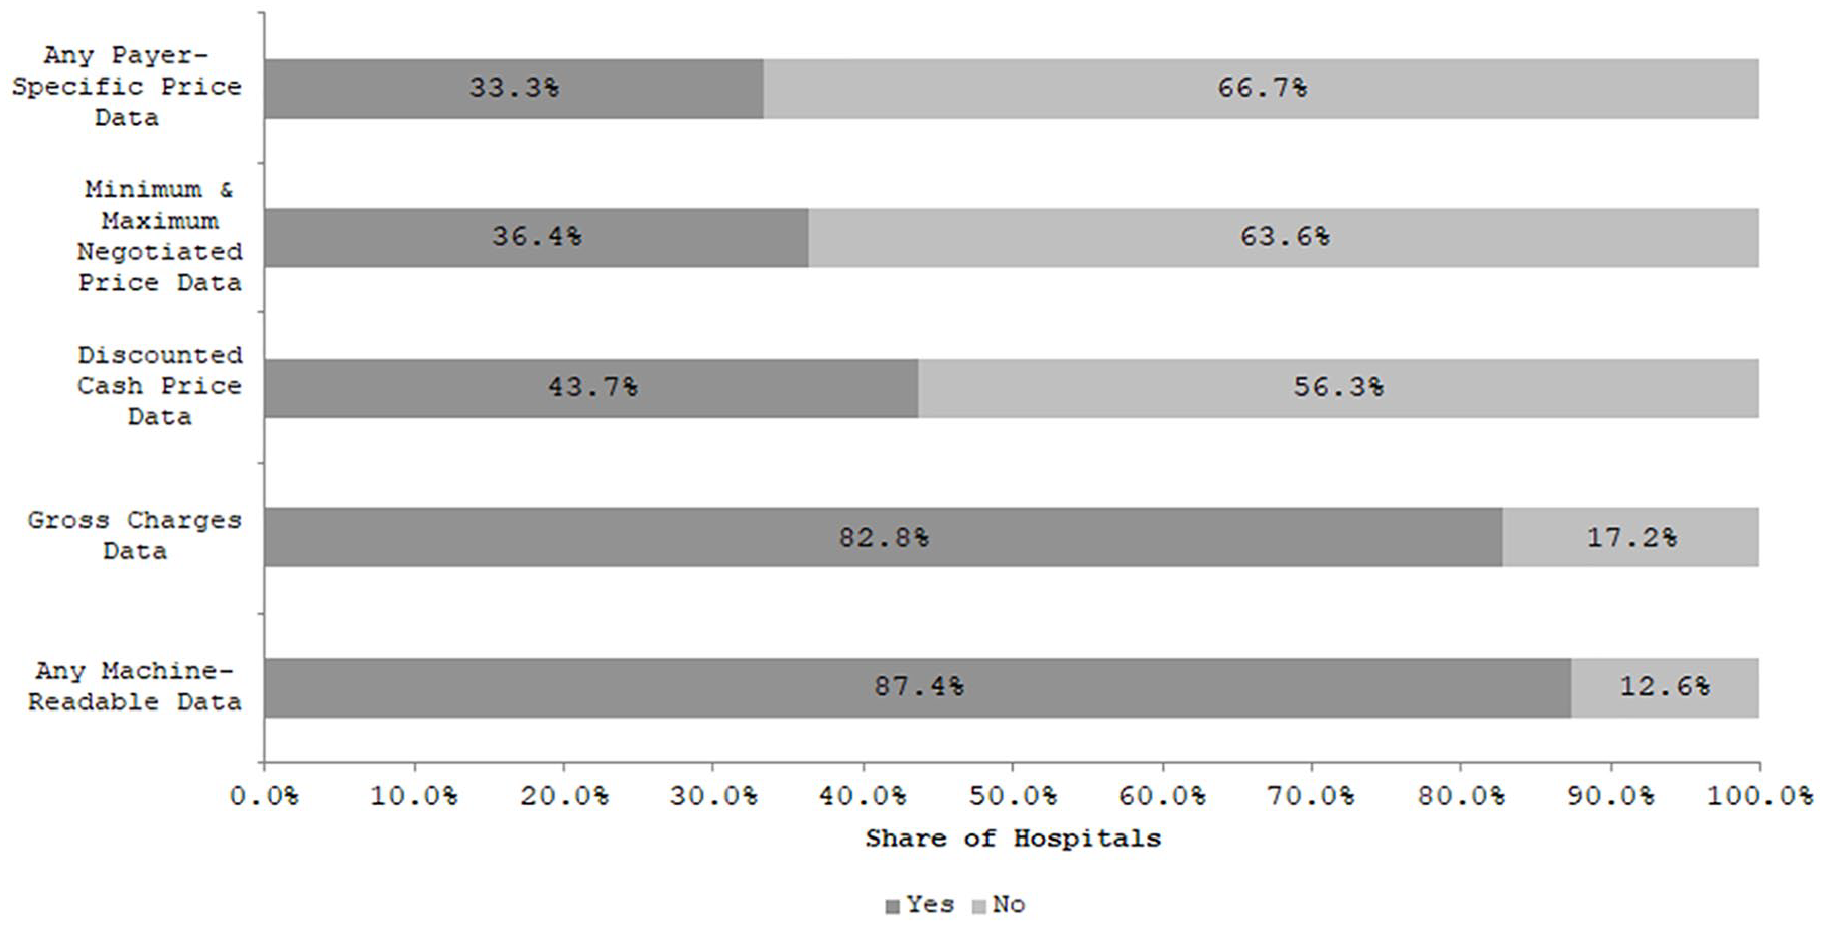
Share of sample hospitals meeting specific aspects of the machine-readability requirement.
There was little variation in machine-readable data reporting across different hospital types (Figure 3). The share of hospitals that reported data elements in Domain 1 was similar across facilities of different sizes, across metropolitan and nonmetropolitan areas, by system affiliation, and by ownership type.
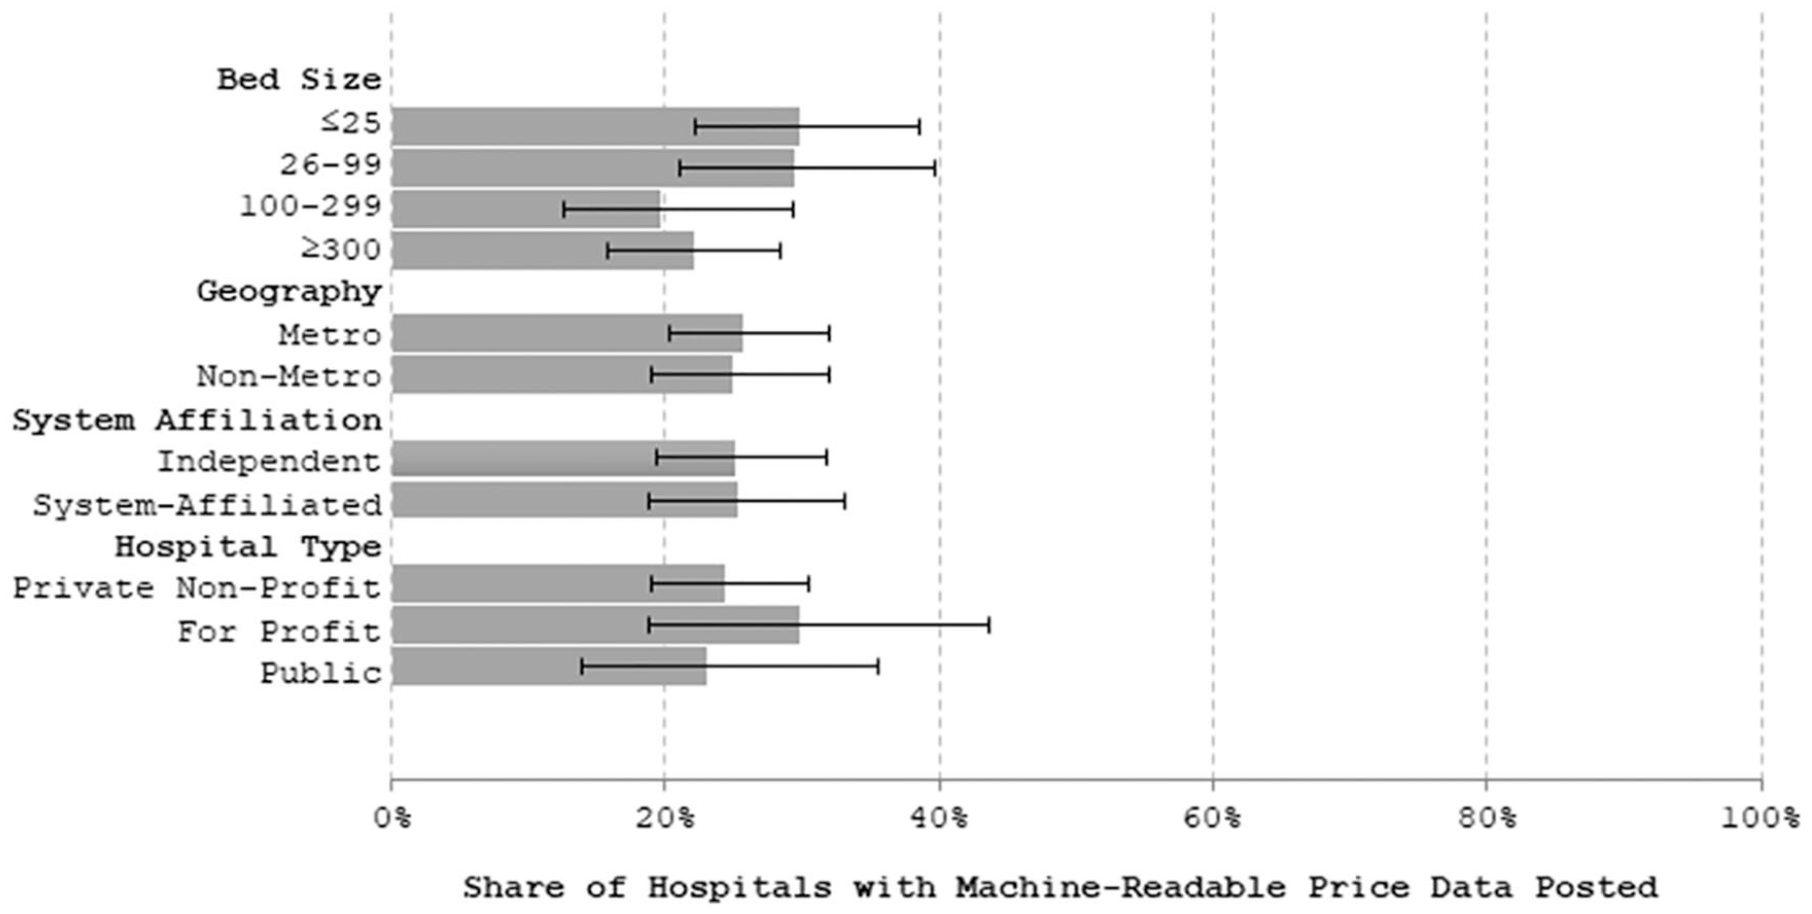
Share of hospitals meeting the machine-readable data requirement of the hospital price transparency rule by hospital characteristics.
Most hospitals (73.5%) reported some consumer-shoppable information (Figure 4). Of hospitals that provided consumer-shoppable information, 61.3% did so through price tools. Roughly, half (53.3%) of the hospitals provided access to the price tool without requiring that consumers disclose personal information.
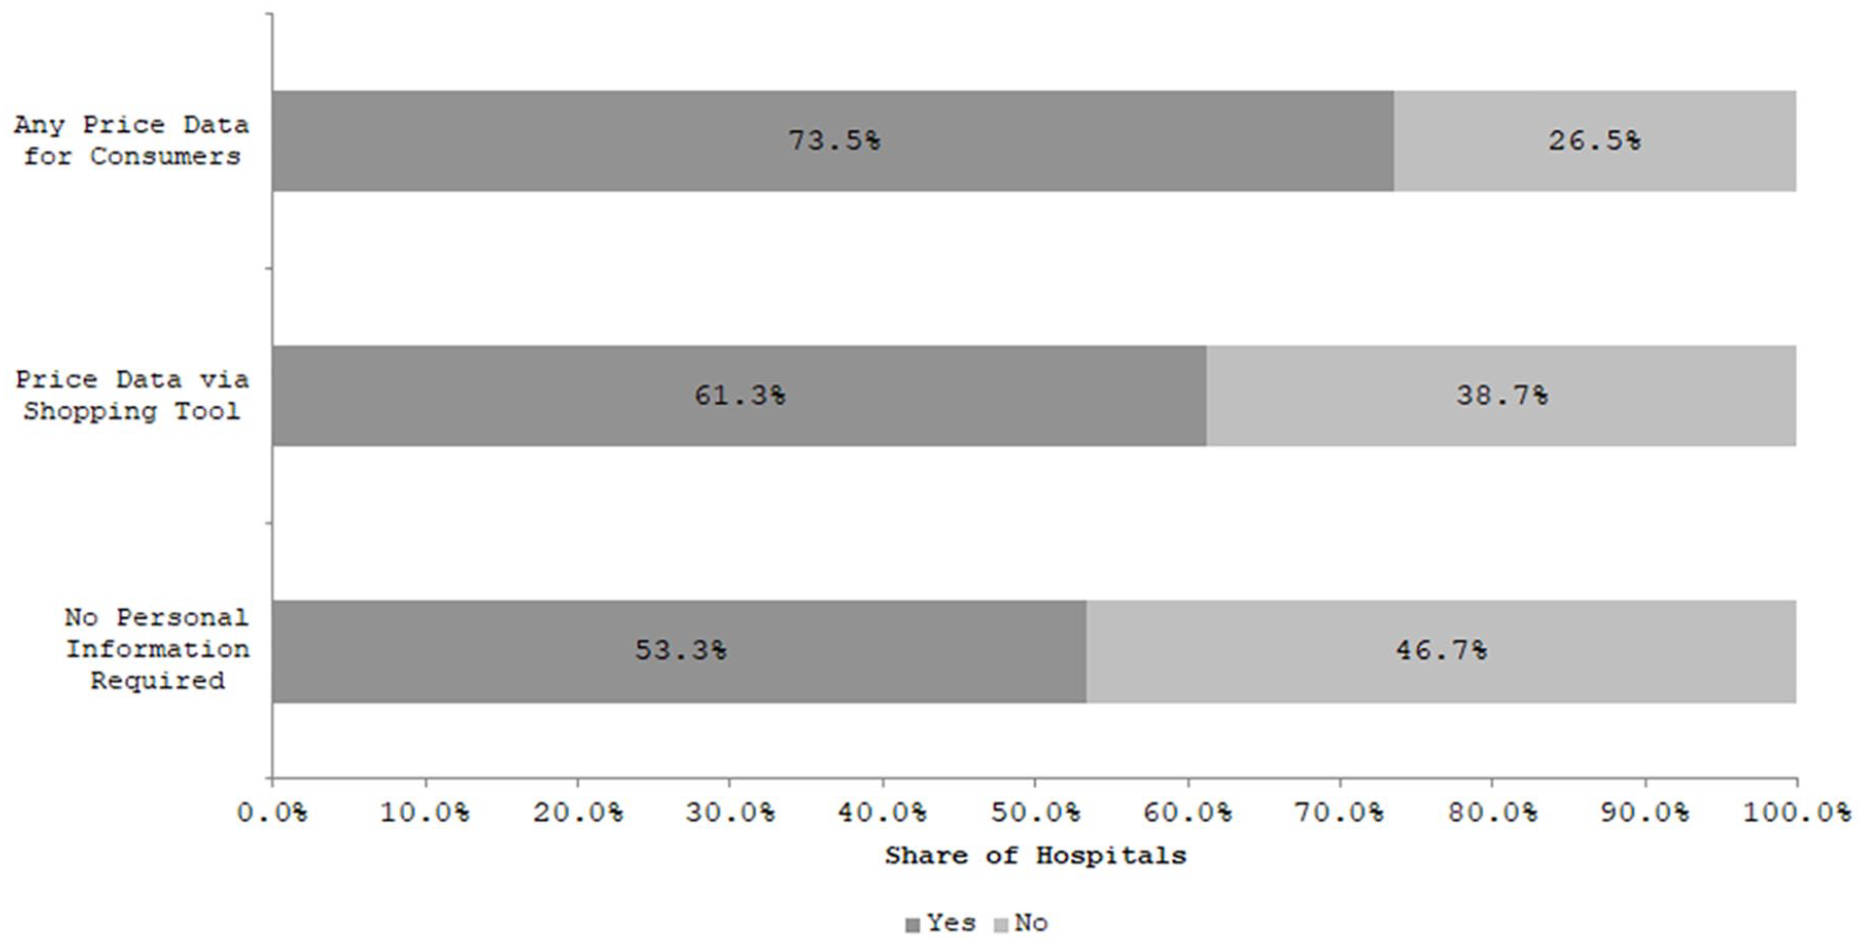
Share of sample hospitals meeting specific aspects of the consumer shoppable requirement of the hospital price transparency rule.
Availability of consumer-shoppable information varied by some hospital characteristics (Figure 5). Independent hospitals were less likely to provide consumer-shoppable information than hospitals with a system affiliation (57.5% vs. 83.0%, p < .01). The share of hospitals reporting consumer-shoppable information also varied by hospital ownership structure. Nonprofit hospitals had the highest reporting rates (78.2%), relative to lower data availability at for-profit hospitals and public hospitals (70.4% and 60.2%, respectively, p = .02).
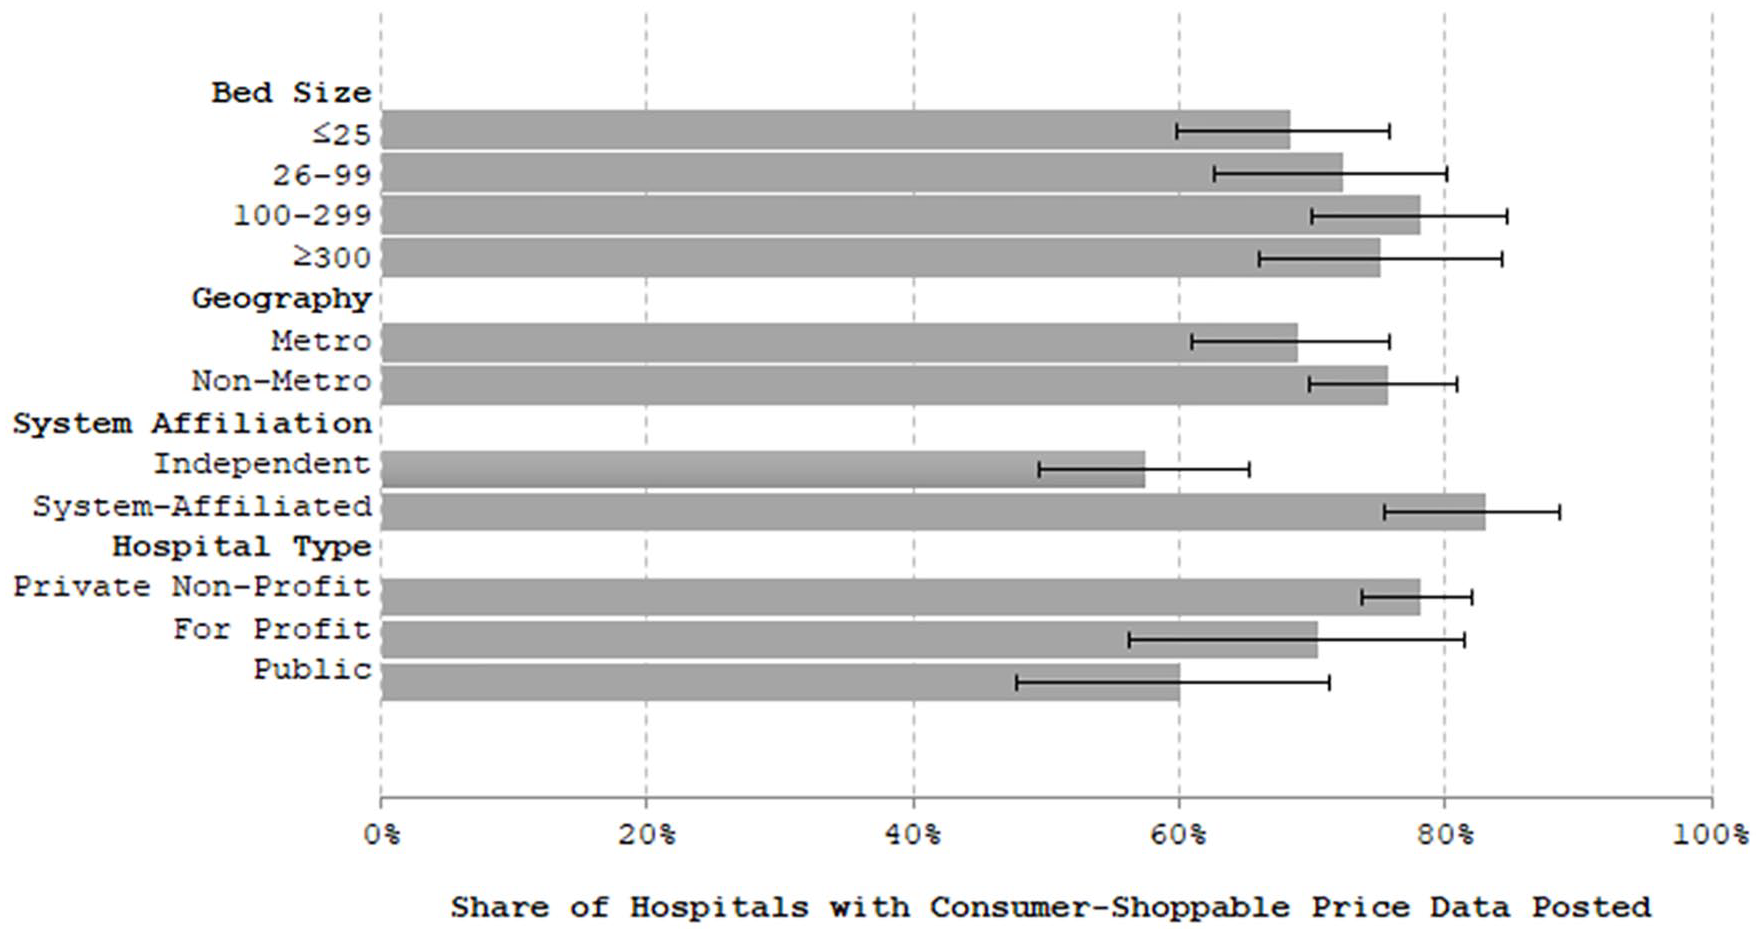
Share of sample hospitals meeting the consumer shoppable requirement of the hospital price transparency rule by hospital characteristics.
Discussion and Conclusion
As of early 2021, only one in four U.S. hospitals provided the online information necessary to meet CMS’ price transparency requirements. While most hospitals posted gross charges or provided consumers with information on shoppable services, only one third posted the full set of payer-specific-negotiated rates. Higher rates of posting for gross charges may reflect the fact that hospitals have been required to report these data in a machine-readable format since January 1st, 2019 (Department of Health and Human Services, 2018). Although the fraction of organizations failing to provide machine-readable data on standard charges was similar across hospital size, ownership, and system affiliation, nonprofit and system-member hospitals appear more responsive to the consumer-shoppable aspects of the rule. This may reflect greater adoption of commercially available, certified electronic health records among these two types of hospitals (Hu et al., 2020), as we found that consumer price comparison tools often were integrated with an electronic health record (e.g., provided through Epic’s MyChart functionality).
Our results are consistent with several early investigations finding that the hospital responses to federal price transparency efforts are mixed at best (Hederson & Mouslim, 2021; Kennedy et al., 2021; Kurani et al., 2021). However, our analysis is the only one that takes a nationally representative approach, and thus our results are generalizable to all U.S. hospitals.
Lack of complete reporting by hospitals in response to the new price transparency rule likely reflects several factors. First, some hospitals may have been unable to invest the time or the resources to provide this information given competing organizational priorities, including responding to the COVID-19 public health crisis. Indeed, the Office of Management and Budget estimates that direct costs of fully complying with the rule would cost U.S. hospitals a total $71.4 million in 2021. Second, some hospitals may have judged the indirect costs of the rule as either high or uncertain and decided to take a “wait-and-see” approach. Examples of such costs include reduced leverage in negotiations with commercial payers or consumer backlash in response to either the level or the variation of prices. A significant number of hospitals may have chosen to take this second approach given the low cost of noncompliance. The rule states that CMS will rely primarily on written complaints from individual consumers or other stakeholders to identify noncompliant hospitals. Furthermore, if hospitals are found to be noncompliant, the maximum penalty they may face is economically insignificant, amounting to less than $300 per day or less than 0.01% of median hospital operating revenue in 2018 (author’s calculation based on hospital cost reports).
Our study has several limitations. First, we relied on a random sample of general acute care hospitals representing approximately 10% of all U.S. hospitals. Second, we assessed only whether the information required by the rule was present or not. We did not evaluate the completeness of the price data presented and did not assess whether the hospitals posting prices were high or low priced. Third, data for this study were collected between January 13th and February 3, 2021—only 1 month after the rule went into effect. Hospitals taking a “wait-and-see” approach may report more complete data as the year progresses and hospitals administrators understand more about the rule as well as the response of competitors, insurers, and the public to reported price data. We assessed this issue by resurveying a 10% sample of hospitals that did not post all five types of price information necessary to fulfill the requirement to post machine-readable data during our original data collection period; we found that only 18% (7/38) had progressed to reporting at least one type in a machine-readable form and only five hospitals had posted all five standardized charge measures as of May 14, 2021.
Moving forward, CMS should tailor modifiable aspects of the rule to achieve greater compliance. For example, strengthening enforcement mechanisms could increase the number of reporting hospitals. To reduce the costs of enforcement and increase the value of information to consumers, researchers, and policymakers, CMS should consider requiring hospitals to report data in not just a machine-readable format but also as a standardized one with uniform reporting requirements. Our experience collecting and reviewing data from a sample of U.S. hospitals indicates that consumer and stakeholder complaints will not be an efficient way to enforce the rule. Despite the requirement of machine readability, we found the process both idiosyncratic and difficult to automate. The structure of the layout of reported data differed substantially across hospitals, and hospitals used a variety of file types (.XLS, .JSON, .XML). Instead, CMS could require hospitals to report data in a standard format such as those used for other public reporting programs and transparency efforts, like CMS Hospital Compare, annual hospital cost reports, or Marketplace plan data. To balance the burden of stricter reporting, CMS could streamline the data requirements to maximize the benefits of transparency for consumers and evidence-based policymaking.
If fully leveraged, the hospital price transparency rule has the potential to create a powerful tool to assess the role of insurer and provider market power as well as other local market conditions as drivers of medical price variation and ultimately health care spending. Moreover, the rule provides a valuable opportunity to assess whether consumer-focused transparency efforts are an effective policy lever for mitigating medical care spending growth. Of course, whether price transparency can reduce health care spending is an open empirical question, given the current evidence base (Benavidez & Frakt, 2019; Brown, 2019; Desai et al., 2017; Sinaiko et al., 2016; Whaley, 2019). However, our results suggest that such a tool will require additional effort from policymakers to increase reporting to permit analysis of its full potential.
Supplemental Material
sj-pdf-1-mcr-10.1177_10775587211024786 – Supplemental material for Taking the Pulse of Hospitals’ Response to the New Price Transparency Rule
Supplemental material, sj-pdf-1-mcr-10.1177_10775587211024786 for Taking the Pulse of Hospitals’ Response to the New Price Transparency Rule by Sayeh Nikpay, Ezra Golberstein, Hannah T. Neprash, Caitlin Carroll and Jean M. Abraham in Medical Care Research and Review
Footnotes
Acknowledgements
The authors wish to thank Emily Johnson, Rebecca Ruff, and Nath Samaratunga for excellent research assistance.
Declaration of Conflicting Interests
The author(s) declared no potential conflicts of interest with respect to the research, authorship, and/or publication of this article.
Funding
The author(s) received no financial support for the research, authorship, and/or publication of this article.
Supplemental Material
Supplemental material for this article is available online.
References
Supplementary Material
Please find the following supplemental material available below.
For Open Access articles published under a Creative Commons License, all supplemental material carries the same license as the article it is associated with.
For non-Open Access articles published, all supplemental material carries a non-exclusive license, and permission requests for re-use of supplemental material or any part of supplemental material shall be sent directly to the copyright owner as specified in the copyright notice associated with the article.