
Abstract
While Medicare is the universal source of health care coverage for Americans aged 65 years or older, the program requires significant cost sharing in terms of out-of-pocket (OOP) spending. We conducted a retrospective study using data from 2016 to 2018 Medicare Current Beneficiary Surveys of elderly community-dwelling beneficiaries (n = 10,431) linked with administrative data to estimate OOP spending associated with the “big four” chronic diseases (cardiovascular disease, cancer, diabetes, and chronic lung disease). We estimated a generalized linear model adjusting for predisposing, enabling, and need factors to estimate annual OOP spending. We found that beneficiaries with any of the “big four” chronic conditions spent 15% (p < .001) higher OOP costs and were 56% more likely to spend ≥20% of annual income on OOP expenditure (adjusted odds ratio = 1.56; p < .001) compared with those without any of those conditions. OOP spending appears to be heterogeneous across disease types and changing by conditions over time.
Keywords
Introduction
The “big four” chronic conditions, including cardiovascular disease (CVD), cancer (excluding skin cancer), diabetes, and chronic lung disease, are the most prevalent and costly health conditions among Medicare beneficiaries (Fong, 2019). According to the American Heart Association (2020; Lopez et al., 2020), CVD refers to a group of health conditions that consist of congestive heart failure, coronary heart disease (heart attack), cardiac arrhythmia, and stroke. The prevalence and incidence of CVD increases markedly with advancing age (80% of individuals aged 60 years or older; American Heart Association, 2020; Yazdanyar & Newman, 2009). Cancer and CVD are the two leading causes of death in the United States (Virani et al., 2020). While Medicare is the universal source of health care coverage for Americans aged 65 years or older, the program requires significant cost sharing in terms of out-of-pocket (OOP) spending for insurance premiums, covered services, and services not covered by Medicare (e.g., dental care).
In 2017, an average Medicare beneficiary with traditional fee-for-service (FFS) coverage spent about $5,800 for insurance premiums plus medical services (Miller, 2020). OOP spending is much higher among beneficiaries with certain chronic health conditions, especially those with CVD or cancer (Centers for Medicare & Medicaid Services [CMS], 2012). While the private managed care plans may lower OOP expenses, these policies can be costly to purchase because of significant direct expenses for coinsurance, deductibles, and premiums (Stadhouders et al., 2019). Therefore, high OOP spending contributes to significant financial burdens to Medicare FFS beneficiaries and their families. Other negative consequences of increased burdens of cost sharing include medication nonadherence (McGee et al., 2019) and avoidance of necessary outpatient care among beneficiaries with chronic health conditions (Goldstein et al., 2019; Ng et al., 2020). It is projected that Medicare beneficiaries will need to spend about half of their social security income as OOP costs by 2030 (Cubanski & Neuman, 2018). Therefore, lowering the financial burden of high OOP costs for Medicare beneficiaries remains the focal point of policy discussions.
Prior studies have examined the relationship between OOP spending and chronic diseases in this population; however, significant gaps exist in the current literature. For example, using self-reported costs data from population-based surveys, studies have found that Medicare beneficiaries with dementia had higher annual OOP spending for medical services than those without dementia (Delavande et al., 2013; Dwibedi et al., 2018; Hurd et al., 2013). However, most of these studies ignored OOP expenses for supplemental insurance premiums, which accounts for more than 40% of total OOP spending. Other studies have also documented higher OOP costs for beneficiaries with cancer (Kelley et al, 2015; Langa et al., 2004; Narang et al., 2017). These studies mainly have focused on a single disease when nearly 80% of Medicare beneficiaries have coexisting chronic conditions (Ahn et al., 2020; Buttorff et al., 2017; Lochner & Cox, 2010). Using self-reported OOP costs data, one recent study has identified that CVD, diabetes, cancer, and chronic lung disease are the four most costly chronic conditions that may contribute to higher financial burdens due to increased OOP spending among Medicare beneficiaries (Fong, 2019). However, this study included both Medicare FFS and Medicare Advantage enrollees, although OOP spending patterns are different for beneficiaries in FFS versus in Medicare Advantage plans due to different cost-sharing structures (Nicholas & Wu, 2020). Furthermore, evidence suggests that self-report of cost data may be subject to recall or nonresponse bias (Cubanski & Neuman, 2018; Lochner & Cox, 2010). Given the high prevalence of chronic diseases among Medicare beneficiaries, and increasing financial burdens of high OOP spending (Zuckerman et al., 2010), it is important to better understand which conditions are costlier in terms of the excess financial burden of OOP spending.
Using the Medicare Current Beneficiary Survey (MCBS), the primary objective of this study was to examine (1) Do Medicare FFS beneficiaries experience higher OOP spending with any of these “big four” conditions and do certain chronic conditions affect annual OOP spending differentially? (2) What is the likelihood of a higher financial burden of OOP spending (≥ 20% of annual per capita income) among FFS beneficiaries with any of the “big-four” conditions?
New Contributions
To date, estimates of OOP spending among Medicare beneficiaries primarily focus on a single disease, survey-based cost data, or OOP expense for medical services only (ignoring the cost of insurance premiums). The current study makes the following contributions to the literature: First, the analysis focuses on the most prevalent chronic conditions that are costly in terms of direct OOP spending for Medicare FFS beneficiaries. A better understanding of the impacts of these expensive conditions on annual OOP spending is critical for the management of those conditions and policy discussion about the reduction of financial burdens of OOP costs for beneficiaries. Second, using multiple years of cost data to estimate OOP spending has allowed us to capture greater variability of OOP expenses and to detect if spending patterns increase over time by these conditions.
Method
In the current study, we used a retrospective design using MCBSs from 2016 to 2018 linked to administrative cost data from the CMS.
Data Overview
We analyzed data from the CMS’s MCBS survey and Cost Supplement data from 2016 to 2018. The MCBS is a nationally representative, multistage stratified random sampling of Medicare beneficiaries, including both aged and disabled enrollees who are living in the community as well as facility residents. The survey collects data directly from Medicare beneficiaries and includes information on demographics, chronic health conditions, and the utilization of medical services. Data collected from the beneficiaries are merged with Medicare administrative billing and claims-level records through an extensive and rigorous reconciliation process. This project was reviewed by the University Medical Center Institutional Review Board at East Carolina University.
Study Population
We restricted our sample to community-dwelling elderly people (≥65 years) enrolled in traditional Medicare FFS programs (both Part A and Part B) throughout the entire year of each of the three calendar years, yielding a total sample of 10, 962 unique beneficiaries. We then dropped 531 beneficiaries with dual coverages (Medicare and Medicaid) yielding our main analysis sample of 10,431 unique Medicare beneficiaries with FFS coverage with 16,573 person-year observations. The exclusion of dually eligible beneficiaries is because, for these respondents, the state Medicaid program not only covers their full Medicare cost sharing but also offers other supplemental benefits (Atherly & Dowd, 2005). Therefore, beneficiaries are exempt from any financial responsibility associated with the medical care services that they receive.
Measures
Dependent Variables
OOP health care spending consisted of insurance premiums plus Medicare cost sharing and expenses for noncovered services. Individual OOP expense was captured from the MCBS Cost Supplement files. The OOP cost for medical services was calculated by summing the expenses for inpatient (hospital or facility-based services, including skilled nursing or long-term care facilities), outpatient services, prescription medication, medical equipment, and other noncovered services for each beneficiary. A detailed description of the types of medical services is provided elsewhere (Cubanski & Newman, 2018). We used two measures of OOP spending: absolute value and a measure of the financial burden of OOP spending as a percentage of per capita annual income. Prior research suggests that beneficiaries in traditional Medicare coverage spend at least 10% of per capita income on medical services and 20% of income on total annual OOP spending, including both medical and insurance premiums (Cubanski & Newman, 2018; Dwibedi et al., 2018). We, therefore, used an indicator of a high financial burden if the total annual OOP spending was greater than or equal to 20% of a beneficiary’s annual per capita income.
Key Independent Variable
The “big four” chronic health conditions—the key explanatory variable in our analysis—was a binary (yes/no) variable indicating the presence of any of the “big four” chronic conditions: CVD, cancer, diabetes, or chronic lung disease. Self-reported measures were based on affirmative responses from beneficiaries to the questions for any chronic health conditions, for example, “Has a doctor [ever] told [you/(SP)] that [you/he/she] had [diabetes, lung disease, cancer, heart conditions, vascular disease, congestive heart failure, high blood pressure]? We constructed a dichotomous variable for each of the chronic conditions coded as (0, 1), where 1 indicates ever having the condition and 0 indicates not having the condition ever. To create a dummy variable for CVD, we combined responses from congestive heart failure, heart attack, cardiac arrhythmia, vascular disease, and any other heart conditions.
Other Control Variables
We adapted Andersen’s behavioral model (Gotanda et al., 2020) to identify the factors that potentially increase or lower OOP spending among community-dwelling individuals. These characteristics include predisposing factors (gender [male/female], age by groups [65-74, 75-84, and 85 years and above], and race/ethnicity [White non-Hispanic, Black non-Hispanic, and Hispanic]; enabling factors (marital status [married, not married, including widowed, single, and divorced), education [less than high school, high school graduate, some college, and college graduate], and federal poverty levels [≤200 % vs. ≥ 200%]) that facilitate the use of health care services given the resource availability; and need factors (chronic health conditions, including Alzheimer’s disease and related dementias, hypertension, arthritis, psychiatric conditions, depression, any other mental health conditions), self-reported health status (excellent/very good/good vs. fair/poor), and activity limitations (yes/no) that motivate individuals to access health care services. We also controlled for smoking status by including a binary variable to indicate if respondents ever smoked. Census regions (Northeast, Midwest, South, and West) were included to adjust for regional differences in OOP spending. Finally, two dummy variables were included in the regression models to account for any temporal patterns in the levels of spending due to time and interactions between year and conditions of interest to examine if OOP spending varies across specific chronic conditions over time.
Statistical Analysis
The MCBS-linked administrative data in our analysis included beneficiaries with nontrivial changes in the sample composition in each year. Therefore, our main analysis treated the sample as repeated cross-sections to estimate OOP sending regressions. We estimated a generalized linear model (GLM) with a log link and gamma distribution to account for nonnormally distributed OOP spending amounts for our outcome variable of annual OOP spending. The GLM model with gamma distribution with a log link has been shown to perform satisfactorily with the skewed (long right tail) cost data (Nicholas & Wu, 2020; Malehi et al., 2015). For the binary outcome variable indicating a higher OOP spending (≥ 20% of per capita annual income), we used a logit link with a binomial distribution. Standard errors were clustered at the individual beneficiary level to account for potential correlation across observations from the same beneficiary over time. We examined the differences in total annual OOP spending by individual characteristics using the two-sample t test or analysis of variance for categorical variables. We used Stata 14 (Stata Corporation, College Station, TX) for the data analysis and MCBS survey weights for producing unadjusted and adjusted estimates of OOP spending.
Results
Table 1 presents descriptive statistics of the weighted sample. The sample consisted of nearly 57% female, 82% White, non-Hispanic, 56% married, 6% Hispanic, and 30% college graduates. The age-group distributions show that approximately 57% of beneficiaries were between 65 and 74 years, 31% were between 75 and 84 years, and 12% were 85 years or older. As expected, chronic conditions are quite prevalent: nearly 46% had CVD, 21% had cancer, 30% had diabetes, 19% had chronic lung disease, and more than 65% had hypertension. Approximately, 67% of the beneficiaries had at least one of the “big four” chronic conditions. Among those who did have any such conditions, nearly 30% had two out of the four conditions, and the prevalence of CVD was the highest (45%). More than 80% of beneficiaries reported to being in good to excellent health status—most beneficiaries did not have any activity limitations (76%). On average, traditional FFS beneficiaries spent nearly $5,695 on medical care plus insurance premiums. Beneficiaries, on average, spent $1,080 annually for outpatient medical services, $736 for prescription medication, and $582 for dental services. More than 32% of beneficiaries spent greater than 20% of their annual per capita income on OOP spending on medical services and insurance premiums.
Sample Descriptive of Medicare Beneficiaries With Fee-for-Service Coverage: 2016-2018 (Pooled Sample n = 16,573).
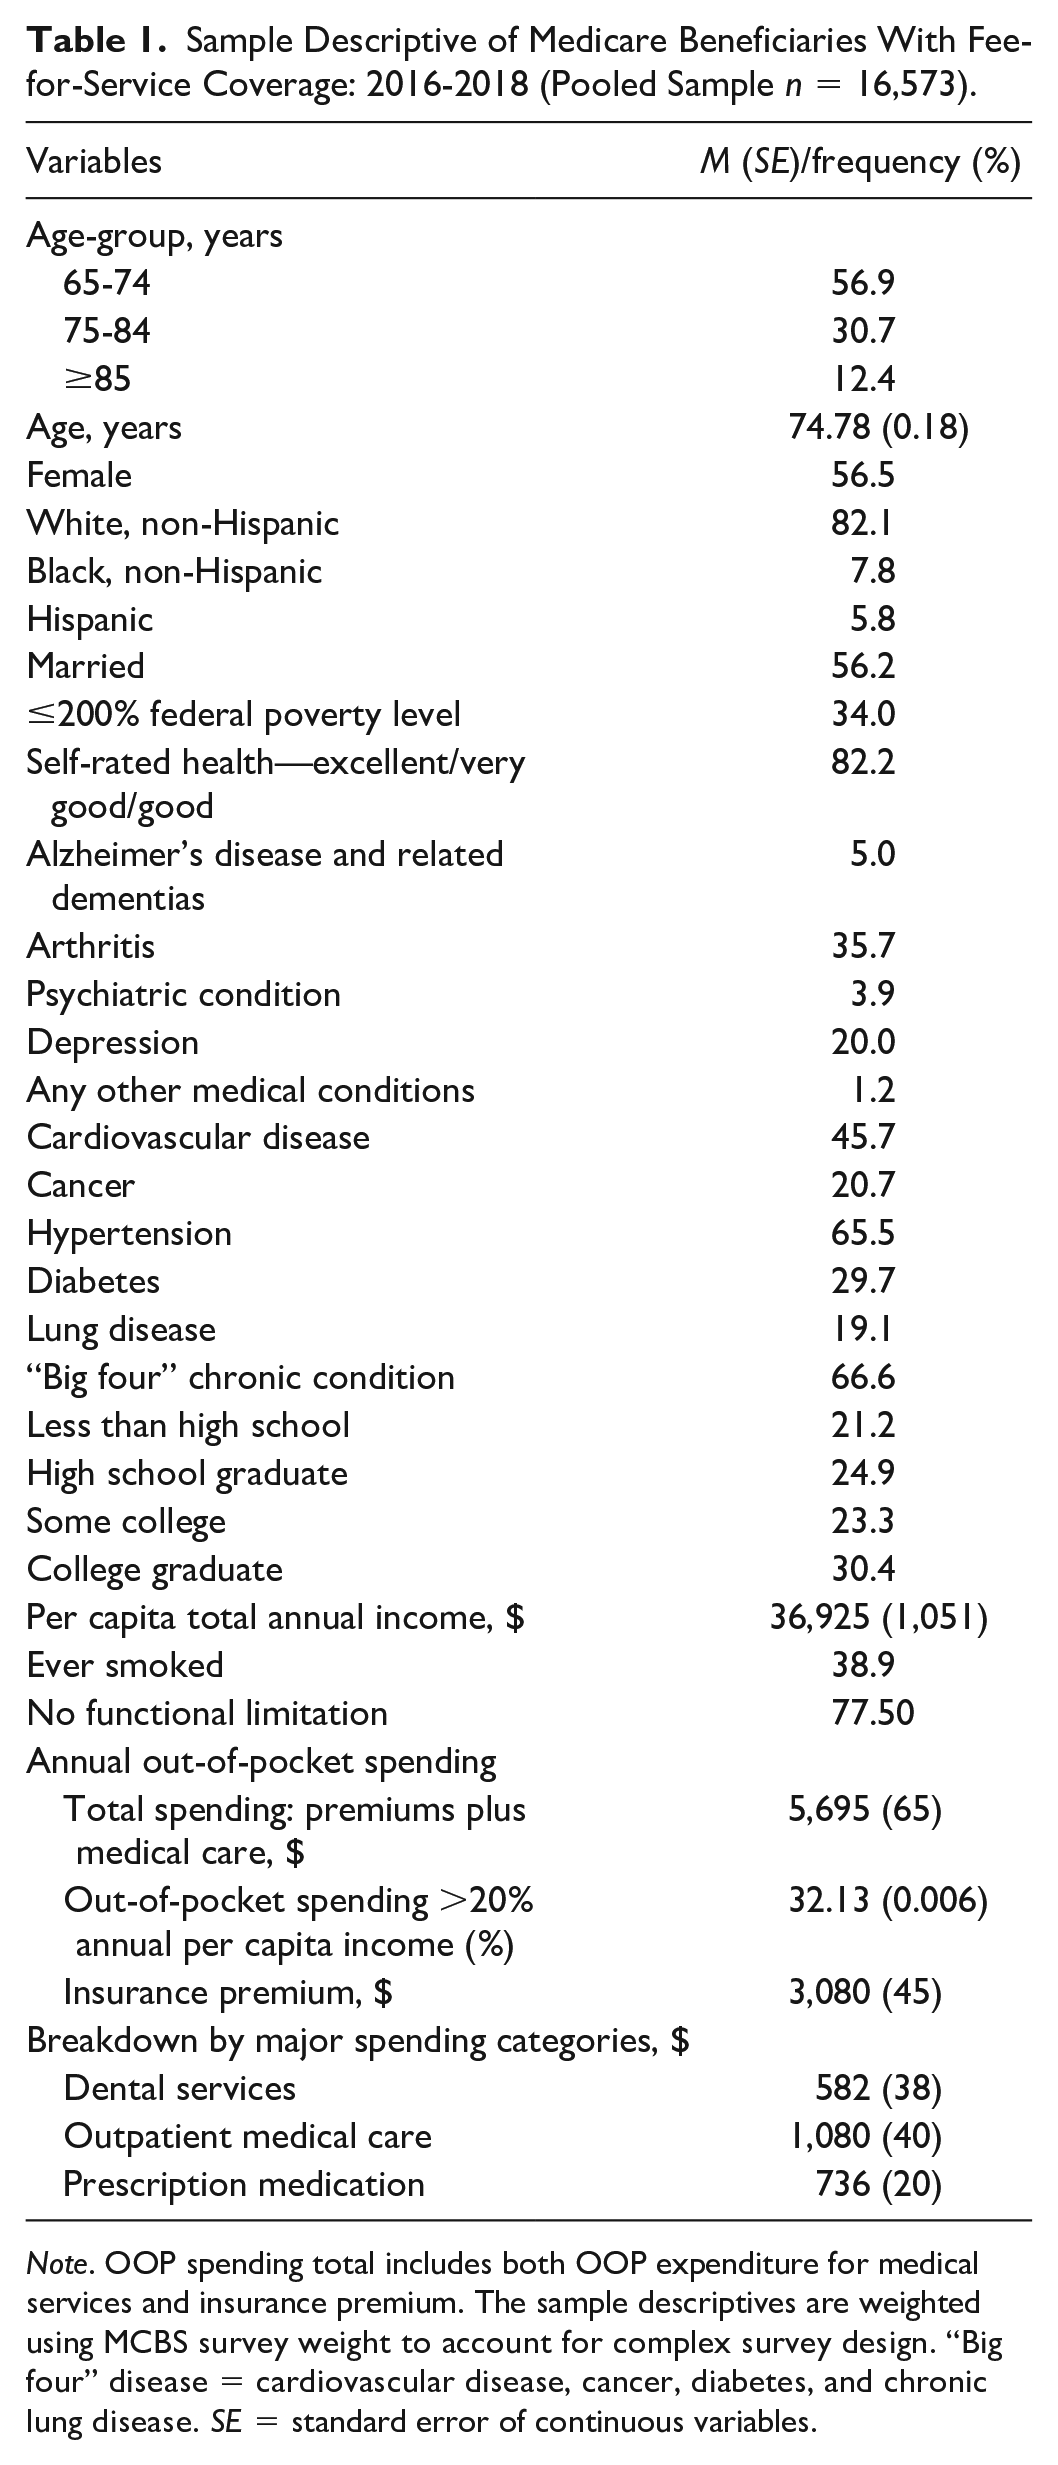
Note. OOP spending total includes both OOP expenditure for medical services and insurance premium. The sample descriptives are weighted using MCBS survey weight to account for complex survey design. “Big four” disease = cardiovascular disease, cancer, diabetes, and chronic lung disease. SE = standard error of continuous variables.
Table 2 shows unadjusted mean differences in OOP spending over time as well as by beneficiary characteristics. There were significant differences in unadjusted OOP spending over the study period. Total annual OOP spending significantly increased from $4,628 in 2016 to $5,022 in 2018. Unadjusted differences suggested that beneficiaries 85 years of age or older had significantly higher per capita OOP spending ($53,792) than those in the 65 to 74 ($4,387) and 75 to 84 age-groups ($4,965). Average OOP spending was significantly higher among those who were married ($4,901), whose annual income was greater than 200% of the federal poverty level (FPL; $5,157), who reported being in fair or poor self-rated health (SRH; $5,052) compared with those who were unmarried ($4,713), being less than 200% FPL ($4,147), and reported excellent/very good or good SRH ($4,788). Blacks ($3,621) and Hispanic ($3,932) had lower OOP than White ($4,902) and non-Hispanic ($4,877). Beneficiaries who were high school graduates or had some college education had significantly higher OOP spending compared with those who had less than high school education.
Out-of-Pocket (OOP) Spending (Absolute Values) and Estimated Changes by Individual Characteristics.
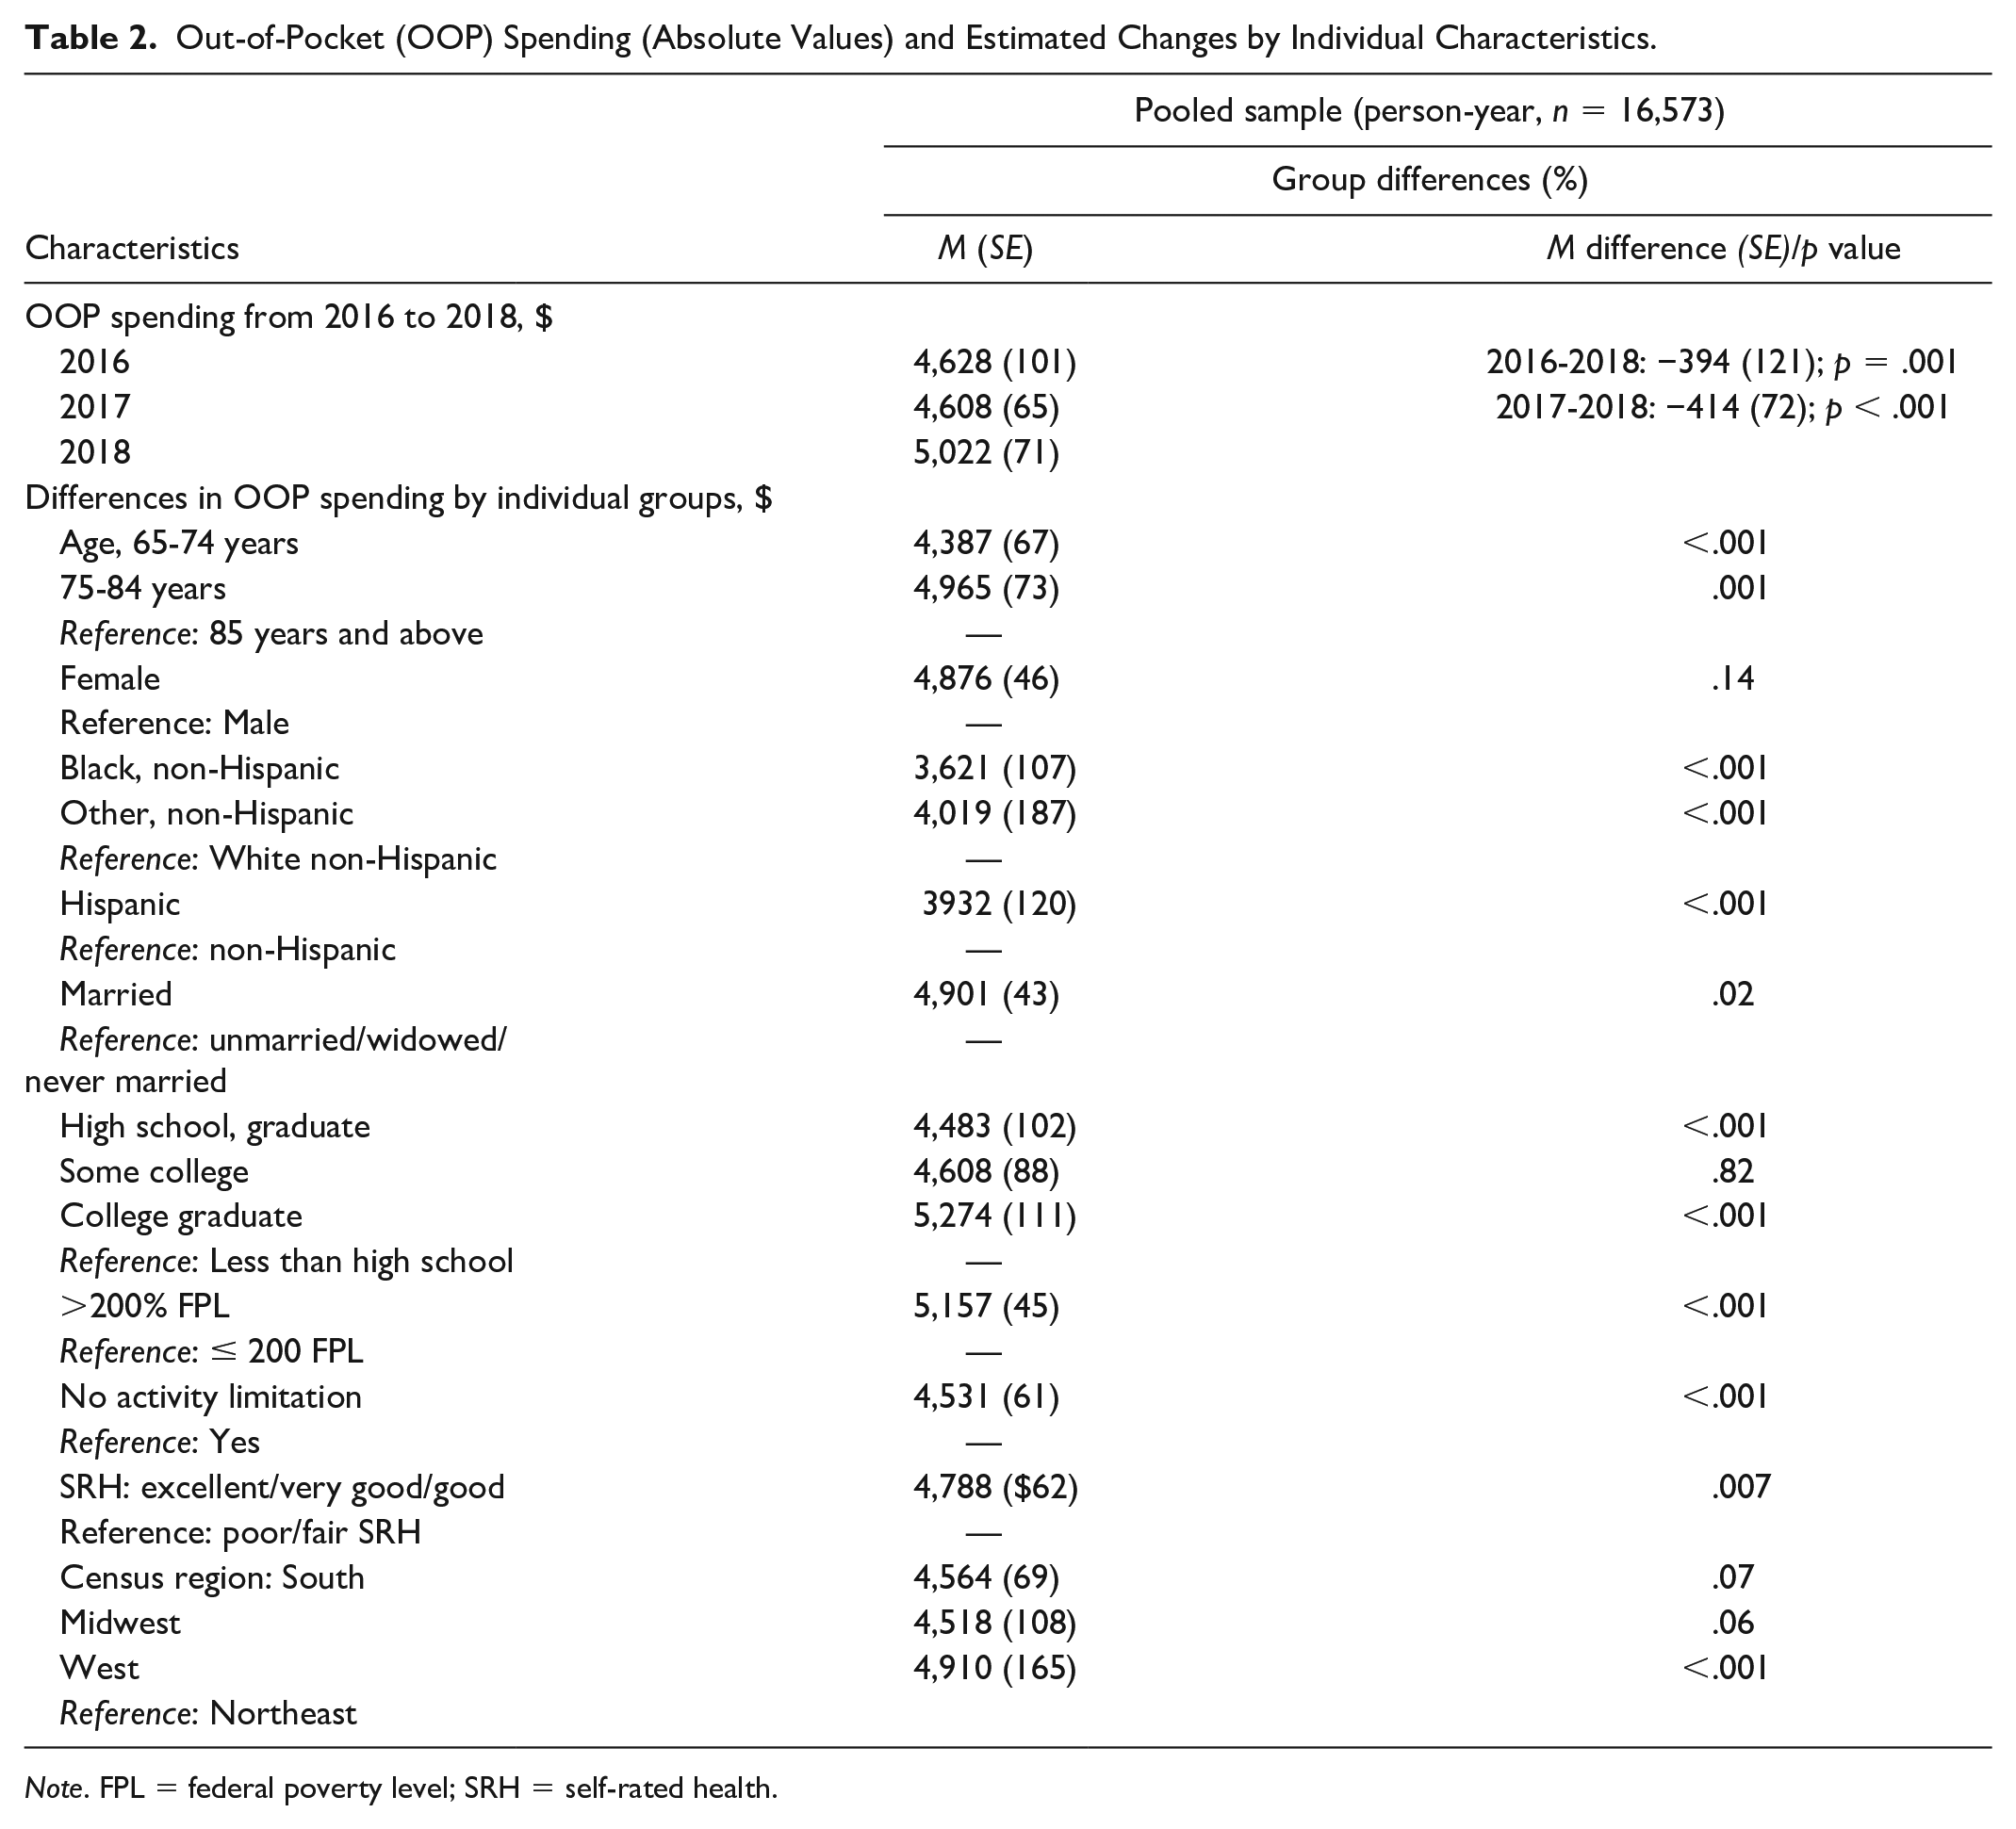
Note. FPL = federal poverty level; SRH = self-rated health.
Unadjusted differences in OOP spending burdens by the “big four” conditions and expenditure categories are reported in Table 3. Beneficiaries, on average, with any one of the “big four” conditions spent $5,053 compared with those without, $4,416, respectively, contributing to increased spending (significant) of $637 in mean OOP costs. Before adjusting for any other individual characteristics, increased spending was highest for cancer ($658), followed by CVD ($628) and chronic lung disease ($373). Breaking down by expenditure categories, we found that unadjusted differences are significant across individual disease types for both prescription medication and outpatient medical services.
Annual Out-of-Pocket (OOP) Spending, Unadjusted Differences, and Estimated Changes (2016-2018) by the “Big Four” Health Conditions (Pooled Sample, n = 16,573).
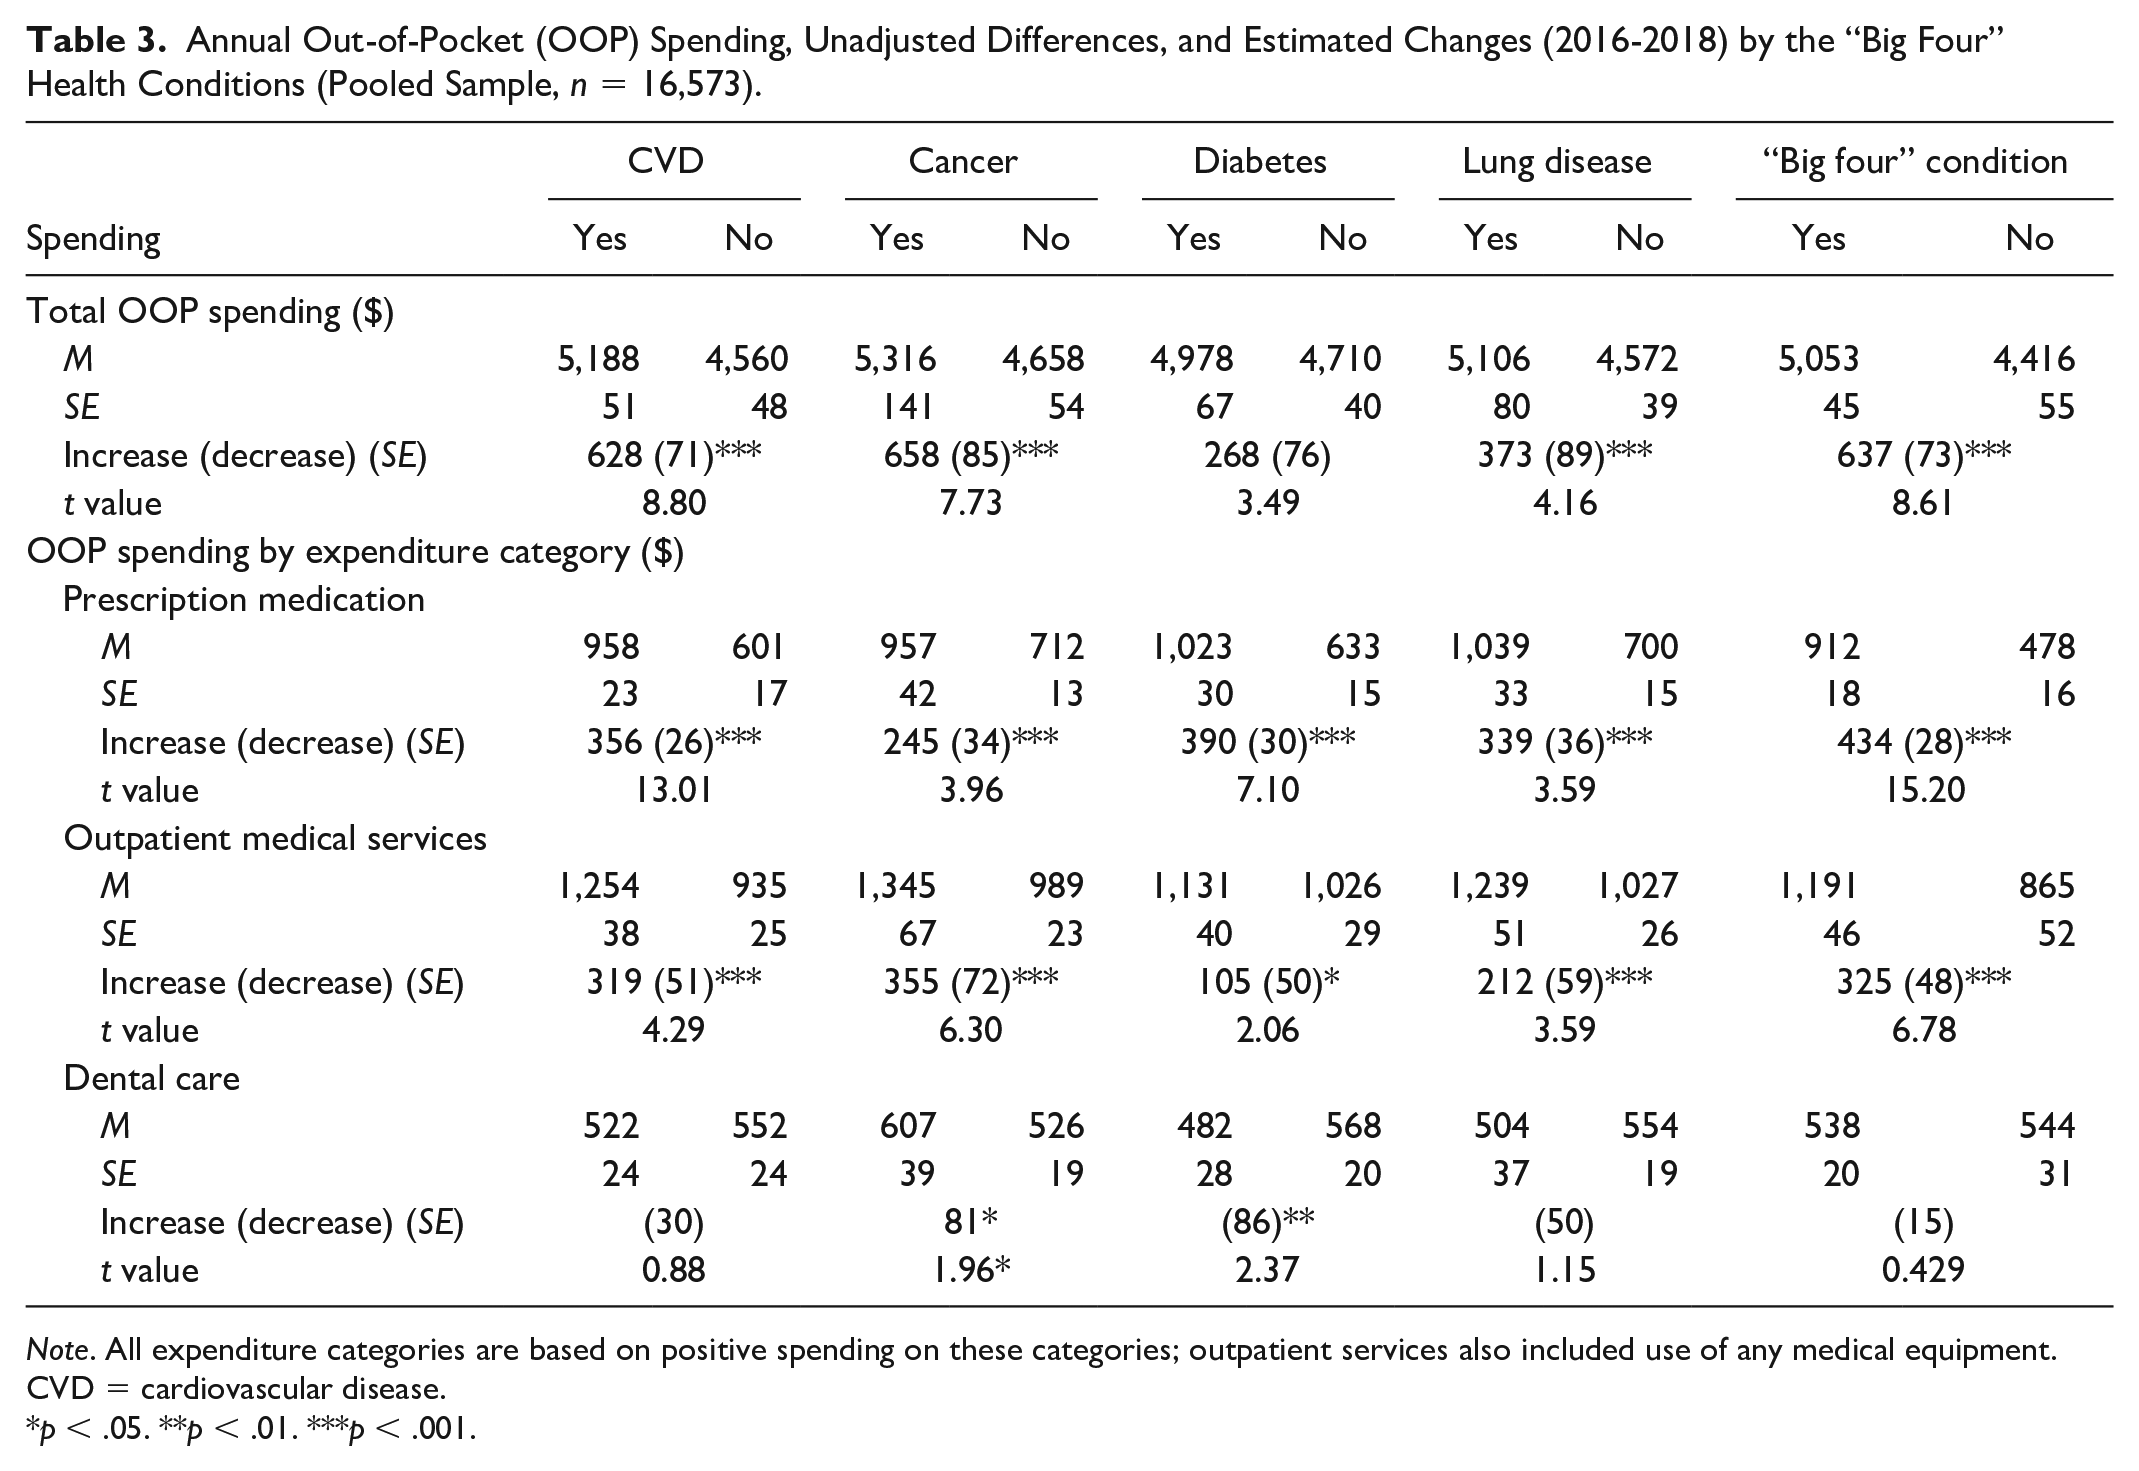
Note. All expenditure categories are based on positive spending on these categories; outpatient services also included use of any medical equipment. CVD = cardiovascular disease.
p < .05. **p < .01. ***p < .001.
Adjusted estimates of an annual OOP spending are shown in Table 4 (absolute value and an indicator of high OOP burden). Because GLM is a multiplicative model and expressed in a logarithmic scale, the regression coefficients of absolute OOP spending are interpreted in terms of a relative estimate of the effect of a covariate. Specifically, parameter estimates were exponentiated to determine the relative effects of a covariate on OOP spending. Based on the GLM estimates, beneficiaries with any of the “big four” chronic conditions spent nearly 15% higher on OOP spending compared with those without any of those conditions. Disaggregating by disease types, we found out that the relative effects of increased spending were highest for CVD at 12%, followed by cancer (10%), chronic lung disease (6%), and diabetes (5%).
GLM Coefficients (Exponentiated Value), Adjusted Odds Ratios, Standard Errors of Out-of-Pocket Spending (Absolute Value and Log-Transformed), and High Out-of-Pocket (OOP) Spending: Pooled Cross-Sectional Sample (n = 10,277).
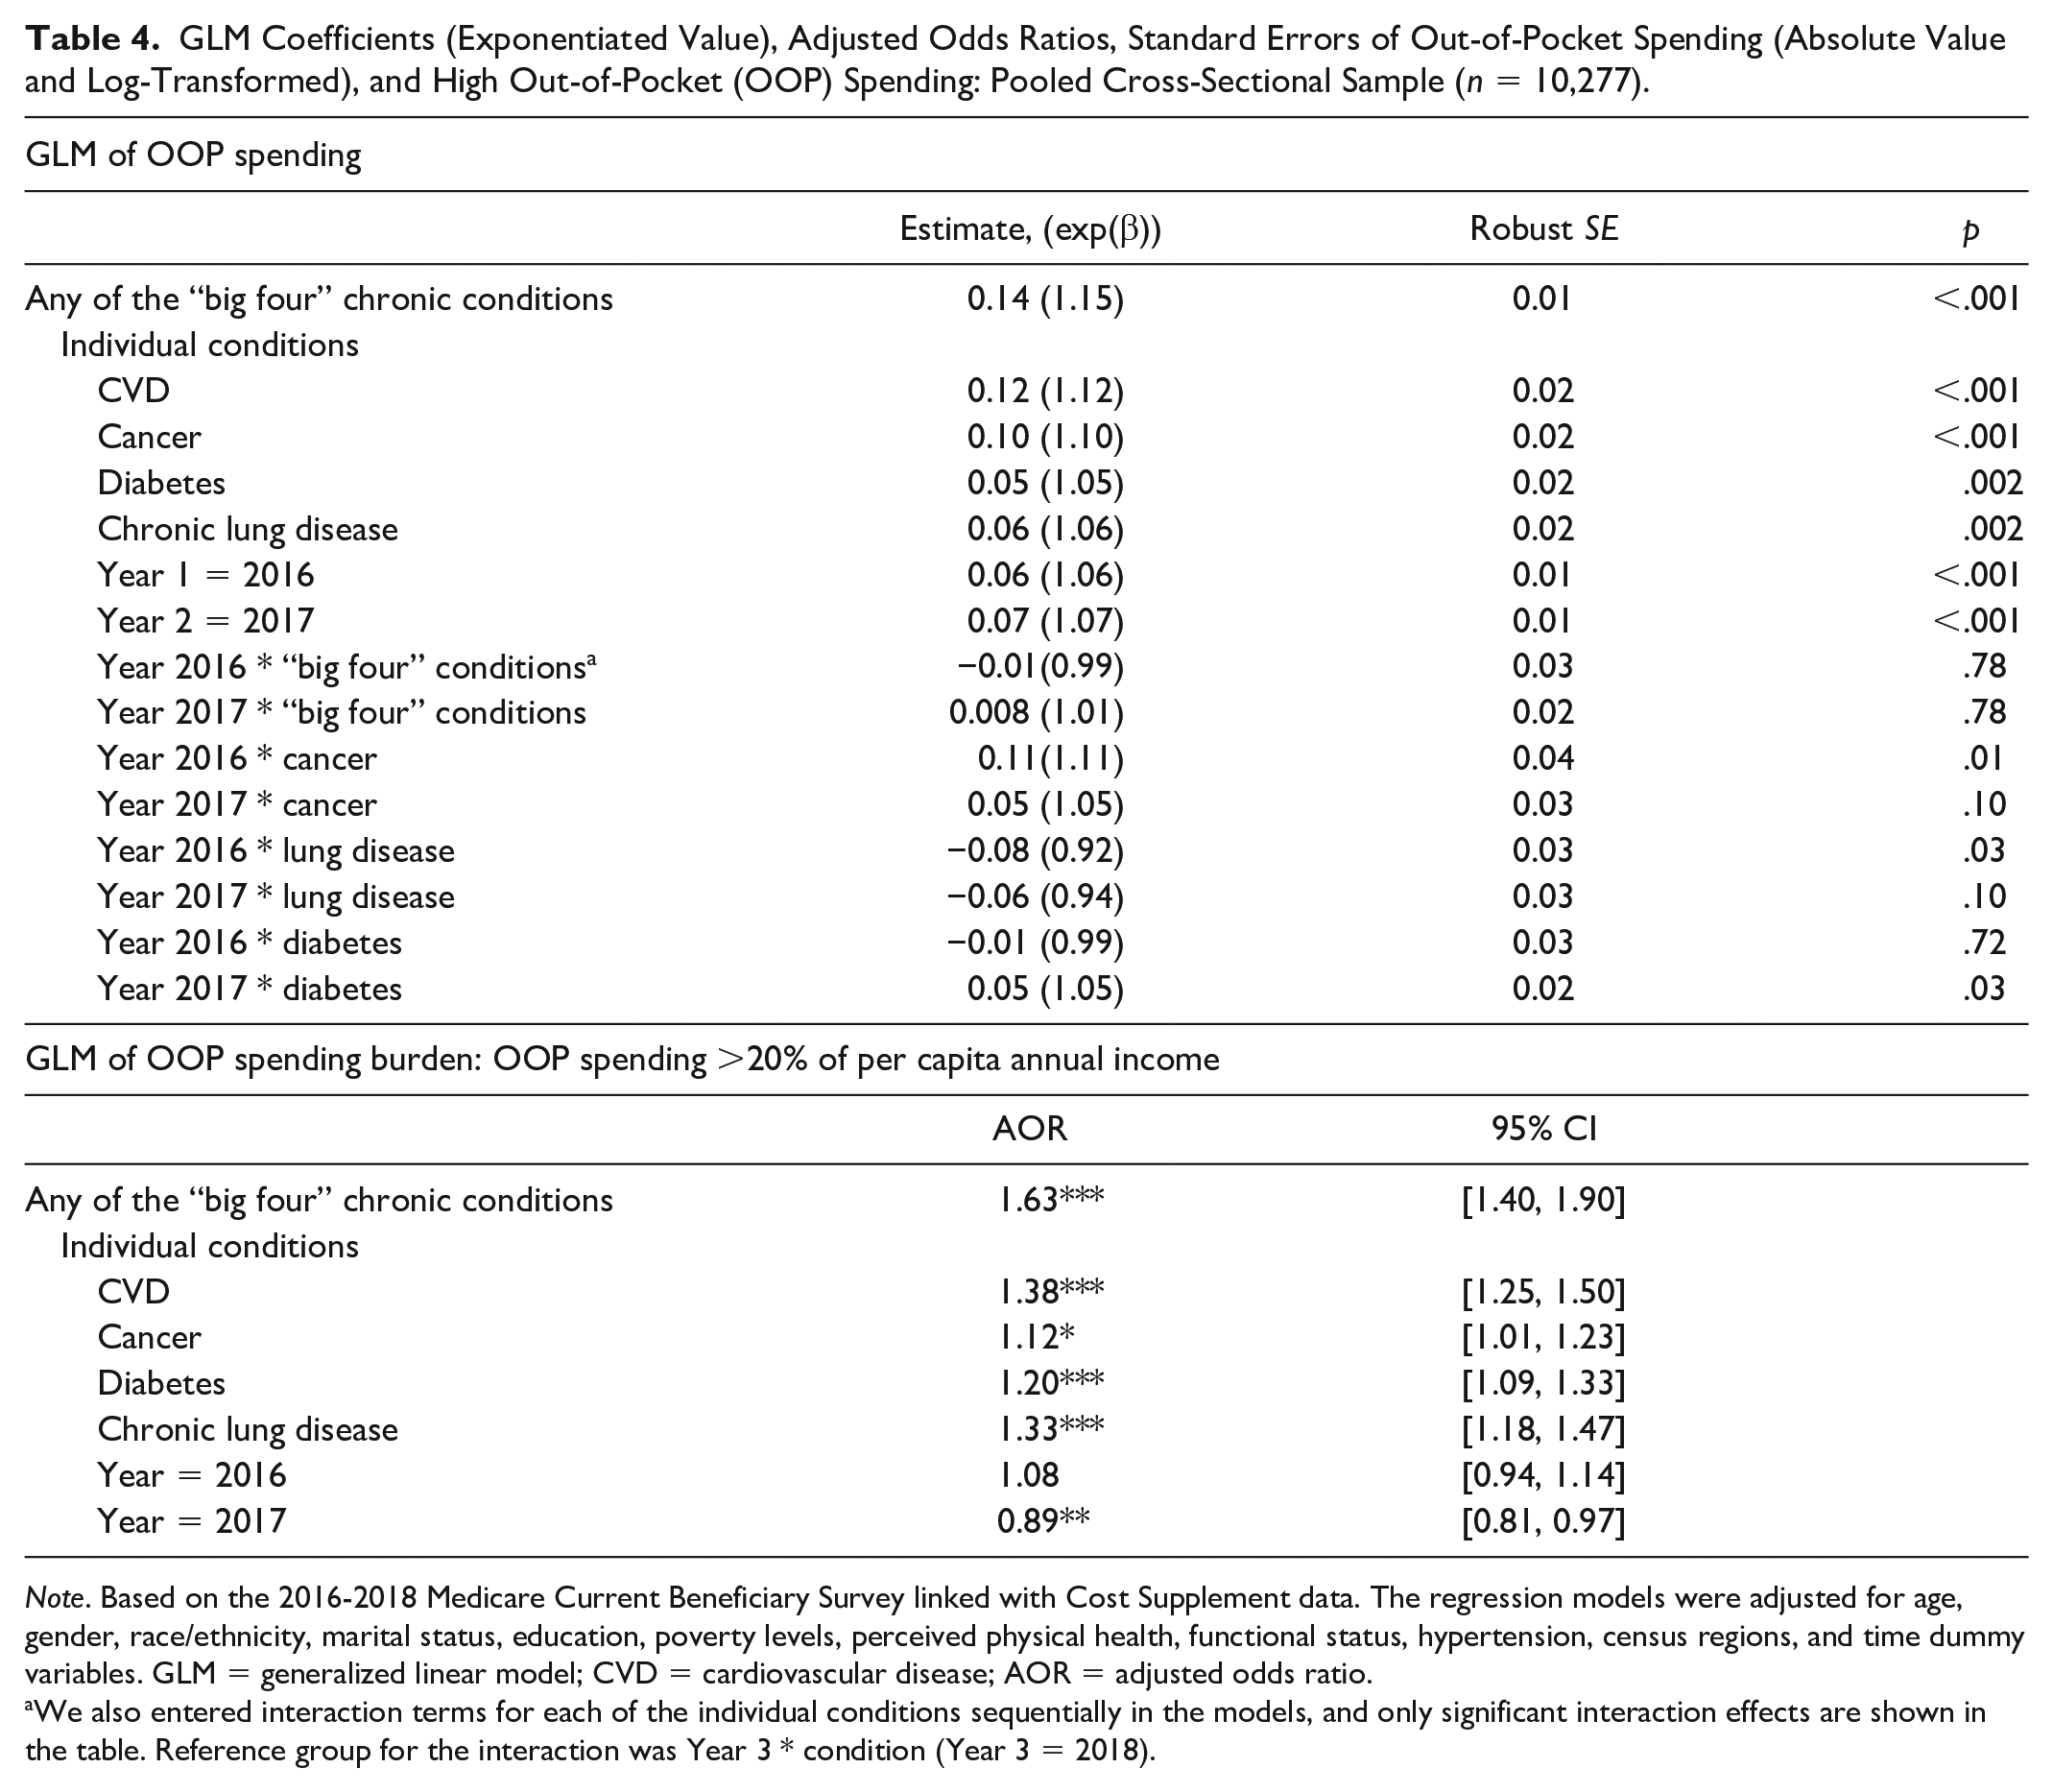
Note. Based on the 2016-2018 Medicare Current Beneficiary Survey linked with Cost Supplement data. The regression models were adjusted for age, gender, race/ethnicity, marital status, education, poverty levels, perceived physical health, functional status, hypertension, census regions, and time dummy variables. GLM = generalized linear model; CVD = cardiovascular disease; AOR = adjusted odds ratio.
We also entered interaction terms for each of the individual conditions sequentially in the models, and only significant interaction effects are shown in the table. Reference group for the interaction was Year 3 * condition (Year 3 = 2018).
Table 4 were also reports the adjusted odds ratio (AOR) of financial burdens of OOP spending at ≥20% of per capita annual income from the GLM estimation with a binomial distribution and logit link function. Adjusting for the same set of control variables, individuals with any of the “big four” chronic conditions were 56% (AOR = 1.56; 95% CI [1.4, 1.9]) more likely to have spent greater than 20% of their annual per capita income on OOP spending compared with those without. Examining by conditions of interest, beneficiaries with CVD were 38% (AOR = 1.38; 95% CI [1.25, 1.50]), followed by chronic lung disease (AOR = 1.33; 95% CI [1.18, 1.47]), diabetes (AOR = 1.20; 95% CI [1.09, 1.33]), and cancer (AOR = 1.13; 95% CI [1.01, 1.23]), more likely to spend higher than 20% of their annual per capita income on OOP expenditures. Our adjusted model predicted that nearly 32% of Medicare beneficiaries had OOP spending ≥20% of the annual per capita income. We found significant temporal effects of OOP spending, meaning that the estimated coefficient of two-time dummy variables appeared to be statistically significant. Estimated coefficients suggest that there is a temporal increase in absolute OOP spending. Finally, we examined the interaction between time dummies and specific conditions to determine any significant spending trend over the study period. We found some evidence of statistically significant changes in spending over time in the adjusted model. The results were mixed: for example, the OOP spending was higher in 2016 for cancer (positive interaction effects) than that in 2018 but lower for lung disease (negative interaction effects). For diabetes, we found that OOP spending in 2017 was higher than that in 2018.
To explore further, we calculated predicted mean costs for individual spending categories after the GLM estimation of absolute OOP spending (Table 5). We compared predicted OOP spending for beneficiaries with the specific condition in contrast to those without the disease, as performed in the previous studies. Medicare beneficiaries with any of the “big four” conditions spent annually about $825 (about 19%) more than those without. The difference in predictive means costs for CVD was $733, which reflects the increased or excess spending among beneficiaries with that chronic condition. Increased spending was estimated as $733 for CVD, $694 for cancer, $350 for chronic lung disease, and $242 for diabetes, respectively. Except for cancer, we found that predicted mean OOP cost for prescription medication drives the excess OOP among Medicare beneficiaries with any of the “big four” chronic conditions.
Predicted Mean OOP Costs by Major Expenditure Categories Across the “Big Four” Conditions.
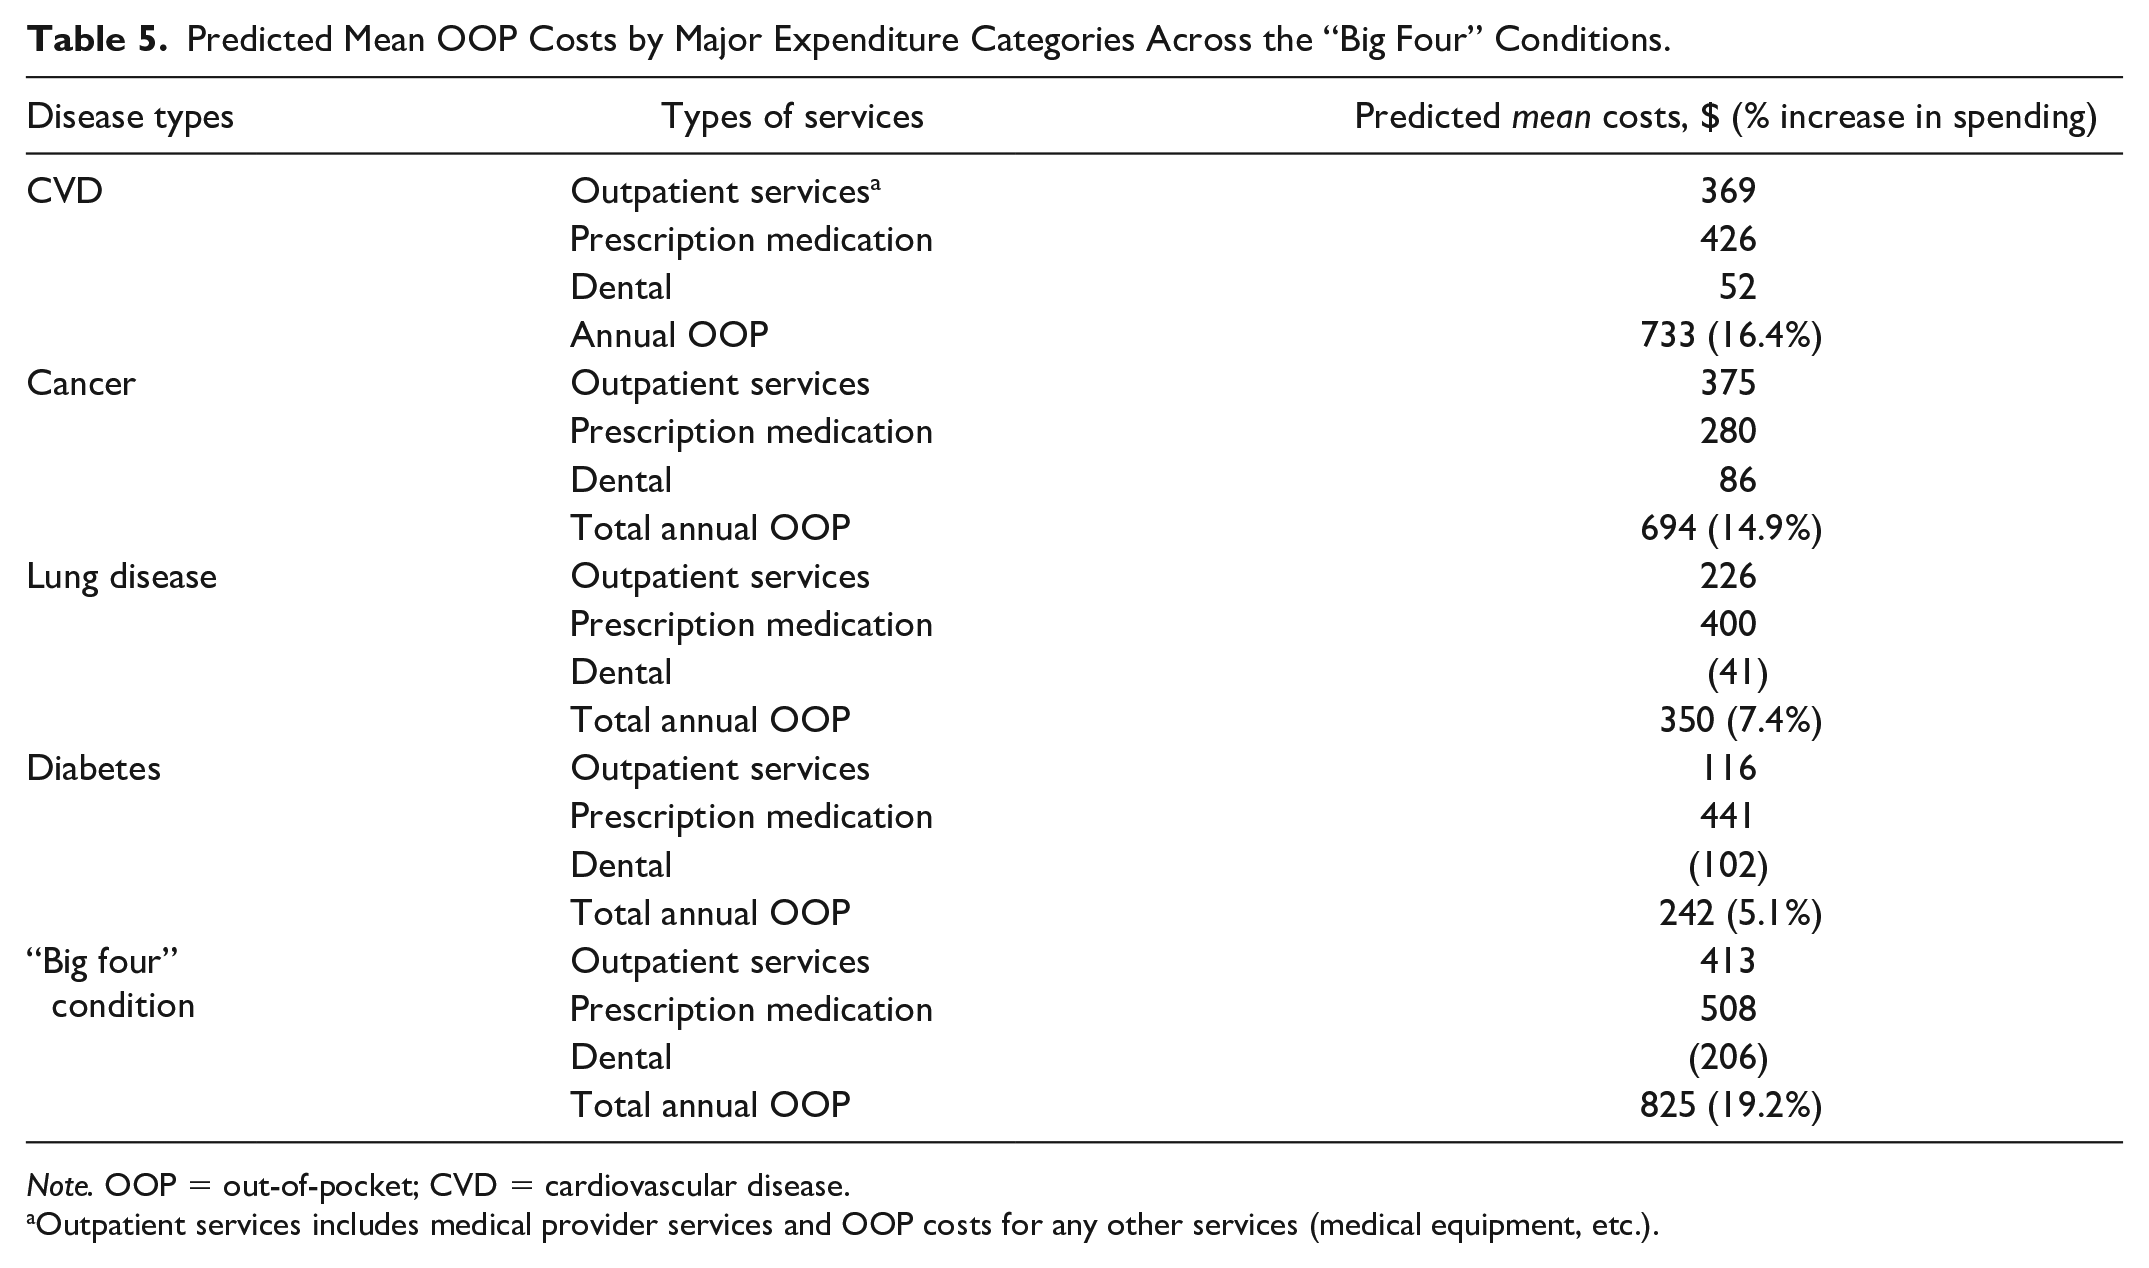
Note. OOP = out-of-pocket; CVD = cardiovascular disease.
Outpatient services includes medical provider services and OOP costs for any other services (medical equipment, etc.).
Among other individual characteristics, being female, having a college degree, and having an annual income greater than 200% FPL were significantly associated with higher annual OOP spending. Beneficiaries with excellent/very good/good SRH, no activity limitation, Black, non-Hispanic, and Hispanic ethnicity were all significantly associated with lower OOP spending (results can be obtained from the authors on request).
Discussion
We found that the prevalence of any of the “big four” chronic conditions was associated with significantly higher OOP spending among Medicare FFS beneficiaries than those who did not have any of these chronic conditions. Beneficiaries with any of the “big four” conditions spent more than 19% (adjusted mean cost of $825) on OOP costs than those without any of these conditions. The prevalence of any of these conditions triggers a more than 50% higher probability of OOP spending greater than 20% of annual per capita income. Notably, three of these “big four” chronic conditions are identified by the World Health Organization (n.d.) as noncommunicable diseases that are costly to society in terms of mortality and significant financial burdens associated with direct health care spending. We observed that CVD is the costliest in terms of both absolute OOP spending as well as high OOP spending. This is perhaps not surprising given the evidence that stroke and heart failure are the most expensive chronic diseases among Medicare FFS beneficiaries. These findings are important for policymakers who want to address financial burdens associated with costly chronic health conditions among Medicare beneficiaries.
Our estimates may not be directly compared in terms of dollar values with published research due to differences in study sample and calculation of OOP-spending components. However, the relative effects of predictive mean costs in our study can be compared with estimates in published studies. For example, using the Health and Retirement Study, Fong (2019) reported that increased OOP spending (adjusted) was highest for CVD, which is consistent with our finding of the highest predicted mean OOP cost for CVD (Table 5) among the four chronic conditions. It is important to note that OOP spending is likely to increase over time (we found evidence of statistically significant changes in spending over time for some chronic conditions) and could contribute to significant financial burdens to older adults since these chronic conditions persist for extended periods (Babitsch et al., 2012).
Our analysis is also informative from the perspective of specific health care services that contribute to increased OOP spending. Costs of prescription medication appeared to be the most important contributing factor of higher annual OOP spending for three (CVD, diabetes, and chronic lung disease) out of four chronic conditions, consistent with the growth of prescription medication costs in the United States (Dieleman et al., 2016; Willink et al., 2017). Excess OOP burdens due to the cost of prescription medication may disproportionately affect Medicare FFS beneficiaries that may have important implications for the clinical management of these conditions, especially for CVD, which appears to be highly prevalent and the costliest among the “big four” conditions.
Limitations
Our study has some limitations that should be noted. First, the prevalence of chronic health conditions in MCBS is based on survey data reported by beneficiaries, which may be subject to recall bias. However, we also have compared the prevalence of the “big four” chronic illnesses using International Classification of Diseases, 10th Revision codes based on inpatient and outpatient claims from the cost supplement files and did not find any qualitative difference from our OOP estimates. Therefore, we decided to use survey-based responses given the prior evidence of using MCBS survey-based chronic disease prevalence linked to cost supplement files. Second, some treatment costs may not be included in the charges and therefore not be included in the OOP cost in the claims if reimbursement rates are low, even when the treatment was delivered, and beneficiaries incur some cost sharing.
Conclusion
Medicare beneficiaries with any of the “big four” (CVD, cancer, diabetes, and chronic lung disease) chronic conditions incur increased OOP spending compared with beneficiaries without any of these conditions. Financial burden as a percentage of annual per capita income is also higher for individuals with any of these chronic conditions. Recognizing the heterogeneous effects of excess OOP spending and spending patterns by those conditions over time, appropriate health interventions may prevent the onset and manage those conditions effectively with a goal to reduce financial burdens among Medicare FFS beneficiaries.
Footnotes
Declaration of Conflicting Interests
The author(s) declared no potential conflicts of interest with respect to the research, authorship, and/or publication of this article.
Funding
The author(s) received no financial support for the research, authorship, and/or publication of this article.