
Abstract
This article examines the relative merit of augmenting an electronic health record (EHR)-derived predictive model of institutional long-term care (LTC) use with patient-reported measures not commonly found in EHRs. We used survey and administrative data from 3,478 high-risk Veterans aged ≥65 in the U.S. Department of Veterans Affairs, comparing a model based on a Veterans Health Administration (VA) geriatrics dashboard, a model with additional EHR-derived variables, and a model that added survey-based measures (i.e., activities of daily living [ADL] limitations, social support, and finances). Model performance was assessed via Akaike information criteria, C-statistics, sensitivity, and specificity. Age, a dementia diagnosis, Nosos risk score, social support, and ADL limitations were consistent predictors of institutional LTC use. Survey-based variables significantly improved model performance. Although demographic and clinical characteristics found in many EHRs are predictive of institutional LTC, patient-reported function and partnership status improve identification of patients who may benefit from home- and community-based services.
Introduction
Over the past two decades, the U.S. Veterans Health Administration (VA) has attempted to “rebalance” long-term care (LTC) expenditures away from institutional care and toward home- and community-based services (HCBS; Thomas et al., 2018). Similar to other health care systems, VA’s emphasis on growing HCBS is motivated by patients’ preferences to remain in the home for as long as possible, as well as the potential for cost savings through the substitution of more affordable HCBS for more costly institutional LTC services (Iglehart, 2016; Konetzka, 2014; Wolff et al., 2008). The most recent HCBS expansion efforts include the 2016 implementation of the Veteran-Directed Care and Medical Foster Home programs and the 2017 implementation of the Choose Home Initiative, which increased community support for Veterans with substantial impairments (Duan-Porter et al., 2020; Thomas et al., 2018; Yuan et al., 2019). When expanding HCBS in this way, a health system needs to ensure that it is optimizing the use of these limited resources. One way to optimize HCBS is to use existing data to identify those likely to thrive with these types of services.
Optimization depends on two related effects. The first is a substitution effect among people who would have otherwise used nursing home care. Evidence from Medicaid suggests that in states where new HCBS precisely targeted patients who required nursing home–level care, HCBS substituted for institutional care, and there were declines in overall LTC expenditures (Grabowski, 2006; Kaye, 2012; Kaye et al., 2009). The second effect relates to increased demand for HCBS among patients who are primarily reliant on informal care, but who would use HCBS if they were made available (Grabowski, 2006). In this article, we focus on optimizing a health system’s ability to facilitate the first effect through patient-reported measures. If well-targeted and early access to HCBS can delay or lower patients’ probability of entry into a nursing home, patients will be able to remain in their preferred setting for longer, and the health system can maximize the reach of its limited LTC budget. Optimizing a health system’s ability to identify patients at higher risk of eventually using institutional LTC services is, therefore, important from both patient and health system perspectives.
In recent years, the VA has developed dashboards for providers to identify patients who are likely to benefit from LTC services so that HCBS can be targeted toward these patients. One such dashboard was created for the Geriatric Patient Aligned Care Team (GeriPACT) program, which provides frail, elderly Veterans and their caregivers access to multidisciplinary geriatric care through a single point of contact (Powers et al., 2018). This dashboard shows providers which patients might benefit from HCBS based on information that is currently available in administrative data sets, such as age and computed risk scores. It also provides descriptive information about factors that are predictive of LTC utilization, such as gender, rurality, service-connected disability information, and diagnoses. Given that these dashboards may inform how HCBS are targeted toward Veterans, it is important to understand the extent to which the characteristics highlighted in these dashboards actually predict institutional LTC utilization and whether there are ways to enhance the information in these dashboards. This is especially important in light of the substantial body of literature that suggests factors excluded from this dashboard are key predictors of LTC utilization. In particular, functional status, access to informal care, and socioeconomic characteristics have all been found to be strong patient-level predictors of entry into institutional LTC settings (Gaugler et al., 2007).
New Contributions
In the present study, we examined the extent to which the addition of factors not commonly captured in VA structured data from the electronic health record (EHR) improves our ability to predict Veterans’ use of institutional LTC. We compare models predicting the probability of using institutional care based on risk factors currently used in the VA’s GeriPACT Dashboard with models that include additional EHR variables as well as variables that are not consistently captured in the VA EHR. We compare fit statistics across models and identify which predictors are consistently associated with institutional LTC use. Results from this study can guide integrated health system investment decisions in data capture systems if the inclusion of patient-reported variables that are not routinely captured substantially improves the ability to identify Veterans most likely to benefit from LTC services.
Method
Study Design
We compare the performance of three models that predict the probability of VA institutional LTC utilization over a 1-year period for Veterans aged ≥65. The first model is based on the EHR-derived characteristics currently used to identify patients who would benefit from geriatric services through the VA’s GeriPACT Dashboard (US Department of Veterans Affairs, 2021). The second model includes additional variables that are not currently included in the GeriPACT Dashboard but that have been found to predict LTC institutionalization in the existing literature and could be added from the EHR without collecting new information. The third model includes all EHR variables from the first two models as well as patient-reported measures that are not consistently captured in VA’s EHR. Patient-reported measures were collected via survey methods, as described below. Because the third model includes additional well-established predictors of LTC utilization, we hypothesize that this model will perform better than the first two models.
Survey Method
Patient-reported measures included in the survey-based model (Model 3 outlined below) were collected in 2018 using a mail survey sent to a nationally representative stratified random sample of 10,000 Veterans. The sampling frame included “high risk” Veterans, as defined by a 1-year risk of hospitalization or death on March 16, 2018, that were in the 75th or higher percentile based on the VA’s Care Assessment Need (CAN) score (DeSalvo et al., 2006). A sample of 10,000 high-risk Veterans across all U.S. VA medical centers were selected using PROC SURVEYSELECT (SAS, version 9.4; SAS Institute Inc.), via stratified random sampling proportional to the percentage of Veterans with a CAN score of 75 or higher in each VA medical center. This enabled us to obtain a nationally representative sample of Veterans who had at least one VA outpatient visit from March 20, 2017, to March 18, 2018; were alive; and had a valid home address at the time of cohort generation. (Zulman et al., 2020). Using the Dillman method (Dillman et al., 2014; Fillenbaum & Smyer, 1981), the survey was sent with a cover letter, a US$2 bill incentive, a prepaid return envelope, and information to opt out from further mailings. The cover letter described the purpose of the survey, how Veterans were identified as potential survey respondents, and a statement that their return of the mailed survey constituted informed consent. Veterans who did not opt out and who did not respond within a 6-week period were mailed a second survey with a prepaid envelope and cover letter. Survey measures were informed by the Cycle of Complexity Model (Berkowitz et al., 2014), which posits that patient complexity is a multifactorial construct comprised of workload, acute shocks and medical events, capacity/resilience, and access/utilization.
Study Measures
Outcome
Our outcome measure was institutional LTC utilization at 12 months. Institutional LTC provided by or funded by the VA included care provided in Community Living Centers, Community Nursing Homes, and State Veterans Homes. This care was identified through the VA’s Corporate Data Warehouse (CDW). We also used Centers for Medicare and Medicaid data to identify non-VA institutional LTC. We applied a method based on Yun et al. (2010) and Goodwin et al. (2017), which identifies all LTC stays where Medicare-funded services are provided and excludes any stays that overlap with a Skilled Nursing Facility (SNF) claim for postacute care. This approach has been found to have sensitivity of 88% to 90% for identifying nursing home residents relative to Medicaid claims data (Goodwin et al., 2017; Yun et al., 2010). With this approach, Medicare Part A SNF claims are used to identify dates billed for SNF services. Medicare Part B claims are used to identify care provided in an institutional LTC setting using two types of indicators, both of which are used regardless of whether the patient is receiving SNF or LTC services. The first are Evaluation and Management (E&M) charge codes in either the carrier or outpatient file for professional services provided in a nursing home: 99304-99310, 99315-99316, or 99318. The second are carrier file place-of-service codes for nursing homes (i.e., 32 or 33). If these codes were used for services provided on dates outside of an SNF stay identified in the Part A data, then the stay was classified as an institutional LTC stay (Goodwin et al., 2017).
Selection of Institutional LTC Predictors
Our selection of institutional LTC predictors was informed by the Andersen Model of Health Behavior, as adapted by Bass and Noelker (1987). This framework outlines predisposing, enabling, and health care need factors that predict LTC service utilization (Bass & Noelker, 1987). Predisposing characteristics are intrapersonal factors that affect one’s propensity for using LTC services. Studies have consistently found that advanced age and race predict institutional LTC use (Borrayo et al., 2002; Gaugler et al., 2007). Enabling factors are the resources that are available to the individual to facilitate the use of formal LTC services. These include living arrangements, marital status, availability of informal care, income, and formal care markets, which consistently predict LTC utilization (Arling et al., 2011; Borrayo et al., 2002; Charles & Sevak, 2005; Jette et al., 1995; Kitchener et al., 2003; Segelman et al., 2017; Temkin-Greener & Meiners, 1995). Health care needs refer to the perceived or evaluated illnesses or impairments that necessitate LTC service use and are the strongest predictors of LTC utilization. Activities of daily living (ADL) limitations (particularly ≥3 limitations) are strong predictors of LTC institutionalization (Borrayo et al., 2002; Gaugler et al., 2007). A diagnosis of Alzheimer’s disease or dementia has been found to be positively associated with institutionalization (Severson et al., 1994; Welch et al., 1992), as has the presence of psychiatric and emotional problems (Borrayo et al., 2002), the presence of chronic health conditions (Mitchell et al., 2000), and prior hospitalizations (Gaugler et al., 2007).
Table 1 summarizes the above outlined predictors of LTC utilization and notes the extent to which these factors are captured in the VA’s GeriPACT Dashboard as well as the VA’s EHR. Overall, many well-established predictors of LTC utilization are overlooked completely (i.e., race, marital status, living arrangements, informal care availability, income, and cognitive impairment), whereas other key predictors are captured only indirectly (i.e., ADL, formal care markets, and mental health diagnoses). Below, we discuss how each of these factors are incorporated into the three predictive models that we compare.
Predictors of LTC Utilization Captured by the GeriPACT Dashboard.
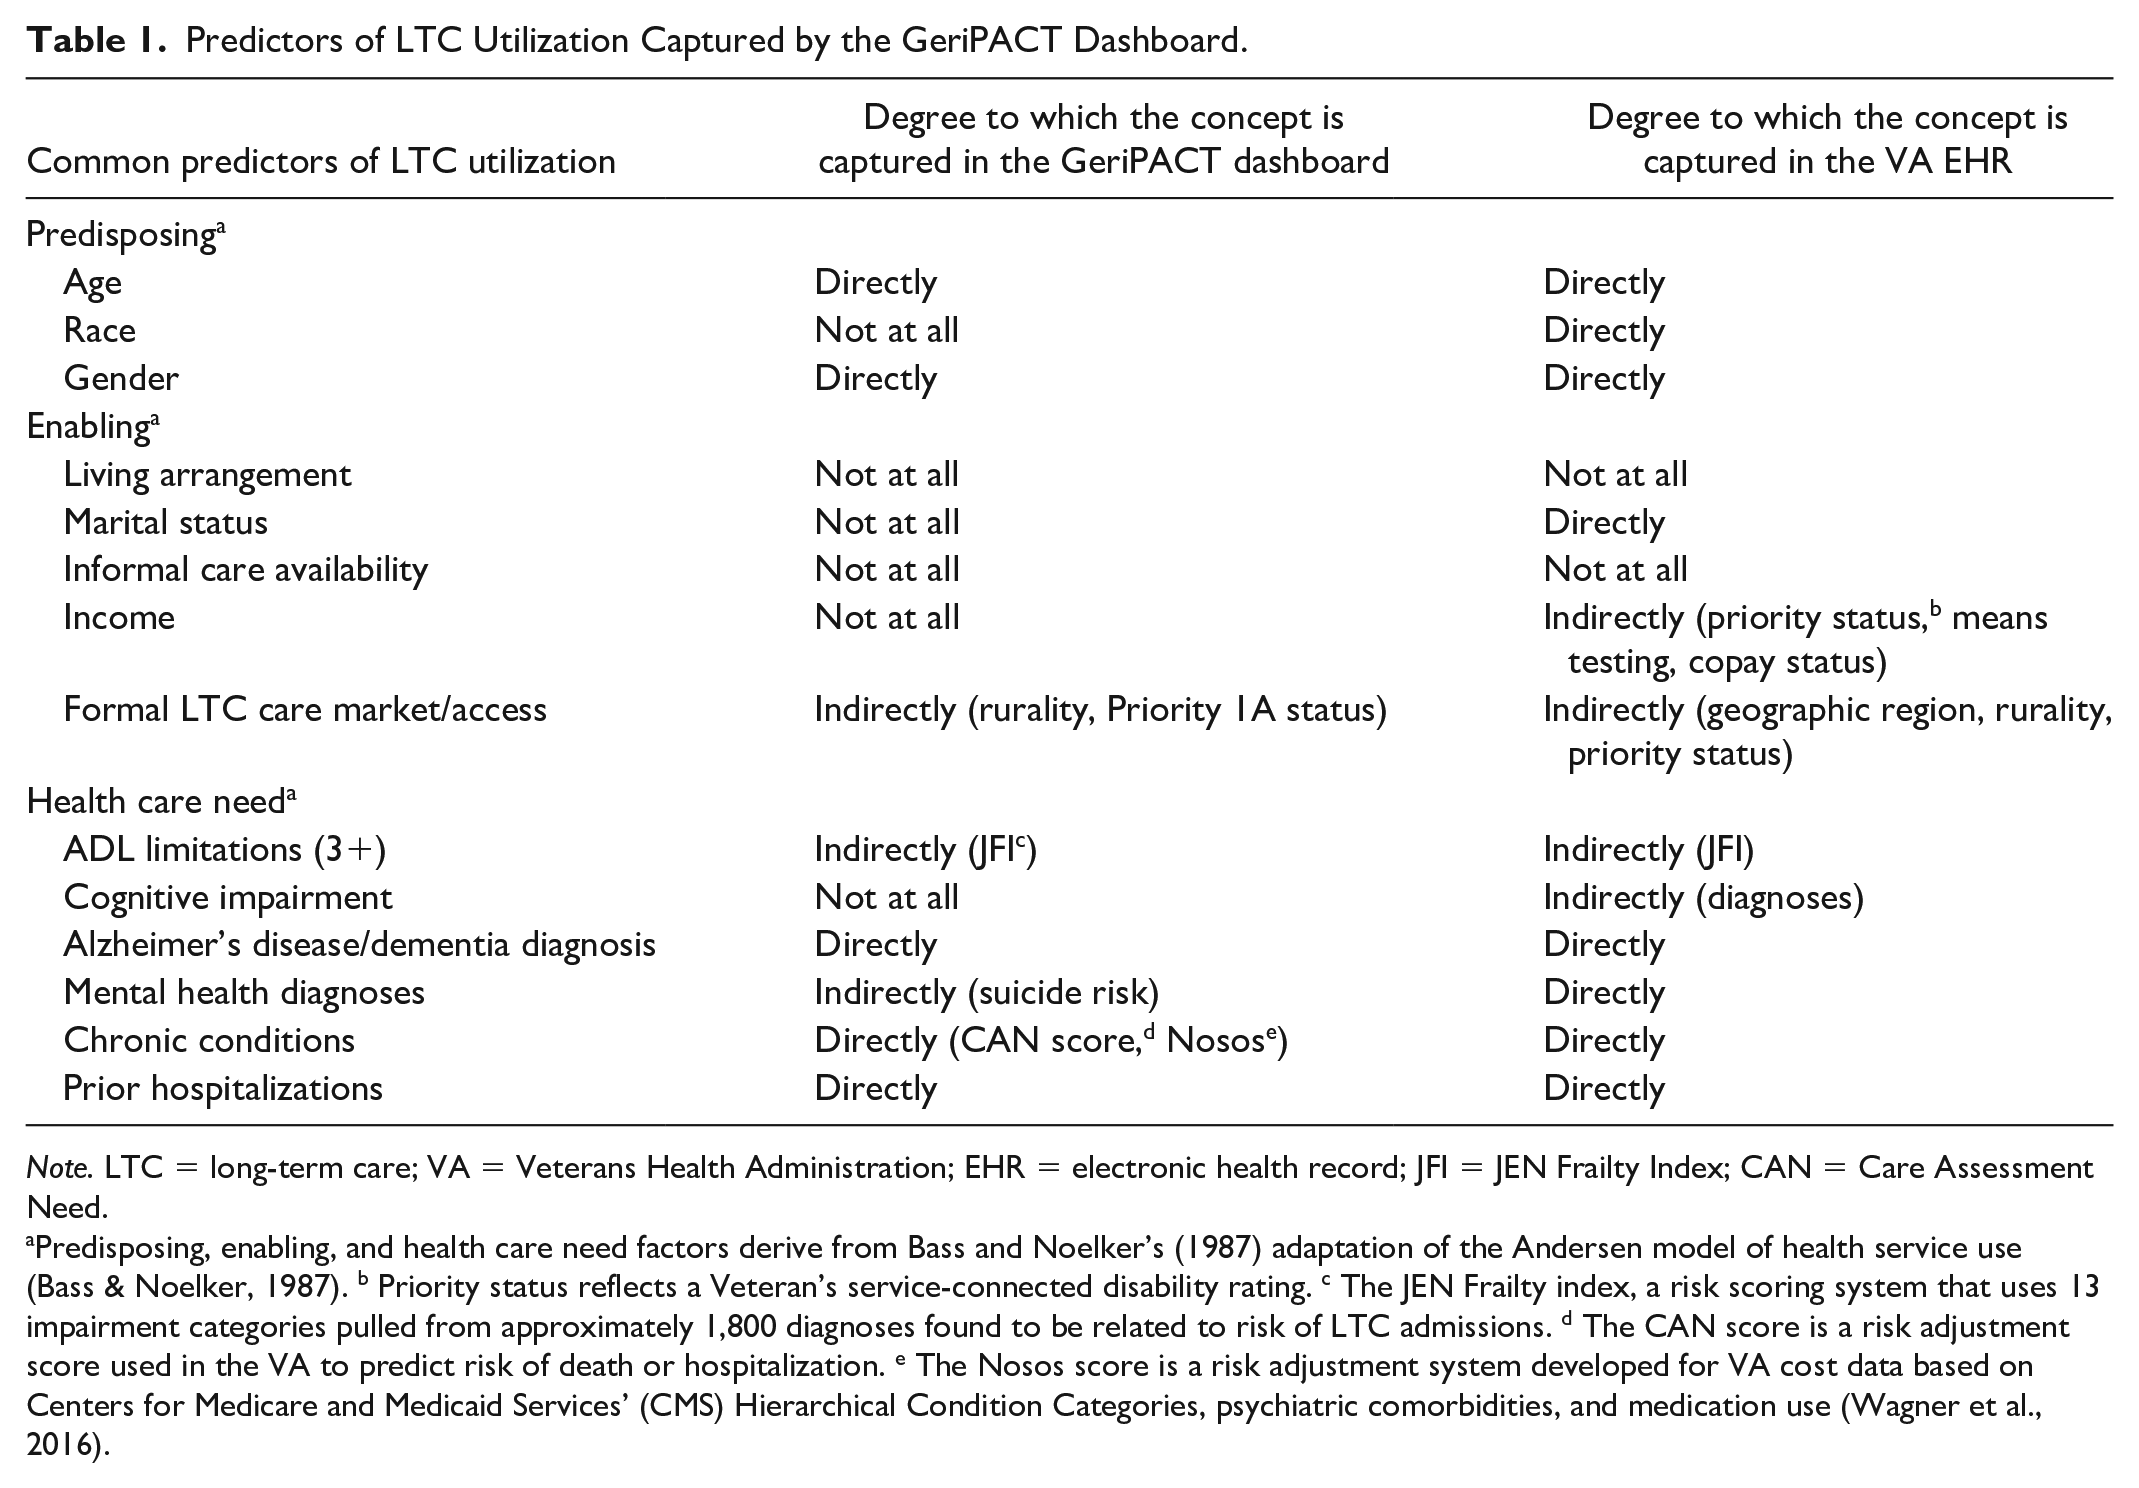
Note. LTC = long-term care; VA = Veterans Health Administration; EHR = electronic health record; JFI = JEN Frailty Index; CAN = Care Assessment Need.
Predisposing, enabling, and health care need factors derive from Bass and Noelker’s (1987) adaptation of the Andersen model of health service use (Bass & Noelker, 1987). b Priority status reflects a Veteran’s service-connected disability rating. c The JEN Frailty index, a risk scoring system that uses 13 impairment categories pulled from approximately 1,800 diagnoses found to be related to risk of LTC admissions. d The CAN score is a risk adjustment score used in the VA to predict risk of death or hospitalization. e The Nosos score is a risk adjustment system developed for VA cost data based on Centers for Medicare and Medicaid Services’ (CMS) Hierarchical Condition Categories, psychiatric comorbidities, and medication use (Wagner et al., 2016).
Model 1 Predictors
The variables included in our GeriPACT Dashboard–derived model were age (75–85 and ≥85), gender, rural or highly rural residence, number of hospitalizations in the prior 12 months, and an indicator for whether the Veteran was Priority 1a status (reflecting that the Veteran has a service-connected disability rating of ≥70% and access to all VA’s Geriatric and Extended Care services without copay). Additional EHR measures included JEN Frailty Index (JFI), a risk scoring system that uses 13 impairment categories pulled from approximately 1,800 diagnoses found to be related to risk of LTC admissions (Kinosian et al., 2018) and the Nosos score, a risk adjustment system developed for VA cost data using Hierarchical Condition Categories (HCC) based primarily on patient diagnoses, age, and gender (Wagner et al., 2016). In sensitivity analyses, we also included additional risk adjustment scores in all three models (i.e., the CAN score and the Prevention Quality Indicator measure). Presence of a mental health diagnosis was a binary indicator for whether the Veteran had an International Classification of Diseases–9th Revision (ICD-9) or International Classification of Diseases–10th Revision (ICD-10) diagnosis of depression, anxiety, substance use disorder, posttraumatic stress disorder, bipolar disorder, or schizophrenia in the prior 12 months. These variables were selected based on information currently available to clinicians in the GeriPACT Dashboard. The dashboard identifies a cohort of patients aged 65 and older who are not currently enrolled in the GeriPACT program, who have a JFI score between 3 and 5, and who have a CAN score ≥75. The dashboard provides descriptive information for all of the above outlined Model 1 predictors for this cohort (US Department of Veterans Affairs, 2021).
Model 2 Predictors
The extended EHR model included all variables from Model 1, as well as race/ethnicity (non-Hispanic White, non-Hispanic Black, Hispanic, and Other or unknown) and a count of 28 chronic conditions identified through ICD-9 and ICD-10 codes (see Supplemental Table S1 for a list of these conditions). Because there were no Veterans utilizing institutional LTC in the “other” category for race/ethnicity, we combined this category (n = 68) with the “unknown” category in regression analyses to enable the calculation of marginal effects. In sensitivity analyses, we also included EHR-derived marital status in this model. Marital status was collected from CDW’s outpatient visits file and is based on the most recent values available prior to the survey date.
Model 3 Predictors
Model 3 included all the variables from Model 2, as well as indicators for the presence of ADL limitations, whether the Veteran is married or living with a partner, informal care availability, and financial status. Limitations with ADL were ascertained using the Older Americans Resources and Services (OARS) ADL questionnaire (Fillenbaum & Smyer, 1981). Based on prior findings that the presence of ≥3 ADL limitations is associated with receipt of institutional care (Gaugler et al., 2007), we created a binary variable indicating the presence of ≥3 ADL limitations. Living arrangement was ascertained by asking, “Are you currently married or living with a partner?” Access to informal care was based on the tangible support components of the Medical Outcomes Survey–8 (MOS-8) (Moser et al., 2012). Respondents were asked, “If you needed it, how often is someone available to . . .” (a) help you if you were confined to bed, (b) take you to a doctor if you need it, (c) prepare your meals if you are unable to do it yourself, and (d) help with daily chores if you were sick. Respondents indicated whether they had access to someone for these tasks all of the time, most of the time, some of the time, a little of the time, or none of the time. We considered someone to have access to informal care if they had access to all four of these tangible supports most or all of the time. Financial status was included in the model as a binary indicator for whether the respondent was “barely getting by,” “falling behind,” or “in serious financial trouble” versus “in good shape” or “okay” in response to the following question: “Which of the following statements best describes your own personal economic situation?”
Analysis
To compare baseline characteristics of respondents and nonrespondents, we calculated standardized differences, and considered a standardized difference of 0.2 to indicate a small but meaningful difference between the two groups (Sawilowsky, 2009). Missing data from the JFI (n = 23), Nosos score (n = 3), finances (n = 102), and tangible supports (n = 131) variables implied that we would lose 6.27% of our sample without accounting for missing data. We used multiple imputation by chained equations (MICE) to impute missing data. The MICE approach creates imputed data sets based on a set of imputation models, with one model for each variable with missing values. It involves producing multiple complete data sets, after which the results of analyses of each data set are combined. White et al. (2011) suggest that the number of imputed data sets should be at least equal to the percentage of incomplete cases in the data set, which in this case would be larger than six (White et al., 2011). As such, we multiply imputed data 10 times using Stata’s mi command (Royston & White, 2011).
We used logistic regression models, which were selected over linear probability models given the possibility of misclassification for our outcome variable. In instances where misclassification is likely, linear probability models are more likely than maximum likelihood models to lead to an inability to identify parameters and calculate marginal effects (Hausman et al., 1998). Because our survey sampling design was clustered at the VA medical center level, standard errors for all regressions were clustered at the medical center level. Model performance was compared via Akaike information criteria (AIC) and C-statistics. We calculated the mean AIC, considering a decrease in AIC of >2 to indicate considerable improvement and a decrease of >10 to indicate substantial improvement (Heinze et al., 2018; Sanchez-Pinto et al., 2018). We also report mean C-statistics for each model and considered a C-statistic above 0.8 to indicate a well discriminating model (Steyerberg et al., 2010). Predictive performance was also assessed by comparing each model’s sensitivity and specificity. We established a cutoff value for the predicted probability using Youden’s J, which maximizes the sum of the sensitivity and specificity, thereby not favoring one over the other (Youden, 1950). We compared observed institutional LTC utilization with the predicted outcomes from our models. The cohort in our base case analysis was limited to Veterans aged ≥65 due to our focus on LTC utilization and the use of Medicare claims data when constructing the outcome variable. Sensitivity analyses that included all survey respondents, regardless of age, were also conducted.
Role of the Funder
This work was funded by the Veterans Health Administration Office of Primary Care. The evaluation was reviewed and designated as nonresearch quality improvement by the supporting VA program office and the Durham VA Medical Center and Stanford University institutional review boards and, therefore, did not require approval or informed consent.
Results
Sample Overview
Of the 10,000 Veterans who received a paper survey, 4,685 returned a survey. Eight Veterans were excluded from analysis because they were deceased prior to the survey field period (n = 5) or because they were missing essential EHR data (n = 3). Based on variables with standardized differences greater than 0.2 (Supplemental Table S2), survey respondents tended to be older, were less likely to be non-Hispanic Black, and were less likely to have 0 to 1 chronic conditions relative to nonrespondents (Figure 1). Among our analytic sample of Veterans above the age of 65 (n = 3,478), there were no significant differences between respondents and nonrespondents.
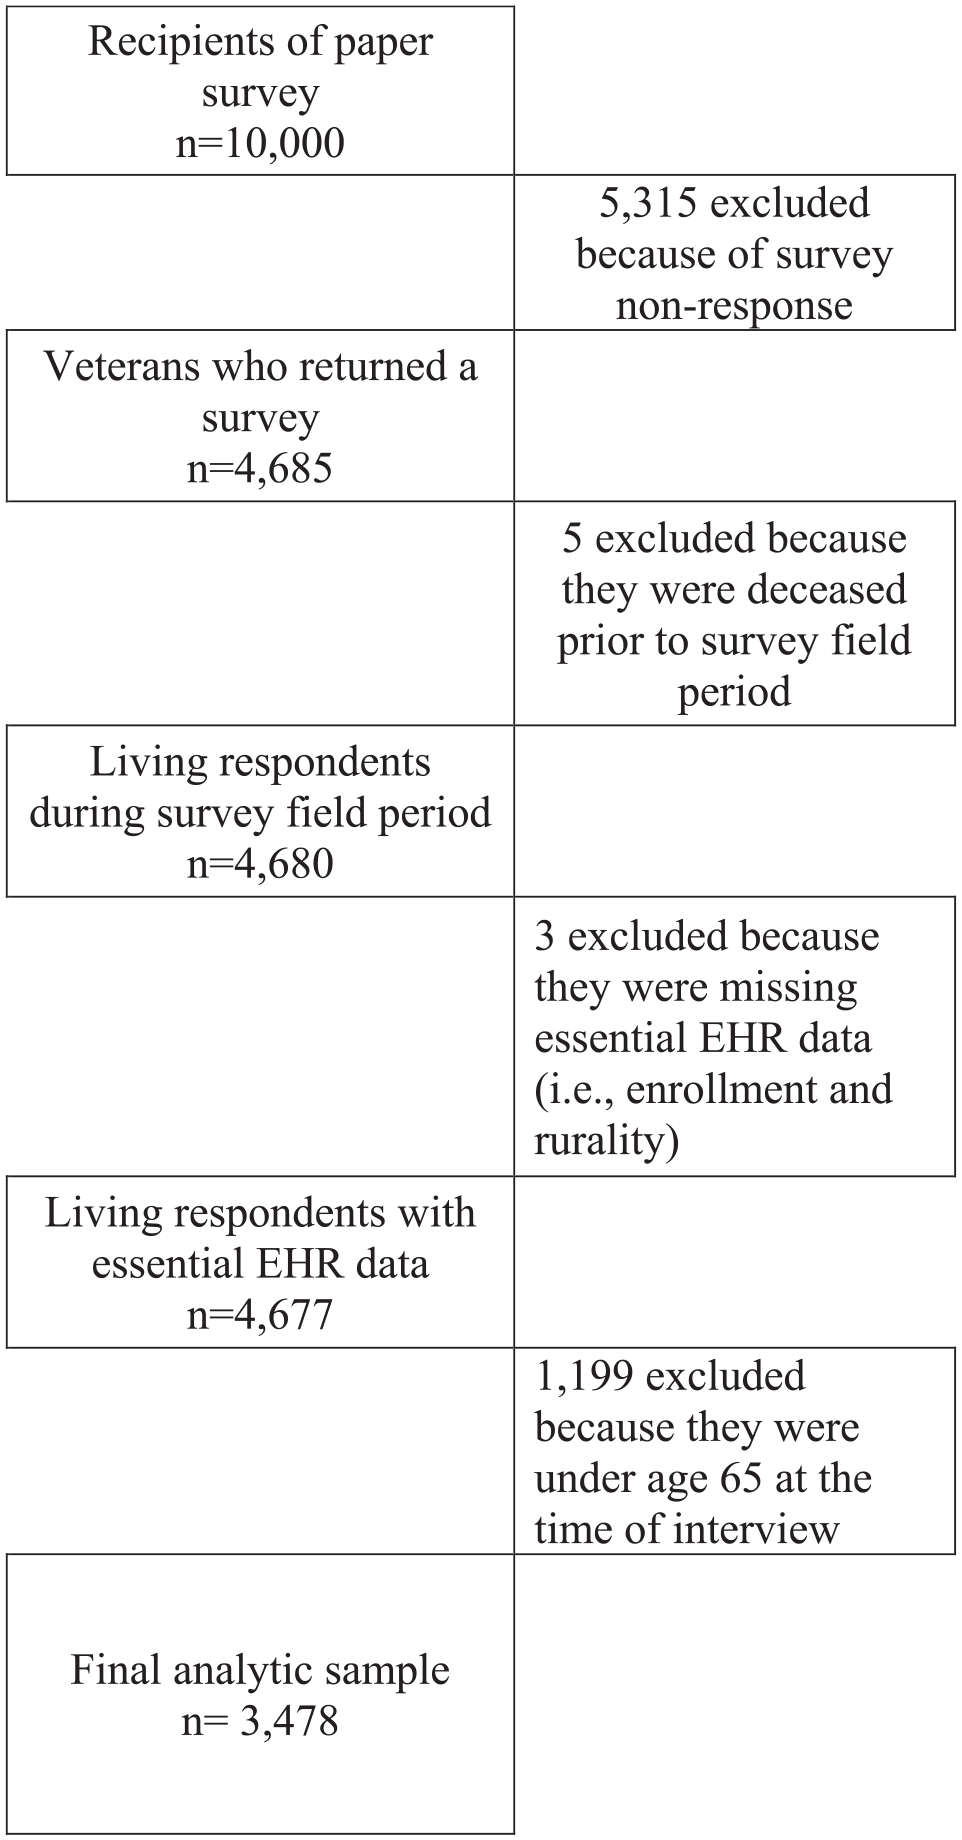
Sample Flow Diagram
Table 2 provides a descriptive overview of the sample: 42.3% of the analytic sample of 3,478 Veterans was above the age of 75 and 38.6% lived in rural or highly rural locations; 35.4% of the sample had a Priority 1a status that entitled them to full coverage of LTC services; 25.2% had a JFI score of 6 or higher, 5.6% a diagnosis of dementia, 26.2% a mental health diagnosis, and 51.7% had four or more chronic conditions. Non-Hispanic Black respondents comprised 12.0% of the sample and Hispanic respondents 3.8%. In all, 12.0% of the sample had three or more ADL limitations, 61.6% were married or living with a partner, and 54.3% indicated that they would have access to tangible support if they needed it. Most respondents (65.3%) indicated that their finances were good or okay, whereas the remaining 34.7% indicated that they were barely getting by, falling behind, or in serious financial trouble. Overall, the rate of institutional LTC utilization in the 12 months following the survey date was 4.97% (n = 173).
Mean and Proportions of Respondent Characteristics at Baseline for Veterans Aged ≥65.
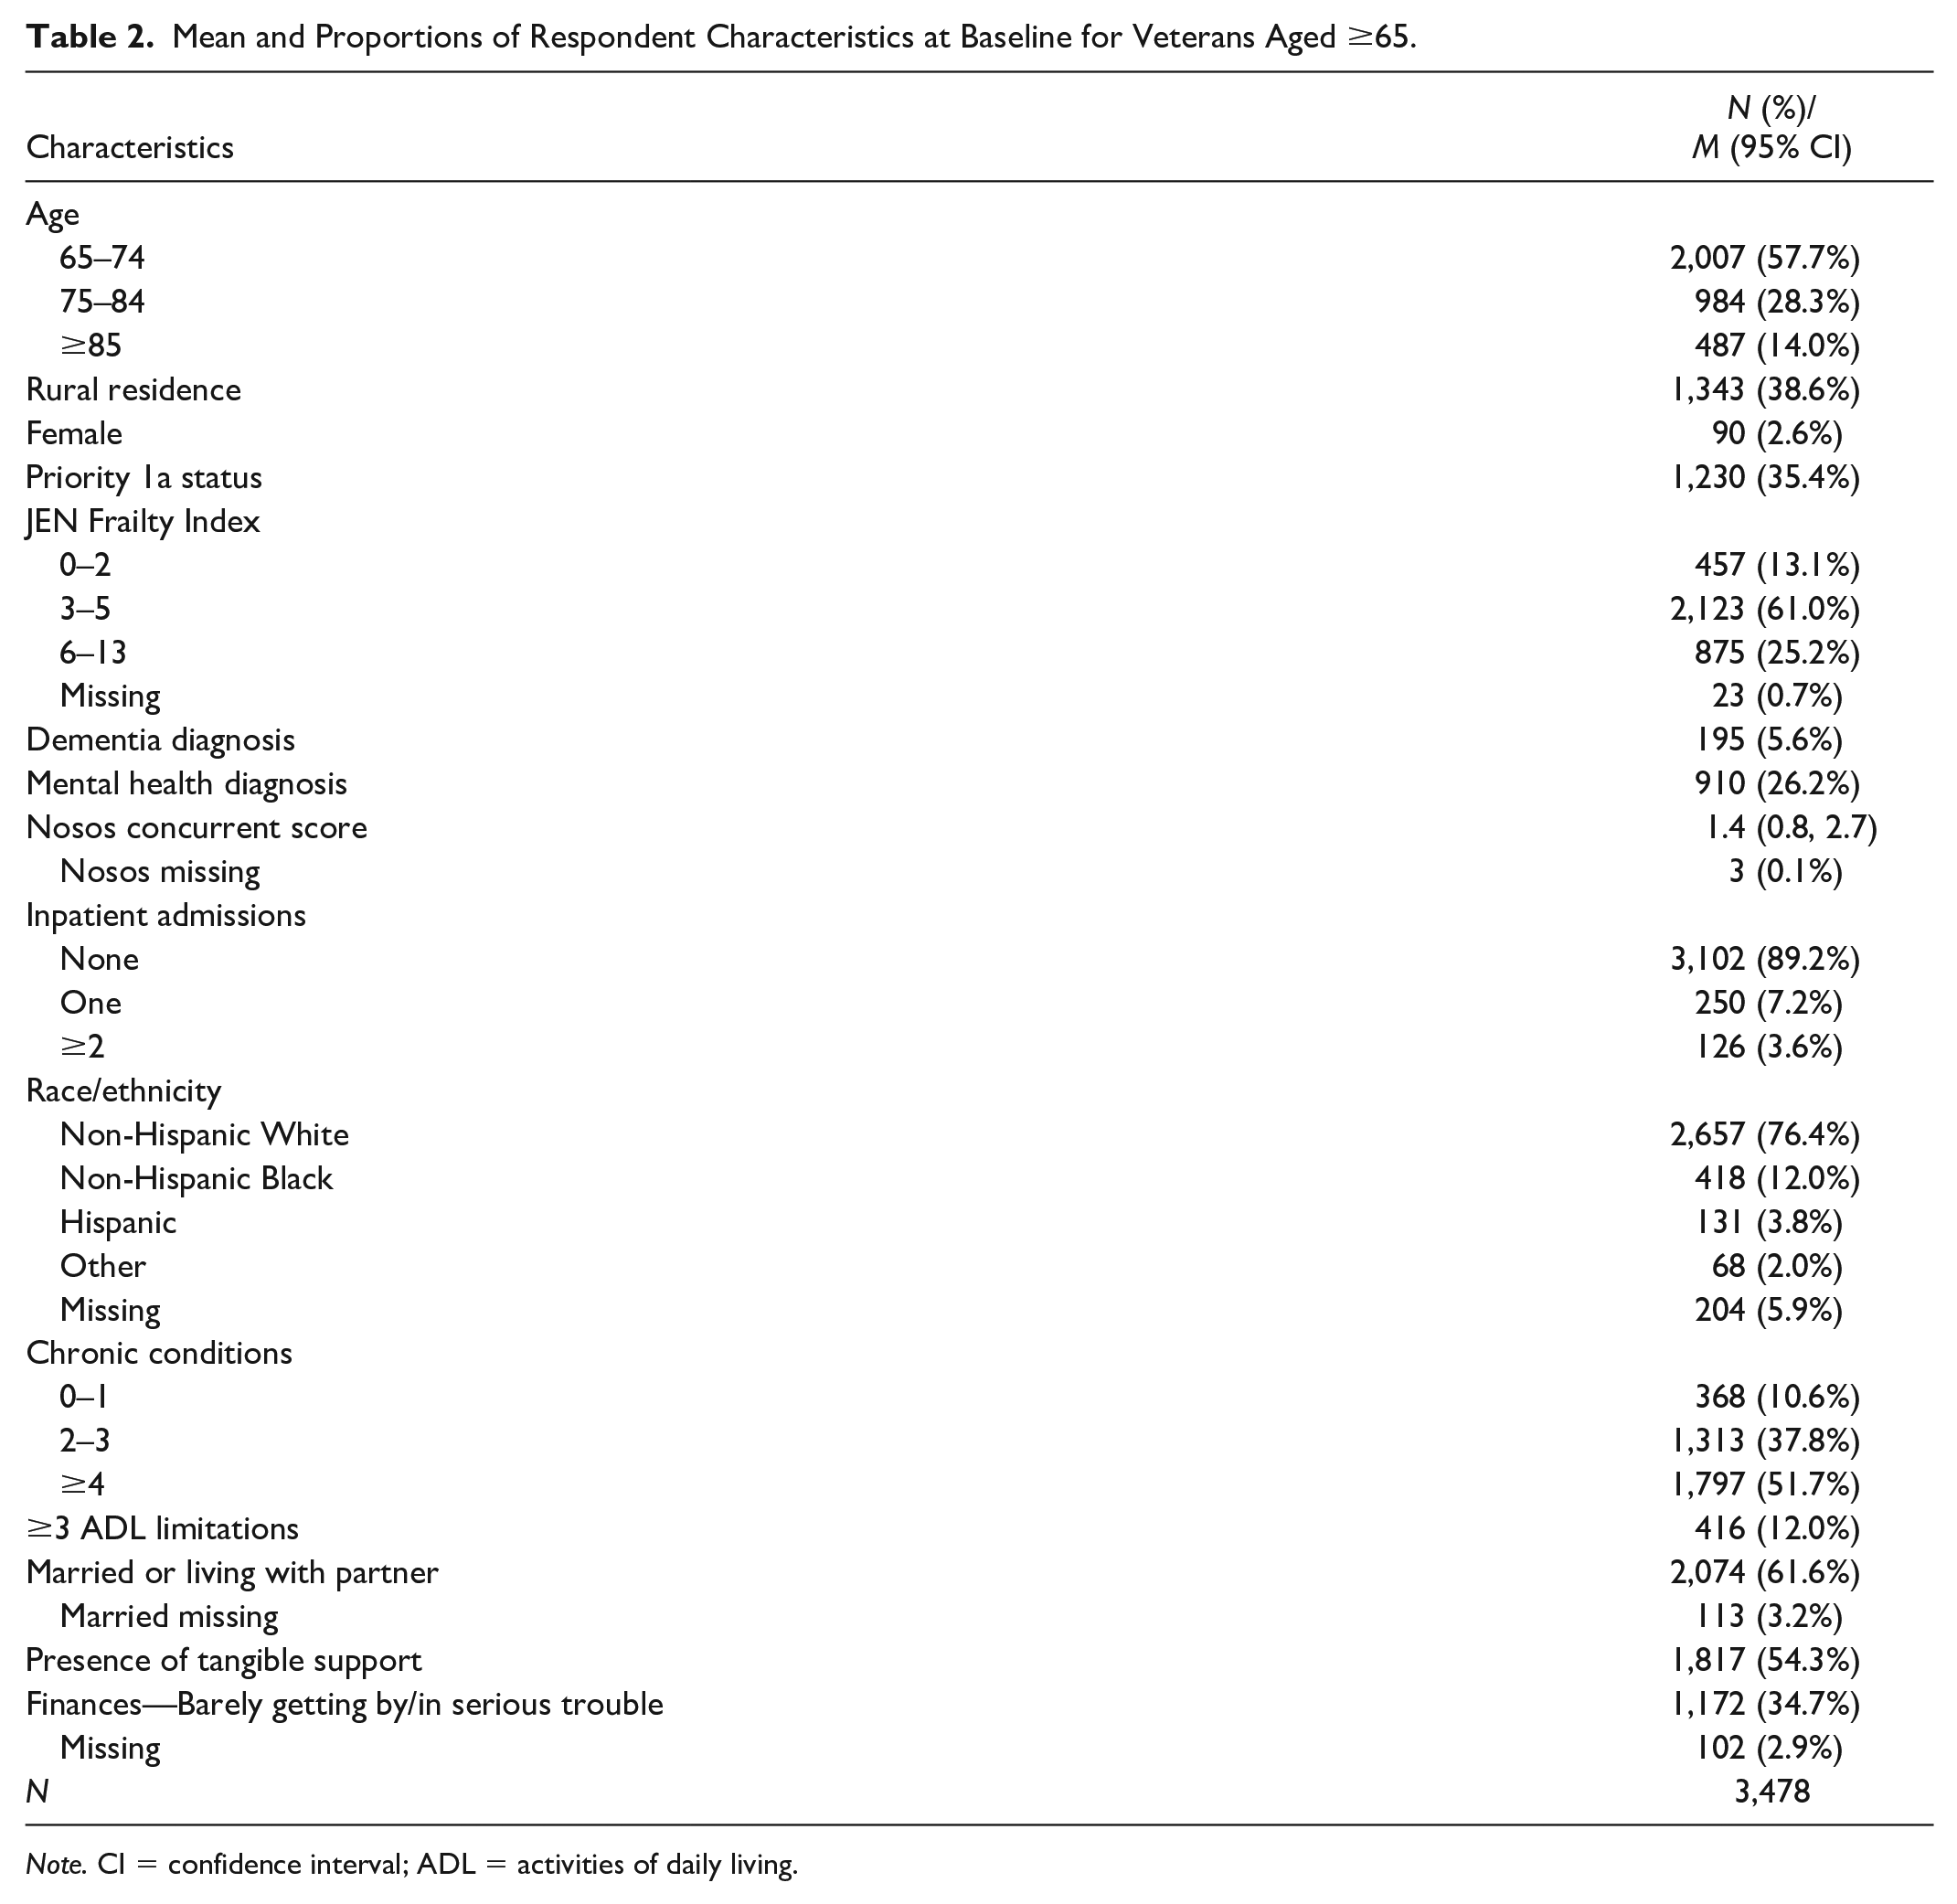
Note. CI = confidence interval; ADL = activities of daily living.
Model Performance Comparison
Model performance statistics are presented at the bottom of Table 3. The mean AIC value was significantly lower for the survey-based model (Model 3; AIC = 1,188) compared with the GeriPACT model (Model 1; AIC = 1,229) and the extended EHR model (Model 2; AIC = 1,229). The decrease in AIC for Model 3 relative to both Models 1 and 2 met our criteria for a substantial improvement in AIC, which was an observed decrease of 10 or more. The C-statistic for Model 3 was also the highest at 0.829 versus 0.780 and 0.786 for Models 1 and 2, respectively. The C-statistic for Model 3 was the only one that met our criteria for a well-discriminating model (i.e., C-statistics ≥ 0.80). Model 3 had the highest sensitivity (0.728) and specificity (0.796) relative to Model 1 (sensitivity = 0.619, specificity = 0.79) and Model 2 (sensitivity = 0.624, specificity = 0.782).
Marginal Effects and Model Fit Statistics for Logistic Regression Models Predicting 1-Year Institutional Long-Term Care Utilization for Veterans Aged ≥65.
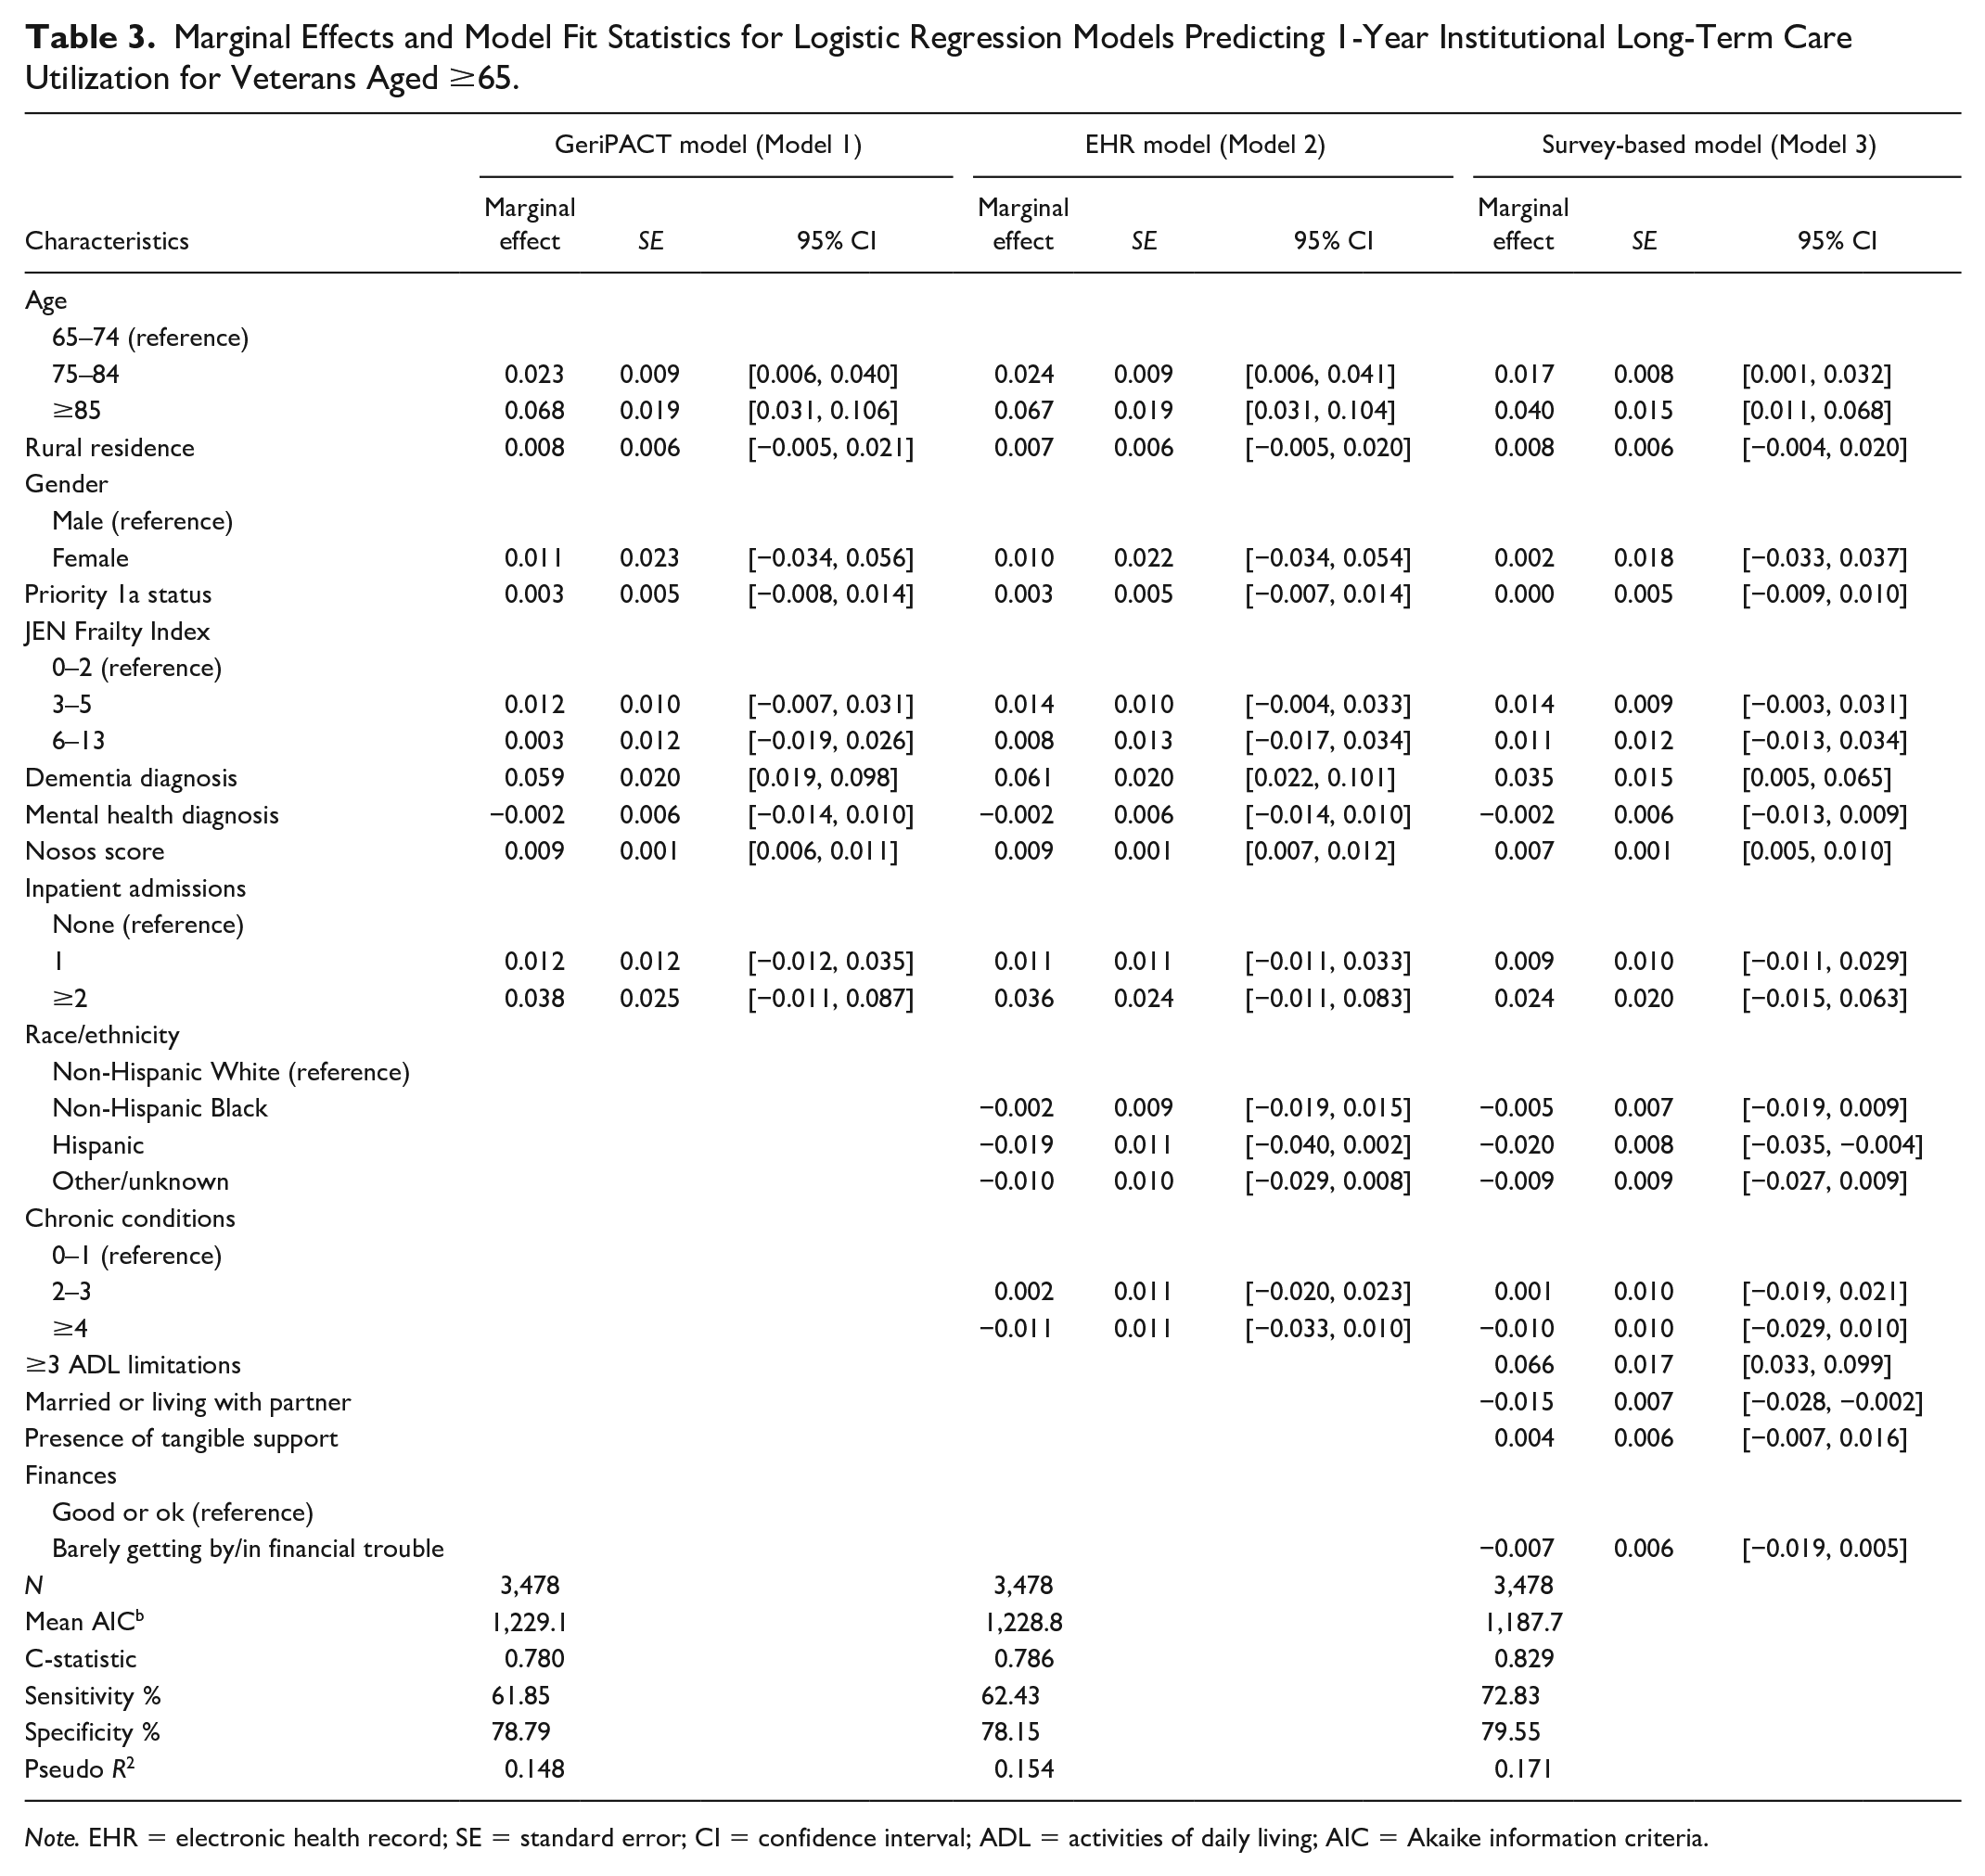
Note. EHR = electronic health record; SE = standard error; CI = confidence interval; ADL = activities of daily living; AIC = Akaike information criteria.
Model Results
Table 3 summarizes the marginal effects and 95% confidence intervals (CIs) for all the covariates in each model, with predicted probabilities for all covariates summarized in Supplemental Table S3. Across all three models, we see similar patterns in terms of which factors consistently predict LTC institutionalization. Unless otherwise stated, all marginal effects reported below are from the survey-based model (Model 3, Table 3). Age is a consistent and strong predictor of LTC utilization. Respondents aged 75 to 84 and 85+ were, respectively, 1.7% points (95% CI = [0.001, 0.032]) and 4.0% points (95% CI = [0.011, 0.068]) more likely to use institutional LTC relative to those below 75. The association was attenuated slightly in the survey-based model relative to the models based on EHR variables alone (Model 2). Veterans with a diagnosis of dementia were 3.5% points (95% CI = [0.005, 0.065]) more likely to use institutional LTC, whereas a unit increase in the Nosos value was associated with a 0.7% point (95% CI = [0.005, 0.010]) increase in institutional LTC use. In the survey-based model, Hispanic Veterans were 2.0% points (95% CI = [−0.035, −0.004]) less likely to use institutional LTC.
From the survey-based variables, the presence of functional limitations was the strongest predictor of institutional LTC use. Veterans with ≥3 ADL limitations were 6.6% points (95% CI = [0.033, 0.099]) more likely to use institutional LTC. Having a partner or being married was negatively associated with institutional LTC use, with partnered Veterans being 1.5% points (95% CI = [−0.028, −0.002]) less likely to use institutional LTC.
Sensitivity Analyses
Alternate models that used the full survey sample without age restrictions (n = 4,677) yielded similar results with respect to model performance. In the full sample model, however, survey-reported partnership status was nonsignificant (Online Appendix 4). In sensitivity analyses that included additional risk adjustment scores (i.e., the CAN score and the Prevention Quality Indicator measure), we did not see significant improvement in model performance. In analyses that included EHR-derived marital status in Model 2 as opposed to survey-reported partnership status in Model 3, there was no improvement in model performance, and being married was not significantly associated with institutional LTC use.
Discussion
We compared the performance of three models predicting use of institutional LTC services among a cohort of high-risk Veterans aged 65 and older. We found that age, rurality, a diagnosis of dementia, Nosos risk score, partnership status, and having three or more ADL limitations were significant predictors of institutional care use. These findings are in line with previous literature exploring predictors of institutional LTC use (Gaugler et al., 2007). We found that only the survey-based model met our criterion for a well-discriminating model, with a C-statistic of 0.82. The best performing model with respect to AIC minimization was also the survey-based model, which resulted in a decrease in AIC of 41.4. The additional explanatory power from the survey-based model was predominantly due to the inclusion of information on functional limitations (≥3 ADL limitations) and partnership status. We also observed an increase in sensitivity from 61.85% to 72.83%, with no decrease in specificity. This implies that of the 42,158 Veterans who used VA-provided or VA-funded institutional LTC in 2018 (US Government Accountability Office, 2020), an additional 4,627 Veterans would be correctly identified using predictions from the survey-based model (Model 3) relative to the GeriPACT model (Model 1) without additional false positives.
These results indicate that although LTC institutionalization models using variables included in the GeriPACT dashboard perform well, their predictive power could be improved with additional information that is not currently included in the EHR. ADL information, in particular, was highly predictive of institutional LTC use, and its inclusion in these models had the largest impact on the models’ performance. This is in line with prior research that has identified ADL information as the most important predictor of institutional LTC utilization (Gaugler et al., 2007). Our findings indicate that even with the inclusion of measures that are highly correlated with functional status information, such as JFI (Kinosian et al., 2018), ADL information still adds significant predictive power to these models. This improvement in predictive power from ADL information could facilitate earlier intervention with HCBS.
These results highlight the importance of finding ways to collect ADL information, such as through regular functional assessments and the addition of structured EHR fields. Health care systems aiming to implement additional screening in clinical settings can learn from ongoing efforts to integrate social determinants of health (SDH) into EHRs. Although there is often widespread agreement among providers about the utility of SDH information (Davidson & McGinn, 2019), there is less agreement about how the collection of this information should be integrated into existing workflows (Gold et al., 2017), who should be conducting SDH screening (Schickedanz et al., 2019), and whether the collected information should be limited to factors that are actionable by clinicians (Davidson & McGinn, 2019; Schickedanz et al., 2019). As health systems work through these challenges, they may also want to consider capitalizing on functional status information that can be found in unstructured EHR sources, such as free-text notes, by using methods such as natural language processing.
We also found that survey-collected partnership status information was predictive of institutional LTC whereas EHR-derived marital status was not. The differences in how each variable performed in our models is likely due to the discordance we observed between the two variables: 10.2% (n = 344) of survey respondents who indicated they were married or had a live-in partner in the survey were coded as divorced, never married, separated, or widowed in the EHR. A smaller proportion (5.53%; n = 186) self-identified as not having a partner in the survey but were coded as married in the EHR. This discordance may be due to the broader phrasing of the survey question, which asked about both married and live-in partners, as well as the likelihood that the survey-based information was more recent than the EHR-derived marital status variable. These findings suggest that there may be added value in more frequent collection of information about the presence of a coresidential partner.
Our results should be interpreted while keeping in mind certain limitations. First, in this article, we focus on practical considerations for targeting HCBS. There are also important ethical considerations that should be considered, but which were beyond the scope of this article. In particular, the assessment of the predictive power of models such as these is based on historical data that reflect prior utilization patterns. Predicted probabilities are compared with a “gold standard” of observed utilization patterns to help identify Veterans with LTC needs. These prior utilization patterns, however, do not necessarily reflect the optimal or most equitable practice patterns. If LTC utilization is not observed for certain groups due to access barriers or discrimination, as opposed to differences in need or preferences for LTC, then policies informed solely by predictive models will not highlight and help mitigate these issues. Second, contrary to prior studies, we did not find that common predictors of LTC use, such as gender, race/ethnicity, chronic condition and mental health diagnoses, presence of a caregiver, and financial status, consistently predicted LTC utilization. In some instances, these findings may be due to the use of survey measures that do not accurately capture the concept in question. The MOS-8 tangible support questions, for instance, capture the respondents’ perceived access to informal care in a hypothetical situation as opposed to the respondents’ actual receipt of informal care. Most studies exploring the relationship between informal care and LTC institutionalization use the latter (Lo Sasso & Johnson, 2002; Van Houtven & Norton, 2004). In other instances, the relatively small number of observations for certain subgroups (e.g., women and respondents who were non-Hispanic Black or Hispanic) in combination with a rare outcome, may explain why some common predictors of LTC use were not significant at p < .05. Finally, we also note that in the years prior to our survey, VA introduced several HCBS programs such as the Veteran-Directed Care and Medical Foster Home Programs. Although the introduction of new institutional LTC substitutes such as these may affect the relationship between the predictors and outcome, we note that over the course of our follow-up period, these programs still had very limited reach.
Conclusion
Our findings indicate that the information currently provided to VA clinicians to help identify patients who would benefit from HCBS is predictive of who ultimately uses VA institutional LTC. This is in line with what we would expect from a health system that is aiming to substitute HCBS for institutional LTC. Information about functional status as well as coresidential partnership, however, would significantly improve clinicians’ ability to target HCBS toward Veterans who are likely to be eventual users of institutional LTC. This finding has important implications for the majority of older adults, both inside and outside the VA, who are cared for in nongeriatric primary care settings where this information is not routinely collected (Nicosia et al., 2019).
Supplemental Material
sj-docx-1-mcr-10.1177_10775587211062403 – Supplemental material for Improving Prediction of Long-Term Care Utilization Through Patient-Reported Measures: Cross-Sectional Analysis of High-Need U.S. Veterans Affairs Patients
Supplemental material, sj-docx-1-mcr-10.1177_10775587211062403 for Improving Prediction of Long-Term Care Utilization Through Patient-Reported Measures: Cross-Sectional Analysis of High-Need U.S. Veterans Affairs Patients by Josephine C. Jacobs, Matthew L. Maciejewski, Todd H. Wagner, Courtney H. Van Houtven, Jeanie Lo, Liberty Greene and Donna M. Zulman in Medical Care Research and Review
Footnotes
Acknowledgements
The authors acknowledge Valerie Smith, Janet, Grubber, and Sharon Dally for their contributions toward constructing the analytic data set.
Declaration of Conflicting Interests
The author(s) declared the following potential conflicts of interest with respect to the research, authorship, and/or publication of this article: Drs. Jacobs, Zulman, Maciejewski, Van Houtven, and Wagner received grant funding from the U.S. Department of Veterans Affairs Health Services Research and Development Service. Dr. Van Houtven also declares receiving US$2,500 for a keynote address at the Middle Tennessee Geriatrics Conference, US$2,500 in consulting fees from the Commonwealth Fund in 2020, and grants from the National Institutes of Health. Dr. Zulman declares receiving grant funding from the Betty Moore Foundation and Stanford University.
Funding
The author(s) disclosed receipt of the following financial support for the research, authorship, and/or publication of this article: This study was supported by the U.S. Veterans Health Administration (VA) Office of Primary Care (XVA 21-159). Dr. Jacob was partly funded by Career Development Award 19-120 from the VA Health Services Research and Development Service.
Supplemental Material
Supplemental material for this article is available online.
References
Supplementary Material
Please find the following supplemental material available below.
For Open Access articles published under a Creative Commons License, all supplemental material carries the same license as the article it is associated with.
For non-Open Access articles published, all supplemental material carries a non-exclusive license, and permission requests for re-use of supplemental material or any part of supplemental material shall be sent directly to the copyright owner as specified in the copyright notice associated with the article.