
Abstract
Household surveys are an important source of information on medical spending and burden. We examine how recently implemented post-processing improvements to the Current Population Survey Annual Social and Economic Supplement (CPS ASEC) affected estimates of medical expenditures and medical burden. The revised data extraction and imputation procedures mark the second stage of the CPS ASEC redesign and the beginning of a new time series for studying household medical expenditures. Using data for the calendar year 2017, we find that median family medical expenditures are not statistically different from legacy methods; however, updated processing does significantly reduce the percentage of families estimated to have a high medical burden (medical expenses are at least 10% of family income). The updated processing system also changes the characteristics of families with high medical spending and is primarily driven by changes in imputation of health insurance and medical spending.
Household medical expenditures are a significant factor affecting health care utilization and household financial well-being (Banthin et al., 2008; Christopher et al., 2018). While administrative records can be used to ascertain some costs, household surveys are an important source of comprehensive information on premium and nonpremium medical spending, high medical burden (expenses are at least 10% of family income in keeping with prior studies (Hill et al., 2019), and on the demographic and socioeconomic characteristics of the household. The Current Population Survey Annual Social and Economic Supplement (CPS ASEC) is widely used as a source of information on the nation’s health insurance coverage and medical expenditures (Berchick et al., 2019). Since the CPS ASEC introduced three questions on out-of-pocket medical expenditures in 2011, these data have been extensively used to study the affordability of care (Abramowitz & O’Hara, 2015), the effects of Medicaid expansion on out-of-pocket medical expenditures (Abramowitz, 2020), and the role of medical expenses in exacerbating inequality (Christopher et al., 2018).
Recently, the CPS ASEC has completed a two-stage redesign to improve data quality. The first stage, implemented in 2014, redesigned the survey questionnaire to improve reporting of medical expenditures (Janicki, 2014), address under-reporting of health insurance coverage (Klerman et al., 2009; O’Hara, 2009; Pascale et al., 2016), and update questions on income and family relationships (Kreider & Gurrentz, 2019; Semega & Welniak, 2013). The second stage of the redesign, completed in 2019, incorporated improvements to data extraction and imputation tailored to the new questionnaire. Details on the second stage of the redesign are documented elsewhere (Berchick & Jackson, 2022; Jackson & Berchick, 2020; Kreider & Gurrentz, 2019; and Rothbaum, 2019); however, key for the study of medical expenditures, imputation changed from imputing health insurance and medical expenditure information separately and at the individual level to, when possible, imputing health insurance and medical expenditure information jointly and among those eligible to share health insurance coverage.
New Contribution
Previous research has found that the recent processing updates significantly affected estimates of health insurance, increasing the percentage of people covered by any insurance and decreasing the share covered by multiple insurance types (Berchick & Jackson, 2022; Jackson & Berchick, 2020) in the CPS ASEC. A recent brief (State Health Access Data Assistance Center [SHADAC], 2020) suggests that processing updates in the 2018 CPS ASEC led to a lower medical burden overall and for individuals living in families below 400% of the federal poverty guidelines; however, we still need to evaluate changes in median family out-of-pocket medical expenditures, determine which processing updates contributed to changes in medical burden, or ascertain whether the characteristics of the population with high medical burden have also changed. To examine these questions, we compare estimates from calendar year 2017 processed twice: once using prior (“legacy”) procedures and once using redesigned (“updated”) procedures to determine how processing changes affected estimates of medical expenditures, medical burden (defined here as family medical expenses which are at least 10% of income), and the characteristics of the population with high medical burden. We then use a series of linear regression models to identify which aspects of the processing updates led to observed changes.
In so doing, we make two key contributions to existing literature: (a) highlight the improvements made in processing and imputation of medical spending, and (b) identify the post collection processing methods that explain the changes in medical burden within the CPS ASEC.
Data and Method
The CPS ASEC is an annual survey of approximately 68,000 households. The survey collects information on the demographic, social, and economic characteristics of respondents and is the source of official national poverty estimates. For data collected in 2017 and 2018, the Census Bureau released two sets of files based on the same respondent data but processed differently. The first set of files, the 2017 and 2018 CPS ASEC, used existing legacy methods of extracting and imputing data. The second file release for each year, the 2017 CPS ASEC Research File and the 2018 CPS ASEC Bridge File, used updated methods of extracting and imputing data. As files are based on the same respondent interviews, differences between files reflect only changes in data extraction, imputation, and weighting.
While the updated processing system featured changes detailed elsewhere (Berchick & Jackson, 2022; Jackson & Berchick, 2020; Kreider & Gurrentz, 2019; and Rothbaum, 2019), a few of the changes to imputation are particularly salient for considering changes to medical expenditures and medical burden. First, the updated processing system improves the handling of whole unit imputes, the approximately 1 in 5 people (Jackson & Berchick, 2020) for whom no one in the household reports health insurance information. For files processed using the legacy system, these cases had health insurance and medical expenditure information imputed separately and at the individual level. The updated processing system identifies people within a household who are eligible to share insurance and simultaneously imputes their health insurance and medical expenditure information using data from a matched donor health insurance unit (for further description of the imputation method see Jackson & Berchick, 2020). This change improves the joint distribution of family insurance status and medical expenditures by imputing the insurance and medical expenditure data simultaneously for all individuals in a household eligible to share insurance. For example, a health insurance unit imputed to have partial-year insurance coverage would also have the medical expenditures from that donor case. This whole unit imputation is substantial and impacts the majority of cases that have medical expenses imputed.
Second, improvements to the imputation of medical expenditures were made for respondents who had missing medical expenditure data but reported some health insurance information. Under both the legacy and the updated processing systems, cases with missing information are imputed using hotdeck imputation (Andridge & Little, 2010). However, under the updated processing system, people missing health insurance premiums and nonpremium medical expenses had their premium and nonpremium expenses imputed jointly. In so doing, the updated imputation procedures better preserve the correlation between premium and nonpremium spending among cases that have their data imputed.
The updated processing system also improves the imputation of medical expenses for people who have private insurance coverage. Policyholders of employer-sponsored insurance plans have distinct premiums than policyholders purchasing coverage directly. The updated processing system imputed these insurance types separately, and the hotdeck for employer-sponsored insurance considered firm size and employer subsidy (fully, partially, not subsidized) when imputing premium information. Finally, the legacy processing system did not consider a family’s income-to-poverty ratio when imputing medical expenditures. This was an important limitation given that income may constrain the amount families may spend on their medical care (U.S. Census Bureau, 2019). The updated processing system addresses this limitation by including the family income-to-poverty ratio in the hotdeck model. Taken together, these improvements to the imputation of health insurance and medical expenditure data may result in differences in medical expenditures in files processed using the updated processing procedures when compared with files processed using legacy procedures.
Imputation of income was also improved as part of the updated processing system (Berchick & Jackson, 2019). Chief among these changes was the consideration of range information reported when imputing a case’s missing value. Respondents who did not give exact income amounts were asked to give the income range in a follow-up question. Under updated processing, this range value was used when imputing the precise income earned. While this change may sound inconsequential, more than 70% of cases with missing values reported some range information (Rothbaum, 2019). Because the medical burden is calculated as high medical expenses relative to income, changes in income or the income distribution may affect the estimated medical burden.
In sum, the second stage of the CPS ASEC redesign introduced changes to the processing of health insurance, income, and medical expenditures that may have directly and indirectly affected out-of-pocket medical spending as well as the ratio of a family’s medical spending to total income.
Analytic Strategy
We first describe median family medical expenditures, overall, and by family income-to-poverty ratio across files processed using updated and legacy procedures. To understand the burden of medical expenses on family economic well-being, we also examine the percentage of people facing a high burden from medical spending across these two files. Consistent with past analyses, we defined high medical burden as people who have family medical expenditures that are at least 10% of the family’s income (Hill et al., 2019). Next, we compare the characteristics of people with high medical burden across legacy and updated processing. Finally, we quantify which processing system improvements explain the change in medical burden using a series of linear regression models.
The first model is an unadjusted model where a high medical burden is predicted by an indicator of the processing system used. This coefficient represents the total effect of processing on changes to medical burden. The next model adjusts for demographics including age, race, sex, marital status, and education as well as family income-to-poverty ratio We control for demographic characteristics because while there were not statistically significant differences in the level of these characteristics across files, the individuals with these characteristics may have changed across files due to imputation and processing. The third model adds controls for the type of health insurance coverage, including employer-sponsored insurance, direct purchase coverage, Medicaid, Medicare, military coverage, multiple coverage types, and policyholder status, to capture the processing effect net of shifts in demographics, income, and health insurance. To better understand which of the changes in health insurance processing may have contributed to changes in medical burden, in model four, we regress medical burden by whether a case was a whole unit impute, that is, had health insurance and medical expenditure information jointly and at the level of the household unit. Because the new processing system included family income to poverty ratio in the imputation whereas the legacy system did not, we might expect that processing system changes differ by family income to poverty ratio. In a final model, we add an interaction between the updated processing system and family income to poverty ratio to test for differences in the processing system effect by income to poverty levels.
In the main results, we focus on comparisons between legacy and updated processing systems using data from the calendar year 2017. However, as previously mentioned two sets of files were also released for calendar year 2016. In sensitivity analyses, we replicate our models using 2016 data. As an additional robustness check, we run additional regressions defining high medical burden as medical expenses of at least 5% and then 20% of family income.
Results
Table 1 shows CPS ASEC estimates for median family income, median family medical expenditures, and percent of people who face a high medical burden in the calendar year 2017 using the legacy and updated processing systems. Relative to the legacy system, median family income and medical expenditures are statistically unchanged with the updated processing system; however, there is a decrease in the percentage of families with a high medical burden. In total, the percentage of people who face high medical burdens is roughly 1.9 percentage points lower in the updated system, which represents approximately 6 million people in the total population. The second panel of Table 1 shows the difference in the percentage of people with a high medical burden by the family’s federal poverty level (FPL). The results reveal that the magnitude and direction of changes in estimated high medical burden across processing systems differ by FPL. Specifically, people in poverty are 5.6 percentage points less likely to have a high medical burden in the new processing system, while individuals in families at or above 400% of the FPL are 0.7 percentage points more likely to have a high medical burden in the new processing system. Medical burden decreased for individuals living in families below 400% of the federal poverty level and increased for individuals living in families with incomes above this threshold. The final panel also shows that across processing systems there are differences in medical expenditures across poverty levels. Using the updated processing system, median family medical expenditures are significantly lower for all but those individuals living in families with incomes above 400% of the FPL for whom median medical expenditures were US$279 higher.
Median Family Income, Median Family Medical Expenses, and Percent of Individuals With High Medical Burden in 2017, Updated and Legacy Processing Systems.
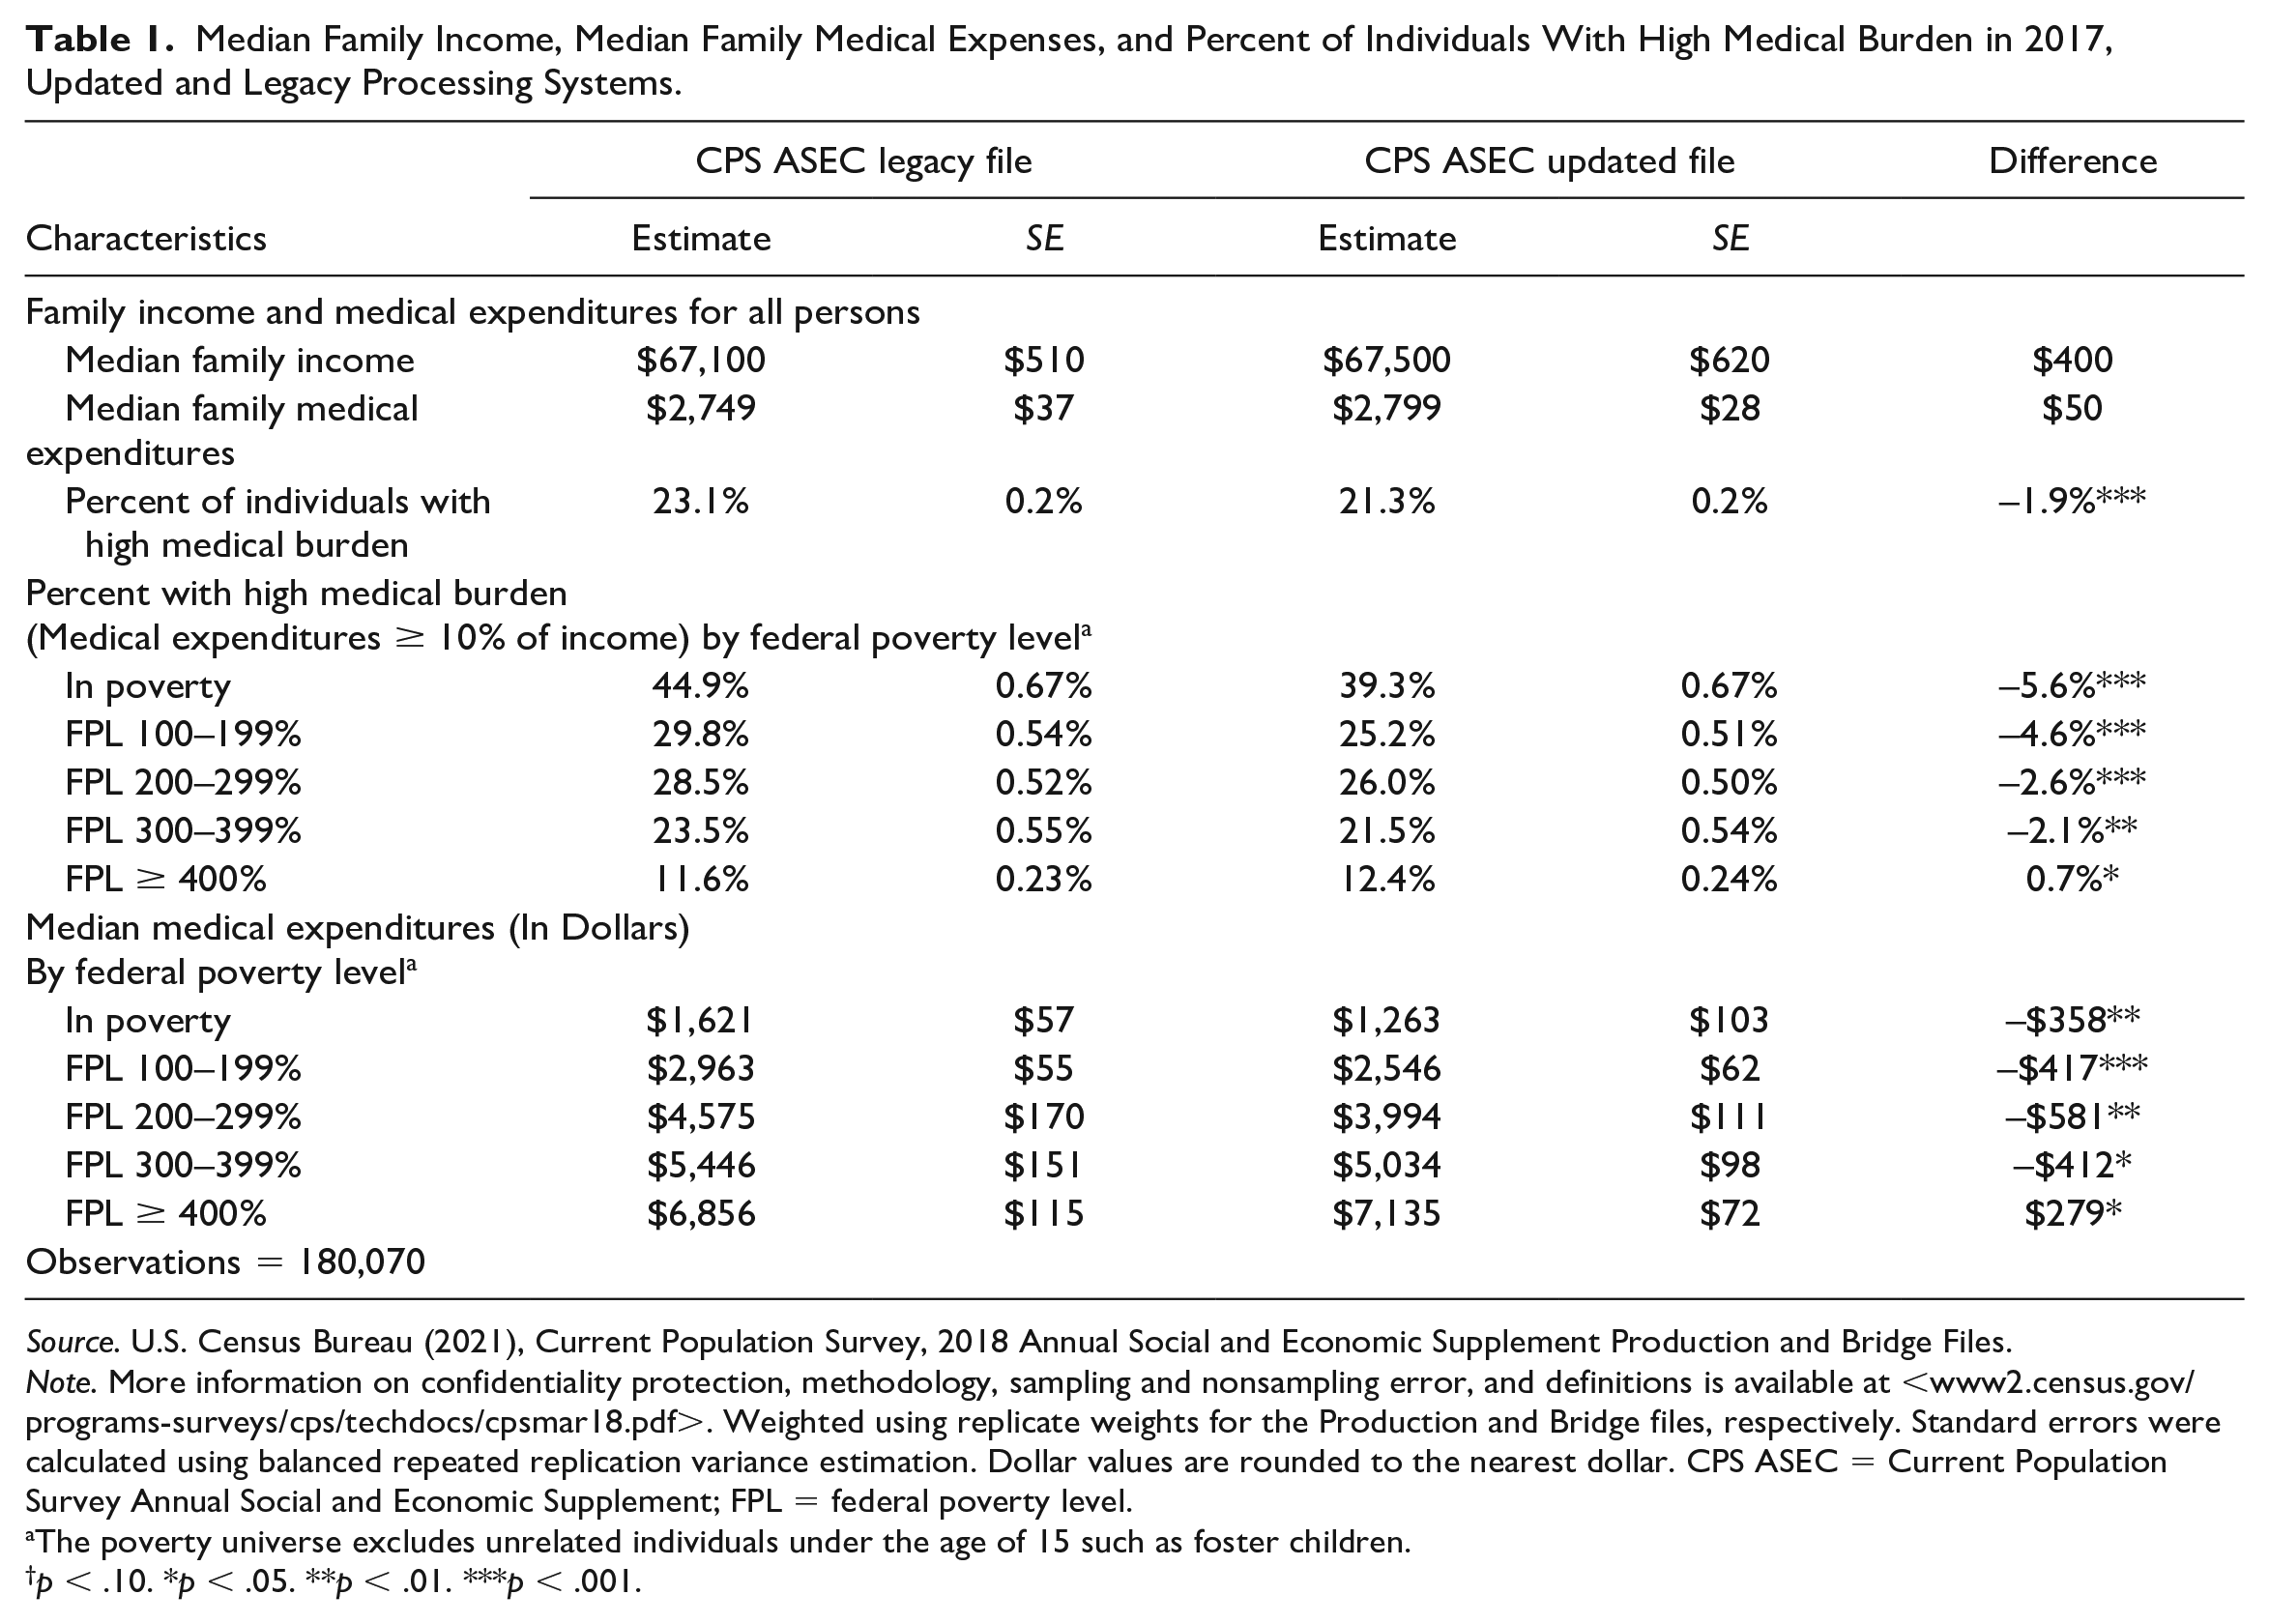
Source. U.S. Census Bureau (2021), Current Population Survey, 2018 Annual Social and Economic Supplement Production and Bridge Files.
Note. More information on confidentiality protection, methodology, sampling and nonsampling error, and definitions is available at <www2.census.gov/programs-surveys/cps/techdocs/cpsmar18.pdf>. Weighted using replicate weights for the Production and Bridge files, respectively. Standard errors were calculated using balanced repeated replication variance estimation. Dollar values are rounded to the nearest dollar. CPS ASEC = Current Population Survey Annual Social and Economic Supplement; FPL = federal poverty level.
The poverty universe excludes unrelated individuals under the age of 15 such as foster children.
p < .10. *p < .05. **p < .01. ***p < .001.
Table 2 shows that several characteristics of the population facing high medical burden also changed across processing systems. Using updated processing, children under the age of 18 made up a smaller share of those with a high medical burden (22.32% vs. 23.09%) whereas adults 65 and older made up a larger share (19.78% vs. 18.99%). The race and ethnic make-up of those with high medical burden also shifted such that people identifying as white made up a larger share of those with high medical burden using the updated processing system (63.34% vs. 61.93%) and people identifying as Hispanic made up a smaller share of those with high medical burden (16.76% vs. 17.66%). Under the updated processing system, those with high medical burden were also more likely to be married relative to legacy procedures (41.27% vs. 39.56%). These changes in the demographic composition of those with high medical burden are particularly noteworthy as there were no significant differences in the age distribution, race ethnic composition, or marital status of people across files. Finally, the share of those with high medical burden changed by health insurance status. People covered by Medicare made up a greater share of those with high medical burden using updated processing (21.87% versus 20.63%), whereas the uninsured, those with military coverage, direct purchase insurance, and people covered by multiple insurance types all made up a smaller share of the population with high medical burden.
Characteristics of People With High Family Medical Burden in 2017 Using the CPS ASEC Legacy and Updated Processing Systems.
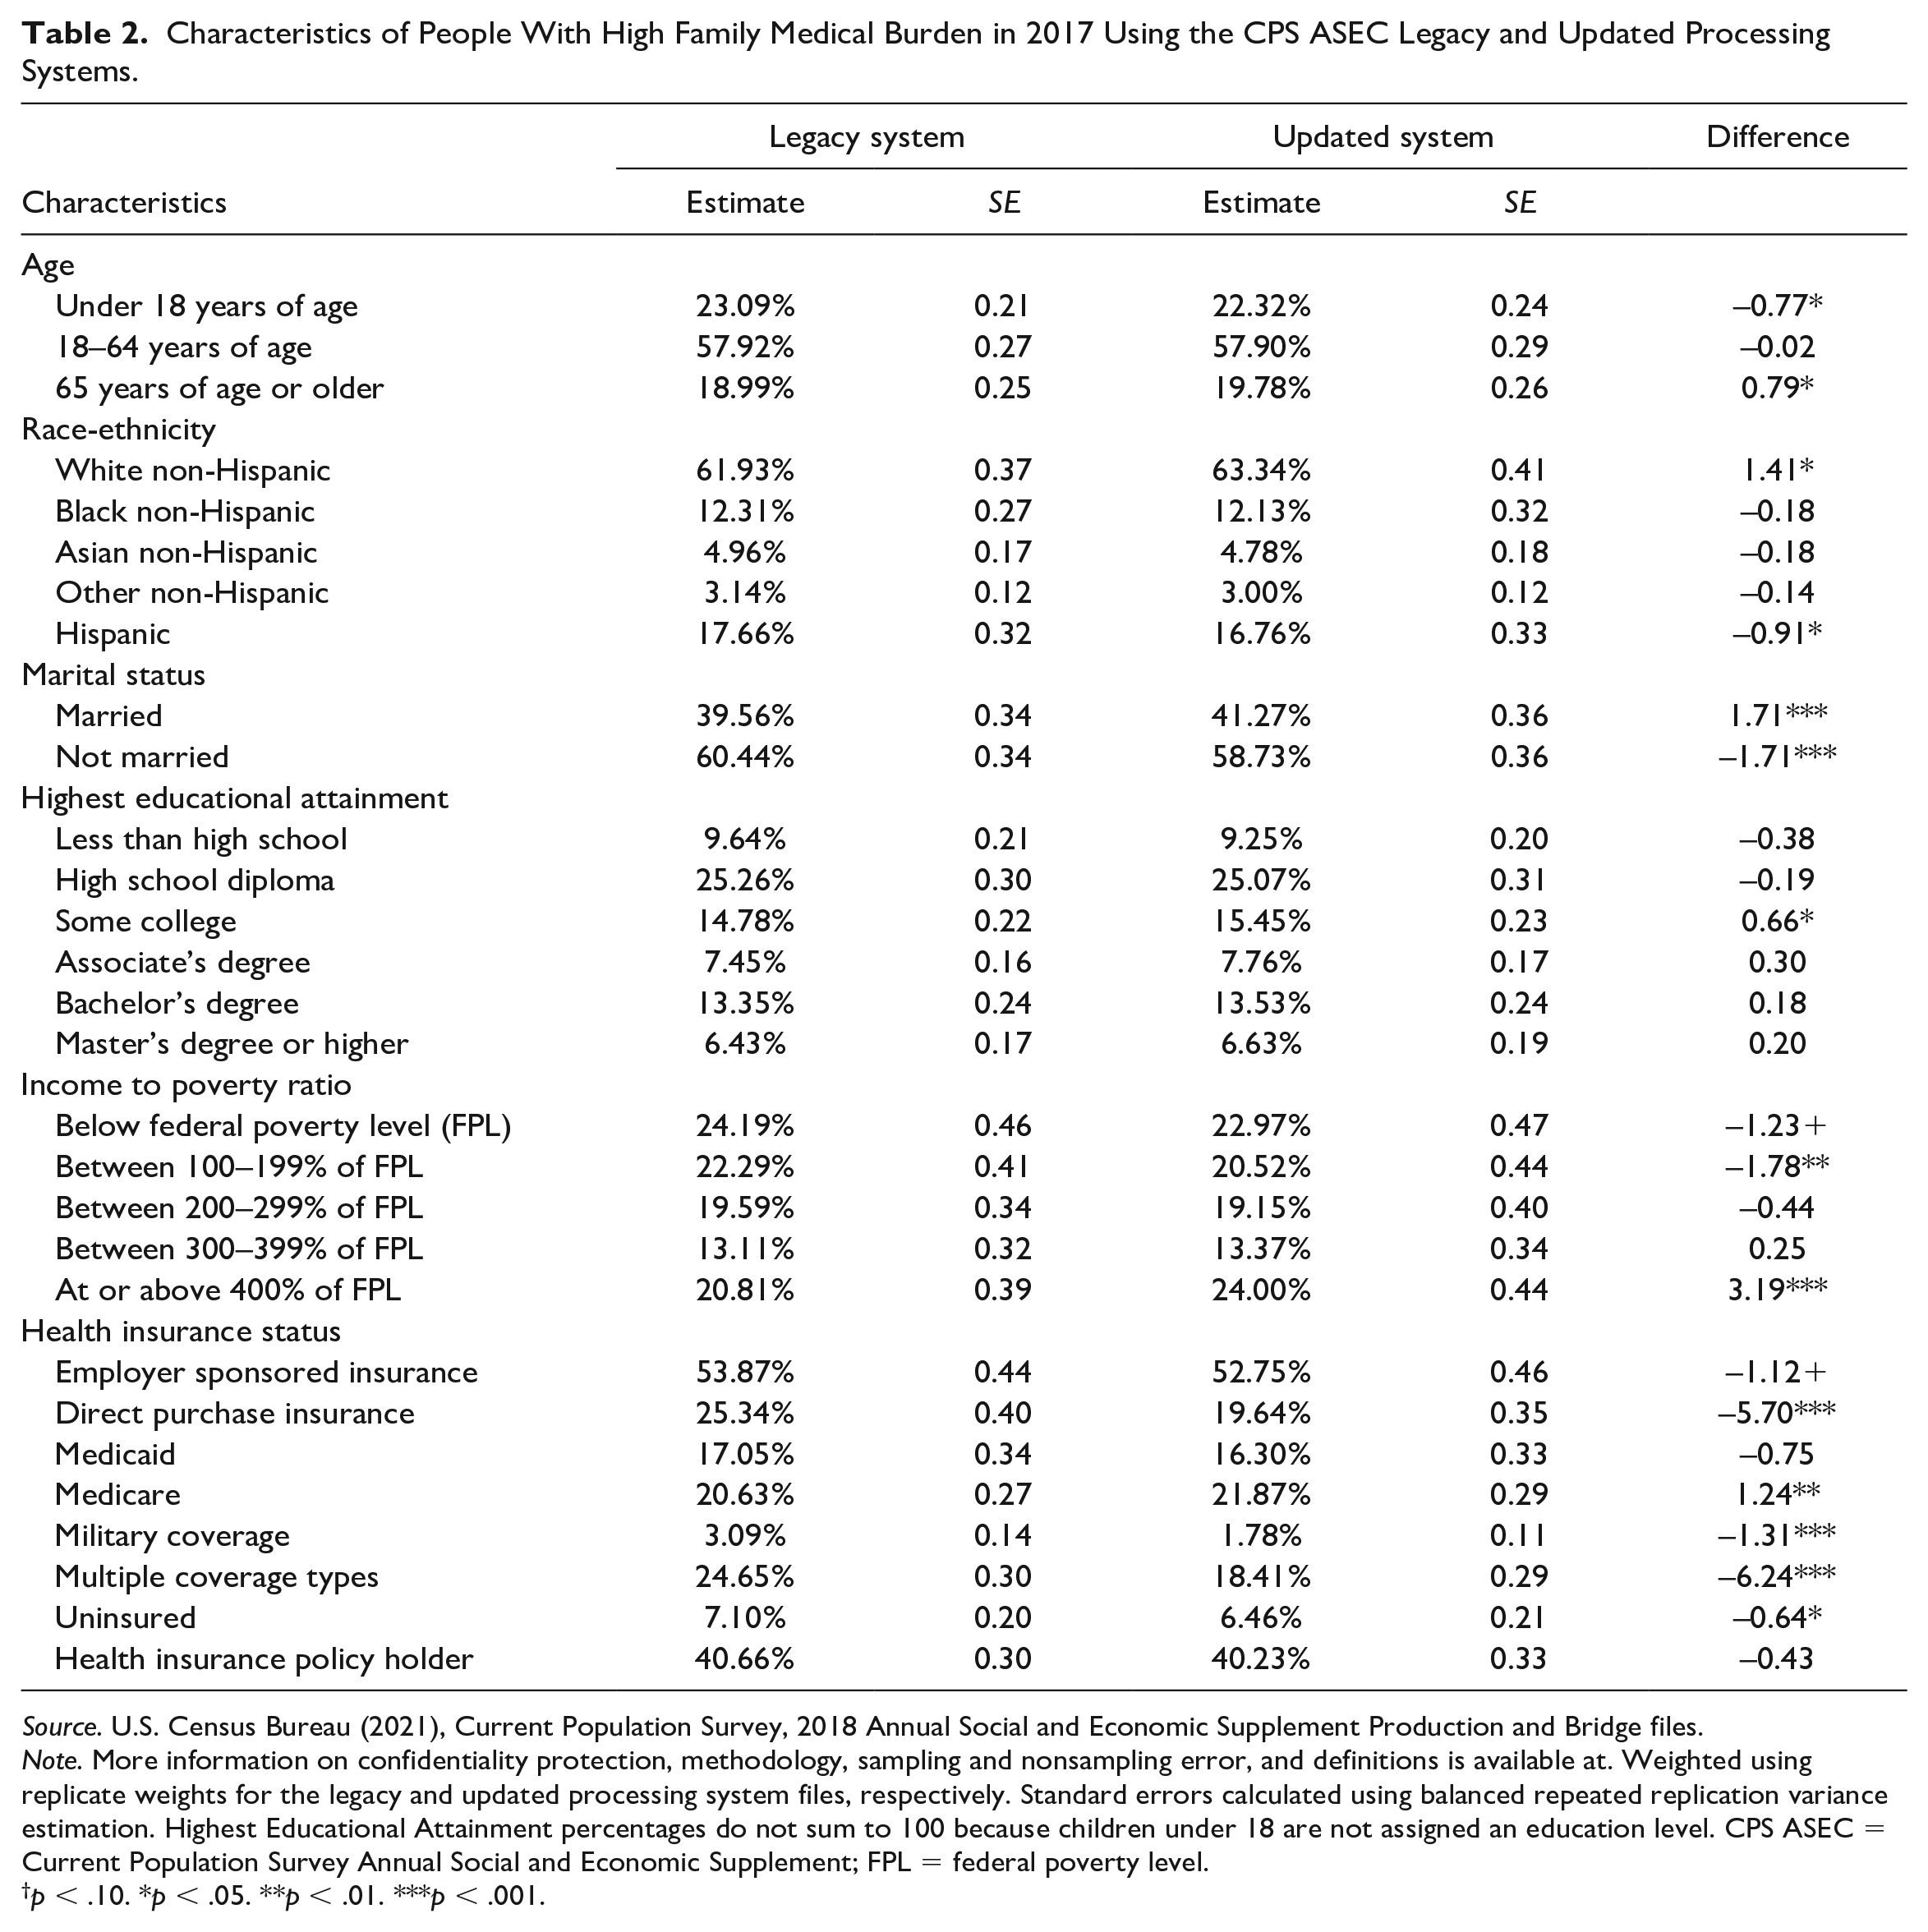
Source. U.S. Census Bureau (2021), Current Population Survey, 2018 Annual Social and Economic Supplement Production and Bridge files.
Note. More information on confidentiality protection, methodology, sampling and nonsampling error, and definitions is available at. Weighted using replicate weights for the legacy and updated processing system files, respectively. Standard errors calculated using balanced repeated replication variance estimation. Highest Educational Attainment percentages do not sum to 100 because children under 18 are not assigned an education level. CPS ASEC = Current Population Survey Annual Social and Economic Supplement; FPL = federal poverty level.
p < .10. *p < .05. **p < .01. ***p < .001.
In Table 3, we examine which factors explain the change in medical burden across processing systems in a series of regression analyses. We find that using a model without controls, the likelihood of experiencing high medical burden differs by 1.9 percentage points between processing systems (Model 1). In Model 2, we show that the point estimate is not statistically different after controlling for demographic characteristics and the income-to-poverty ratio. However, after including controls for type of health insurance coverage in Model 3, the difference between processing systems moves toward zero (–1.1 percentage points). When we include an additional control for individuals processed using whole unit imputation (Model 4), we find that people with whole unit imputation had a higher likelihood of having high medical burden (2.9 percentage points higher) but the interaction between whole unit imputation and processing systems is not statistically significant suggesting that changes in the whole unit imputation do not explain the change in medical burden across files.
Linear Probability Models Examining Probability of High Medical Expenditures in 2017 Using Legacy and Updated Processing Systems.
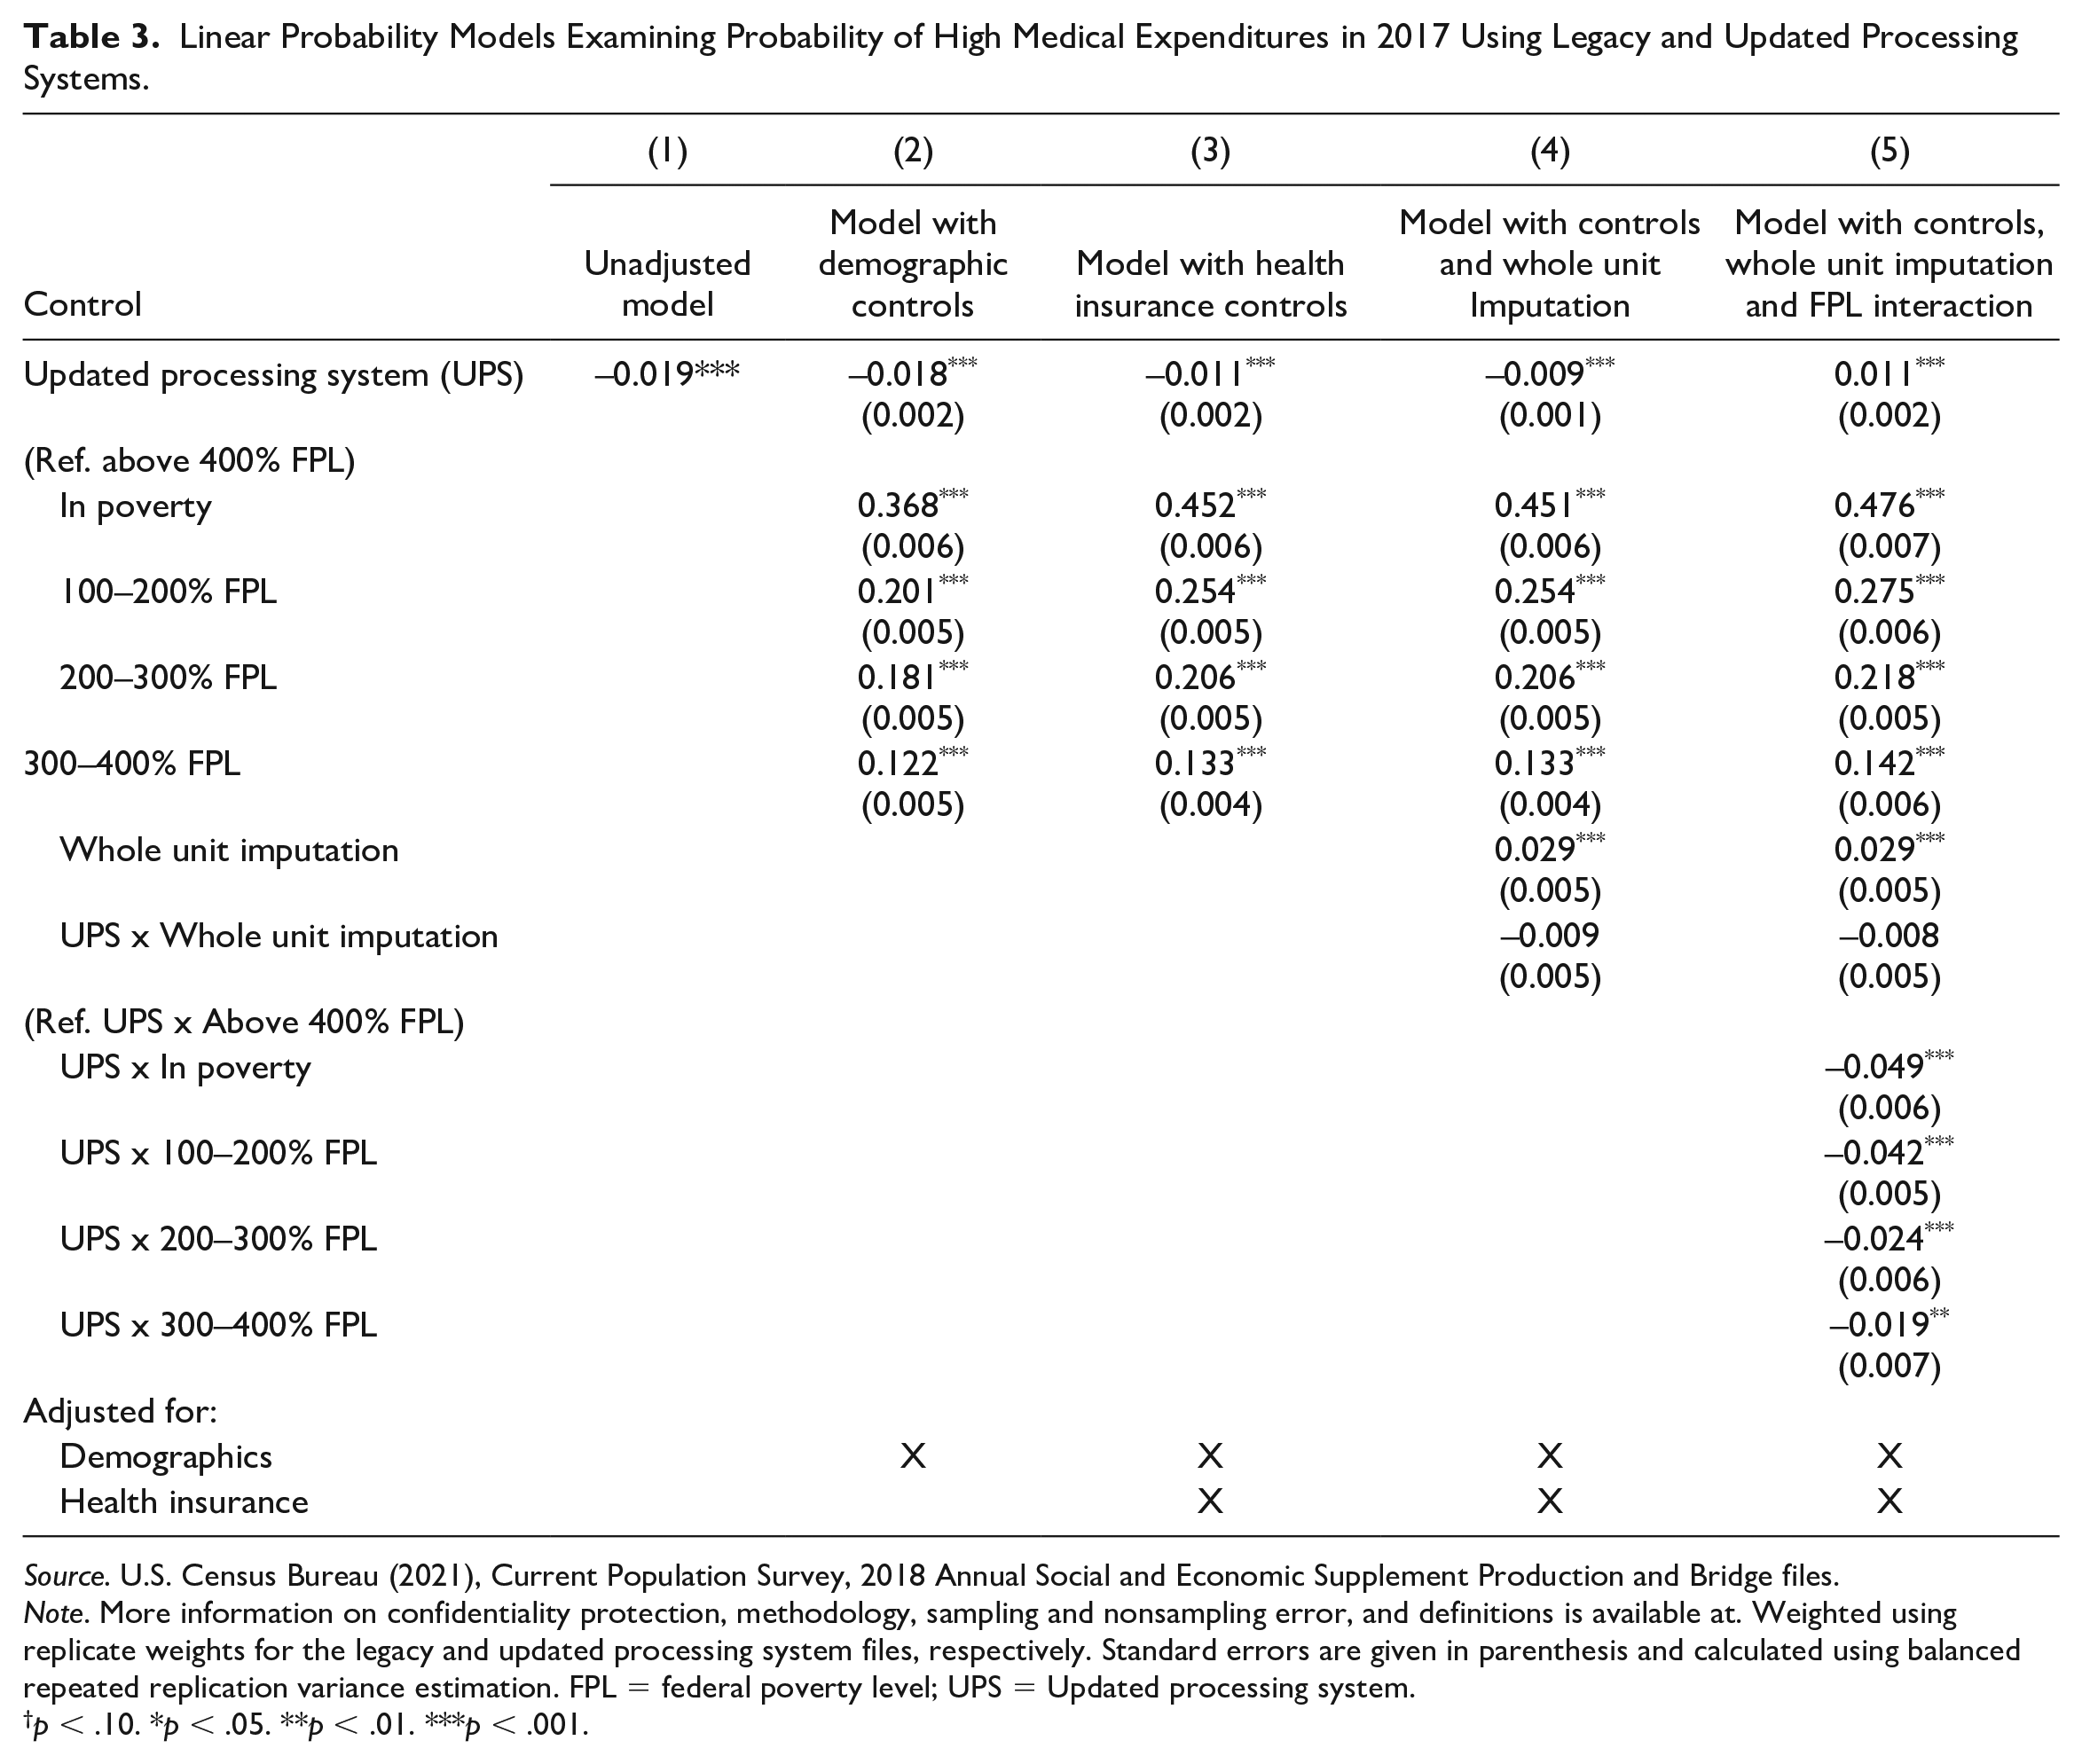
Source. U.S. Census Bureau (2021), Current Population Survey, 2018 Annual Social and Economic Supplement Production and Bridge files.
Note. More information on confidentiality protection, methodology, sampling and nonsampling error, and definitions is available at. Weighted using replicate weights for the legacy and updated processing system files, respectively. Standard errors are given in parenthesis and calculated using balanced repeated replication variance estimation. FPL = federal poverty level; UPS = Updated processing system.
p < .10. *p < .05. **p < .01. ***p < .001.
Because the updated processing system included family income to poverty ratio in the imputation procedures whereas the legacy processing system did not, we might expect that the processing system effect may differ by family’s income to poverty ratio controlling for other changes across files. In our final model (Model 5) which adds the processing system FPL interaction, we confirm these differences. Under updated processing, the probability of having a high medical burden is 1.1 percentage points higher for individuals above 400% of the federal poverty level, but it is 3.8 percentage points lower for individuals below the federal poverty level.
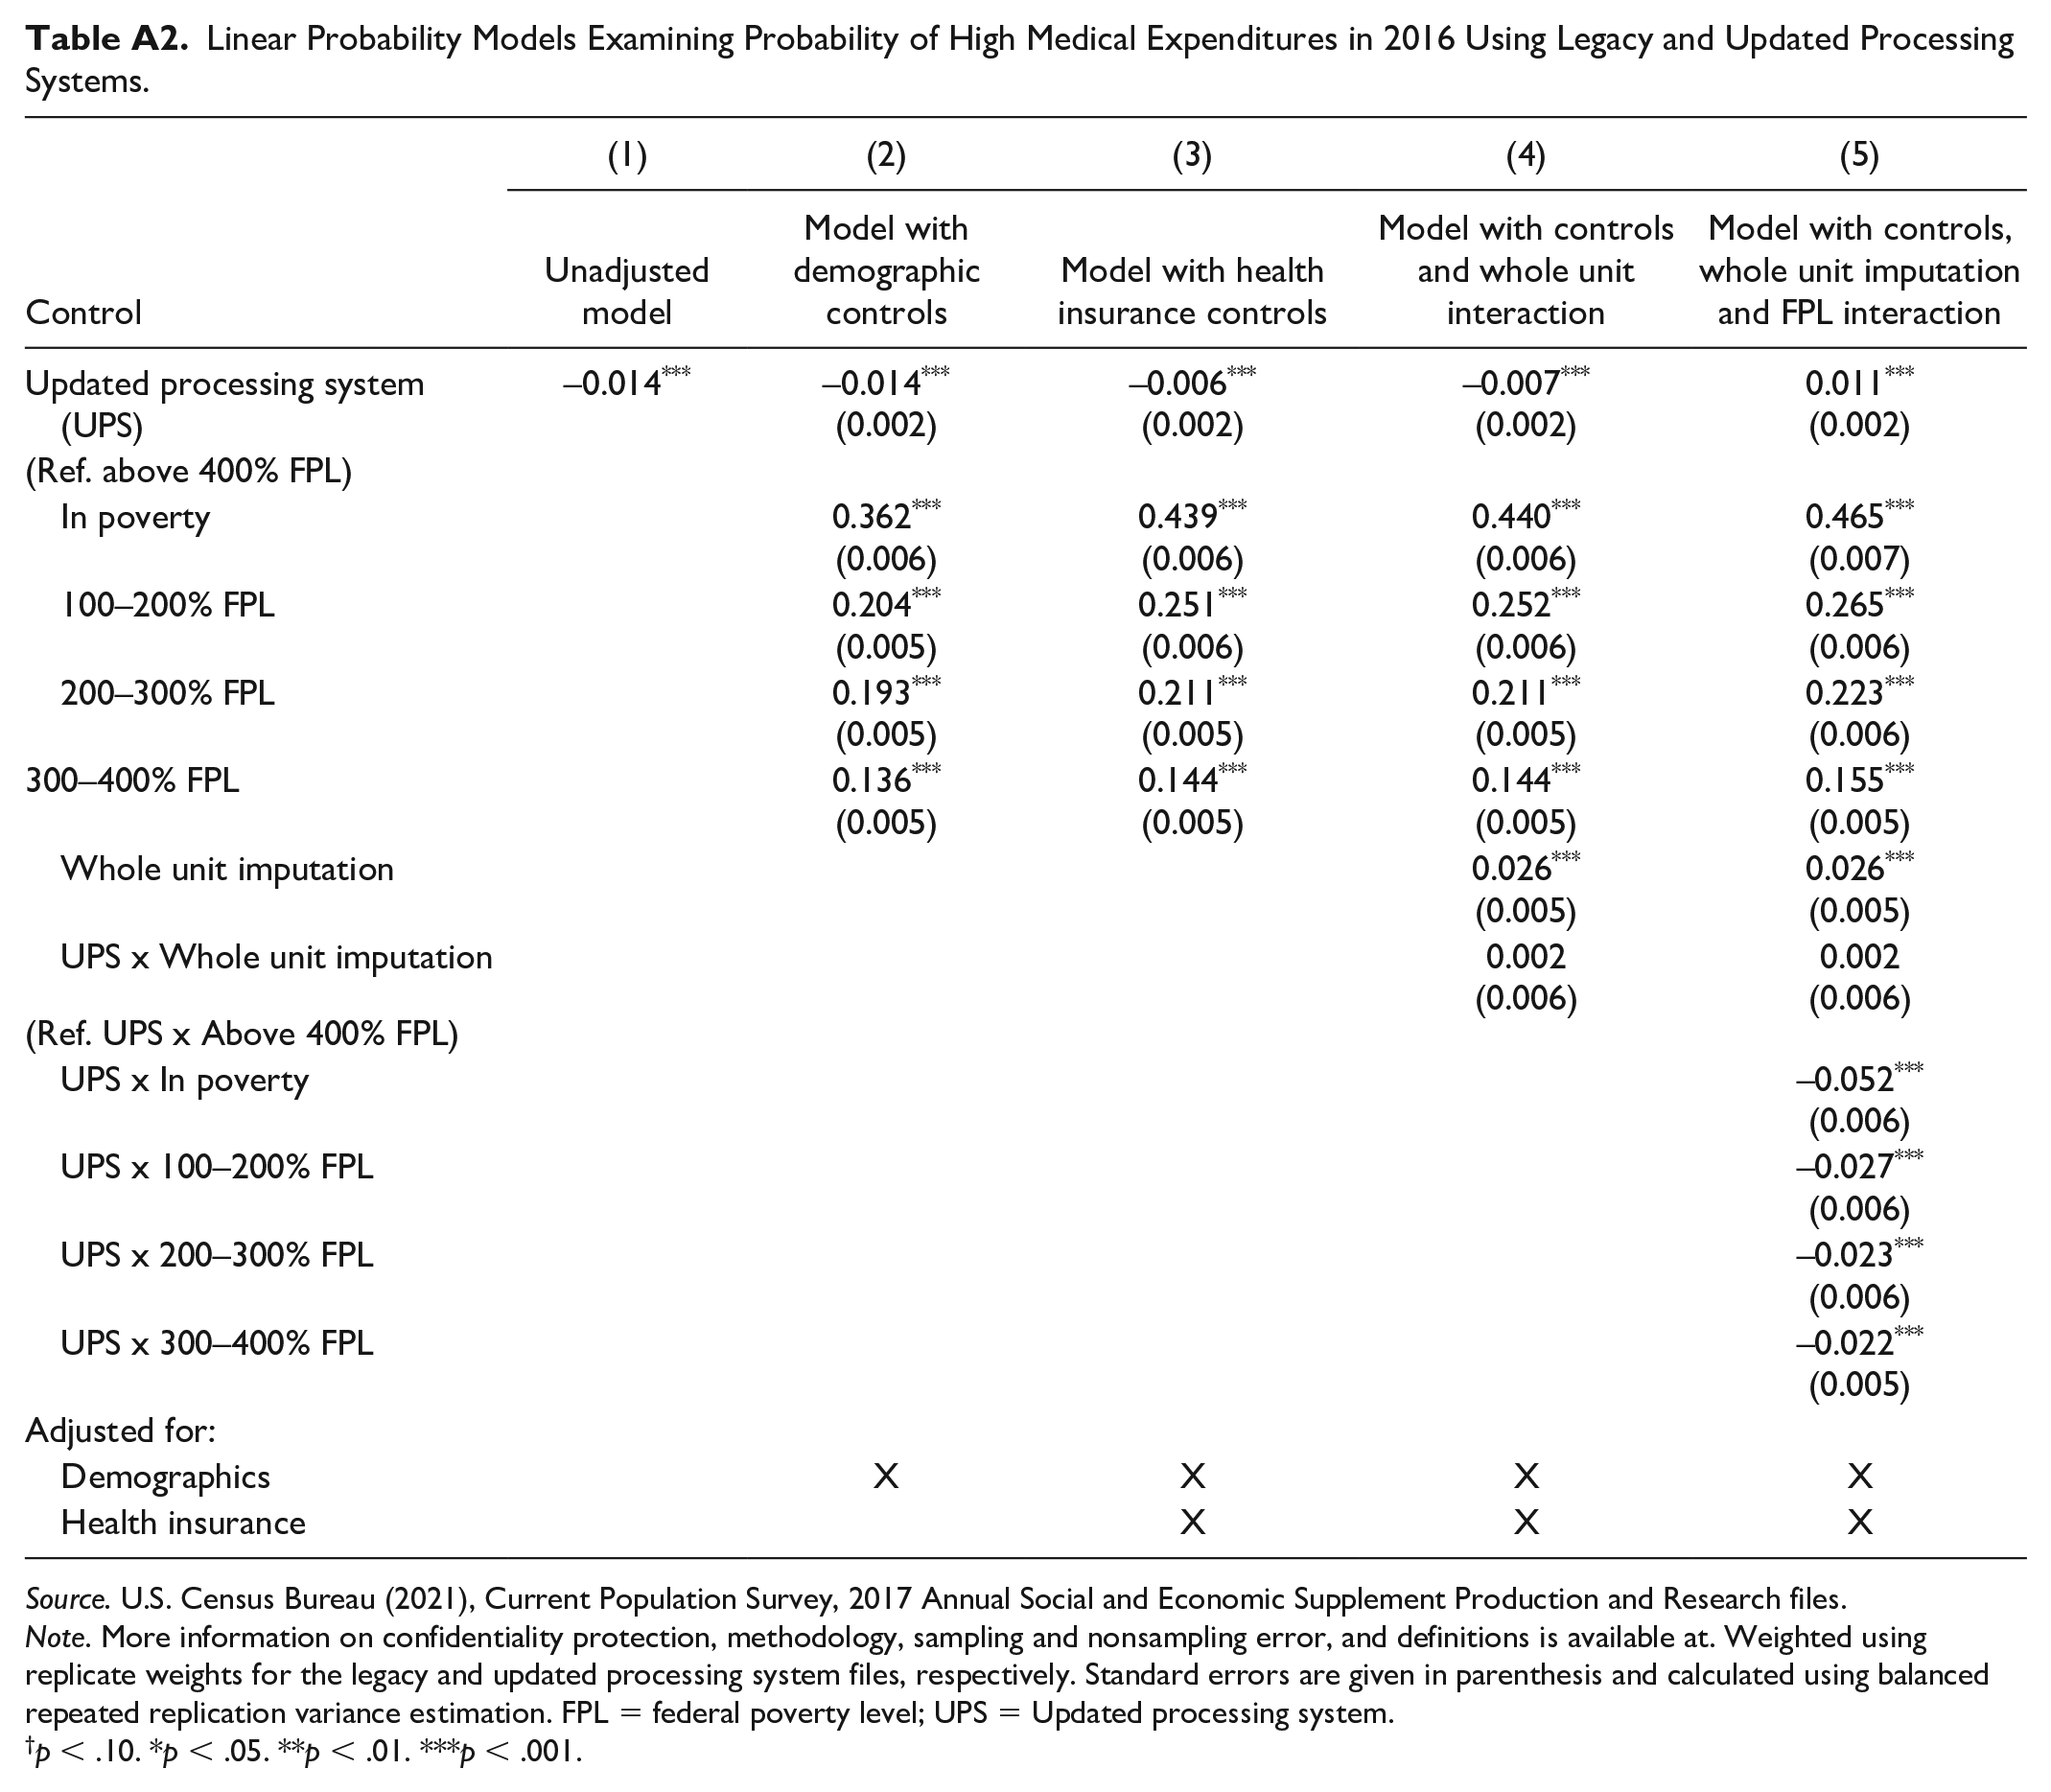
In sensitivity analyses, we show the robustness of our findings by presenting results for our analysis in the calendar year 2016, the only other year for which data using both the old and the new processing systems is available. In Appendix Table A1, we show the change in percentage with high expenditures and family medical spending in each processing system. Again we see a decrease in high medical expenditures and family spending for those below 400% of their FPL, with an increase in medical expenditure and high medical burdens for those above 400% of the FPL. In Table A2, we repeat our regression analyses using the calendar year 2016 data and again find evidence that controls for health insurance explain some of the change in medical burden across processing systems, and the updated processing system is associated with different changes in medical burden by family income to poverty ratio (Model 3).
Finally, in Table B1, we show differences in high medical burden across files with high medical burden alternately defined as 5% or 20% of family income. At both cut-offs for high medical burden, we see that people with family incomes below 400% of the federal poverty level have a lower likelihood of having a high medical burden. People with family incomes at or above 400% of the federal poverty level have a higher likelihood of having a high medical burden at the 5% threshold and no change in medical burden at 20% of family income.
Discussion
The CPS ASEC, an important source of information on health insurance and medical expenditures, completed a two-stage redesign with the aim of improving the quality of income, health insurance, and medical expenditure data. This article found that changes to post-collection data extraction and imputation procedures did not change median medical expenditures but did reduce the share of the population facing a high medical burden by 1.9 percentage points. Consistent with prior work (SHADAC, 2020), changes in medical burden across files varied by family income to poverty levels.
Individuals with family incomes below 100% of the federal poverty level or at 100% to 199% of the FPL made up a smaller share of those facing high medical burdens under the updated processing system whereas people with family incomes above 400% of the federal poverty level made up a greater share of those with high medical burden in the updated system. However, in both files, individuals with incomes below 100% of the FPL had the greatest risk of having a high medical burden defined as medical expenses exceeding 5%, 10%, or 20% of income. One surprising finding is that people without health insurance made up a smaller share of the population with a high medical burden under updated processing; however, this finding is likely explained by the lower uninsured rate in files processed using the updated system (Berchick & Jackson, 2019). It is important to note that not only is the uninsured rate different across files but the probability of being uninsured by race and income also differs by processing (Berchick & Jackson, 2022).
Our regression results suggest two features of the updated processing system explain the observed lower rates of medical burden relative to legacy procedures. First, increases in health insurance coverage and changes in coverage type (Berchick & Jackson, 2022), explain part of the decrease in medical burden across files. Second, conditioning medical expenditure imputation on the family income to poverty ratio appears to be an important driver of differences in the change in medical burden by family income to poverty ratio. The whole unit imputation procedure introduced in the new processing system addressed previously shown bias in the uninsured rate (Davern et al., 2007; Jackson & Berchick, 2020) but does not appear to be related to changes in medical burden conditioning on changes in insurance status. Supplemental analyses run on calendar year 2016 data suggest that the changes in medical burden are not idiosyncratic, but a consistent feature of the new processing system.
Given changes in the level of medical burden and the characteristics of the population facing a high medical burden documented in the CPS ASEC, an important next step will be to compare these findings with other surveys that collect medical expenditure information such as the Medical Expenditure Panel Survey (MEPS), the Survey of Income and Program Participation, and the Consumer Expenditure Surveys. One preliminary analysis (O’Hara & Jackson, 2017) found that the processing improvements in the CPS ASEC increased the average premium paid by policy holders of employer-sponsored insurance plans and brought estimates from the CPS ASEC closer to those obtained from MEPS. However, an extensive cross-survey comparison is needed to examine more recent data and differences in medical burden and not just medical costs. The cross-survey comparison is particularly important as the CPS ASEC is now using the updated processing procedures described in subsequent data releases. As such, the updated processing of medical expenditures marks a new time series for the CPS ASEC medical expenditure data.
Footnotes
Appendix A
Linear Probability Models Examining Probability of High Medical Expenditures in 2016 Using Legacy and Updated Processing Systems.
| (1) | (2) | (3) | (4) | (5) | |
|---|---|---|---|---|---|
| Control | Unadjusted model | Model with demographic controls | Model with health insurance controls | Model with controls and whole unit interaction | Model with controls, whole unit imputation and FPL interaction |
| Updated processing system (UPS) | –0.014 *** | –0.014
***
(0.002) |
–0.006
***
(0.002) |
–0.007
***
(0.002) |
0.011
***
(0.002) |
| (Ref. above 400% FPL) | |||||
| In poverty | 0.362
***
|
0.439
***
|
0.440
***
|
0.465
***
|
|
| 100–200% FPL | 0.204
***
|
0.251
***
|
0.252
***
|
0.265
***
|
|
| 200–300% FPL | 0.193
***
|
0.211
***
|
0.211
***
|
0.223
***
|
|
| 300–400% FPL | 0.136
***
|
0.144
***
|
0.144
***
|
0.155
***
|
|
| Whole unit imputation | 0.026
***
|
0.026
***
|
|||
| UPS x Whole unit imputation | 0.002 |
0.002 |
|||
| (Ref. UPS x Above 400% FPL) | |||||
| UPS x In poverty | –0.052
***
|
||||
| UPS x 100–200% FPL | –0.027
***
|
||||
| UPS x 200–300% FPL | –0.023
***
|
||||
| UPS x 300–400% FPL | –0.022
***
|
||||
| Adjusted for: | |||||
| Demographics | X | X | X | X | |
| Health insurance | X | X | X | ||
Source. U.S. Census Bureau (2021), Current Population Survey, 2017 Annual Social and Economic Supplement Production and Research files.
Note. More information on confidentiality protection, methodology, sampling and nonsampling error, and definitions is available at. Weighted using replicate weights for the legacy and updated processing system files, respectively. Standard errors are given in parenthesis and calculated using balanced repeated replication variance estimation. FPL = federal poverty level; UPS = Updated processing system.
p < .10. *p < .05. **p < .01. ***p < .001.
Appendix B
Median Family Income, Median Family Medical Expenses, and Percentage of Individuals With High Medical Burden in 2017, Updated and Legacy Processing Systems- Alternate Cut offs.

| CPS ASEC legacy file | CPS ASEC updated file | Difference | |||
|---|---|---|---|---|---|
| Characteristics | Estimate | SE | Estimate | SE | |
| Percent with high medical burden (Medical expenditures > 5% of income) by federal poverty level (FPL) a |
|||||
| In poverty | 54.9% | 0.68% | 48.60% | 0.64% | –6.3%*** |
| FPL 100–199% | 45.0% | 0.58% | 41.20% | 0.54% | –3.8%*** |
| FPL 200–299% | 50.6% | 0.62% | 48.50% | 0.63% | –2.1%* |
| FPL 300–399% | 50.1% | 0.62% | 47.90% | 0.62% | –2.2%* |
| FPL ≥ 400% | 34.1% | 0.33% | 36.60% | 0.36% | 2.5%*** |
| Percent with high medical burden (Medical expenditures > 20% of income) by federal poverty level (FPL) a |
|||||
| In poverty | 37.2% | 0.65% | 31.0% | 0.62% | –5.3%*** |
| FPL 100–199% | 14.0% | 0.39% | 10.5% | 0.33% | –3.5%*** |
| FPL 200–299% | 9.3% | 0.35% | 7.4% | 0.30% | –1.9%*** |
| FPL 300–399% | 6.0% | 0.32% | 5.0% | 0.27% | –1.0%* |
| FPL ≥ 400% | 2.1% | 0.11% | 2.3% | 0.13% | 0.2% |
| Observations = 180,070 | |||||
Source. U.S. Census Bureau (2021), Current Population Survey, 2018 Annual Social and Economic Supplement Production and Bridge Files.
Note. More information on confidentiality protection, methodology, sampling and nonsampling error, and definitions is available at. Weighted using replicate weights for the Production and Bridge files, respectively. Standard errors calculated using balanced repeated replication variance estimation. Dollar values rounded to the nearest dollar. CPS ASEC = Current Population Survey Annual Social and Economic Supplement; FPL = federal poverty level.
p < .10. *p < .05. **p < .01. ***p < .001.
The poverty universe excludes unrelated individuals under the age of 15 such as foster children
Acknowledgements
The authors thank Laryssa Mykyta, Sharon Stern, Liana Fox, Katrina Crankshaw, and Susan Walsh for their careful review of this paper.
Authors’ Note
Any opinions and conclusions expressed herein are those of the author(s) and do not reflect the views of the U.S. Census Bureau. More information on confidentiality protection, methodology, sampling and nonsampling error, and definitions is available at <![]() >. The Census Bureau has reviewed this data product to ensure appropriate access, use, and disclosure avoidance protection of the confidential source data used to produce this product. DMS Number: D-0000009330; DRB Number: CBDRB-FY23-POP001-0006. This paper uses Current Population Survey, Annual Social and Economic Supplement 2018 Production and Bridge files and 2017 Production and Research files.
>. The Census Bureau has reviewed this data product to ensure appropriate access, use, and disclosure avoidance protection of the confidential source data used to produce this product. DMS Number: D-0000009330; DRB Number: CBDRB-FY23-POP001-0006. This paper uses Current Population Survey, Annual Social and Economic Supplement 2018 Production and Bridge files and 2017 Production and Research files.
Declaration of Conflicting Interests
The author(s) declared no potential conflicts of interest with respect to the research, authorship, and/or publication of this article.
Funding
The author(s) disclosed receipt of the following financial support for the research, authorship, and/or publication of this article: H.J. gratefully acknowledges support from the Eunice Kennedy Shriver National Center for Child Health and Human Development grant P2C-HD041041, Maryland Population Research Center.