
Abstract
Medicare Advantage (MA) plans increase their risk-adjusted payments through intensive coding in health risk assessments (HRAs) and chart reviews. Whether the additional diagnoses from HRAs and chart reviews are associated with increased resource use is not known. Using national MA encounter data (2016–2019), we examine the relative contributions of three health risk scores to MA resource use: the base risk score that excludes diagnoses from HRAs and chart reviews; the incremental score added to the base score from diagnoses in HRAs; and the incremental score added from diagnoses in chart reviews. We find that the incremental risk scores explain 53.4%-63.9% of resource use relative to the base risk score effect—that is, 36.1% to 46.6% of the incremental risk scores are not accompanied by increased resource use. While HRAs and chart reviews contribute to more complete coding of diagnoses, they are sources of intensive coding not accompanied by resource use.
Background
Medicare Advantage (MA) is a private alternative to Traditional Medicare (TM). Almost half of Medicare beneficiaries were enrolled in MA in 2022. Federal spending on MA was projected to reach US$427 billion in 2022 (Congressional Budget Office [CBO], 2022). MA is expected to cover 57% of the Medicare population by 2032, with federal spending of US$853 billion (CBO, 2022). It is thus becoming the dominant source of coverage for Medicare beneficiaries.
As MA grows, it is important to ensure that MA plans do not engage in undesirable activities that increase federal spending. However, a concern has been growing that MA plans intensively code their enrollees’ diagnoses to increase risk-adjusted payments (Medicare Payment Advisory Commission [MedPAC], 2023). The media has highlighted anecdotes of providers’ recording some diagnoses that are not accompanied by any treatments for MA enrollees (Abelson & Sanger-Katz, 2022), and more intensive coding by some MA plans has come under scrutiny (Centers for Medicare and Medicaid Services [CMS], 2017; Freidin Brown, 2018).
Medicare pays MA plans per-capita rates, adjusted for patients’ health risks to discourage MA plans from selecting healthy beneficiaries. The current risk adjustment formula uses Hierarchical Condition Category (HCC) scores that represent each beneficiary’s expected Medicare spending relative to the national TM average. The HCC score equals 1.0 for the average beneficiary in TM, while scores other than 1.0 indicate the degree of deviation from the average expected spending. For example, an HCC score of 1.2 means that the beneficiary’s expected spending is 20% higher than the national TM average. To compute HCC scores, the CMS risk model maps diagnoses from inpatient and outpatient records into 79 conditions. It estimates a weight for each condition using data from TM beneficiaries, and it uses the weights to construct HCC scores for MA enrollees. Each year, CMS publishes the mapping of diagnoses and the weights for the HCC conditions (CMS, n.d.).
Because HCC scores determine risk-adjusted payments, MA plans have an incentive to code as many diagnoses as possible to increase enrollees’ risk scores. This incentive for intensive coding can have positive functions; for example, MA plans may identify enrollee conditions that otherwise would be missed, so they can provide care to manage those conditions. However, because the CMS risk model uses TM data, it incentivizes MA plans to make their enrollees with the same expected spending as TM beneficiaries look sicker (Newhouse, 2021). MA plans may game the risk-adjustment system by adding diagnoses that are not accompanied by increased resource use.
The Office of Inspector General (OIG; 2019, 2020) has explained that MA plans use health risk assessments (HRAs) and chart reviews to establish additional diagnoses. Providers administer HRAs to collect information on patients’ health status and risk factors, which they can use to improve care management. Both TM and MA use health risk assessments, usually performing them during annual wellness visits or nurses’ home visits (Online Appendix A lists codes for HRAs). MA plans can hire third-party vendors to conduct HRAs during visits to enrollees’ homes. Only MA plans use chart reviews to supplement diagnoses that were not originally included in base records submitted by providers. Diagnoses from HRAs and chart reviews are mapped to the risk model in the same way as diagnoses from base encounter records (before considering diagnoses from HRAs or chart reviews). In other words, HCC scores are independent of the diagnosis source, and thus, any incremental scores due to diagnoses from additional sources should predict resource use to the same degree as the base score.
Prior work calculated the additional MA payments due to intensive coding in HRAs or chart reviews. Meyers and Trivedi (2021) estimated that the payment due to diagnoses added by chart reviews was US$2.3 billion in 2015. The OIG (2019, 2020) estimated that diagnoses recorded only in HRAs or chart reviews resulted in MA payments of US$9.4 billion in 2017. It is not known whether these payments are all due to diagnoses that do not increase service utilization. Some MA plans may actively manage diagnoses identified from HRAs or chart reviews, resulting in service use and improved care. Adding those diagnoses is consistent with the intention of risk adjustment to compensate plans for treating higher risk patients. Whether and how much diagnoses from HRAs and chart reviews are accompanied by increased service utilization has yet to be explored.
We answer this question by examining the association between diagnoses from HRAs and chart reviews with resource use in MA. Specifically, we analyze the extent to which diagnoses added by HRAs and chart reviews explain MA enrollees’ resource use, relative to diagnoses in base encounter records. Using 2016–2019 national MA encounter data, we find that the incremental risk scores explained 53.5%-64.5% of resource use relative to the base risk score effect—that is, 36.1%-46.6% of the incremental risk scores were not accompanied by increased resource use.
New Contributions
The existing work has established that HRAs and chart reviews are mechanisms by which MA plans engage in intensive coding (Meyers & Trivedi, 2021; OIG, 2019, 2020). It has documented payments related to intensive coding in those sources; however, it has not decomposed those payments into portions that are accompanied by service use and that are not. Distinguishing these two types of intensive coding requires information on resource use for MA enrollees. Using recently released MA encounter data, we decompose intensive coding through HRAs and chart reviews into portions that explain resource use and that do not. This helps us understand the degree to which MA plans may be gaming the risk adjustment by adding diagnoses from HRAs and chart reviews that are not associated with increased resource use.
Method
Study Population
The study population is a random 50% sample of enrollees from MA contracts with highly complete encounter data (described below). We require enrollees to reside in the 50 states or D.C., have continuous Parts A, B, and D coverage during the year, and not have end-stage renal disease.
Data
The primary data sources are 2015–2019 MA encounter data for inpatient care, outpatient facility services, and professional services. We use the 2015 data only to construct 2016 HCC scores, which are based on diagnoses in prior-year claims.
MA encounter data from the study period have some missing records (Jung et al., 2022; MedPAC, 2019). Following prior work, we assess the completeness of the data and select MA contracts that submitted highly complete data (Jung et al., 2022). We identify 810 (59% of 1,379) contract years with highly complete data and at least 2,500 enrollees—a requirement that ensures the estimates of data completeness are reliable.
Medicare Beneficiary Summary Files supply information on MA enrollment and patient demographics. We obtain area-level variables from American Community Survey data and the Area Health Resource File.
Outcome
The study outcome is “resource use” (price-standardized utilization) per beneficiary per month. Because MA encounter data lack proprietary payment information, we measure resource use by applying standardized prices to services provided to enrollees. We combine the utilization of different types of services to create a global measure of service use in dollars. Because we normalize service prices across MA plans, all differences in resource use are attributable to changes in service utilization.
Following prior work, we use Traditional Medicare payments as the standardized prices (Jung et al., 2022). Categories of services in resource use are inpatient facility services, outpatient facility services, and professional services (physician services, Part B drugs, clinical laboratory services, anesthesia, ambulance services, and durable medical equipment). We do not include skilled nursing facility and home health services because MA encounter data for those services have many missing records (MedPAC, 2019). We do not include hospice services because those services are compensated outside the risk-adjusted payment method.
We obtain total resource use by summing up resource use for the categories of services above. We express resource use in 2019 dollars by adjusting for the consumer price index.
HCC Scores
We construct enrollees’ HCC scores following the algorithm published each year by CMS (n.d.). We create a base risk score (
We calculate
Analysis
We examine the association between the incremental HCC scores and resource use by estimating:
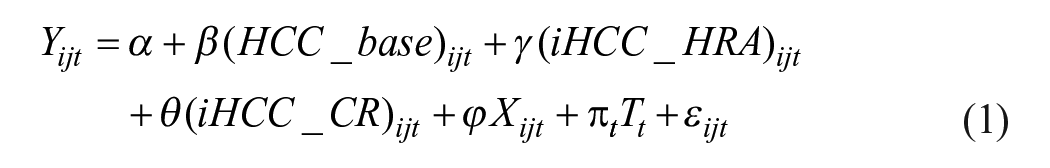
Subscripts
The coefficient
The covariates (
We estimate Equation 1 using the Generalized Linear Model (GLM) with a log link to account for the skewed distribution of resource use. For comparison, we estimate the equation as a linear regression. Standard errors are clustered within MA contracts in all equations.
Separate Analyses
First, we perform separate analyses by year to examine trends in intensive coding through HRAs and chart reviews and the degree of coding that does not explain resource use.
Second, we examine variation in the extent to which intensive coding through HRAs and chart reviews explains resource use across MA contracts. Some MA contracts rely heavily on HRAs and chart reviews to add diagnoses, substantially increasing the average HCC scores of their enrollees (Meyers & Trivedi, 2021; OIG, 2021). A larger share of added diagnoses in these contracts may be accompanied by a smaller increase in resource use. To examine this, we estimate Equation 1 separately for each incremental risk quintile. We use the sum of the two incremental risk scores to divide contracts into risk quintile groups.
Finally, we estimate the resource use model separately by plan type: Health Maintenance Organizations (HMOs) and Preferred Provider Organizations (PPOs). Provider payment systems usually differ between HMOs and PPOs, leading to different incentives for intensive coding.
Results
The study sample includes 24,332,773 enrollee years. The mean age is 72.7 years, and the female share is 57% (Table 1).
Characteristics of the Study Sample.
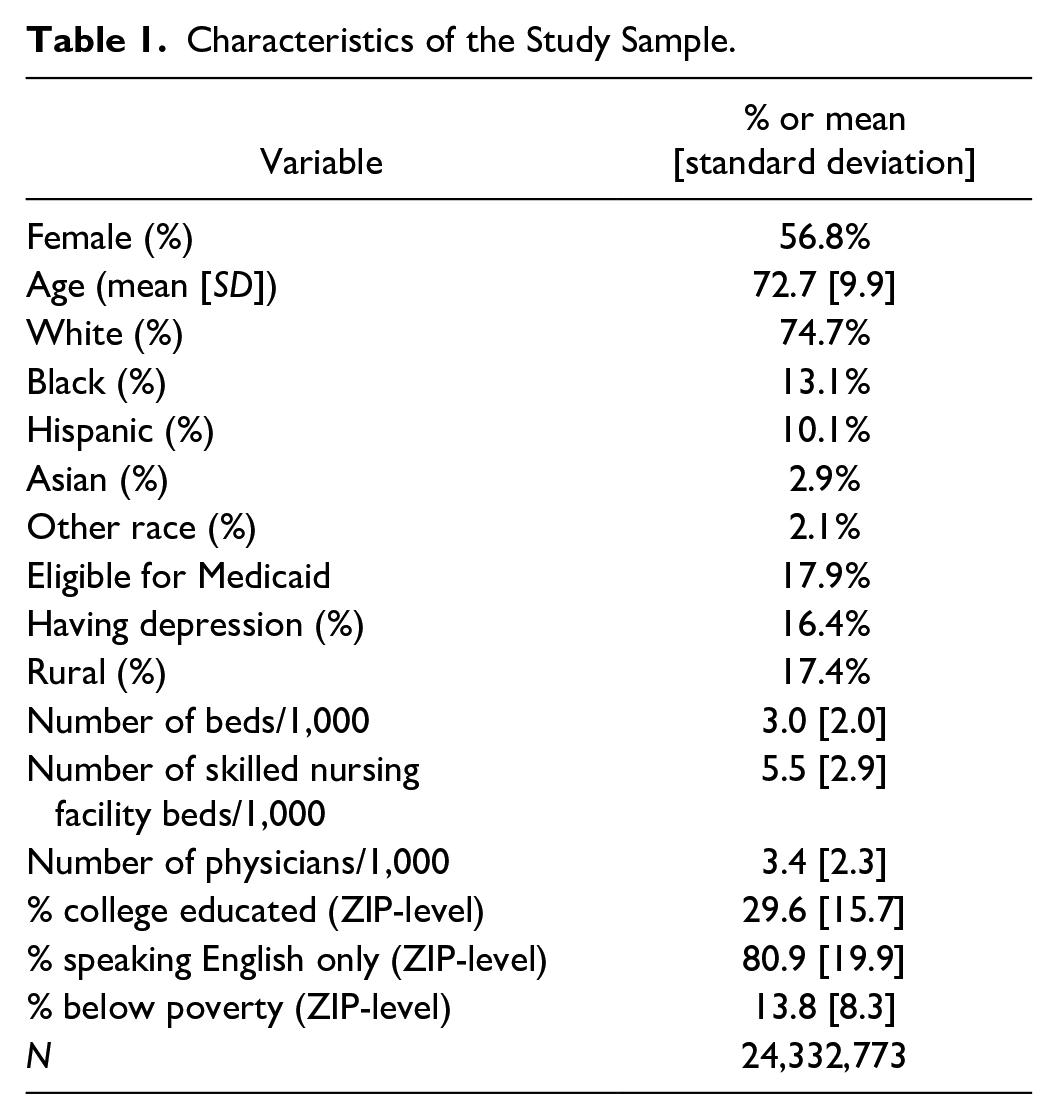
Table 2 shows that additional diagnoses on HRAs increased the average risk score by 0.043 units (3.8% of the base score), and diagnoses only on chart reviews increased the score by an additional 0.062 units (5.6%). The regression results (Column B) indicate that a one-unit increase in the base risk score increases resource use by US$709. However, resource use increases by only US$379 per unit of the incremental score from HRAs and by US$
Relation Between Risk Score and Resource Use by Source of Diagnoses.
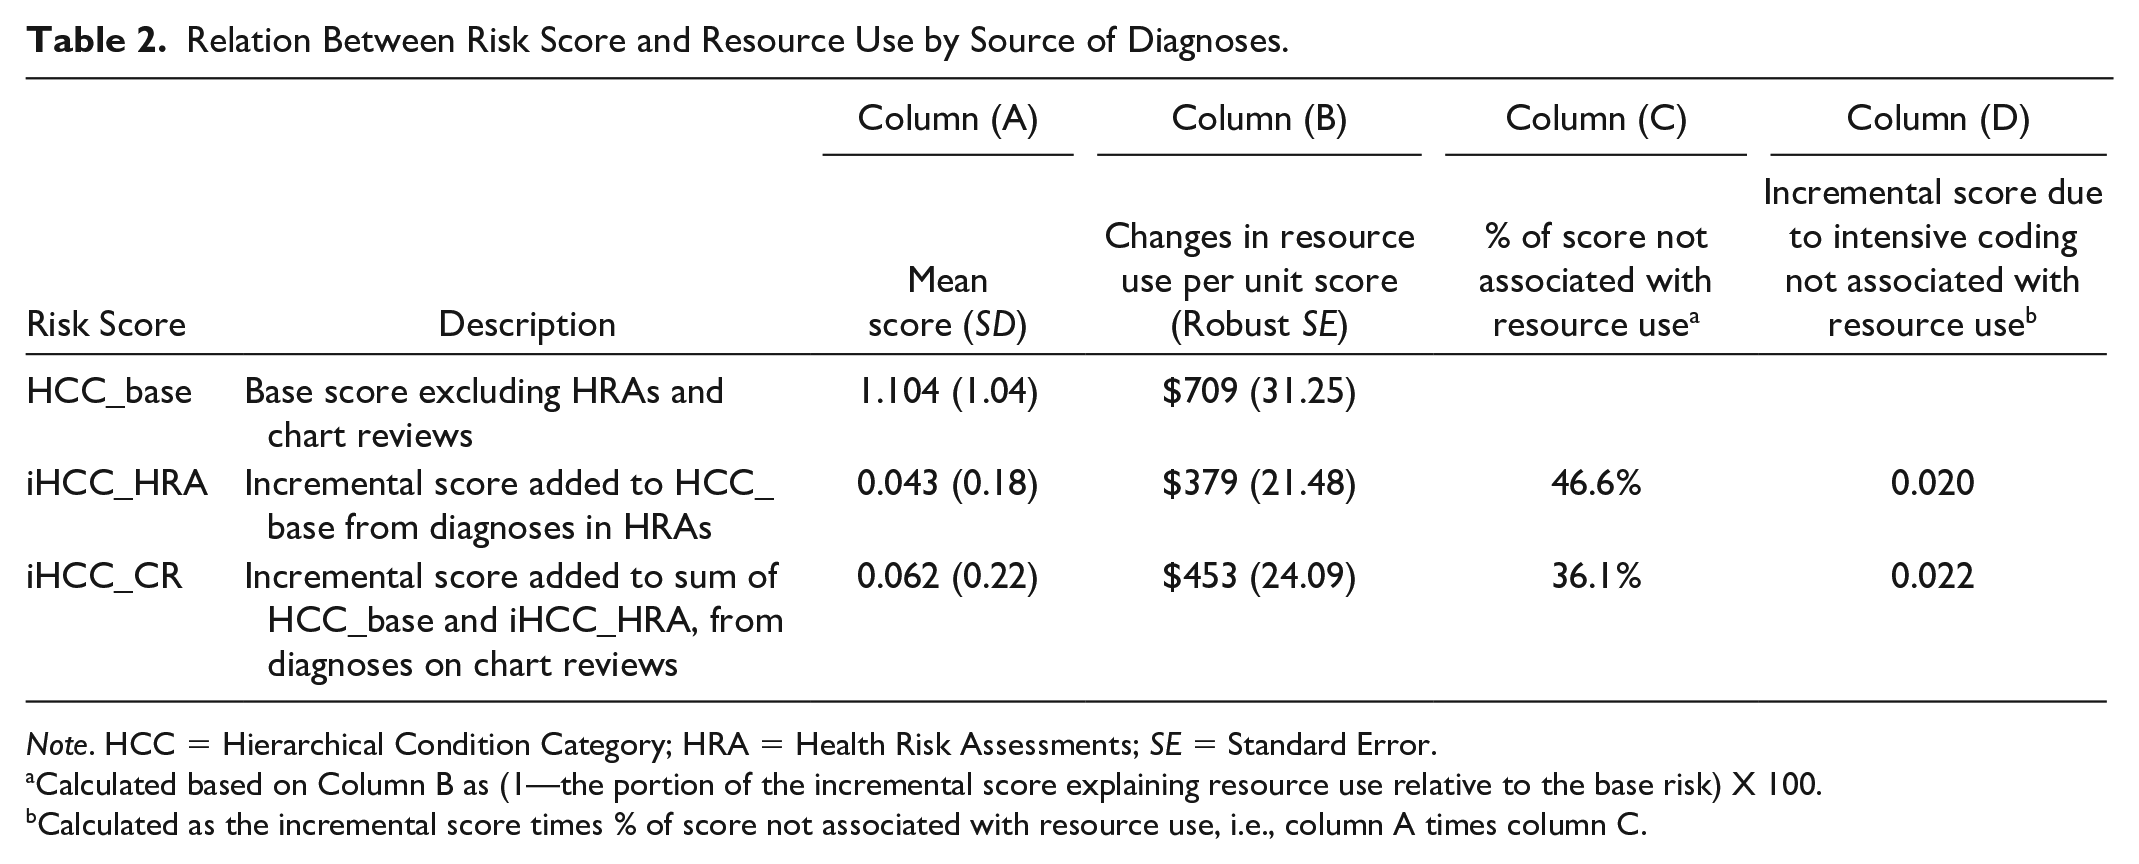
Note. HCC = Hierarchical Condition Category; HRA = Health Risk Assessments; SE = Standard Error.
Calculated based on Column B as (1—the portion of the incremental score explaining resource use relative to the base risk) X 100.
Calculated as the incremental score times % of score not associated with resource use, i.e., column A times column C.
The results from the regressions excluding patient characteristics (age, sex, and dual status) or area factors were very similar to the primary analysis (Online Appendix Table A1). The linear regression produced larger estimates of the portions of the incremental scores not associated with resource use than GLM (Online Appendix Table A1), indicating the primary estimates above are conservative.
Results from Separate Analyses
Table 3 reports results from separate analyses by year. The table shows that coding in HRAs and chart reviews became more intensive over time (Panel A in Table 3). Diagnoses only on HRAs increased the average risk score by 0.034 units (3.3% of the base score) in 2016 but by 0.045 units (3.9%) in 2019, and diagnoses only on chart reviews increased the average score by an additional 0.056 units (5.4%) in 2016 but by 0.071 units in 2019 (6.2%). More importantly, the contribution of the incremental scores to resource use relative to the base risk effect decreased over time. Thus, the percentage of the incremental scores not associated with resource use increased from 42.2% in 2016 to 50.1% in 2019 for HRAs and from 32.6% to 39.2% for chart reviews (Panel C in Table 3).
Relation Between Risk Score and Resource Use by Year.
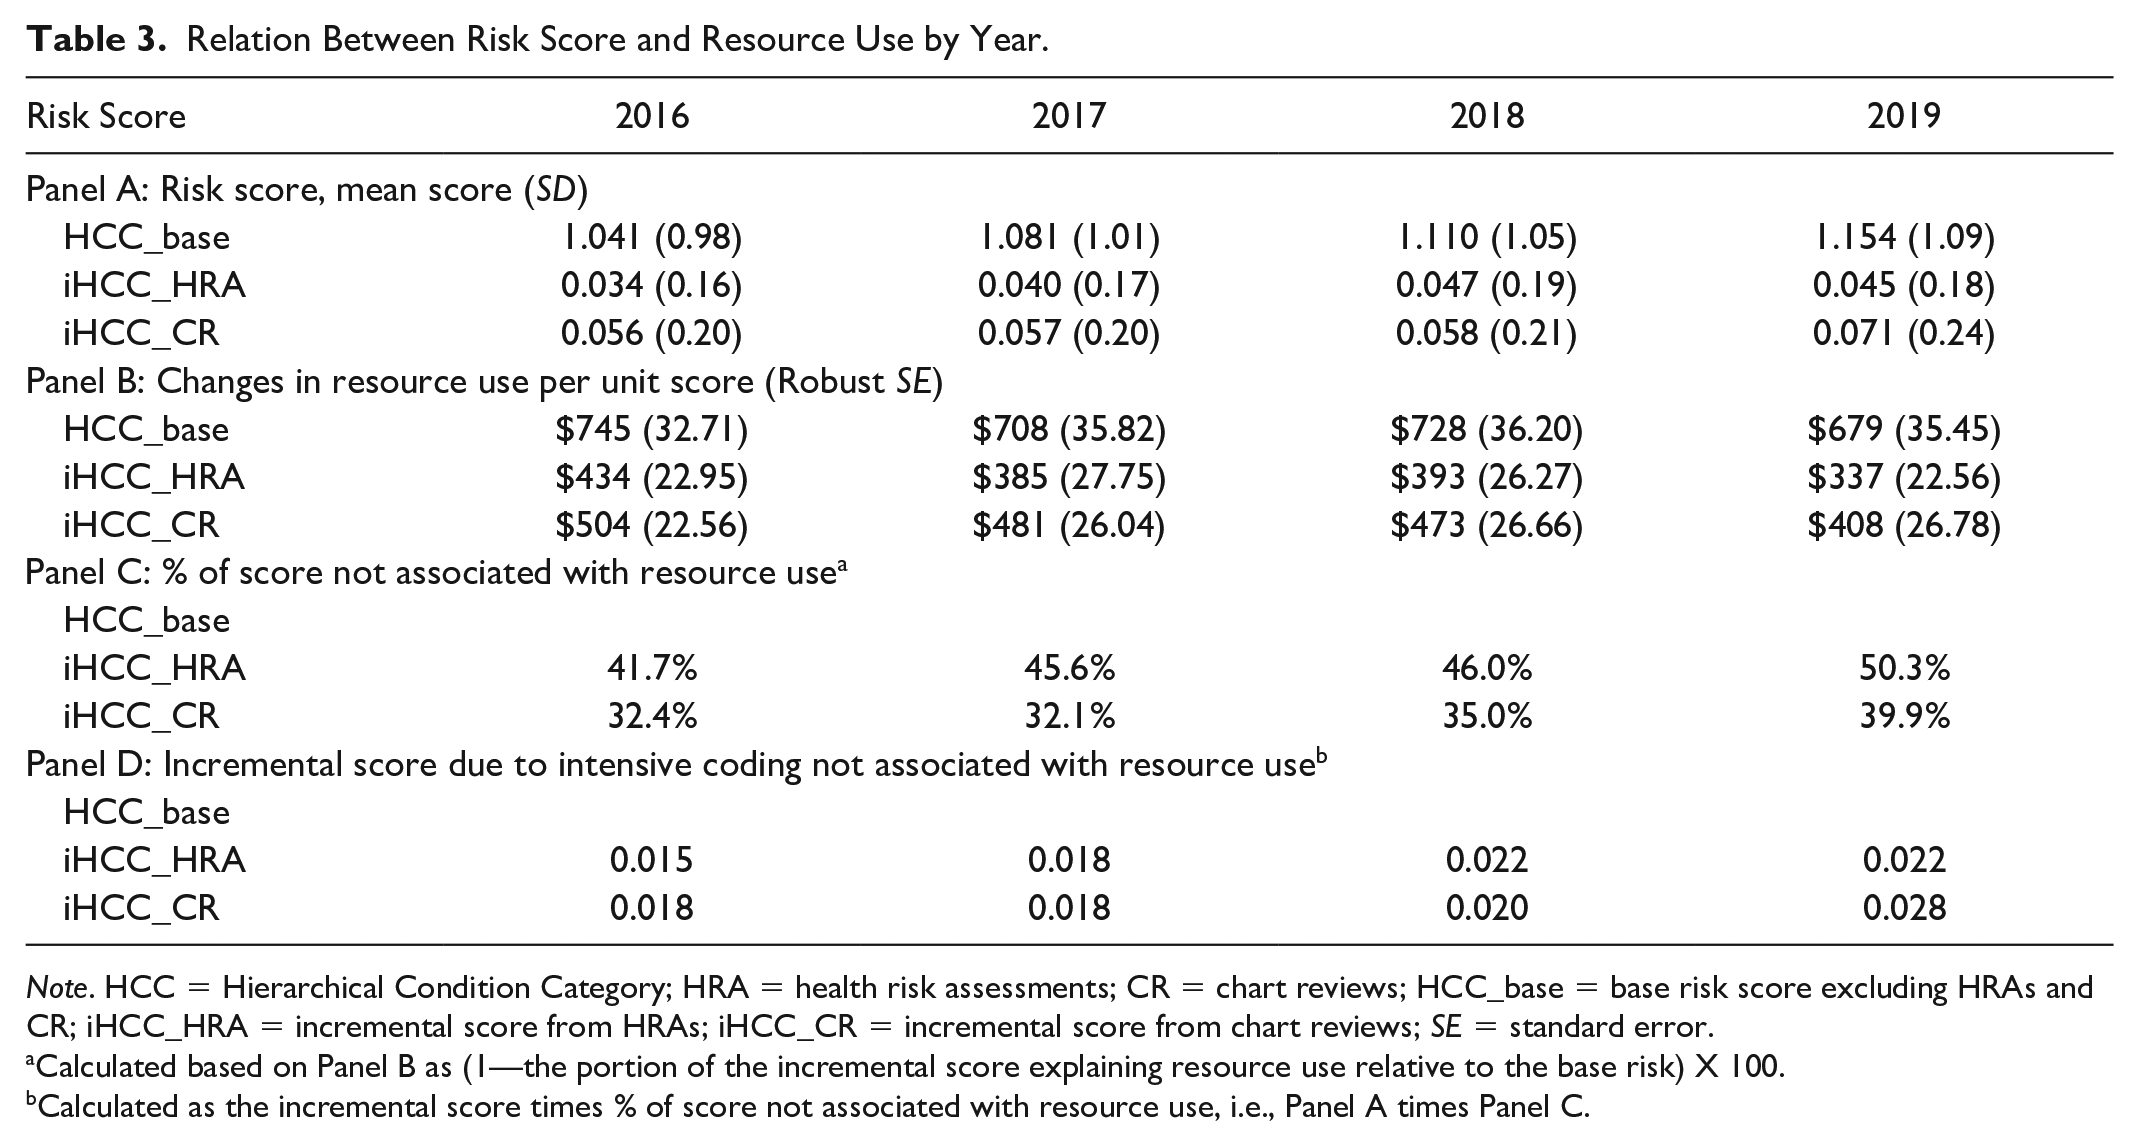
Note. HCC = Hierarchical Condition Category; HRA = health risk assessments; CR = chart reviews; HCC_base = base risk score excluding HRAs and CR; iHCC_HRA = incremental score from HRAs; iHCC_CR = incremental score from chart reviews; SE = standard error.
Calculated based on Panel B as (1—the portion of the incremental score explaining resource use relative to the base risk) X 100.
Calculated as the incremental score times % of score not associated with resource use, i.e., Panel A times Panel C.
Analyses by incremental risk quintile show considerable variation in the use of HRAs and chart reviews across MA contracts. In the top quintile, 30.7% of enrollees had an increase in the risk score due to diagnoses added from HRAs or chart reviews, while only 8.1% of enrollees did so in the bottom quintile (Online Appendix Table A2). Consistent with this, additional diagnoses from HRAs and chart reviews increased the average risk score by 0.180 units (15.8% of the base score) in the top quintile but by only 0.033 units (2.9%) in the bottom quintile (Panel A in Online Appendix Table A3). The separate regressions by risk quintile indicate that the contribution of the incremental risk scores to resource use was smaller among contracts with higher incremental risk scores (Panel B in Online Appendix Table A3).
Figure 1 shows large differences in the degree of intensive coding that does not explain resource use across incremental risk quintiles. In the top quintile, 48.0% of the incremental scores from HRAs and 42.6% from chart reviews were not associated with resource use. In contrast, in the bottom quintile, 30.1% of the incremental scores from HRAs and 18.2% from chart reviews were not associated with resource use.
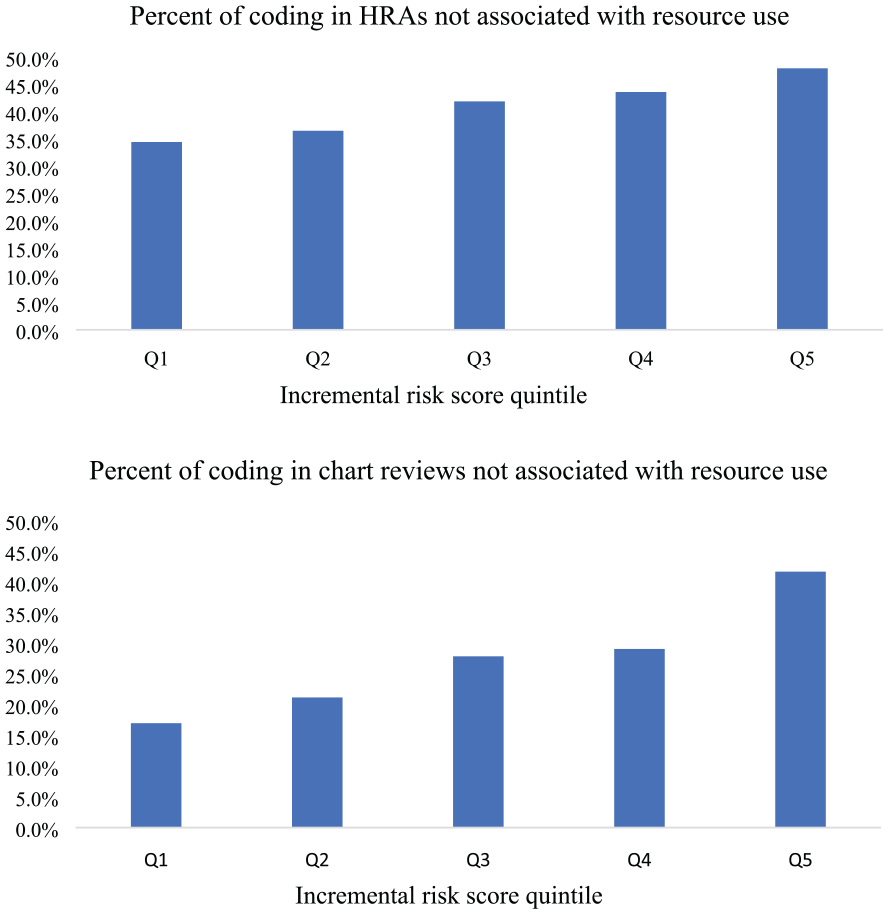
Percent of Incremental Scores Not Associated With Resource Use by Risk Quintile.
Finally, we find that PPOs had slightly more coding not explained by resource use through HRAs and chart reviews than did HMOs (Online Appendix Table A4).
Payments Associated With Coding Through HRAs and Chart Reviews Not Related to Resource Use
We use the findings above to calculate annual MA payments due to intensive coding not associated with resource use between 2016 and 2019. For each year, we multiply the portions of the incremental scores not explained by resource use (Panel D in Table 3) by the average MA base payment for an enrollee with an HCC score of 1.0 during the study period (Online Appendix A3). The average payment per beneficiary year due to intensive coding not associated with resource use increased over time: US$129 from HRAs and US$163 from chart reviews in 2016, US$163 and US$163 in 2017, US$193 and US$180 in 2018, and US$207 and US$262 in 2019. We apply these estimates to enrollees from MA contracts with or without highly complete data each year, excluding enrollees without continuous coverage or with end-stage renal disease. This gives us the annual MA payment due to the portion of coding in HRAs and chart reviews not explained by resource use: US$4.7 billion in 2016, US$5.6 billion in 2017, US$7.0 billion in 2018, and US$9.9 billion in 2019. These payment estimates are due only to HRAs or chart reviews. MA plans might game the risk-adjustment system through the base encounter records, but we are not able to assess the presence or extent of that possibility.
Discussion
Diagnoses added from HRAs and chart reviews increased the risk scores of MA enrollees by 9.4% between 2016 and 2019. Importantly, the incremental risk scores explained only 53.4%-63.9% of resource use relative to the base risk score effect—that is, 36.1%-46.6% of the incremental risk scores were not accompanied by increased resource use. This finding implies that HRAs and chart reviews perform some positive functions as intended, helping with more complete coding of patients’ diagnoses. Particularly, some diagnoses added by HRAs and chart reviews identify undetected conditions and allow providers to actively manage them, as intended by those assessments.
However, HRAs and chart reviews also are sources of intensive coding that does not explain resource use. Several factors could explain the gaps between coded conditions and service use. First, some patients may not seek services or treatments needed for their conditions due to access barriers or their health beliefs. Second, providers may record certain diagnoses (e.g., conditions in remission) that do not require treatments. Finally, plans may game the risk-adjustment system by adding diagnoses not associated with service use to increase patients’ risk scores. While we could not assess the relative impact of each factor, any payments related to codes without accompanying service use are hard to justify because they do not compensate for additional resource use.
Using the results from the decomposition of intensive coding through HRAs and chart reviews, we estimated the payments attributable to intensive coding not associated with resource use. The OIG reports calculated that diagnoses from HRAs or chart reviews increased payments to MA plans by $9.4 billion in 2017 ($9.8 billion in 2019 dollars; OIG, 2019, 2020). We estimated that payments due to the portion of coding in HRAs and chart reviews that is not associated with resource use were $5.6 billion in 2017 (in 2019 dollars). Our analysis also indicated that MA plans used chart reviews and HRAs more intensively and for more coding not related to resource use over time between 2016 and 2019, with payments due to such coding reaching US$9.9 billion in 2019.
It should be noted that our payment estimates do not represent all “excess” payments due to differences in coding intensity between MA and TM (MedPAC, 2023). For example, diagnoses may be under-reported in TM in base claims/encounters data, compared with MA (Frogner et al., 2011). Also, TM does not use diagnoses from chart reviews, and thus, any payments due to chart review records could be considered “excess” payments. Prior reports used that approach and calculated payments related to all diagnoses in HRAs and/or chart reviews (Meyers & Trivedi, 2021; OIG, 2019, 2020). We focus on identifying a portion of coding through HRAs and chart reviews that do not explain resource use. We thus estimate the payments associated only with that portion.
Currently, Medicare applies a uniform 5.9% reduction in payments to all MA plans to address intensive coding. However, considerable variation exists across MA contracts in the role of HRAs or chart reviews in intensive coding, and more importantly, variation exists in the degree of intensive coding not associated with resource use. Medicare could address this variation by excluding all diagnoses from chart reviews and HRAs from the HCC risk-adjustment model, for both MA and TM. This approach would substantially reduce payments to MA plans that receive a disproportionate amount of their payments from diagnoses in HRAs and chart reviews while minimizing impacts on plans that do not rely on those sources of intensive coding. In addition, it would place MA and TM in an equal position—at least for the sources of diagnoses. However, this approach would eliminate the positive functions of HRAs and chart reviews in capturing resource use.
Another option would be to use a tiered system that would adjust payments in relation to the degree of the incremental risk scores attributable to intensive coding in HRAs or chart reviews. For example, a tiered approach could place an upper limit on the increases in HCC scores from chart reviews or HRAs but not reduce payment for MA contracts in the lowest quintile. This option could allow some payments for coding in HRAs and chart reviews that is not related to resource use, but it would partially preserve the positive functions of HRAs and chart reviews. As discussed earlier, coded conditions are unlikely to completely correspond to service utilization for several reasons (e.g., patient non-compliance). Thus, a certain amount of non-correspondence may be reasonable, and it could be accommodated in the definition of the policy option (e.g., in determining an upper limit). Identifying a reasonable or potentially optimal level of correspondence is a challenging task. One could assess such a level from managed care plans (e.g., the Federal Employees Health Benefits Program) whose payments do not depend on risk adjustment or coded diagnoses because those plans would add diagnoses primarily for care management, not for financial motives.
Alternatively, Medicare could consider a new approach to risk adjustment for MA enrollees, such as developing weights for HCC conditions based on the resource use of MA enrollees with those conditions. The current system uses weights estimated from spending in TM. This creates incentives for MA plans to make their enrollees look sicker than TM beneficiaries with the same expected spending. With MA-specific weights, if MA plans code more diagnoses unrelated to resource use, the weights on those diagnoses would become smaller, weakening plans’ incentives to code those diagnoses. MA-specific weights can also better predict MA enrollees’ resource use depending on health risks. However, because this approach would take the MA risk adjustment system in a new direction, it would require substantial efforts to address challenges that may arise in implementation, such as ensuring data quality across all MA plans.
We note several limitations of the study. First, we examined only the role of HRAs and chart reviews in coding intensity, using codes in the base encounter records as the baseline. We were not able to analyze whether and how much intensive coding exists in the base records. Second, we did not include skilled nursing facility and home health services in measuring MA resource use because of incomplete data for those services (MedPAC, 2019). Third, unobserved factors may affect both the incremental scores and resource use. For example, plans may selectively review medical charts for high-risk enrollees who are high users of services. We estimated associations between the incremental scores and resource use, not causal relations. Thus, our estimates should not be interpreted as unbiased marginal effects of the risk scores. Rather, they represent the combined effects of the incremental scores, including the effect due to plans’ strategic decisions on intensive coding. Finally, our estimates of MA payments due to coding unrelated to resource use assumed that the level of such coding is similar between MA contracts with and without highly complete data. The estimates may not be precise if contracts with incomplete data have different levels of intensive coding through HRAs or chart reviews.
Despite these limitations, our analysis is the first to decompose intensive coding from HRAs and chart reviews into portions that are associated with increased resource use and those that are not. With its recent growth, MA is becoming the dominant source of Medicare coverage. Continued efforts are needed to identify intensive coding that does not explain resource use in all sources of MA records. Such efforts will develop adequate risk adjustment for MA payments and mitigate MA plans’ incentives for the potential gaming of the risk-adjustment system.
Supplemental Material
sj-docx-1-mcr-10.1177_10775587231191169 – Supplemental material for Coding Intensity Through Health Risk Assessments and Chart Reviews in Medicare Advantage: Does It Explain Resource Use?
Supplemental material, sj-docx-1-mcr-10.1177_10775587231191169 for Coding Intensity Through Health Risk Assessments and Chart Reviews in Medicare Advantage: Does It Explain Resource Use? by Jeah Jung, Roger Feldman and Caroline Carlin in Medical Care Research and Review
Footnotes
Correction (March 2024):
The incorrect values were reported throughout the paper, including in the abstract, p.642, p.644, p.645, p.646, columns 3 and 4 of Table 2, Panels B and C of Table 3, and Appendix Tables A1, A3, and A4.
Declaration of Conflicting Interests
The author(s) declared no potential conflicts of interest with respect to the research, authorship, and/or publication of this article.
Funding
The author(s) disclosed receipt of the following financial support for the research, authorship, and/or publication of this article: This study was supported by the National Institute on Aging (NIA) 1R01AG069352-01A1. The content is solely the responsibility of the authors and does not necessarily represent the official views of the NIA.
Supplemental Material
Supplemental material for this article is available online.
References
Supplementary Material
Please find the following supplemental material available below.
For Open Access articles published under a Creative Commons License, all supplemental material carries the same license as the article it is associated with.
For non-Open Access articles published, all supplemental material carries a non-exclusive license, and permission requests for re-use of supplemental material or any part of supplemental material shall be sent directly to the copyright owner as specified in the copyright notice associated with the article.