
Abstract
Health care providers participating in five accountable care organization (ACO) models designed, implemented, and evaluated by the Innovation Center at the Centers for Medicare & Medicaid Services have cared for almost six million fee-for-service Medicare patients over the past decade. This systematic review summarizes the features and performance of these ACO models, capturing five major themes arising from their evaluation reports: spending performance by ACO organization type; the role of management companies in ACO structure and performance; financial risk and ACO participation; clinician incentives, waivers, and payment mechanisms; and patient engagement with ACOs. In difference-in-differences analyses, these 214 ACOs lowered spending by an estimated $2.8 billion, or $316.9 million after accounting for shared savings payouts derived from benchmarks, with no evident decrements in quality of care. ACOs’ challenge in ongoing and future ACO models is to apply their accrued experience to reduce spending and improve quality within a fee-for-service payment system.
Introduction
A decade has elapsed since the Center for Medicare and Medicaid Innovation (Innovation Center) at the Centers for Medicare & Medicaid Services (CMS) launched its first accountable care organization (ACO) model in the fee-for-service Medicare program. ACOs are groups of health care providers who voluntarily accept responsibility for the total cost and quality of care of the patients who visit them most often for their primary care (Fisher & Shortell, 2010; Shortell et al., 2014). In return, ACOs may earn additional payments known as shared savings if they meet or exceed performance standards on a set of quality measures and the annual spending of their patients is below a target spending level or benchmark; alternatively, they may be liable for repaying CMS a portion of spending above their benchmark as shared losses.
Section 3021 of the Affordable Care Act authorized the creation of the Innovation Center to test payment and care delivery models in the Medicare and Medicaid programs, some of which have been ACO models. Unlike the Medicare Shared Savings Program, a permanent national program for ACOs authorized under Section 3022 of the Affordable Care Act, Innovation Center ACO models are time-limited and must be evaluated to assess their promise to reduce spending and improve the quality of care. The CMS Office of the Actuary uses evaluation reports, in conjunction with its own analysis, to determine whether an ACO model meets the statutory requirements for expansion in the Medicare program, which then could be expanded through rulemaking. Different features of ACO models tested through the Innovation Center can also be incorporated into the Shared Savings Program through rulemaking.
The Innovation Center has been an incubator for five ACO models fully designed, implemented, and evaluated during its first 10 years, along with additional ongoing ACO models. Depending on the model and its objectives, participating health care providers could receive a combination of incentives and flexibilities in the form of up-front payments, new payment mechanisms, or programmatic waivers to aid in transforming health care delivery for ACO-attributed patients. The five completed ACO models in this study can be categorized into three types of ACOs.
The first ACO type constitutes advanced organizations prepared to assume two-sided financial risk, meaning that ACOs may incur shared losses in exchange for the prospect of receiving a high share of savings. Patients were prospectively attributed to these ACOs, which were afforded novel payment mechanisms; waivers meant to enhance the efficiency of care delivery; and options to encourage patients to continue seeking care from ACO health care providers. This type includes ACOs in the Pioneer ACO Model and its successor, the Next Generation ACO (NGACO) Model.
Shared Savings Program ACOs could participate in the second ACO type tested by the Innovation Center if they demonstrated a need for up-front capital and included facilities no larger than a small hospital. The Advance Payment (AP) ACO Model and ACO Investment Model (AIM) provided up-front funding known as advance payments to ACOs for investments in their infrastructure or workforce, with the goal of recouping their advance payments from shared savings. The AP model was for new ACOs at the time the Shared Savings Program began. AIM succeeded the AP model as a two-test model with distinct objectives for ACOs with different levels of experience. AIM Test 1 was intended to encourage ACOs to form in areas of the country with low ACO prevalence; AIM Test 2 was intended to provide existing ACOs support to transition from one-sided to two-sided financial risk. In exchange for participating for a minimum of 3 years, AP and AIM Test 1 ACOs did not have to repay any unrecouped advance payments, while AIM Test 2 ACOs were required to have a financial guarantee to ensure that they did so within 6 years.
In the third ACO type, specialty organizations serving patients with end-stage renal disease (ESRD) participated in the Comprehensive ESRD Care (CEC) Model as ACOs known as ESRD Seamless Care Organizations (ESCOs). Patients were attributed to an ESCO from their first maintenance dialysis service and remained attributed as long as they were otherwise eligible throughout the ESCO’s participation in the model.
New Contribution
Innovation Center ACO models have been subject to the most comprehensive assessments of any health insurer’s ACO initiative, including the Medicare Shared Savings Program. The Innovation Center commissions independent contractors to produce evaluation reports throughout an ACO model’s duration as well as a final report. Findings from these reports have been published in peer-reviewed publications (Fullerton et al., 2016; Hersey et al., 2021; Hirth et al., 2021; Marrufo et al., 2020; Nyweide et al., 2015; Parashuram et al., 2024; Scarpati et al., 2020; Schur & Sutton, 2017; Trombley et al., 2019, 2022; Ullman et al., 2022; Zhou et al., 2022). Each report is limited to one ACO model and its derived publications are focused on particular findings in one or two ACO models, with none containing key information covering all models in one source nor examining themes across model evaluations. Broader systematic reviews of ACOs have been limited to assessments of ACO performance (Kaufman et al., 2019; Wilson et al., 2020) or do not include Innovation Center ACO models (Spivack et al., 2023). This systematic review synthesizes quantitative and qualitative findings from ACO evaluation reports in conjunction with additional ACO data analyses to offer insights into the features and performance of ACO models that began and ended during the Innovation Center’s first decade. It provides an overview of these ACO models; describes key themes from ACO evaluation reports; situates these themes in the wider ACO literature; and concludes with overarching lessons that can be applied to existing and future ACOs serving patients in the fee-for-service Medicare program.
Conceptual Framework
Each Innovation Center ACO model evaluation is centered around a conceptual framework that varies by model, but they all share a common framework for measuring and understanding the factors related to outcomes (Supplemental Appendix 1). Each ACO model is defined by its unique features and goals, which shape the ACOs it attracts to participate. ACO models have a shared savings incentive structure that rewards ACOs for lowering spending while improving quality in a fee-for-service payment system, and depending on the model, an ACO may assume financial risk or implement Medicare waivers to deliver care differently. Every ACO within a model varies by factors uniquely related to its market and the ACO itself. An ACO’s market reflects the availability of health care providers and the profile of its patient population. The market also captures competitive and spillover dynamics between health care providers as well as the presence of other ACOs and Innovation Center models. Each ACO is governed and organized in different ways as a collection of health care providers. Its clinicians may have more or less experience practicing together as an ACO, conditioned by the size and composition of the ACO’s provider network and the patients they serve. The ACO may engage its clinicians with financial or nonfinancial incentives while providing support through health information technology such as electronic notification systems or a management company.
With their shared savings incentive and other features of each model, ACOs—conditioned by their market and own structural factors—are able to enhance any number of care delivery processes (Lewis et al., 2019). These processes may strengthen the care management support that makes it easier for patients to access care; increase the receipt of preventive services and development of health and treatment plans; ensure that patients are placed in the right care setting for their needs and aligned with their preferences; or to have more seamless transitions between care settings. ACOs may instate processes that heighten cost consciousness or improve communication among their clinicians and provide population health management data analytics to guide clinicians where to focus improvements in care.
The combination of model, market, and ACO structural factors, in concert with ACO care delivery processes, are intended to result in certain ACO and patient outcomes. Some ACO outcomes such as the receipt of shared savings and continuous model participation are common to all models and others are the fruition of a specific model’s goals that ideally lead to sustainable care transformation. Outcomes for ACO-attributed patients in the form of lower spending, higher quality of care, and improved care experiences should result overall in better health (Berwick et al., 2008). The heterogeneous nature of ACO factors and care delivery processes means that there are multiple pathways to outcomes (Shortell et al., 2014), so it is the evaluation’s role to examine and endeavor to understand their relationships.
Method
Data Sources
Each ACO model was evaluated comprehensively by an independent contractor awarded the evaluation contract following a competitive bidding process among contractors with extensive methodological experience conducting programmatic evaluations. Each evaluation was guided by a series of research questions written by Innovation Center health services researchers, with input from the contractor awarded the evaluation contract (Supplemental Appendix 2). The research questions were shaped by goals and features specific to the model; understanding the experiences of participants with implementing the model and experiences of patients affected by the model; model performance on measures of spending, utilization, and quality; and any unintended consequences of the model.
Innovation Center health services researchers worked with the contractor to design a robust mixed methods evaluation, where primary data analysis was used to directly answer some research questions and to provide insights on findings from secondary data analysis that answered other research questions. Primary data collection could include ACO site visits; interviews or surveys with ACO leaders; surveys of clinicians; or focus groups with patients to answer research questions involving how the model was implemented, challenges the ACOs faced, and perspectives on changes in care delivery. Secondary data sources such as fee-for-service Medicare claims and enrollment data were used to answer research questions involving ACO performance on spending and utilization measures against a comparison group. Other secondary data related to model implementation such as participating provider and patient finder files; the Consumer Assessment of Health Care Providers and Systems (CAHPS) survey on a sample of each ACO’s patients; and annual publicly available ACO financial and quality performance spreadsheets were also analyzed as part of ACO evaluations.
Evaluation reports for each ACO model contain detailed information about the methods used for collecting and analyzing primary data and secondary data sources and methods of analysis. ACO evaluation reports for the five ACO models produced and publicly available between 2013 and 2024 were included in the systematic review. One evaluation report was produced for the AP model; three reports for Pioneer; three reports for AIM; five reports for CEC; and six reports for NGACO.
The author gleaned several common ACO descriptive characteristics from ACO evaluation reports: number of ACOs and their participation status each performance year; number of ACOs by organization type; number of ACOs assuming two-sided financial risk and population-based payments; and advance payment disbursement and recoupment amounts. In addition, the author calculated the number of unique patients in total across model years and per ACO per year using ACO beneficiary research identifiable files and the number of unique clinicians (individual national provider identifiers) per ACO per year using ACO provider research identifiable files.
Spending performance for each model was calculated by the evaluators after identifying baseline and comparison groups to estimate whether ACOs in the model increased or decreased programmatic Medicare spending. It is distinct from financial and quality performance, as reported in ACO financial and quality performance spreadsheets, which represent how each ACO’s spending compared to a prospectively set benchmark and quality against measure-specific performance standards to determine shared savings or losses.
Measuring Spending Performance
To measure spending performance, each evaluation contractor identified patients attributed to ACOs in a model and to a comparison group during a performance year and then did the same during baseline years to conduct difference-in-differences regression analyses.
After identifying ACO-attributed patients in a given performance year, evaluators applied a model’s attribution criteria to identify a comparison group of patients not attributed to a model’s participating provider list, which contains tax identification numbers, CMS certification numbers, or national provider identifiers. In the Pioneer, AP, AIM Test 1, and NGACO evaluations, comparison patients were fee-for-service Medicare patients who would have been eligible for attribution to an ACO if a plurality of their primary care charges had been with an ACO’s health care providers in ACO markets, ensuring that the comparison group was subject to the same market-level influences on health care provision. Since AIM Test 2 ACOs were already participating in the Shared Savings Program, AIM Test 2 comparison patients were attributed to other Shared Savings Program ACOs with one-sided financial risk that started the same year and were of a similar size as AIM Test 2 ACOs. In the CEC evaluation, the comparison group was other fee-for-service Medicare ESRD patients who visited similar dialysis facilities not participating in the model and not located in an ESCO core-based statistical area.
To measure baseline spending performance, the participating provider finder file for a given performance year was used to identify patients meeting the model’s attribution criteria in each of up to three baseline years prior to the start of the model. The attribution criteria were likewise applied to identify a comparison group in each of the baseline years. In the AIM Test 2 evaluation, patients were attributed to participating providers in AIM Test 2 ACOs and comparator ACOs in their respective baseline and performance years.
With ACO-attributed patients and their comparison groups identified, spending trends were measured from baseline to performance years with Parts A and B Medicare claims data for total spending or spending categories in difference-in-differences regression analyses. The analyses included weighting and adjustments for patient demographic and clinical characteristics that might confound the relationship between ACO attribution and spending. A detailed comparison of the methods for calculating spending performance across ACO evaluations is in Supplemental Appendix 3.
The resulting effects represent the per-patient-per-month spending performance of ACOs. They were converted to per-patient-per-year spending as well as multiplied by the number of ACO-attributed patient months to produce aggregate total spending for a given performance year. Aggregate total spending for each performance year was, in turn, added across years and divided by the total number of ACOs across those years to compare spending across ACOs on a per-ACO-year basis.
Measuring Quality Performance
To counterweight the incentive to reduce spending, ACOs were accountable for as many as 35 quality measures each year, which encompassed process and intermediate outcome measures reported by ACOs; outcome measures calculated using claims data; and patient experiences of care from CAHPS. ACOs met quality measure performance standards by simply reporting the measures in their first year, which continued for some measures in subsequent years. An ACO’s performance against quality measure standards was converted into a quality score, which affected eligibility for and amount of shared savings or, where applicable, the extent of shared losses.
Some ACO evaluation reports contained difference-in-differences analyses of ACO performance on quality or utilization measures that could be analyzed against a comparison group using claims or survey data. These analyses allowed an evaluation to assess whether any changes in quality measure performance were limited to the ACOs or reflected broader trends.
Measuring Financial Performance
An ACO’s financial performance reflects its shared savings or losses after accounting for its quality score each year. Since shared savings are measured against a benchmark set according to the specifications of each model, they reflect a cost to CMS as incentive payments to ACOs for spending below their benchmark; conversely, shared losses reflect ACO payments to CMS for spending above their benchmark.
Gross Total Spending Versus Net Total Spending
Aggregate total spending against a comparison group is gross total spending, and after adding CMS payouts to participating ACOs for shared savings and subtracting ACO paybacks to CMS for shared losses over the same performance year, the result is net total spending. To account for additional payments from CMS to ACOs, all recouped and outstanding advance payments were added to net total spending in the AP and AIM models, as were coordinated care reward payments used in the NGACO model to boost patient engagement. The Pioneer, AP, and CEC evaluation reports contained cumulative effects of gross total spending across two, three, and four performance years, respectively, so shared savings and losses were limited to those model years to calculate net total spending. Net total spending was calculated for all model years in the NGACO and AIM evaluation reports.
Data Analysis
In combination with analyzing common ACO descriptive characteristics across models, the author reviewed ACO evaluation reports for key themes substantively present and centered around ACO implementation experiences, operational challenges, and performance. Themes had to be present in two or more ACO models; some themes were based on model features only available in certain models. Mixed methods findings from evaluation reports, in conjunction with ACO descriptive characteristics, were noted, compiled, and organized in support of a theme. An explicit review protocol was not prepared in advance. The author shared and confirmed the validity of the themes with other health services researchers with experience working on Innovation Center model evaluations.
Results
Overview of ACO Models
Of the five ACO models that the Innovation Center launched and concluded between 2012 and 2021, each lasted 3 to 6 years (Table 1). A total of approximately 5.8 million patients were attributed to 214 participating ACOs.
Summary of Innovation Center ACO Models, 2012–2021.
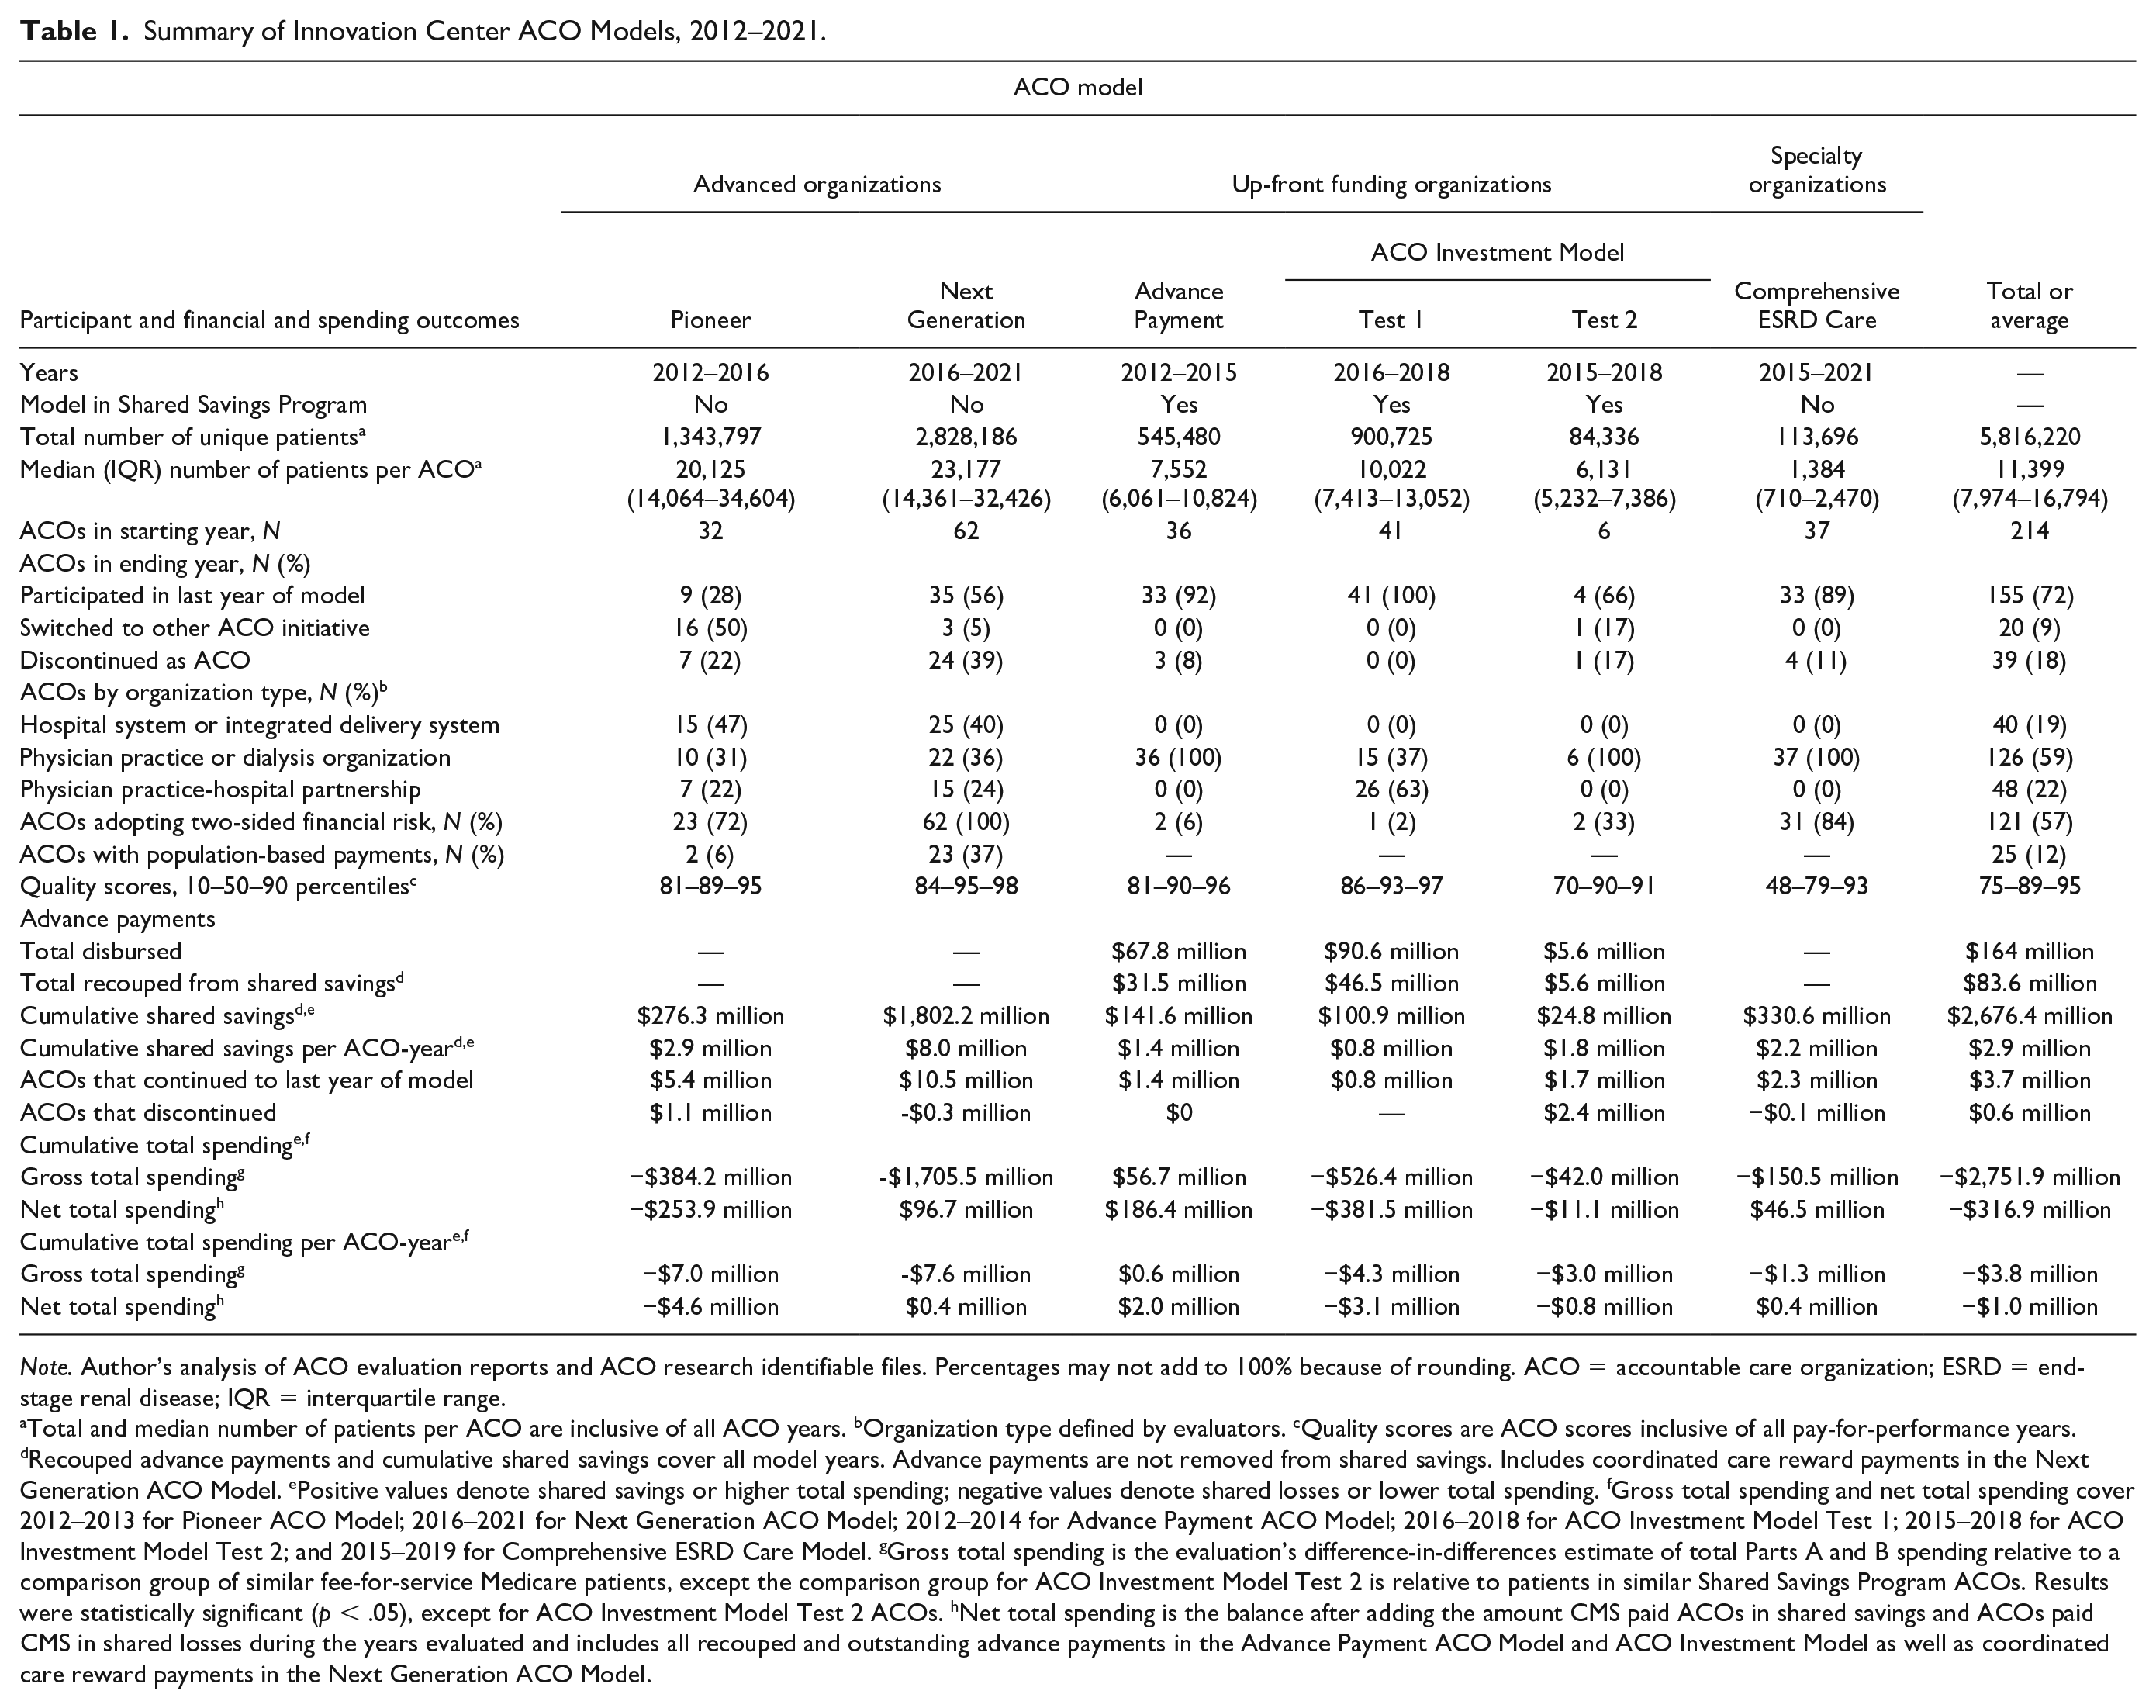
Note. Author’s analysis of ACO evaluation reports and ACO research identifiable files. Percentages may not add to 100% because of rounding. ACO = accountable care organization; ESRD = end-stage renal disease; IQR = interquartile range.
Total and median number of patients per ACO are inclusive of all ACO years. bOrganization type defined by evaluators. cQuality scores are ACO scores inclusive of all pay-for-performance years. dRecouped advance payments and cumulative shared savings cover all model years. Advance payments are not removed from shared savings. Includes coordinated care reward payments in the Next Generation ACO Model. ePositive values denote shared savings or higher total spending; negative values denote shared losses or lower total spending. fGross total spending and net total spending cover 2012–2013 for Pioneer ACO Model; 2016–2021 for Next Generation ACO Model; 2012–2014 for Advance Payment ACO Model; 2016–2018 for ACO Investment Model Test 1; 2015–2018 for ACO Investment Model Test 2; and 2015–2019 for Comprehensive ESRD Care Model. gGross total spending is the evaluation’s difference-in-differences estimate of total Parts A and B spending relative to a comparison group of similar fee-for-service Medicare patients, except the comparison group for ACO Investment Model Test 2 is relative to patients in similar Shared Savings Program ACOs. Results were statistically significant (p < .05), except for ACO Investment Model Test 2 ACOs. hNet total spending is the balance after adding the amount CMS paid ACOs in shared savings and ACOs paid CMS in shared losses during the years evaluated and includes all recouped and outstanding advance payments in the Advance Payment ACO Model and ACO Investment Model as well as coordinated care reward payments in the Next Generation ACO Model.
In 2012, Pioneer ACOs were participants in the Innovation Center’s first model. The Pioneer model attracted 32 organizations (L&M Policy Research, 2016b), and the other advanced organization ACO type, the NGACO model, had roughly twice the number of ACOs and attributed patients (NORC at the University of Chicago, 2024), although the median ACO was not much larger in size (23,177 versus 20,125 patients). A little more than a quarter of Pioneer ACOs and half of NGACOs participated to the end of each model. ACOs that prematurely exited a model switched to the Shared Savings Program in some cases; some Pioneer ACOs became NGACOs in the last year of the Pioneer model; and the remainder discontinued as ACOs altogether. Both models were composed of a mix of organization types, with a plurality of each organized around a hospital system or integrated delivery system.
AP ACOs received advance payments starting in 2012. A total of 36 ACOs participated in the AP model, and AP ACOs were relatively small (total 545,480 patients; median ACO 7,552 patients; L&M Policy Research, 2016a). AIM began with Test 2 ACOs in 2015 and Test 1 ACOs in 2016 (Abt Associates, 2018). AIM Test 1 had a total of 41 ACOs and 900,725 patients, with a median ACO of 10,022 patients; AIM Test 2, by contrast, had six ACOs and 84,336 patients overall and smaller ACOs (median ACO 6,131 patients). Almost all AP and AIM ACOs participated for the duration of each model, and they were organized as collections of physician practices or physician practice partnerships with small hospitals.
The CEC model served 113,696 ESRD patients in dialysis organizations, where a few organizations each controlled many ESCOs, which totaled 37 and had a median size of 1,384 patients (The Lewin Group, 2019). The vast majority of ESCOs participated until the model’s conclusion in 2021.
Financial and Quality Performance
With the incentive to spend below their benchmarks while meeting quality measure performance standards, ACOs in the five models earned roughly $2.7 billion in cumulative shared savings payments across all performance years, ranging from $24.8 million for ACOs in AIM Test 2 to $1.8 billion for NGACOs (Table 1). The median ACO’s quality score across all models was high. With a maximum score of 100, the median ACO quality score across performance years was around 90 for the Pioneer, AP, AIM, and NGACO models but closer to 80 for the CEC model.
The quality measures themselves varied over time and across ACO models from among 60 unique quality measures used to hold ACOs accountable for their quality of care in at least one performance year. Only a small number of quality measures contributing to quality scores were measurable by evaluations through claims data in difference-in-differences analyses of ACOs and their comparison groups to rigorously determine whether any changes in quality for ACO patients were part of larger trends. These common quality measures in evaluations were hospitalizations for ambulatory care sensitive conditions, which contributed to quality scores in different models and varying performance years, and all-cause, 30-day readmissions, which contributed to quality scores in all years of every model except the CEC model.
Composite measures of ambulatory care sensitive conditions were measured in the Pioneer, AP, AIM, and NGACO evaluations but were not consistently statistically significant across years (p < .05) (Abt Associates, 2020; L&M Policy Research, 2015, 2016a; NORC at the University of Chicago, 2024). However, where ambulatory care-sensitive conditions were limited to a specific condition, some evaluations found notable reductions over time. The AP model showed a declining trend in admission rates for patients with chronic obstructive pulmonary disease or asthma, which was statistically significant at about 3 per 1,000 patient-years by the model’s third year (p < .05) and a reduction in the heart failure admission rate for patients with heart failure of about 8 per 1,000 patient-years in the model’s second year (p < .05) (L&M Policy Research, 2016a). The Pioneer evaluation found a significant reduction in the admission rate for chronic obstructive pulmonary disease or asthma of about 9 per 1,000 admissions (p < .05) (L&M Policy Research, 2015), while the CEC evaluation found almost a 9% decrease in the rate of heart failure admissions through the model’s fourth year (p < .01) (The Lewin Group, 2021).
Average all-cause, 30-day readmission rates calculated for quality scores hovered between 14% and 15% in all years of the Pioneer, AP, AIM, and NGACO models. When measured against a comparison group, readmission rates declined significantly by 0.1 percentage points (p < .05) in each of 3 years among AIM Test 1 ACOs and by almost 3% over 4 years among ESCOs (p < .01) (Abt Associates, 2020; The Lewin Group, 2021) but did not significantly change over the course of the Pioneer, AP, or NGACO model (p < .05) (L&M Policy Research, 2015, 2016a; NORC at the University of Chicago, 2024).
Spending Performance by ACO Organization Type
Prior to accounting for the cost to CMS of shared savings payments and other payments to ACOs, gross total spending for patients attributed to ACOs in the models declined by an estimated $2.8 billion relative to other fee-for-service Medicare patients (Table 1). Four of the five models contributed to the spending reductions. The exception was the AP model, which increased gross total spending by $56.7 million (L&M Policy Research, 2016a).
AP ACOs joined the earliest cohorts of the Shared Savings Program as small, physician-practice ACOs. About half of them formed as new collections of health care providers to participate in the AP model (L&M Policy Research, 2016a). Leadership of AP ACOs reported that advance payments were essential for establishing and operating their ACOs. In a physician survey performed by the evaluation, roughly two-thirds of respondents agreed or strongly agreed that the AP model led them to be more mindful of controlling costs, a higher percentage than physicians in Pioneer ACOs or other Shared Savings Program ACOs (p < .001) (Schur & Sutton, 2017).
AP ACO leaders shared in interviews that health care providers in their ACOs proactively reached out to patients to schedule office visits to increase access to care, fill gaps in preventive care, and meet quality measure performance standards (L&M Policy Research, 2016a). After a year or two of investing in new care management staff and health information technology and becoming accustomed to delivering care in an ACO, AP clinicians appear to have turbo-charged spending on professional services for AP patients, which drove their increase in gross total spending (Figure 1). The AP evaluation showed that spending on tests tripled and spending on evaluation and management visits and procedures more than doubled over the course of the model (L&M Policy Research, 2016a).
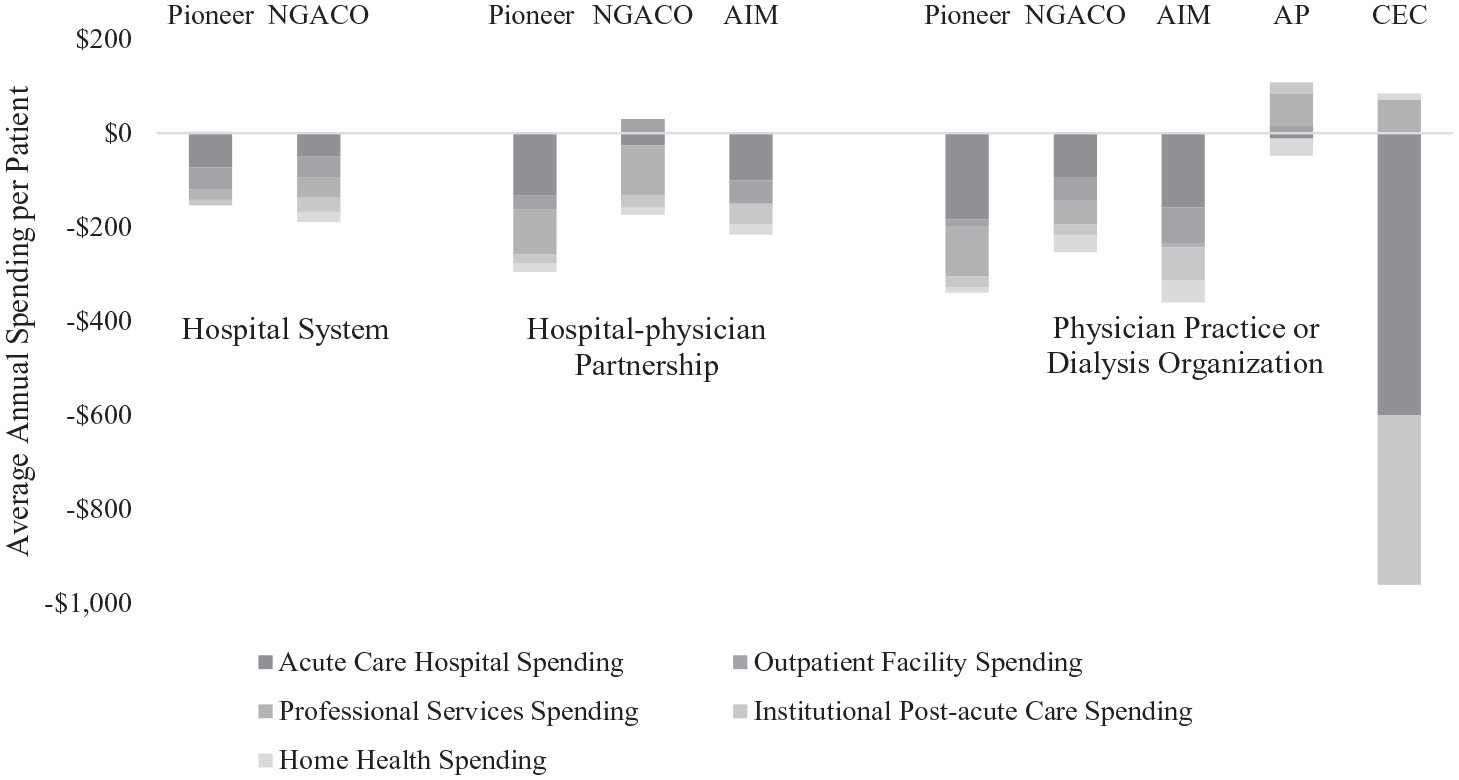
Differences in Major Categories of Gross Spending for ACO-Attributed Patients by ACO Organization Type.
As shown in Figure 1, the CEC model had a similar increase in professional spending relative to a comparison group, though it represented Part B institutional claims for dialysis and coincided with very large decreases in acute hospital and post-acute care spending for a small but expensive patient population. For models with ACOs of more than one organization type, physician practices had the largest average annual reductions in spending per patient collectively among major spending categories, with acute care hospital spending contributing the most to the declines. By contrast, hospital-affiliated ACOs did not reduce spending to the same extent.
The Role of Management Companies in ACO Structure and Performance
In interviews and surveys across ACO models, some ACO leaders reported that they relied on management companies to handle operational aspects of ACOs such as start-up assistance, programmatic compliance, data analytics, and performance feedback to practices or clinicians (Abt Associates, 2018; L&M Policy Research, 2016a, 2016b; NORC at the University of Chicago, 2020). The use of management companies was particularly notable with AP ACOs and AIM ACOs, where a key objective of both models was to stimulate ACO formation.
Thirty-three percent of AP ACOs worked with management companies (L&M Policy Research, 2016a), whereas an AIM evaluation survey found that about 80% of AIM ACOs enlisted management companies, compared with about 25% of similarly sized Shared Savings Program ACOs starting in the same year with the same financial risk track (Abt Associates, 2019).
Sometimes AIM health care providers made initial contact with management companies or management companies approached physician practices or small hospitals through conferences or other widely attended gatherings about applying to AIM and, if they were not already participating, the Shared Savings Program (Abt Associates, 2019). In many cases, management companies cobbled together groups of health care providers into ACOs, sometimes spread across different regions of the country, and guided them through the application process. AIM ACO leaders commonly reported that without advance payments and management company support, they would not have had the resources nor the expertise to establish and operate an ACO.
In their first year, AIM ACOs comprised an average of 229 unique clinicians (physicians and non-physicians such as nurse practitioners and physician assistants) per ACO (Figure 2). The next year, the number of participating clinicians more than quadrupled to 972 clinicians per ACO and then 1,021 clinicians per ACO in the final year of the model, with no change in the number of ACOs. In interviews, AIM ACO leaders generally observed that their growth expanded the geographic footprint of their ACOs (Abt Associates, 2019). By the final year of the model, the 41 AIM Test 1 ACOs were located in 36 states, with 32% of ACOs in contiguous counties, while 77% of 70 similar ACOs in the Shared Savings Program by start year, size, and financial risk track operated in fully contiguous counties (Abt Associates, 2020). Among AP ACOs, the number of participating clinicians never crested above 60 per ACO during the three model years. For ACOs in both models continuing to participate in the Shared Savings Program after the models ended over the next 2 years, the size of former AP ACOs reached only 109 clinicians per ACO and former AIM ACOs remained much higher at no lower than 817 clinicians per ACO.
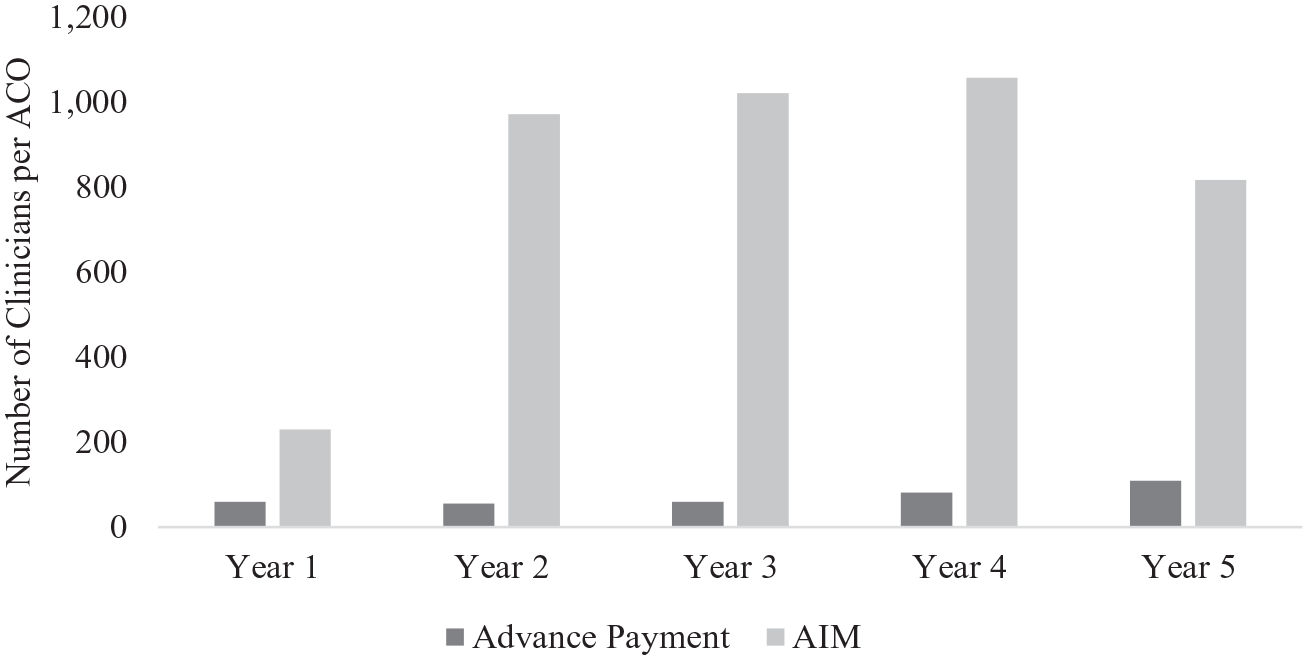
Total Clinicians Per ACO in Advance Payment Model and ACO Investment Model.
When the requisite 3-year participation period concluded for most AIM ACOs at the end of 2018, 29 of the remaining 45 ACOs withdrew from the Shared Savings Program, including 27 of the 36 AIM ACOs that expended some of their advance payments on management company support (Abt Associates, 2020). AIM ACOs withdrew at a higher rate than AP ACOs after 3 years (64% versus 50%). Many clinicians of discontinued AIM ACOs joined other Shared Savings Program ACOs. The AIM evaluator found that by 2020, 46% of former AIM participants’ primary care allowed charges were being billed under a different Shared Savings Program ACO. For 21 AIM ACOs working with one management company in particular at the end of the model, 75% of their former participants’ primary care allowed charges were billed under different ACOs by 2020.
While the AP evaluation did not conduct a subanalysis of ACOs with and without management company support, the AIM evaluation found that AIM Test 1 ACOs with management companies reduced gross total spending to a greater degree than their independent counterparts over the first ($396 versus $120 per patient per year) and second ($516 versus $264 per patient per year) model years (p < .05), with no significant difference between them in the third year (Abt Associates, 2020). AIM Test 1 ACOs spread across discontinuous geographic areas reduced spending the same amount as those contiguously located by the third model year. In addition, a greater share of all AIM ACOs’ advance payments was recouped (54%) compared with AP ACOs (47%) during each 3-year model (Table 1).
Financial Risk and ACO Participation
In interviews with the AIM evaluator, management company representatives explained that many AIM ACOs discontinued as Shared Savings Program ACOs after 3 years in AIM because as largely physician-practice ACOs, they needed more time without downside risk after regulatory changes in the Shared Savings Program accelerated the timeline when ACOs would have to transition to two-sided financial risk (Abt Associates, 2020). In separate interviews, ACO leaders affirmed that they were wary of transitioning to two-sided financial risk too quickly, citing their relatively small patient population and operational challenges of managing the risk involved. Representatives of the management company working with the most AIM ACOs noted that a key reason it disbanded and reconstituted ACOs at the end of AIM was to create larger ACOs to mitigate the financial risk of two-sided risk arrangements.
The experiences of both AP and AIM ACOs reflected the aversion smaller organizations tended to have to assume two-sided financial risk. Only two AP ACOs and three AIM ACOs assumed two-sided financial risk during their respective models (Table 1). Although advance payments were intended to assist smaller ACOs’ transition to two-sided financial risk in AIM Test 2, only four ACOs participated in any year of the model. AIM Test 2 ACO leaders explained that, as small organizations, it was challenging for their ACOs to obtain a financial guarantee to repay their advance payments to CMS if they were not recouped from shared savings (Abt Associates, 2020). ESCOs were small entities, and although 84% of them assumed two-sided financial risk (Table 1), most were controlled by large dialysis organizations capable of spreading risk across many ESRD patients.
Pioneer ACOs were expected to transition to two-sided financial risk starting in the model’s second year, while NGACOs were required to assume two-sided financial risk in their first year of participation. Both models attracted putatively sophisticated organizations with large numbers of patients, yet they had the highest attrition rates, with 22% of Pioneer ACOs and 39% of NGACOs discontinuing as ACOs altogether (Table 1). Leaders from several Pioneer ACOs said they were attracted to participate in a wholly new, ambitious model, yet after the model launched, they realized that their organizations were not ready to assume two-sided financial risk and some were content to join the Shared Savings Program instead (L&M Policy Research, 2016b). They cited challenges with data lags and analysis; difficulties engaging their participating physicians and patients; and disagreements with the methodology for calculating their financial performance that made it difficult to continue in the model. NGACO leaders of ACOs that withdrew reported that incursion of shared losses and ongoing uncertainty about their ACOs’ future financial performance were the main reasons for discontinuing participation (NORC at the University of Chicago, 2021).
For the advanced organizations, ACOs tended to withdraw when they did not achieve shared savings. As shown in Table 1, ACOs that participated over the full course of their models accumulated higher shared savings on average than ACOs that withdrew, with the exception of AIM Test 2 ACOs. All Pioneer ACOs that did not continue to the second year with two-sided financial risk did not earn shared savings in their first year (L&M Policy Research, 2016b). The average ACO that withdrew from the NGACO model or CEC model owed CMS approximately $300,000 and $100,000, respectively, per year of participation. NGACOs demonstrated high gross total spending reductions ($1.7 billion), yet shared savings outlays to NGACOs over the life of the model outstripped gross total spending by an estimated $96.7 million.
Clinician Incentives, Waivers, and Payment Mechanisms
Although some ACO leaders reported distributing some portion of shared savings among their health care providers, it was uncommon for ACOs to use shared savings as a financial incentive to shape clinicians’ spending decisions. Both Pioneer and NGACO leaders pointed out that the receipt of shared savings was too removed from the time of care and divided among too many clinicians (L&M Policy Research, 2015; NORC at the University of Chicago, 2022). They found instead that the optimal way to provide financial incentives to clinicians was to tie their compensation to quality performance or patient satisfaction or, to a lesser extent, participation in ACO-related activities such as seminars and meetings. ACOs also supported clinicians by sharing performance data and funding care managers to improve workflow processes. Typically, employed physicians were part of larger organizations pre-dating the ACO and did not themselves elect to participate; consequently, ACO leaders said that employed physicians could find it more challenging to engage in ACO activities.
Since their shared savings were used to recoup advance payments, AP and AIM ACOs were less focused on returning a portion of shared savings to their clinicians directly. Instead, AP and AIM ACOs used the bulk of their advance payments for care management support as well as to develop their ACO administrative staff, with AIM ACOs more often doing so by hiring management companies (Abt Associates, 2020; L&M Policy Research, 2016a).
Starting in its third year, the Pioneer model offered ACOs meeting certain requirements the option to receive population-based payments, a payment mechanism advancing ACOs a portion of expected spending for their patients and then reconciled against their actual spending at the end of the performance year. Population-based payments provide ACOs an opportunity to channel regular, predictable payments into alternatives to fee-for-service payments for their health care providers. The NGACO model offered population-based payments at the beginning of the model as well as fee-for-service with infrastructure payments, which worked much like advance payments reconciled with shared savings each performance year.
Twelve Pioneer ACOs were eligible for population-based payments, though only two elected to receive them (Table 1). Less than 40% of NGACOs elected population-based payments over the course of the model. Pioneer ACO leaders said they were reluctant to experiment with population-based payments (L&M Policy Research, 2016b), as did some NGACO leaders (NORC at the University of Chicago, 2020). NGACOs that elected population-based payments tended to have patients with greater chronic illness burdens; more years of experience as ACOs in the Medicare program; and operated in markets with higher ACO penetration than their NGACO counterparts (NORC at the University of Chicago, 2021). NGACOs with population-based payments cumulatively decreased total Medicare spending by about $409 per patient per year, compared with about $173 per patient per year for other NGACOs (NORC at the University of Chicago, 2024).
In some ACO models, payment waivers were available to ACO clinicians for added flexibility to deliver different aspects of care. The most commonly used payment waiver was the skilled nursing facility 3-day waiver, first offered in the Pioneer ACO model in 2014 and then throughout the NGACO model. The waiver allows qualifying ACO patients to forgo a hospital stay of at least 3 days before receiving skilled nursing facility services. Fourteen of 23 Pioneer ACOs implemented the waiver in its first year and as many as 43 of 50 NGACOs through the fourth year of the model (L&M Policy Research, 2016b; NORC at the University of Chicago, 2021).
Other payment waivers in the NGACO and CEC models, which pre-dated waivers available widely to health care providers through the COVID-19 public health emergency, loosened telehealth location requirements or allowed post-discharge home visits and care management visits without direct physician supervision. They had very low uptake: no more than nine NGACOs elected to implement any of them in 2019 and only one ESCO intended to by 2020 (The Lewin Group, 2021; NORC at the University of Chicago, 2021). In interviews, NGACO and CEC leaders cited challenges in implementing the waivers because their administrative complexity and workflow challenges outweighed the potential benefits of additional care delivery flexibilities or because they were not appealing enough to clinicians themselves to deploy.
Patient Engagement With ACOs
Patient attribution to ACOs shifts every year because patients’ eligibility or visit patterns may change and the roster of participating health care providers is refreshed. Only 30% of patients were continuously attributed to Pioneer ACOs participating through the first 3 years of the model (L&M Policy Research, 2016b). About 38% of NGACO patients who entered the first year of each of the model’s three cohorts remained attributed to ACOs that participated through the final year of the model (NORC at the University of Chicago, 2024). For AIM Test 1 ACOs, 47% of patients were attributed all 3 years of the model (Abt Associates, 2020). Patient retention varied across AP ACOs from year-to-year, ranging from 33% to 92% (L&M Policy Research, 2016a). Notably, patient retention was not a challenge in ESCOs since patients did not have to be re-attributed each year.
CAHPS survey results have shown that patient perceptions of access to care are remarkably constant across time and ACO models despite fluctuations in patient attribution. As shown in Figure 3, scores on the ACO Performance on Timely Care, Appointments, and Information CAHPS measure for the median ACO gradually rose from the low 80s in the early years of ACO models to the mid-80s by the end of the decade, with the performance of ACOs at the 10th and 90th percentiles consistently close to their peers at the median. Evaluation analyses of the same CAHPS measure adjusting for patient and market characteristics found that in 2012, average scores for Pioneer and AP ACO patients were five to six percentage points greater than fee-for-service Medicare patients as a whole (p < .05) (L&M Policy Research, 2015). In a patient-level multivariate regression comparing against other fee-for-service Medicare patients in the same markets, the AIM evaluation found that AIM Test 1 patients’ average scores on the Timely Care, Appointments, and Information CAHPS measure were about 2.5 percentage points worse (p < .05) during their first year in the model but less worse and not statistically significant in the second and third years (Abt Associates, 2020). The CEC model used a version of CAHPS tailored to dialysis facilities and found that in a risk-adjusted, difference-in-differences analysis over the first 4 years of the model, the highest ratings for almost all measure-years were not significantly different from other dialysis patients (p > .1) (The Lewin Group, 2021). Altogether, available CAHPS findings from ACO evaluations provide evidence that at least after the first year of ACO models, patients’ assessments of quality of care were unaffected by being attributed to an ACO.
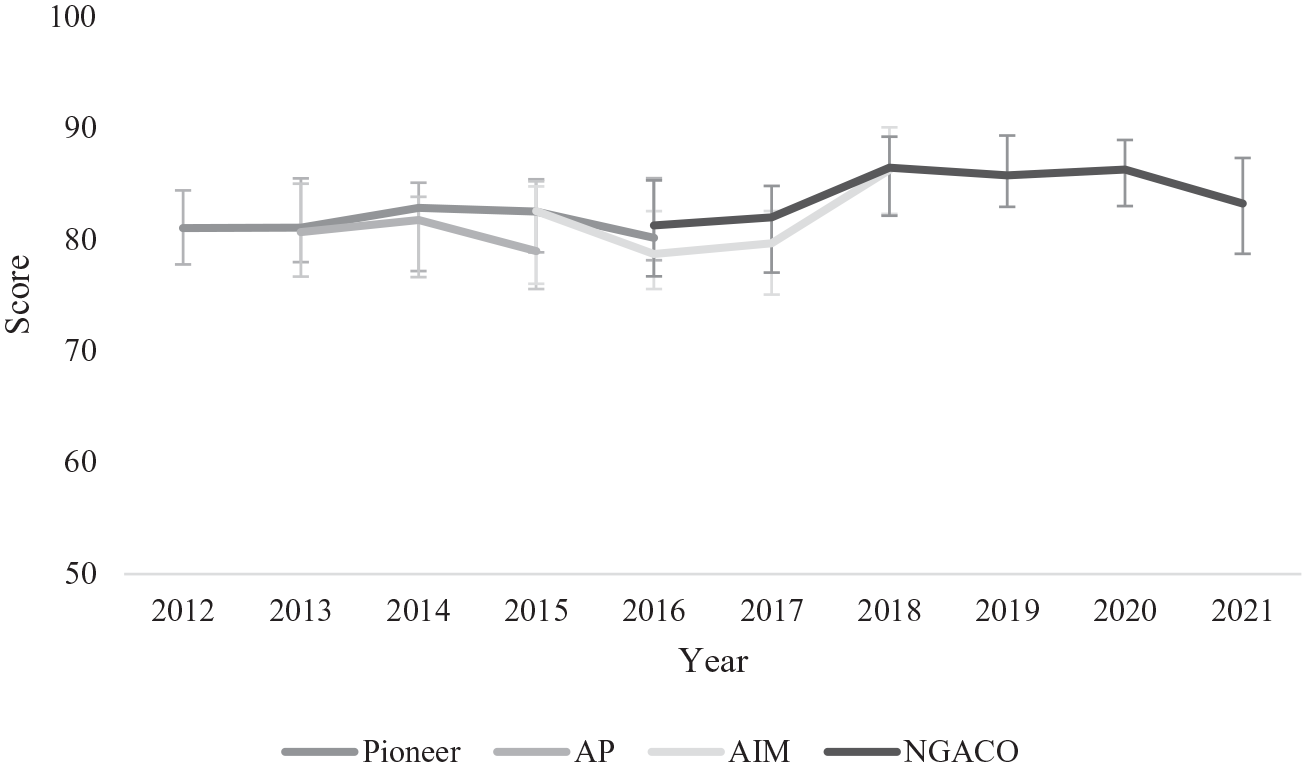
ACO Performance on Timely Care, Appointments, and Information CAHPS Measure.
Moreover, ACO-attributed patients were generally unaware of receiving care from an ACO-participating clinician, even in ACOs where they must be notified in writing after being prospectively attributed. Evaluation focus groups with 56 patients in a Pioneer or AP ACO found that patients recognized their primary care physician or the physician’s practice but not their relationship with an ACO, even for the few patients who had heard of the term (L&M Policy Research, 2016b). In separate focus groups with 46 former Pioneer ACO patients no longer attributed because of their visit patterns or from switching to Medicare Advantage, the evaluator found that none were aware they had been attributed to an ACO (L&M Policy Research, 2016b). After four rounds of patient focus groups in ESCOs, the evaluator found that ESRD patients were also not knowledgeable of being attributed to ESCOs, though some recognized features of the model in their care (The Lewin Group, 2022).
Voluntary alignment was piloted near the end of the Pioneer ACO model to bolster patient engagement and stabilize ACO attribution by having patients attest to their relationship with a particular clinician in an ACO. Patients were able to voluntarily align with an NGACO starting in the model’s first year, but voluntary alignment enrollment was very low, with no more than 1% in any year (NORC at the University of Chicago, 2024). NGACO leaders explained that aligning patients voluntarily was administratively burdensome and some found that fewer patients than expected agreed to be voluntarily aligned (NORC at the University of Chicago, 2021).
It is possible that patient awareness of ACOs grew over time through the appreciable growth of annual wellness visits, which give patients the opportunity to talk with a clinician about their health goals and focus on preventive care. As the earliest ACO models, the AP model contained a single reference to annual wellness visits in its evaluation report (L&M Policy Research, 2016a), and the Pioneer model evaluation reports contained none. Over the course of the NGACO model, annual wellness visit rates for patients attributed to NGACOs were 22% higher than other fee-for-service Medicare patients in their markets (NORC at the University of Chicago, 2024). Nearly all NGACO leaders explained that annual wellness visits were a key means for their clinicians to engage patients and assess new or ongoing health conditions (NORC at the University of Chicago, 2020). Annual wellness visits in AIM ACOs also rose steadily over 3 years, with the evaluation finding that a higher share of patients with annual wellness visits were re-attributed to AIM ACOs the following year (74% versus 61%) (Abt Associates, 2020).
The NGACO model also offered waivers to enhance patient engagement, beginning with an incentive for patients to receive an annual wellness visit from an NGACO clinician. The coordinated care reward offered NGACO-attributed patients a $25 check from CMS for completing an annual wellness visit starting in 2017, when their use of annual wellness visits more than doubled over the prior year (NORC at the University of Chicago, 2020). NGACO leaders praised the coordinated care reward as an effective incentive for patients, and it was so popular that it became too costly for CMS, with CMS paying out nearly $25 million to patients, and so was discontinued after 2 years. In its place, NGACOs were allowed to devise and pay for patient incentives for chronic disease management and cost-sharing for certain services. In 2019, no more than 10 ACOs were implementing these patient engagement waivers according to a survey of NGACO leaders (NORC at the University of Chicago, 2021).
Discussion
Over the past decade and across Innovation Center models, ACOs varying in location and organizational composition have, in aggregate, reduced gross total spending in the fee-for-service Medicare program by an estimated $2.8 billion according to rigorous evaluations while maintaining high scores on quality measures. After accounting for shared savings, coordinated care reward payouts, and shared loss receipts during evaluation years as well as all recouped and outstanding advance payments, net total spending was lowered by $316.9 million (Table 1).
Few peer-reviewed studies independent of ACO evaluations have been conducted on the spending performance of Innovation Center ACO models. McWilliams et al. (2015) analyzed the first year of the Pioneer model with a difference-in-differences analysis, finding that ACOs decreased total spending by about $117 per patient (p < .01), which was lower in magnitude but the same direction as the evaluation’s gross total spending findings for the same performance year (L&M Policy Research, 2015).
Throughout the first decade of Innovation Center ACO models, the Shared Savings Program operated as the largest and most-studied ACO initiative in the Medicare program. According to three independent studies, ACOs in the early years of the Shared Savings Program have demonstrated their capacity to reduce gross total spending. In a time-series analysis, one study found evidence that Medicare patients on long-term dialysis attributed to a Shared Savings Program ACO before the start of the CEC model had $572 perpatient-year (p < .05) lower total spending than those who were not attributed to an ACO (Bakre et al., 2020). Using a difference-in-differences analysis, McWilliams et al. (2018) followed patients attributed to a Shared Savings Program ACO for up to 3 years, finding the greatest reduction in total spending for patients attributed to ACOs that entered the first year of the program ($1.3 million per ACO-year, p < .001). In a similar difference-in-differences analysis, Colla et al. (2016a) analyzed total spending in the first full year of the Shared Savings Program, finding that cohorts of patients attributed to ACOs starting in 2012 or 2013 reduced total spending significantly in 2013 ($196 per patient, p < .001), even more for those with three or more Hierarchical Condition Categories ($588 per patient, p < .001).
Spending performance in ACO models largely comported with the estimates from these independent studies of the Shared Savings Program, with the notable exception of the AP model. AP ACOs comprised about 20% of Shared Savings Program ACOs in 2013, so their higher spending performance indicates that AP ACOs, as inexperienced participants responding to the model’s unique features, were not a representative minority of the broader Shared Savings Program. Since these independent studies were limited to the first few years of the Shared Savings Program, they also resemble the evaluations of ACO models, which necessarily were conducted for a comparable length of time for ACOs in a new ACO initiative. Longitudinal studies of the spending effects of ACOs, both in the Shared Savings Program and ACO models, are challenging to estimate because of the volatility in patient attribution and health care provider participation. Attempts to apply estimates of the effects of the Shared Savings Program on spending to later program years do not account for changes related to ACOs that selectively enter and exit the program nor learning over time among clinicians in ACOs continuing to participate (Lyu et al., 2023; Ouayogodé et al., 2021; Ryan & Markovitz, 2023).
Evaluations’ assessments of ACO quality performance that account for underlying trends showed little changes, if any, on measures that ACOs were also accountable for as part of determining shared savings or losses. The evaluation reports’ insights were limited to outcome measures related to preventing hospital admissions and readmissions, with no quality measures in ambulatory care settings. It is reassuring that ACOs did not evince worse outcomes on hospital-based quality measures for their attributed patients, which is consistent with studies of the first year of the Pioneer model (McWilliams et al., 2015) and the Shared Savings Program (Bleser et al., 2018; Colla et al., 2016a; Geyer et al., 2016; Kaufman et al., 2019; McWilliams et al., 2018), yet it might be expected that ACOs’ focus on bolstering primary care would result in material reductions hospital-related utilization (Baker et al., 2020; Spivack et al., 2021). It may take more than a few model years for ACOs to develop formal or informal relationships with acute hospitals to deter some hospital stays (Winblad et al., 2017), but preventing readmissions, in particular, may be outside their clinicians’ control (Krumholz et al., 2017).
Rather than reducing potentially preventable admissions with enhanced primary care management, ACOs may be better positioned to reduce acute hospital use overall (McWilliams et al., 2017). As ACOs without large hospitals, AIM ACOs especially excelled at reducing spending in acute hospital settings, as did ESCOs. ACO evaluations showed that physician practice-based ACOs were particularly adept at reducing acute hospital spending, a pattern also documented in the Shared Savings Program (McWilliams, 2016). ACOs with hospitals seem to struggle with the tension between maintaining revenues for the hospital and reducing hospital spending for the ACO (Colla et al., 2016b; Spivack et al., 2023).
Despite their similarities as smaller, nascent ACOs, AP and AIM ACOs had divergent experiences with reducing gross total spending. By the time new ACOs started participating in AIM, the Shared Savings Program had existed for 4 years, giving management companies more knowledge about how to assist in ACOs’ formation and operation (Lewis et al., 2018). Management companies appear to have been particularly beneficial to physician practice-based ACOs that dominated AIM since they may not have had the resources of their hospital-based counterparts to operate an ACO on their own (Spivack et al., 2023). The swings in ACO size, widely spread locations, and health care provider reconfigurations after the end of AIM strongly intimate that management companies played a critical role in shaping health care providers’ ACO participation decisions and the composition of ACOs. Yet, these factors were not detrimental to ACO performance. Management companies’ knowledge about ACO programmatic requirements and operations likely helped AIM ACOs more strategically and effectively reduce Medicare spending than AP ACOs.
AIM Test 2 ACOs demonstrated by dint of paltry participation that advance payments do not necessarily provide adequate motivation nor support for smaller ACOs to assume two-sided financial risk, and AIM ACOs were able to reduce gross total spending largely in its absence. Almost all AP and AIM ACOs participated for the duration of each model, likely because participation was contingent on returning their advance payments if they withdrew prematurely.
Larger ACOs were better sized to spread the risk that a few high-cost patients would drive total spending above their benchmarks, but they were not necessarily equipped to handle two-sided financial risk. In the two ACO models where two-sided financial risk was required, Pioneer ACOs and NGACOs had both the largest number of patients per ACO and the most volatile participation patterns, with Pioneer ACOs tending to discontinue when they were forced to transition to two-sided financial risk and NGACOs when they had to repay shared losses to CMS. The participation decisions of ACOs and their health care providers have ramifications for the costs to CMS of attracting and retaining participants in ACO models. ACOs that prematurely withdrew may have owed more in shared losses had they continued and those that remained may have been especially adroit at accruing shared savings for different organization- or market-related reasons (Bleser et al., 2019; Comfort et al., 2018; D’Aunno et al., 2018). Such adverse selection may have been at work in the NGACO model, where the gross total spending reductions shown by the evaluation were wiped out by shared savings payments, or the incentive to participate.
While shared savings were crucial for maintaining participation in the Pioneer and NGACO models, the prospect of shared savings was too distal an incentive to directly share with clinicians for most ACOs. Instead, ACOs mostly invested their shared savings payments in ACO infrastructure in the form of care management staff, tools, and analytics. Where ACOs provided additional incentives to clinicians’ compensation, they tended to augment fee-for-service payment with bonuses based on quality performance. As other research has shown, performance bonuses in ACOs are a very small share of primary care physician or specialist compensation (Rosenthal et al., 2019), which may reflect the challenge of creating incentives for ACO-attributed patients who constitute a small proportion of a clinician’s or practice’s patient panel; the difficulty of creating uniform compensation arrangements across health care providers organized into ACOs; or a greater reliance on non-financial motivators and mechanisms to influence care delivery (Phipps-Taylor & Shortell, 2016; Ryan et al., 2015).
In exchange for assuming two-sided financial risk, ACOs in the Pioneer and NGACO models could pay their health care providers differently from fee-for-service payment through population-based payments. Perhaps because they were more experienced ACOs, NGACOs elected population-based payments at a greater rate than Pioneer ACOs. The lower gross total spending rate among the minority of NGACOs that implemented population-based payments suggests that for ACOs prepared for them, population-based payments may be vital to ACOs to devise different approaches to payment within a fee-for-service payment system.
In addition to population-based payments, some ACO models allowed health care providers to deliver care in new ways to fee-for-service Medicare patients through waivers. NGACOs could access more waivers than Pioneer ACOs and ESCOs, yet the use of waivers, except for the skilled nursing facility 3-day waiver, was sparse enough to conclude that ACO leaders determined they were not worth the effort to implement, at least during the few years of a model. ACOs found heavy operational costs with few outweighing benefits of enhancing care delivery tied to waivers: they had to educate their health care providers about the availability of and billing details for waivers, which were isolated to eligible patients in qualifying situations. ACOs may be better equipped to implement waivers if they participate in subsequent ACO models that offer them.
Similarly, patient engagement incentives were most popular when ACOs were not responsible for creating and funding them. Annual wellness visit rates grew sharply over the course of ACO models, and ACO leaders spoke glowingly about their value for patient engagement. What was not shared in ACO evaluation reports is that ACO consulting companies advise ACOs to increase annual wellness visits as a strategy to boost the likelihood that patients become or stay attributed to an ACO and potentially reap a greater amount of shared savings for the ACO by fully documenting patients’ health conditions during the visits (Mora, 2021). Regardless of the rise in annual wellness visits, engaging patients in the benefits of being attributed to ACOs was challenging in all ACO models, as patients lacked awareness of attribution and almost none elected voluntary alignment in models where it was offered. At the same time, patient awareness of ACO attribution is not an explicit goal of accountable care, and patients may find other aspects of their care more valuable (Muhlbacher et al., 2015).
Perhaps because ACOs were unfamiliar even to attributed patients, perceptions of their access to care held steady, not unlike other findings of patient ratings of care during the first year of the Pioneer model or Shared Savings Program (McWilliams et al., 2014). Fee-for-service Medicare patients, even those attributed to ACOs, visit health care providers without network restrictions, so the not insubstantial rates of annual turnover in ACO-attributed patients should not be surprising (Hsu et al., 2017), even while it is reassuring that their perceptions of access were relatively constant over time and across ACO models.
Limitations
By design, the ACO models in this study started and ended within 4 to 6 years in the fee-for-service Medicare program. They may not generalize to ACOs operating with different programmatic rules, through other health care payers, or outside the study period of 2012–2021. The evaluation reports covered in this systematic review were written to answer similar, but sometimes different, sets of research questions. Even though many research questions overlap, it is possible that the qualitative and quantitative findings in the reports would have been different had the questions been asked uniformly or yielded additional supporting or conflicting evidence for the themes in this study. However, since these themes reflect major lessons learned from ACO evaluations, it is unlikely that additional evidence would materially change them. Finally, the themes are not meant to be comprehensive and exhaustive; other themes may be present across reports.
Conclusion
Innovation Center ACO models are test beds of accountable care overlaid on the fee-for-service Medicare program. By design, Innovation Center ACO models test accountable care over short-lived experiments to inform the structure of future ACO models and features of the Shared Savings Program (Rawal, Jacobs, Fowler, & Seshamani, 2023). In 2015, the Pioneer model met the statutory requirements for expansion after 2 years of evaluation and became a new track of the Shared Savings Program, allowing Shared Savings Program ACOs to assume two-sided financial risk with higher savings rates and a prospectively attributed patient population. In 2017, Shared Savings Program ACOs were eligible to use the skilled nursing facility 3-day waiver, and in 2024, a new payment option patterned off AIM started providing advance investment payments that can be recouped from shared savings for certain new Shared Savings Program ACOs.
Now into the beginning of the second decade of the Innovation Center, ACO models continue operating and new ones have been launched, bringing more health care providers into ACOs and building on learnings from earlier ACO models. The Vermont All-Payer ACO Model began in 2017 as a statewide ACO model open to all providers and payers that runs through 2025. In the final year of the NGACO model, the Global and Professional Direct Contracting Model (GPDC) was launched. It built on lessons from the Pioneer and NGACO models by providing additional population-based payment options to facilitate innovative payment arrangements for clinicians; allowing more payment waivers for greater latitude in care delivery; and easing the process of voluntary alignment to promote patient engagement. In 2023, the GPDC model was redesigned and renamed the ACO Realizing Equity, Access, and Community Health Model (REACH), with an emphasis on enhancing health equity by attracting ACOs to form in traditionally underserved communities and making related adjustments to financial benchmarks to provide greater resources for their patients. Beginning in 2022, the Kidney Care Choices Model (KCC) followed the CEC model with four payment options for managing the care of patients with late-stage chronic kidney disease or with ESRD.
As ACO models continue to evolve and ACOs grow in experience, perhaps ACOs’ most intractable challenge is to reduce the spending and improve the quality of their patients’ care while operating within the strictures of the fee-for-service Medicare program. Their health care providers must still render medical services billable under the program, and their attributed patients may not always seek care from them. ACOs’ value also may be more difficult to realize if Medicare patients’ care is concurrently improved by other alternative payment initiatives from the Innovation Center or other payers (Fowler et al., 2025; McWilliams et al., 2013; Navathe et al., 2020; Spivack et al., 2023).
Despite these challenges, ACOs have shown the capacity to reduce Medicare spending by millions of dollars with no signs of hampering quality of care. What has been learned over the past decade of ACO evaluations is that it takes time for health care providers serving fee-for-service Medicare patients to grow accustomed to managing population health; adjust to new payment flows; and become acclimated to two-sided financial risk. Their accrual of experience has made ACOs more adept at creating pathways for lowering spending while maintaining quality within the fee-for-service Medicare program.
Supplemental Material
sj-docx-1-mcr-10.1177_10775587251325914 – Supplemental material for The First Decade of ACO Model Evaluations in the Medicare Program: A Systematic Review
Supplemental material, sj-docx-1-mcr-10.1177_10775587251325914 for The First Decade of ACO Model Evaluations in the Medicare Program: A Systematic Review by David J. Nyweide in Medical Care Research and Review
Footnotes
Acknowledgements
Special thanks to several colleagues at the Centers for Medicare & Medicaid Services for their helpful comments.
Correction (July 2025):
The Author’s Note has been included as part of the end statement.
Author’s Note
The content is solely the responsibility of the author and does not represent the official views of the Centers for Medicare & Medicaid Services.
Declaration of Conflicting Interests
The author(s) declared no potential conflicts of interest with respect to the research, authorship, and/or publication of this article.
Funding
The author(s) received no financial support for the research, authorship, and/or publication of this article.
Supplemental Material
Supplemental material for this article is available online.
References
Supplementary Material
Please find the following supplemental material available below.
For Open Access articles published under a Creative Commons License, all supplemental material carries the same license as the article it is associated with.
For non-Open Access articles published, all supplemental material carries a non-exclusive license, and permission requests for re-use of supplemental material or any part of supplemental material shall be sent directly to the copyright owner as specified in the copyright notice associated with the article.