
Abstract
This study describes the developmental trajectories of language skills in infants with substantiated maltreatment histories over a 5-year period and evaluates the effect of three different custodial placements on their language trajectories over time: in-home (remaining in the care of the biological parent/parents), nonkin foster care, and nonparental kinship care. Participants included 963 infants reported to child protective services prior to their first birthday and whose maltreatment was substantiated. Results from covariate-controlled growth modeling revealed no significant placement effects. Across all groups, children’s auditory and expressive communication scores decreased significantly from Wave 1 (intake) in the infants’ first year to Wave 4, when children were about 3.5 years of age, then improved to baseline levels by Wave 5, when children were about 6 years old. Despite these fluctuations, children’s average language scores in each placement group remained below the population mean at each wave of the study.
Among more than 3.5 million cases of child maltreatment investigated in the United States in 2008, including cases of neglect as well as physical and sexual abuse, children under the age of 4 had the highest rate of victimization, and 19.5% of all children maltreated that year were 1 year old or younger (U.S. Department of Health and Human Services [USDHHS], 2010). This is of great concern because children undergo rapid growth and development in language, cognition, motor skills, and social emotional functioning during early childhood, and child maltreatment adversely affects all of these areas of development (Cicchetti, 1987; Hildyard & Wolfe, 2002). One critical area of development worthy of further intense scrutiny in this population is language functioning. Language skills are foundational to all children’s early learning, emerging literacy, and self-regulation, which in turn are important predictors of later adaptation and school success (Beeghly, 2006; Lonigan, Burgess, & Anthony, 2000; Welsh, Nix, Blair, Bierman, & Nelson, 2010). Research has shown that sensitive, consistent, and stimulating caregiving environments promote children’s language development, whereas environments characterized by harsh parenting, abuse, or impoverished stimulation, such as those often experienced by maltreated children, place them at risk for language delays and other developmental problems (Bradley & Corwyn, 2002; Hart & Risley, 1995; Hoff, 2003).
Following their entry into the child welfare system, maltreated children are significantly more likely than their nonmaltreated counterparts to be placed into nonmaternal care, such as foster care or kinship care. According to the U.S. Children’s Bureau, the primary goals of the child welfare system in making placement decisions are to (a) achieve children’s safety and protection, (b) establish a permanent placement for children in a timely manner, and (c) ensure children’s well-being. These goals are reflected in current public policies affecting placement decisions, such as the Adoption and Safe Families Act (Public Law 105-89) of 1997, the Fostering Connections to Success and Increasing Adoptions Act (Public Law 110-351), and the family-to-family movement (Annie E. Casey Foundation, 2001). During the past decade, these initiatives and the decreasing number of foster homes have resulted in the increasingly common practice of placing maltreated children with relatives (Jones-Harden, Clyman, Kriebel, & Lyons, 2004). Although these decisions are made in the best interests of the child, very little empirical data exist regarding the effect of different placements on maltreated children’s language and other developmental outcomes. Less is known about how placement type may affect changes in children’s language skills over time. The purpose of this study is to evaluate the language trajectories of young maltreated infants over a 5-year period and assess whether different placement types (i.e., remaining with the biological parent, nonkin foster care, or kinship care) alter these trajectories, controlling for child and environmental characteristics. The study is theoretically grounded in a developmental systems perspective (i.e., Bronfrenbrenner’s bioecological model of human development, Bronfenbrenner & Morris, 2006), which posits that children’s outcomes are influenced by multiple transacting factors including their own characteristics (e.g., gender, race, severity of maltreatment, and level of neurodevelopmental risk), variations in the proximal caregiving environment (e.g., level of cognitive stimulation in the home), and broader ecological factors (e.g., parental education and familial income).
Language Development, Emergent Literacy, and School Readiness
Fostering optimal language development in maltreated infants and toddlers is an important public health goal because early language skills are strong predictors of children’s emergent literacy, reading skills, and long-term academic success (Lonigan et al., 2000; Wagner et al., 1997). Conversely, children with language impairments are six to eight times more likely to develop a reading disability than age-matched children without language impairments (Justice, Bowles, Turnbull, & Skibbe, 2009). Given that maltreated young children are at higher risk for language delays than demographically similar nonmaltreated peers (Allen & Oliver, 2002; Cicchetti & Beeghly, 1987), it is vitally important to understand more clearly how different types of child placements may influence maltreated children’s early language development trajectories.
Multiple Factors Influence Early Language Development
Maltreatment
Maltreated children exhibit delays in multiple aspects of expressive language (e.g., semantics, syntax, pragmatics, and discourse), relative to demographically similar, nonmaltreated peers (Beeghly & Cicchetti, 1994; Coster, Gersten, Beeghly, & Cicchetti, 1989; Eigsti & Cicchetti, 2004; Katz, 1992), and some studies have also reported delays in receptive language (see Westby, 2007, for a review). Although these findings stem mostly from small, cross-sectional studies (English, 2003), a rare 12-year longitudinal study showed that early child maltreatment predicted lower language arts standard scores and other academic and behavioral problems at adolescence (Lansford et al., 2002). These negative effects likely result from the complex, dynamic interplay among multiple biologic and environmental risk factors associated with maltreatment (Cicchetti, 2002). Stress associated with early adverse experiences, including maltreatment, is linked to alterations in brain and psychobiological processes, which in turn may impair acquisition of language and other neurodevelopmental functions (Cicchetti, 2002; Watts-English, Fortson, Gibler, Hooper, & DeBellis, 2006). Child maltreatment is also more prevalent among families facing multiple environmental stressors (Coulton, Crampton, Irwin, Spilsbury, & Korbin, 2007; Wu et al., 2004). When cumulative, these stressors are likely to compromise the quality of parenting and cognitive stimulation children receive in the home environment and increase parents’ child abuse potential (Kotch, Browne, Dufort, Winsor, & Catellier, 1999; Nair, Schuler, Black, Kettinger, & Harrington, 2003).
Parenting and the Home Environment
Indicators of the quality of the home environment known to promote early language and other developmental outcomes include (a) the level of parental responsiveness and sensitivity, (b) parental verbal input, and (c) the provision of age-appropriate cognitive-enriching experiences (Hart & Risley, 1995; Hirsh-Pasek & Burchinal, 2006; Kelly et al., 1996; Roberts, Jurgens, & Burchinal, 2005). The prevalence of these indicators is also linked to demographic factors such as higher maternal education (Skibbe, Justice, Zucker, & McGinty, 2006); however, some studies show that these indicators retain their significant association with children’s language and academic outcomes even after controlling for demographics (Gottfried, Fleming, & Gottfried, 1998). Although understudied, these associations have also been reported for maltreated infants and toddlers (Stahmer et al., 2009).
Differences in Placement Type
Clearly, variations in parenting, the quality of the home environment and demographic risk factors impact children’s language outcomes. It is less well understood whether different placement types differ systematically on these factors. A few studies have suggested that young maltreated children who are reported to child protective services (CPS), but who remain at home with their biological parents and receive services, experience lower-quality home environments, compared to children placed with nonparental caregivers (see e.g., Stahmer et al., 2009). Studies have also shown that different out-of-home placements may vary in factors that promote positive child outcomes. Compared to nonkin foster caregivers, kinship caregivers are more likely to be single, less well educated, to live in unsafe neighborhoods, and to provide a less stimulating home environment (Ehrle & Geen, 2002; Stacks & Partridge, 2011). On the other hand, kinship care may afford protective factors for children that may ameliorate these risks, such as increased contact with birth parents and siblings (Scannapieco, 1999). Understanding whether placement differences are linked to children’s language outcomes is therefore an important undertaking, with potentially significant implications for service.
Goals of the Present Study
The goals of the current analysis were twofold: The first was to describe the auditory and expressive language trajectories of a large sample of maltreated infants over a 5-year period, from infancy to about age 6. The maltreatment of all infants was reported and substantiated during the infants’ first year of life. Based on literature, showing that a history of maltreatment is associated with significant language delays in early childhood, we expected that children’s expressive and receptive language scores would remain below the population mean, on average, at each wave of the study. The second goal was to evaluate whether three different types of custodial placements (in-home care [remaining in the care of the biological parent/parents], nonkin foster care, and nonparental kinship care) would be associated with differences in children’s language trajectories over time, after controlling for relevant child and environmental factors. Given the paucity of studies, we had no firm hypotheses regarding the effects of placement type. We expected, however, that variations in child and environmental factors within placement groups (e.g., child gender, level of developmental risk at intake, severity of risk for harm, caregiver education, and level of cognitive stimulation in children’s home) would be stronger predictors of children’s language outcomes than placement type alone. Although some research suggests that placement with biological parents or relatives is associated with risk factors that may promote a less supportive caregiving environment than nonkin foster care, some findings (Scannapieco, 1999) suggest that there may also be benefits of kinship care (e.g., continuity of family relationships) that may protect against the harmful effects of these risks.
Method
The data used in this study were from Waves 1, 3, 4, and 5 of the National Survey of Child and Adolescent Well-Being (NSCAW), a nationally representative, large-scale study of children investigated for child maltreatment. The NSCAW sample includes 5,501 children between the ages of birth and 14 years, from the United States who entered the child welfare system within a 15-month period beginning in October 1999. To be eligible for the study, children had to enter child welfare services through an investigation of child abuse or neglect by CPS. Infants and sexual abuse cases were oversampled to ensure statistical power required for these key categories of cases. Children were followed longitudinally; Wave 1 data were collected 2–6 months after the close of the CPS investigation; the response rate was 64.2%. Wave 2 data were collected 12 months after baseline, but only from former caregivers, so it was not used in this analysis. Data from Waves 3, 4, and 5 were collected 18, 36, and 60 months, respectively, after the close of the initial CPS investigation (Dowd et al., 2006).
Participants
Analyses in the present study were based on longitudinal data collected for the subsample of 963 infants who were investigated by the child protection system before their first birthday and whose maltreatment cases were substantiated. Of the 963 children in the sample, just under half (46.7%) were female and 32.9% were White, 43.6% were African American, 17.8% were Hispanic, and 3.9% were classified as Other. At the end of the protective services investigations, which took place prior to Wave 1 (intake), infants were less than 1 year (M age = 4.18 months, SD = 3.7 months). The average age of children at Wave 1 was 8.01 months (SD = 3.87 months), at Wave 3 was 23.27 months (SD = 4.22 months), at Wave 4 was 38.90 months (SD = 4.06 months), and at Wave 5 was 69.59 months (SD = 6.92 months). Based on the most serious forms of abuse/neglect reported by caseworkers, nearly half of the infants in this sample had substantiated cases of neglect: 37.1% of infants experienced a lack of food, clothing, shelter, medical care, or hygiene and 18.7% were either left unsupervised, lived in an unsafe environment, or were not provided with adequate substitute care. Just under one sixth (15.3%) experienced physical abuse. Very few children experienced sexual maltreatment (.8%). On average, infants experienced 1.43 types of maltreatment (SD = .756). Among the 871 infants for whom maltreatment type was available, 67.3% experienced only one type of maltreatment and 32.7% experienced two or more types of maltreatment.
More than half of the infants (56.1%, n = 540) remained in the custody of their biological parent/parents (in-home), 27.5% (n = 258) were placed in nonkin foster care, and 16.4% (n = 158) were placed in kinship care. Children’s placements at intake remained relatively stable over the course of the study. The average number of placements experienced by the children over the 5-year evaluation period was 2.25 (SD = 1.57). By Wave 5, 76.2% of the children were living with a permanent biological or adoptive caregiver. The majority of the children’s caregivers were female (95.4%), and 41% were married at Wave 1. Nearly half (46.1%) were White, 34.7% were African American, and 13.3% were Hispanic. Nearly one third (29.4%) of the caregivers had not completed high school, almost half (43.3%) had earned a high school diploma or a general educational development, 17.1% had earned either an associate’s degree or a vocational/technical diploma, 4.4% had earned a bachelor’s degree, and 1.2% had earned a postgraduate degree. Approximately one quarter (21.7%) had a total family income of less than $15,000 per year, whereas 31.4% had an income of $40,000 or greater.
Measures—Dependent Variable
Language
Auditory and expressive communication skills were assessed at each wave using The Preschool Language Scale-3 (PLS-3; Zimmerman, Steiner, & Pond, 1991). The PLS-3 is age-normed and used to evaluate language development and delay in children between the ages of 2 weeks and 6 years. The PLS-3 was normed on a racially and geographically representative sample and yields three standard scores (population M = 100, SD = 15): expressive communication (EC), auditory comprehension (AC), and total language (TL). Items in each scale vary according to the age of the child being assessed. Example AC items include responding to sounds and name, identifying pictures, objects and actions, and following increasingly complex directions. Example EC items include early consonant and vowel sounds, gestures, words, and sentence complexity. In the NSCAW sample, the test was administered by a trained examiner in the child’s home with the assistance of computerized scoring. A computer determined the child’s start point based on the age and routed questions to the test administrator until the child’s basal and ceiling were reached. The PLS-3 discriminates language disordered from language-typical children 66–80% of the time (Zimmerman et al., 1991). In normative samples, Cronbach’s α for all three scales indicated good internal reliability: EC subscale = .81, AC subscale = .76, and the TL scale = .87.
Measures—Independent Variable
Placement type
Placement type was reported by the investigative caregiver and confirmed by the custodial caregiver at Wave 1. Caseworkers were asked to report with whom the child was living and their relation to the child; caregivers were asked to confirm that the child was living with them and to report their relationship to the child. This information was used by NSCAW investigators to create a derived variable for placement type, which indicates whether infants were placed at Wave 1 with biological parents, nonkin foster parents, or kinship caregivers.
Measures—Covariates
Children’s risk for harm at intake
The investigative caseworker reported on the child’s severity of risk for harm. This was assessed using a 4-point Likert-type scale based on the caseworkers’ response to the question, “regardless of the outcome of the investigation, how would you describe the level of severity or risk (to the child)?” Caseworkers reported whether there was no risk (a), mild risk (b), moderate risk (c), or severe risk (d). Because very few children were reported as having no risk or mild risk, these categories were collapsed.
Home environment
The level of cognitive stimulation in children’s home environment was measured at Wave 1 using the cognitive stimulation subscale of Home Observation for Measurement of Environment-Short Form (HOME-SF; Caldwell & Bradley, 1984) at Wave 1. This scale contains a total of 9 items that are either directly observed during a home visit or through self-report during a semistructured interview at a home visit. A higher score indicates a better home environment. Sample observation items include whether (a) the caregiver had toys for the infant and (b) the child’s play environment was safe. Sample self-report items include how often the caregiver (a) reads stories to the child, (b) has spanked the child, and (c) talks to the child as well as the number of books and toys that the child has. Internal consistency is generally not reported for this measure because it is an index of observed and reported behaviors and index items are not expected to be interrelated. However, internal consistency information is reported in study documentation provided by The Administration for Children and Families, According to this documentation, internal consistency for the cognitive stimulation subscale is .36.
Sociodemographic risk
Child and caregiver demographic variables were collected from the children’s primary caregivers at Wave 1. Caregivers reported their sex, date of birth, age, race/ethnicity, marital status, highest grade completed, and income. Caregivers also provided information about child age, sex, and race. Children’s age-in-months was derived at each wave using caregiver and caseworker report of child’s birth date and the date of the interview.
Children’s developmental risk at intake
Children’s risk for developmental delay was assessed at Wave 1 using the Bayley Infant Neurodevelopmental Screener (BINS, Aylward, 1995). The BINS is a screening tool used to identify infants between the ages of 3 and 24 months for neurological impairments or developmental delays. The BINS assesses four developmental areas: (a) basic neurological functions; (b) sensation and perception; (c) fine, oral, and gross motor skills; (d) memory, learning, and thinking. Items differ depending on the infant’s age. For very young infants, sample items include the infant’s ability to hold his head steady, reach for a suspended ring, coordinate movement of the extremities, look for fallen objects, make vowel sounds, respond to vocal requests, and walk or make walking movements. Scores for each subscale were summed to get a total score, which was converted, to risk level (high, moderate, and low), following instructions on the BINS record form. Scores in the moderate- to high-risk range at 6–24 months are indicative of clinically significant cognitive developmental impairment at 36 months of age (Aylward & Verhulst, 2000). Internal consistency ranged from .73 to .84 for the various age groups in the NSCAW sample.
Statistical Analyses
A multistep analysis plan was used to evaluate the study aims. Descriptive statistics were first generated for each variable of interest to evaluate their distributional properties. Second, bivariate statistical analyses were used to identify which demographic and risk variables were associated with placement type, AC and EC, to be used in the growth models as covariates. Next, unconditional growth curves were used to examine changes in AC and EC across four waves of data and to determine whether data could be represented by linear or quadratic growth curves. Finally, we specified conditional growth models to determine the extent to which variance in the trajectories of AC and EC across the four waves of data were related to type of placement.
Growth models were tested using Mplus v 5.01 software. In all of these models, means and covariances of the observed variable residuals were constrained to zero. In a growth-modeling context, residuals can be interpreted as variance that is time specific and fixing the covariances of the residuals to zero states that the time-specific variance at a given time point is independent of the time-specific variance at another time point. Preliminary analyses were conducted to assess the distributional properties and patterns of missingness of the data using standard procedures described in Wilcox (2001) and Schafer and Graham (2002). The median absolute deviance statistic, which is less sensitive to outlier masking than the standard deviation, did not identify any outliers. Missing data analyses suggested that the data met the definition of missing at random (Little & Rubin, 1989). As such the estimation–maximization algorithm full maximum likelihood estimation procedure was used to estimate missing data allowing for the inclusion of cases where at least two assessment periods provided data in growth modeling analyses (Schafer & Graham, 2002).
Results
Descriptive Findings
At intake, the investigative caseworkers rated 19% of the infants in the present sample as having no/mild risk, 35.7% as having moderate risk, and 45.3% as having been at severe risk of harm. Results of the BINS developmental screening indicated that 14.2% of the children were at low risk for developmental problems, 27.4% were at moderate risk, and 58.4% were at high risk. At every wave, children’s average standard scores for AC and EC fell below the population mean of 100. In Table 1 , descriptive statistics for children’s AC and EC scores at each wave are presented for the sample as a whole and for each placement type.
Descriptive Statistics for Language Variables used in Growth Models
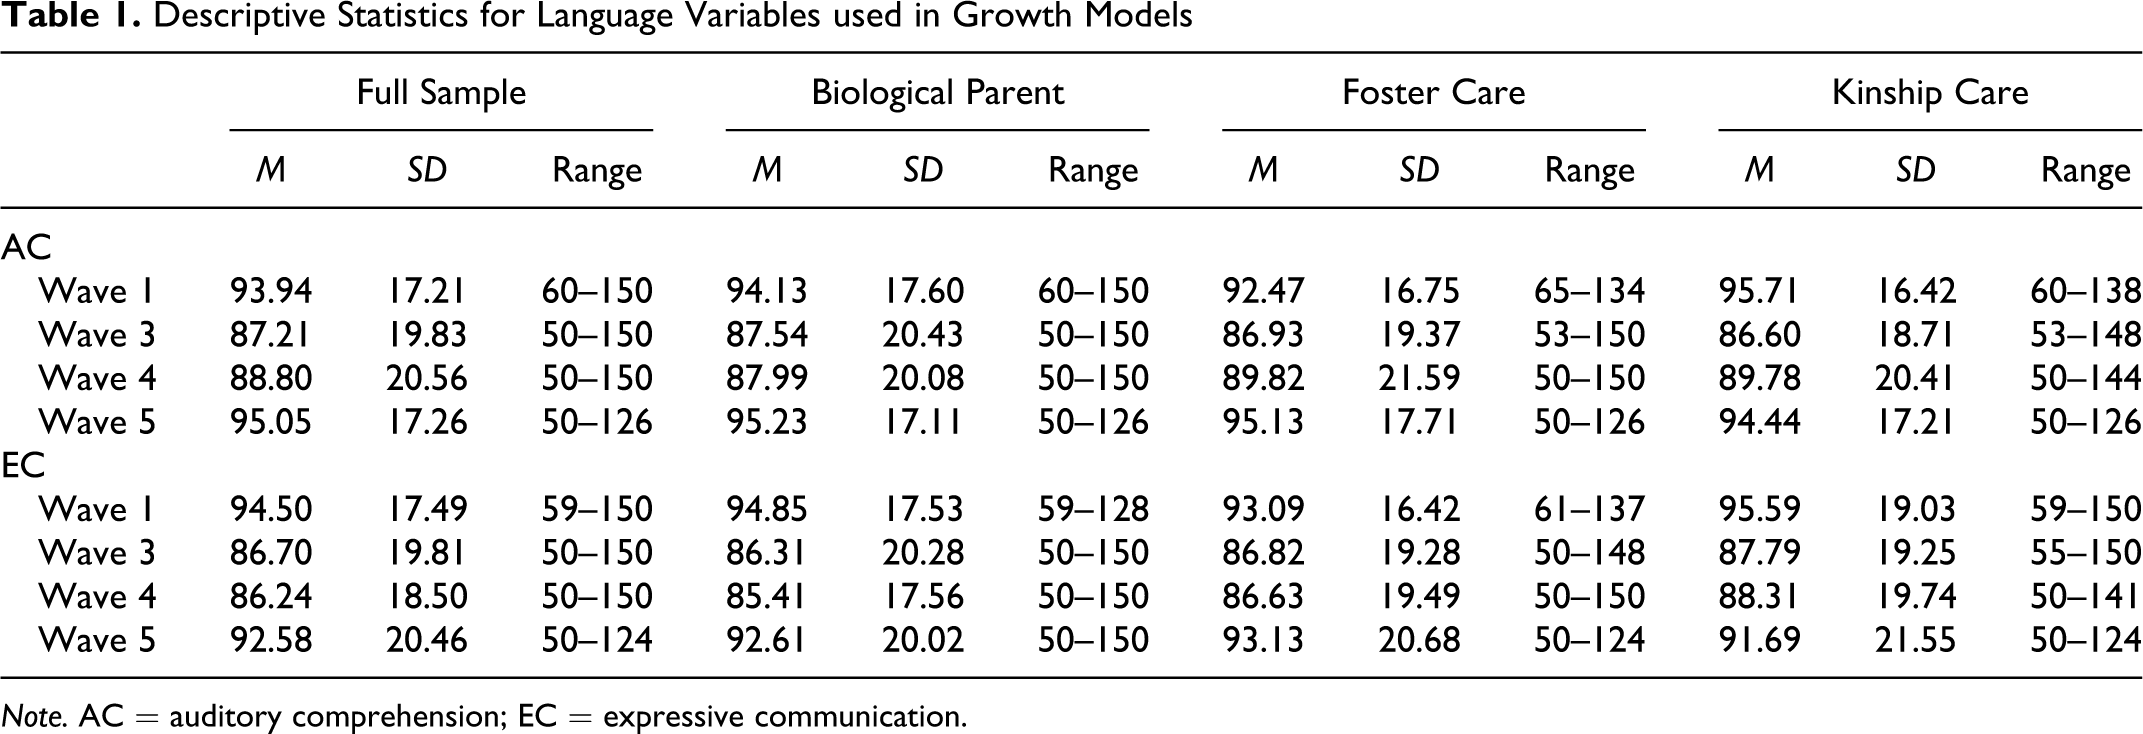
Note. AC = auditory comprehension; EC = expressive communication.
Demographic and Risk Differences by Placement Type
Table 2 provides means, standard deviations, and results of analyses of variance (ANOVAs) for infant and caregiver developmental and sociodemographic risk variables by placement type. Results indicate that infants placed with biological parents were significantly older, at significantly less risk of harm, and had experienced fewer types of maltreatment. Infants placed with foster parents were rated to be at the highest level of neurodevelopmental risk, χ2(4, 865) = 15.82, p < .01. Approximately half of infants who remained at home with their biological parents (54.5%) or who were placed in kinship care (54.7%) were rated as being at a high level of neurodevelopmental risk compared to 69.3% of infants placed with foster parents. Biological parents were significantly younger, had significantly lower incomes, and lower levels of education than both foster parents and kinship providers. It is notable that there were no differences in the home environment among the three groups.
Means, Standard Deviations, and One-Way Analysis of Variance for Demographic and Risk Differences by Placement Type
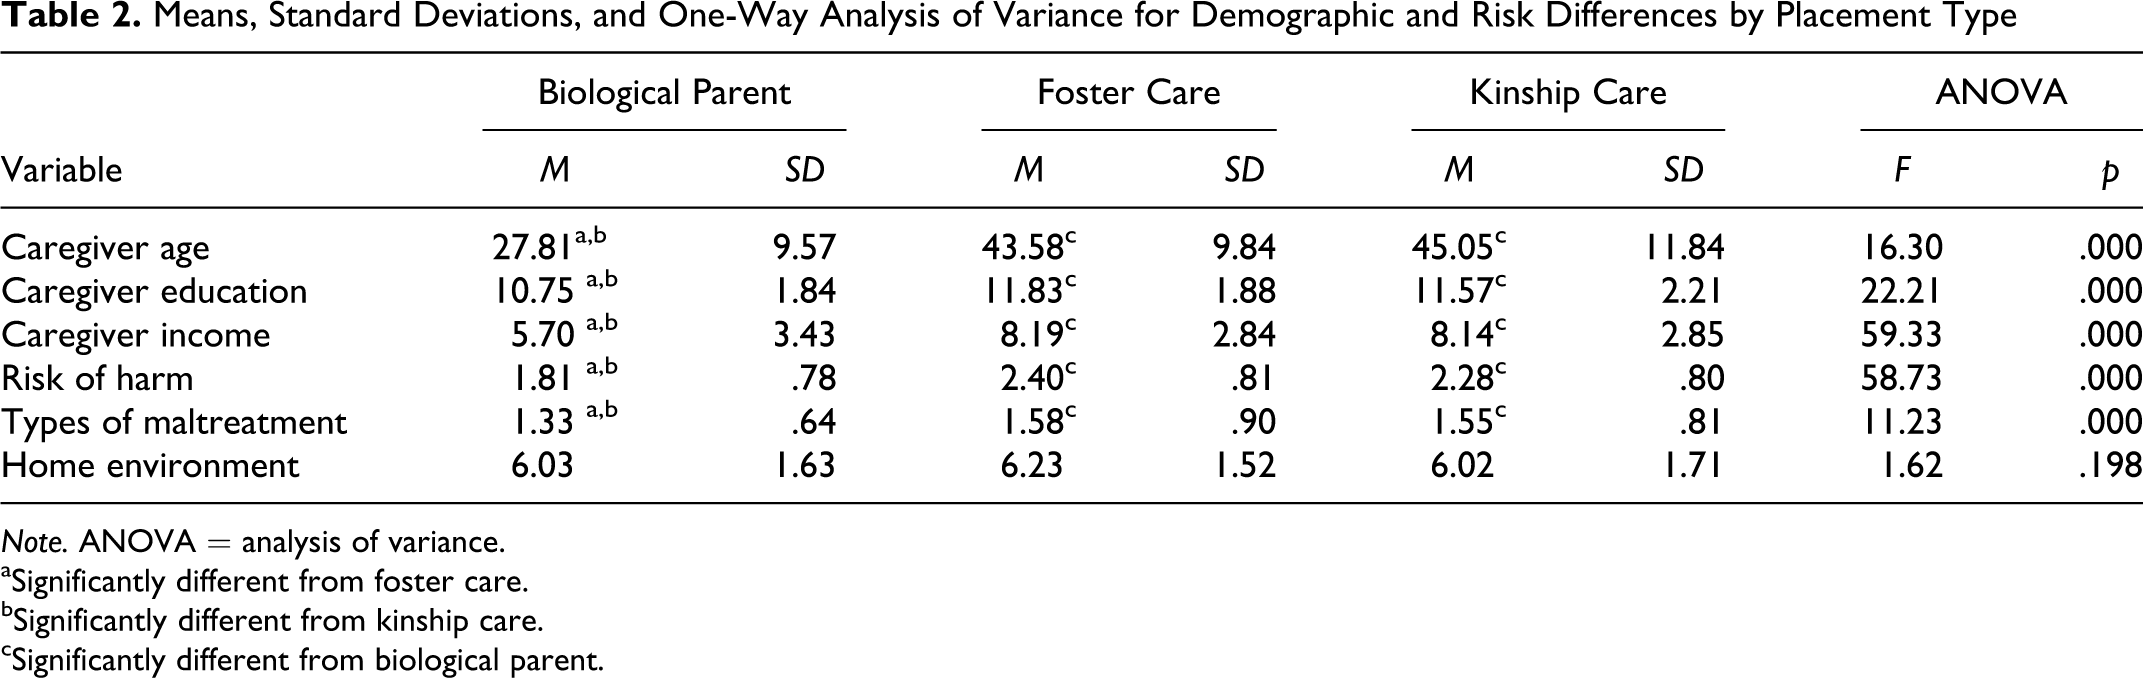
Note. ANOVA = analysis of variance.
aSignificantly different from foster care.
bSignificantly different from kinship care.
cSignificantly different from biological parent.
Demographic and Risk Differences in Children’s Language Abilities
Infants
To assess which variables would be included as predictors in the model, a series of one-way ANOVAs were conducted. Tables 3 and 4 provide means, standard deviations, and results of ANOVAs for infant and caregiver demographic and risk variables for AC and EC, respectively, at each study wave. Results revealed that for AC, girls scored higher at Wave 4.White children scored higher than African American children at Waves 4 and 5. Infants who were at low risk for developmental delay at Wave 1 had significantly higher AC scores at all waves than infants rated as having moderate and high levels of developmental risk. At Waves 3 and 4, AC differed as a function of maltreatment type. Infants who were physically abused had lower AC scores than infants who were neglected. For EC, girls scored higher than boys in Waves 1, 4, and 5. White infants scored higher than African American infants at Waves 1 and 5 and higher than Hispanic infants at Wave 5.
Demographic and Risk Differences in Auditory Comprehension at Each Wave
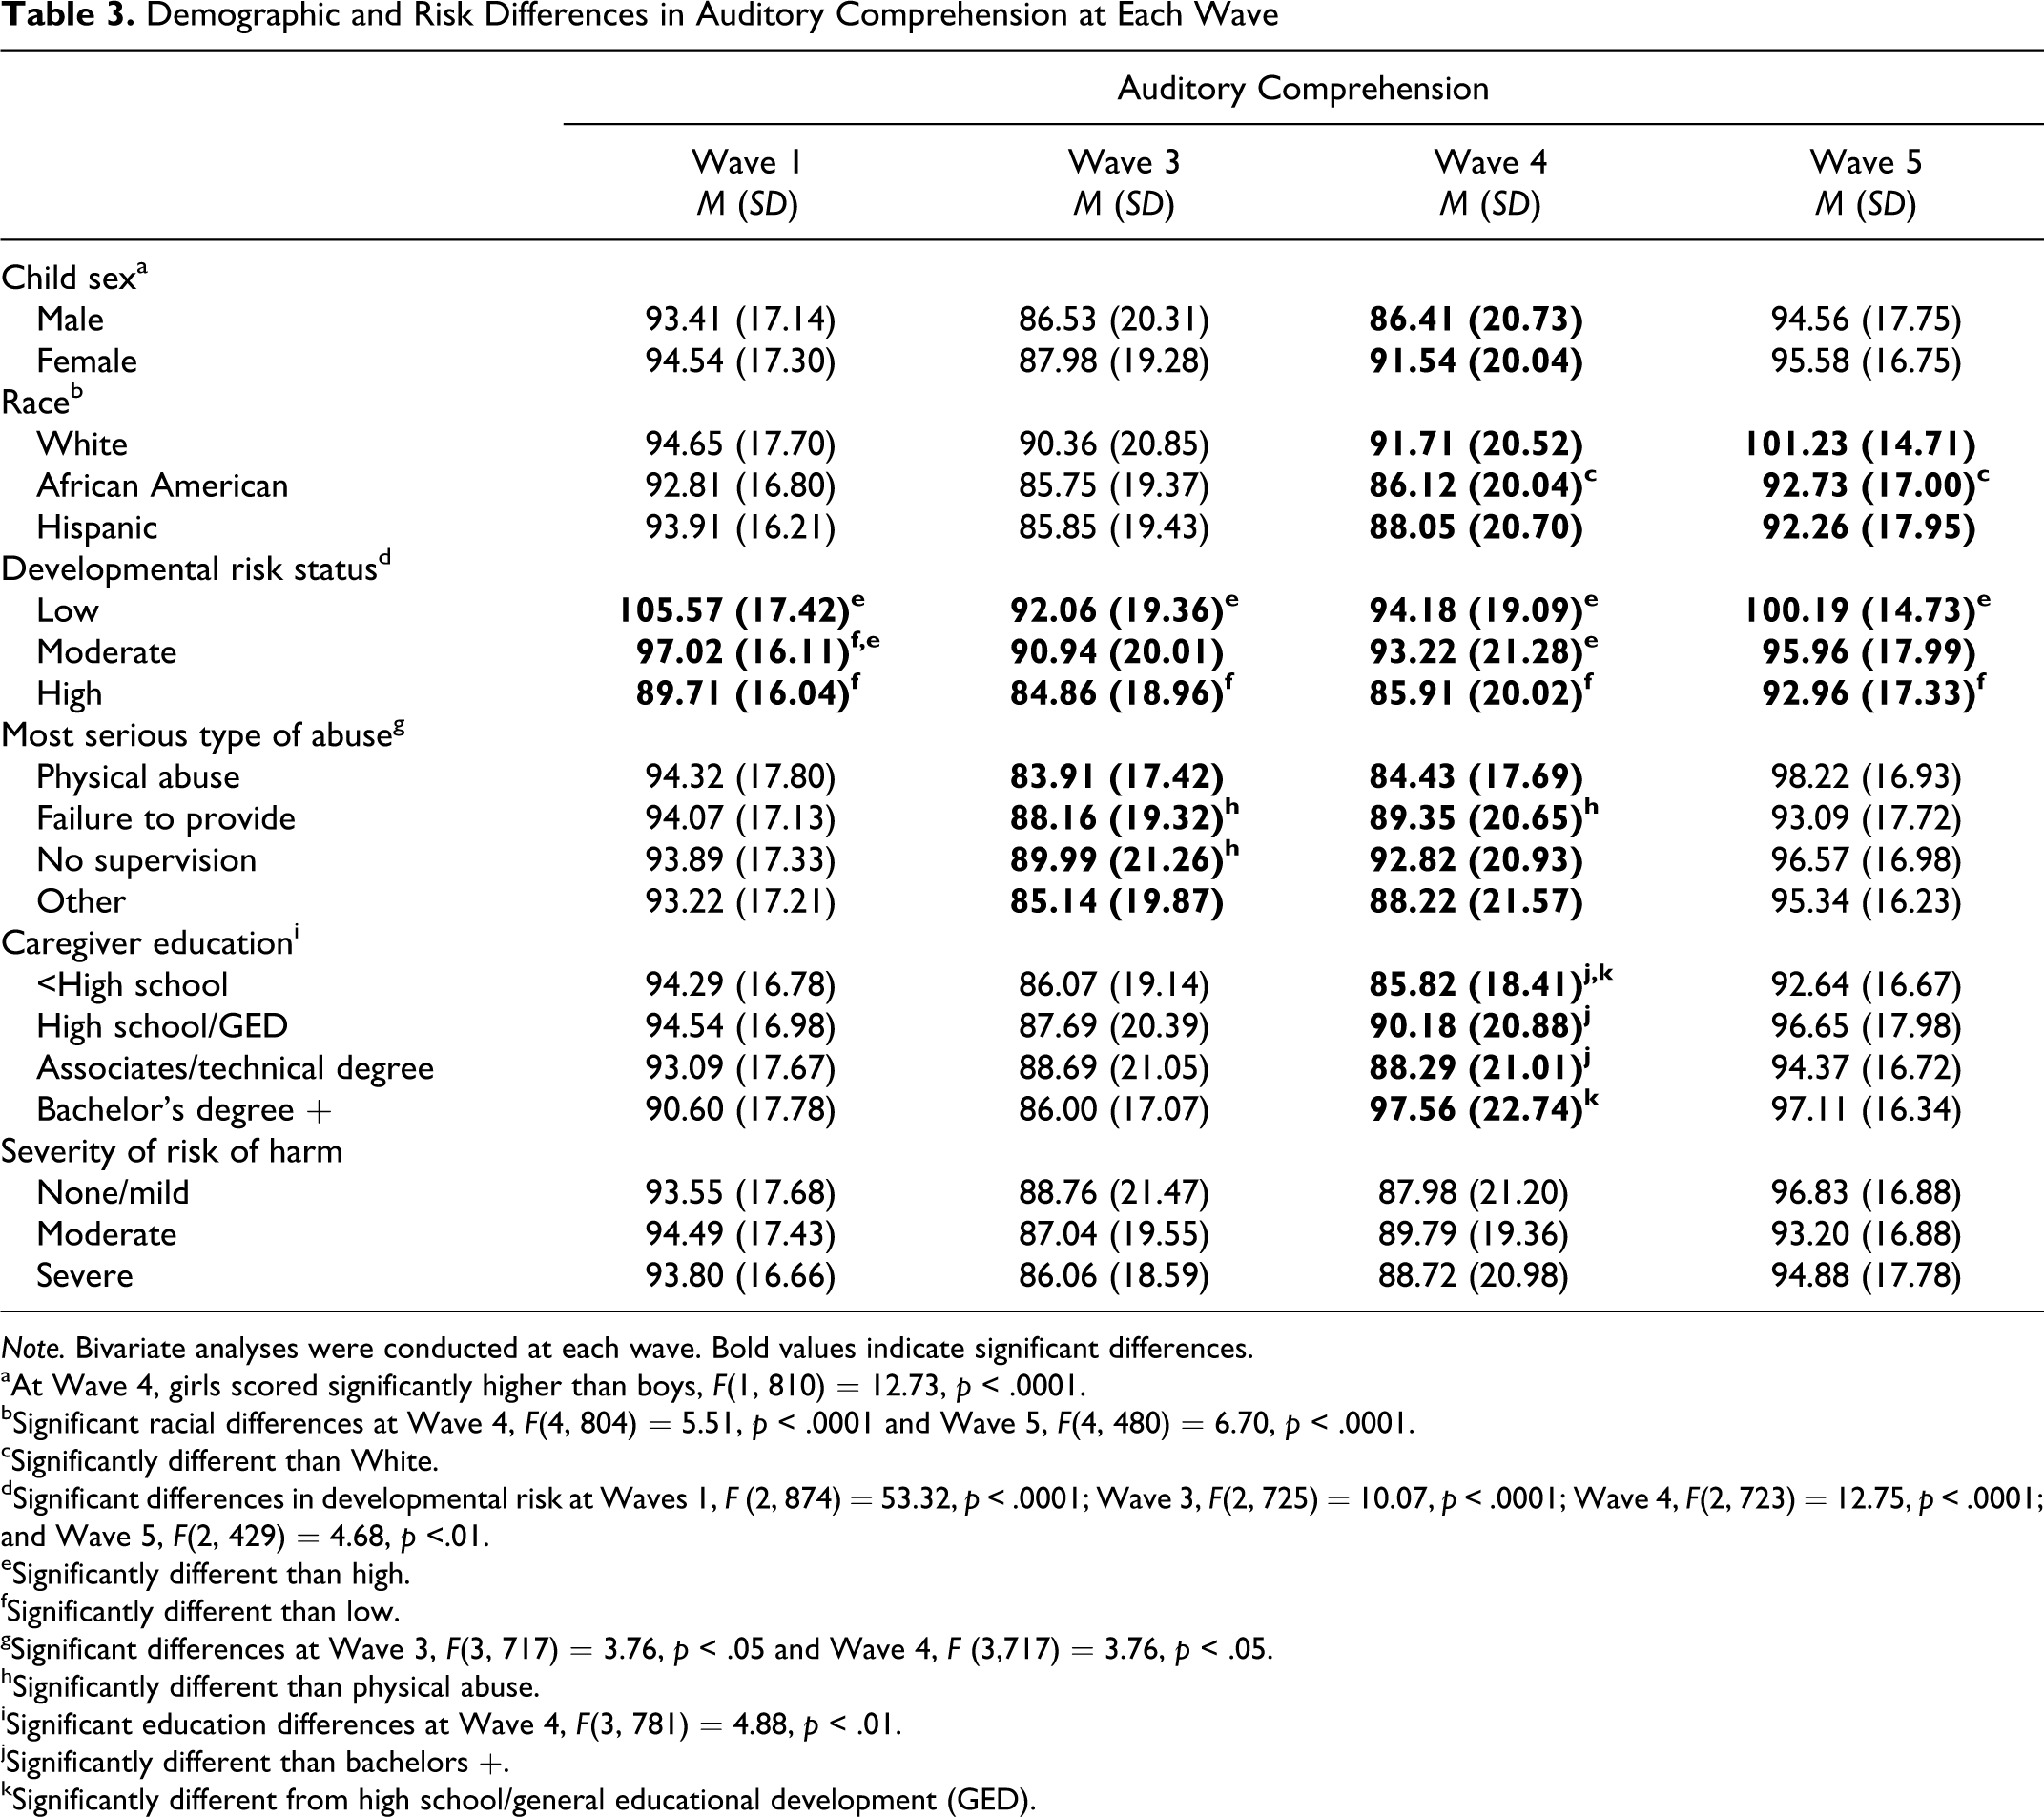
Note. Bivariate analyses were conducted at each wave. Bold values indicate significant differences.
aAt Wave 4, girls scored significantly higher than boys, F(1, 810) = 12.73, p < .0001.
bSignificant racial differences at Wave 4, F(4, 804) = 5.51, p < .0001 and Wave 5, F(4, 480) = 6.70, p < .0001.
cSignificantly different than White.
dSignificant differences in developmental risk at Waves 1, F (2, 874) = 53.32, p < .0001; Wave 3, F(2, 725) = 10.07, p < .0001; Wave 4, F(2, 723) = 12.75, p < .0001; and Wave 5, F(2, 429) = 4.68, p <.01.
eSignificantly different than high.
fSignificantly different than low.
gSignificant differences at Wave 3, F(3, 717) = 3.76, p < .05 and Wave 4, F (3,717) = 3.76, p < .05.
hSignificantly different than physical abuse.
iSignificant education differences at Wave 4, F(3, 781) = 4.88, p < .01.
jSignificantly different than bachelors +.
kSignificantly different from high school/general educational development (GED).
Demographic and Risk Differences in Expressive Communication at Each Wave
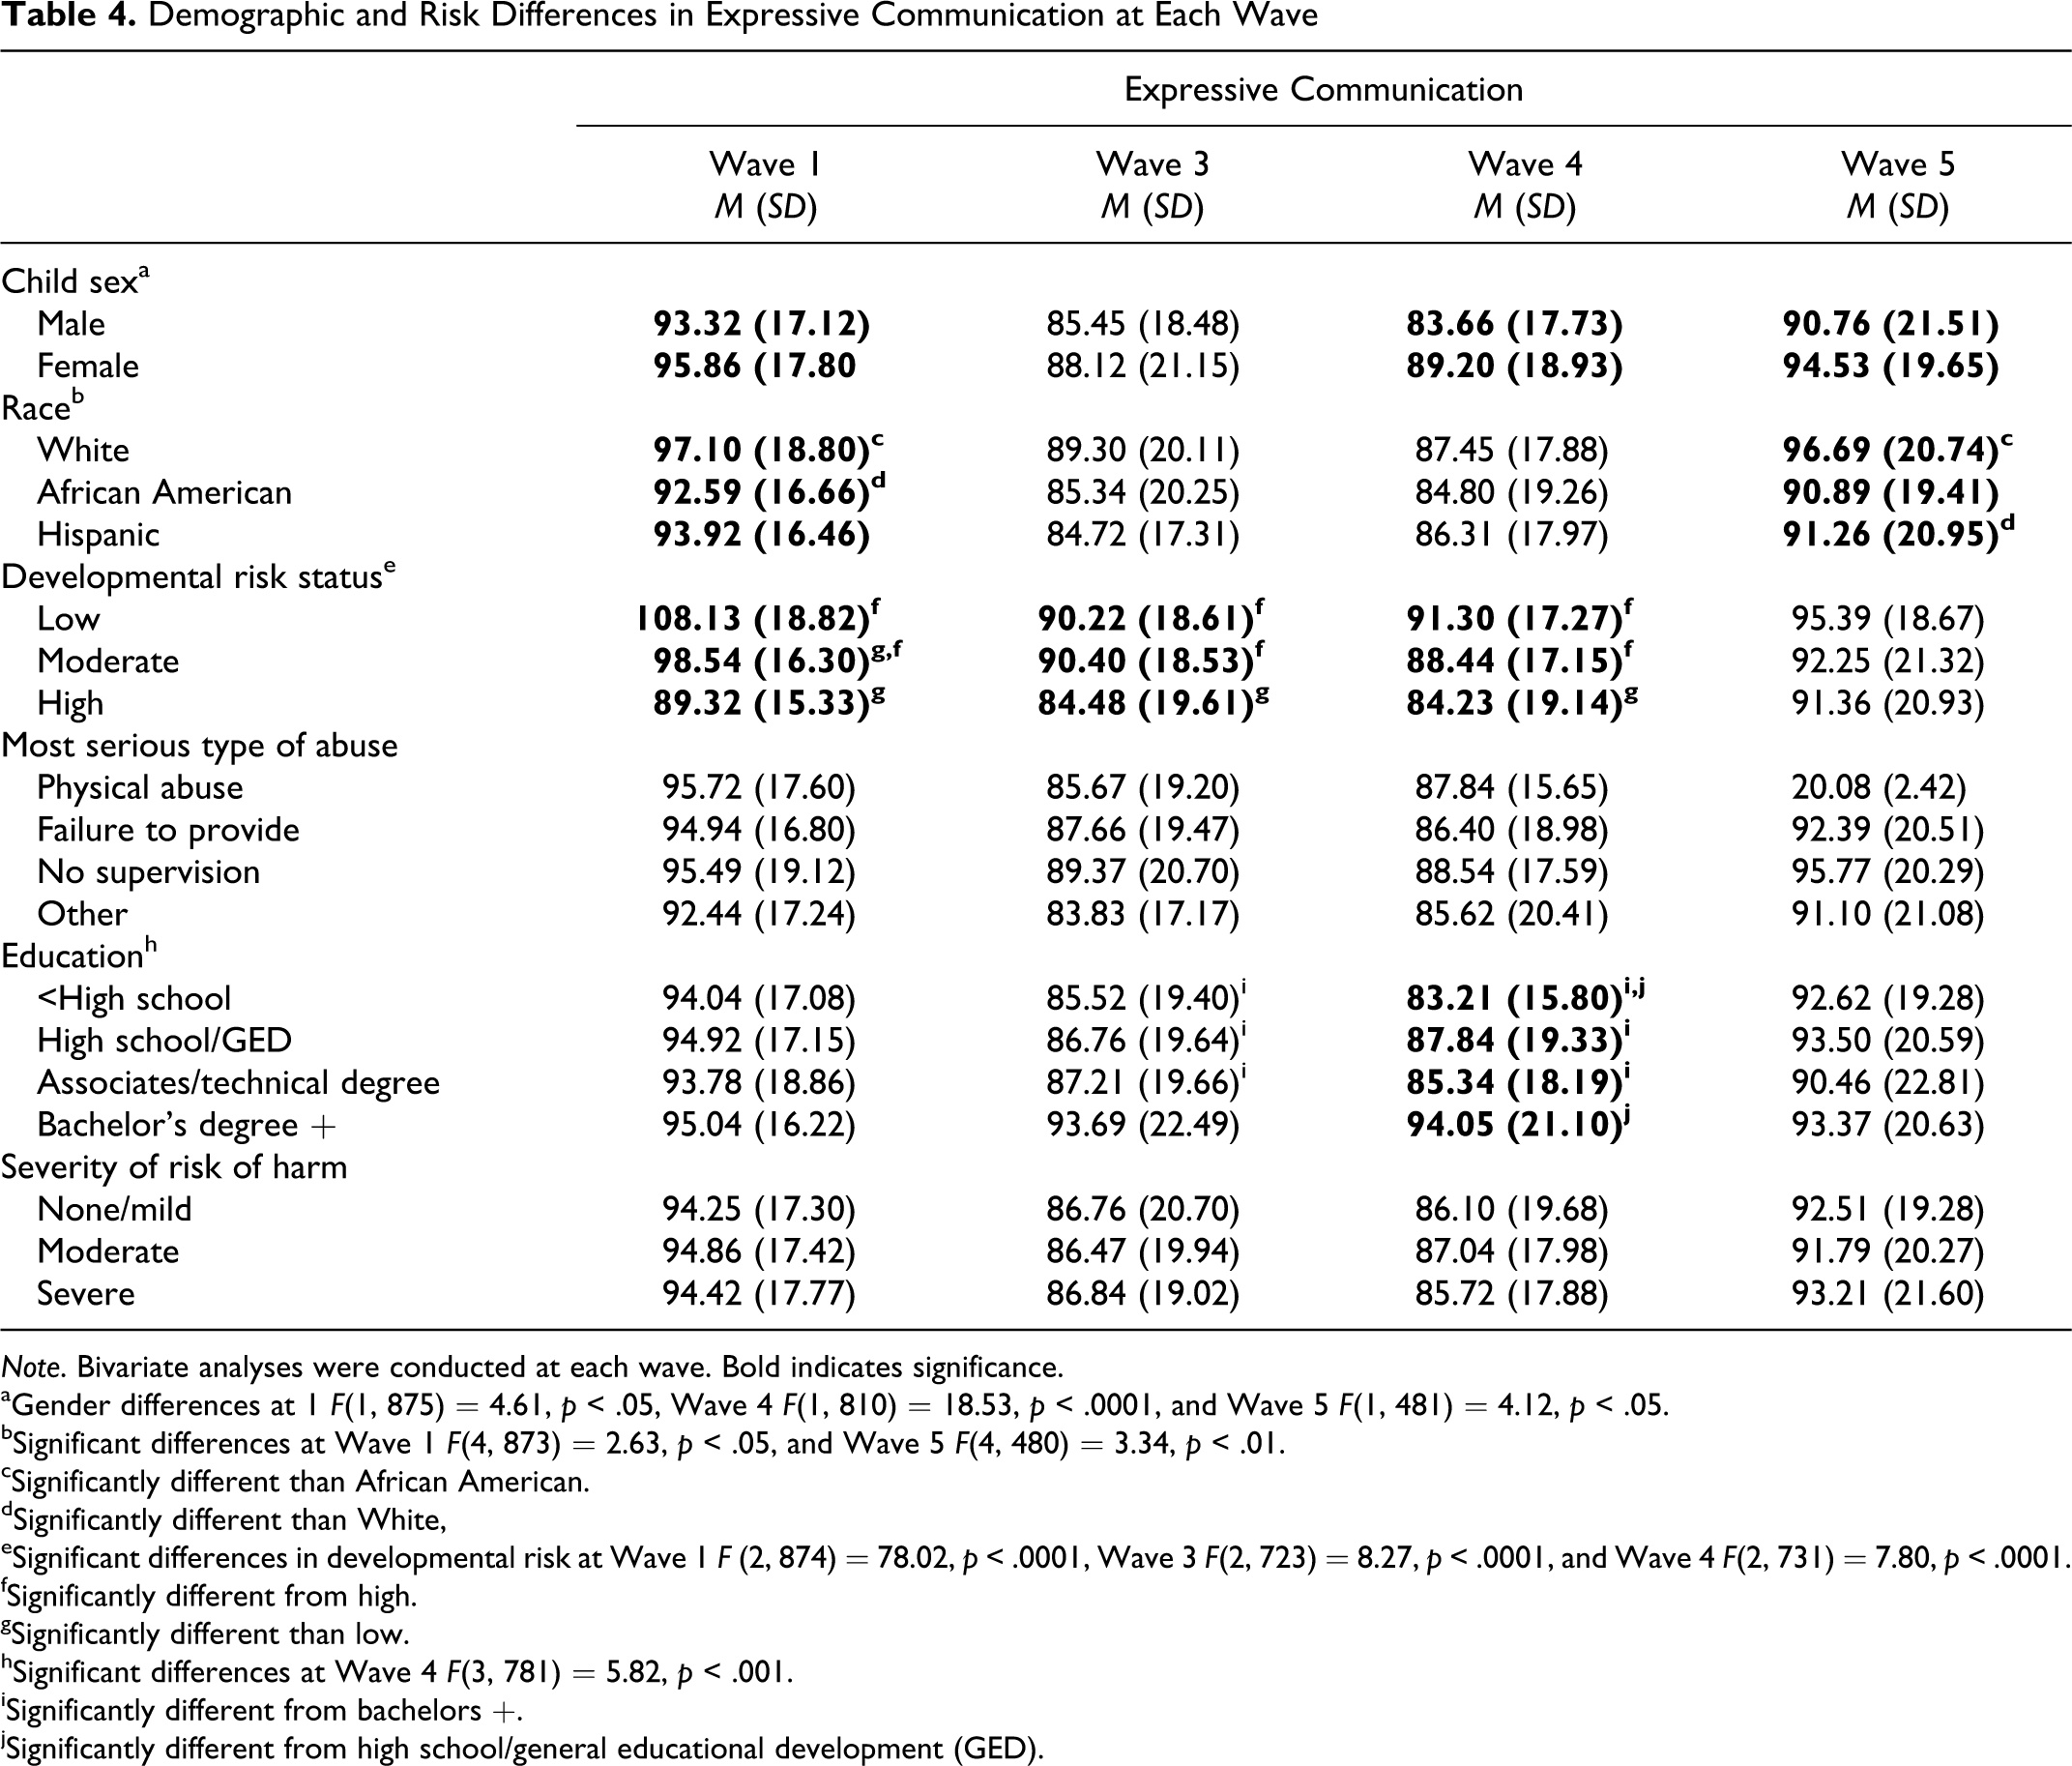
Note. Bivariate analyses were conducted at each wave. Bold indicates significance.
aGender differences at 1 F(1, 875) = 4.61, p < .05, Wave 4 F(1, 810) = 18.53, p < .0001, and Wave 5 F(1, 481) = 4.12, p < .05.
bSignificant differences at Wave 1 F(4, 873) = 2.63, p < .05, and Wave 5 F(4, 480) = 3.34, p < .01.
cSignificantly different than African American.
dSignificantly different than White,
eSignificant differences in developmental risk at Wave 1 F (2, 874) = 78.02, p < .0001, Wave 3 F(2, 723) = 8.27, p < .0001, and Wave 4 F(2, 731) = 7.80, p < .0001.
fSignificantly different from high.
gSignificantly different than low.
hSignificant differences at Wave 4 F(3, 781) = 5.82, p < .001.
iSignificantly different from bachelors +.
jSignificantly different from high school/general educational development (GED).
Caregivers
For AC, infants whose caregivers had a college degree scored significantly higher than all other education groups in Wave 4. Infants whose caregivers earned less than a high school diploma or equivalency scored significantly lower at Wave 4 than those who had earned a diploma or a college degree. For EC, infants whose caregivers had a college degree scored significantly higher than all other education groups in Waves 3 and 4. Caregivers who earned less than a high school diploma or equivalency scored significantly lower than caregivers who had earned a college degree at Waves 3 and 4.
Based on these findings, child sex, race, and developmental risk were included in as covariates in the growth models. Risk of harm was also included in the model because children who were rated by caseworkers as having a low risk of harm at baseline were most likely to remain with biological parents, and children rated as high in developmental risk were most likely to be in foster care. Cognitive stimulation and maternal education were also found to be potential covariates, however, only cognitive stimulation was retained because it was correlated with caregivers highest degree (p < .0001), was correlated with AC at Waves 1–4 (correlations ranged from .11 to .21, p < .01), and EC at Waves 1–4 (correlations ranged from .08 to .20). Cognitive stimulation is also theoretically more proximal to the outcome (Bradley & Corwin, 2002). While income was not associated with language outcomes, it was also included as a predictor in the model because of its association with the placement type.
Change in Auditory Comprehension and Expressive Communication
In order to evaluate the overall shape of the growth trajectories for AC and EC we conducted two unconditional growth models. First, we specified linear growth models. The linear growth model for AC yielded a poor fit to the data (χ2 = 167.88, df = 5, p < .001; comparative fit index [CFI] = .350; root mean square error of approximation [RMSEA] = .184). We therefore added a quadratic term. The intercept was centered at Wave 3 because it improves the estimation efficiency in the case of nonlinear growth (see Mehta & West, 2000). Centering the intercept at the middle wave does not change the parameter estimates or the fit of the model. The quadratic model for AC yielded a significantly better fit (χ2 = 9.67, df = 2, p = .007; CFI = .969; RMSEA = .063) Further, the Bayesian information criterion (BIC) which is a log-likelihood derived index of model fit in which lower values represent a more adequate representation of the data by the model, was 25,557 for the quadratic model, but was 25,695 for the linear model indicating that the quadratic model was preferable. In contrast, for EC the linear model yielded a much better fit (χ2 = 10.36, df = 2, p = .005; CFI = .965; RMSEA = .066). Again the BIC indicated a better fit for the linear model, which had a BIC of 25,573 and the quadratic model BIC was 25,683. Moreover, the AC intercept and linear and quadratic factor variances were significant (σ2 = 106.01, SE = 12.86, t = 2.83), (σ2 = 359.89, SE = 126.97, t = 2.84), (σ2 = 172.16, SE = 56.39, t = 3.07) respectively, as well as for the EC intercept and linear slope factor variances (σ2 = 134.89, SE = 55.28, t = 2.44), (σ2 = 52.01, SE = 19.04, t = 2.73). This suggests that there are significant individual differences in growth trajectories across children.
Growth trajectories for both AC and EC for the total sample and each placement type are depicted in Figures 1 and 2 , respectively. The growth curves for each placement type and the total sample were virtually identical. On average, AC language scores fell below the population mean at each wave. For all groups, AC scores decreased significantly from Wave 1 to Wave 3, remained low at Wave 4 and increased to their original levels at Wave 5. For EC, all groups demonstrated a significant decrease in EC from Wave 1 to Wave 3. Scores remained low at Wave 4 and increased by Wave 5 but remained below the population mean.
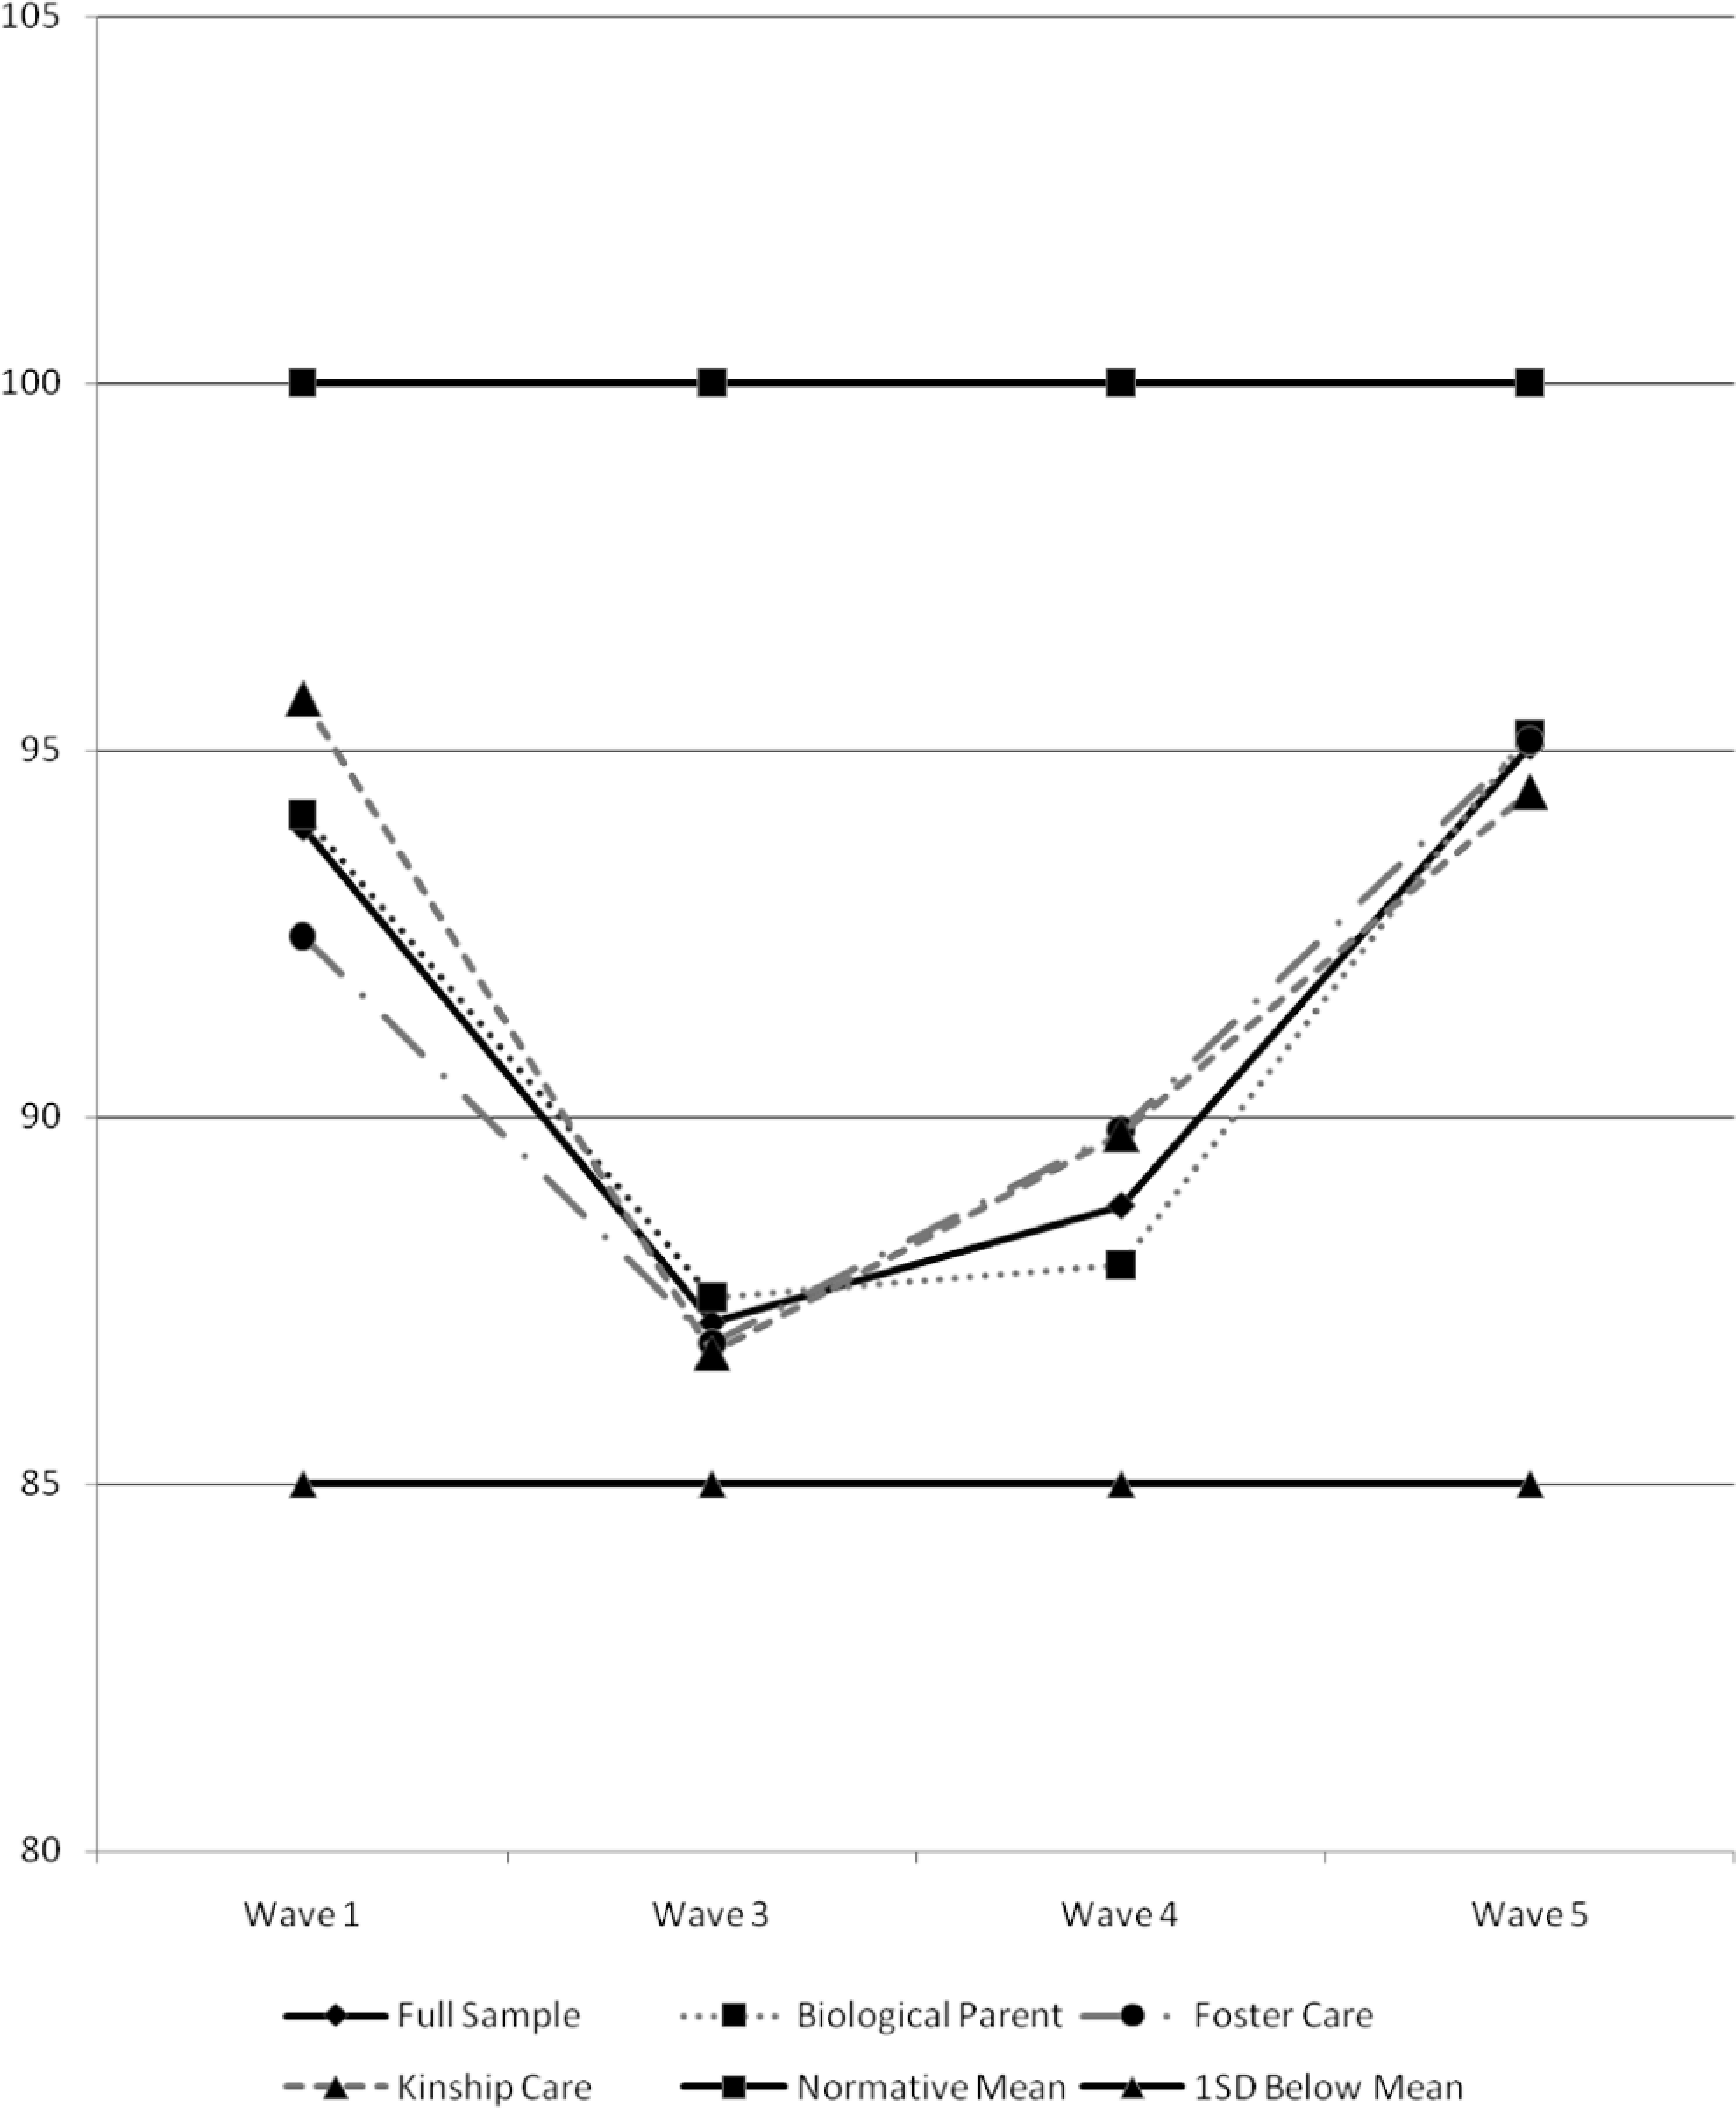
Growth trajectories for auditory comprehension. Note. Lines for normative mean and 1 SD below the mean represent data from the standardization sample.
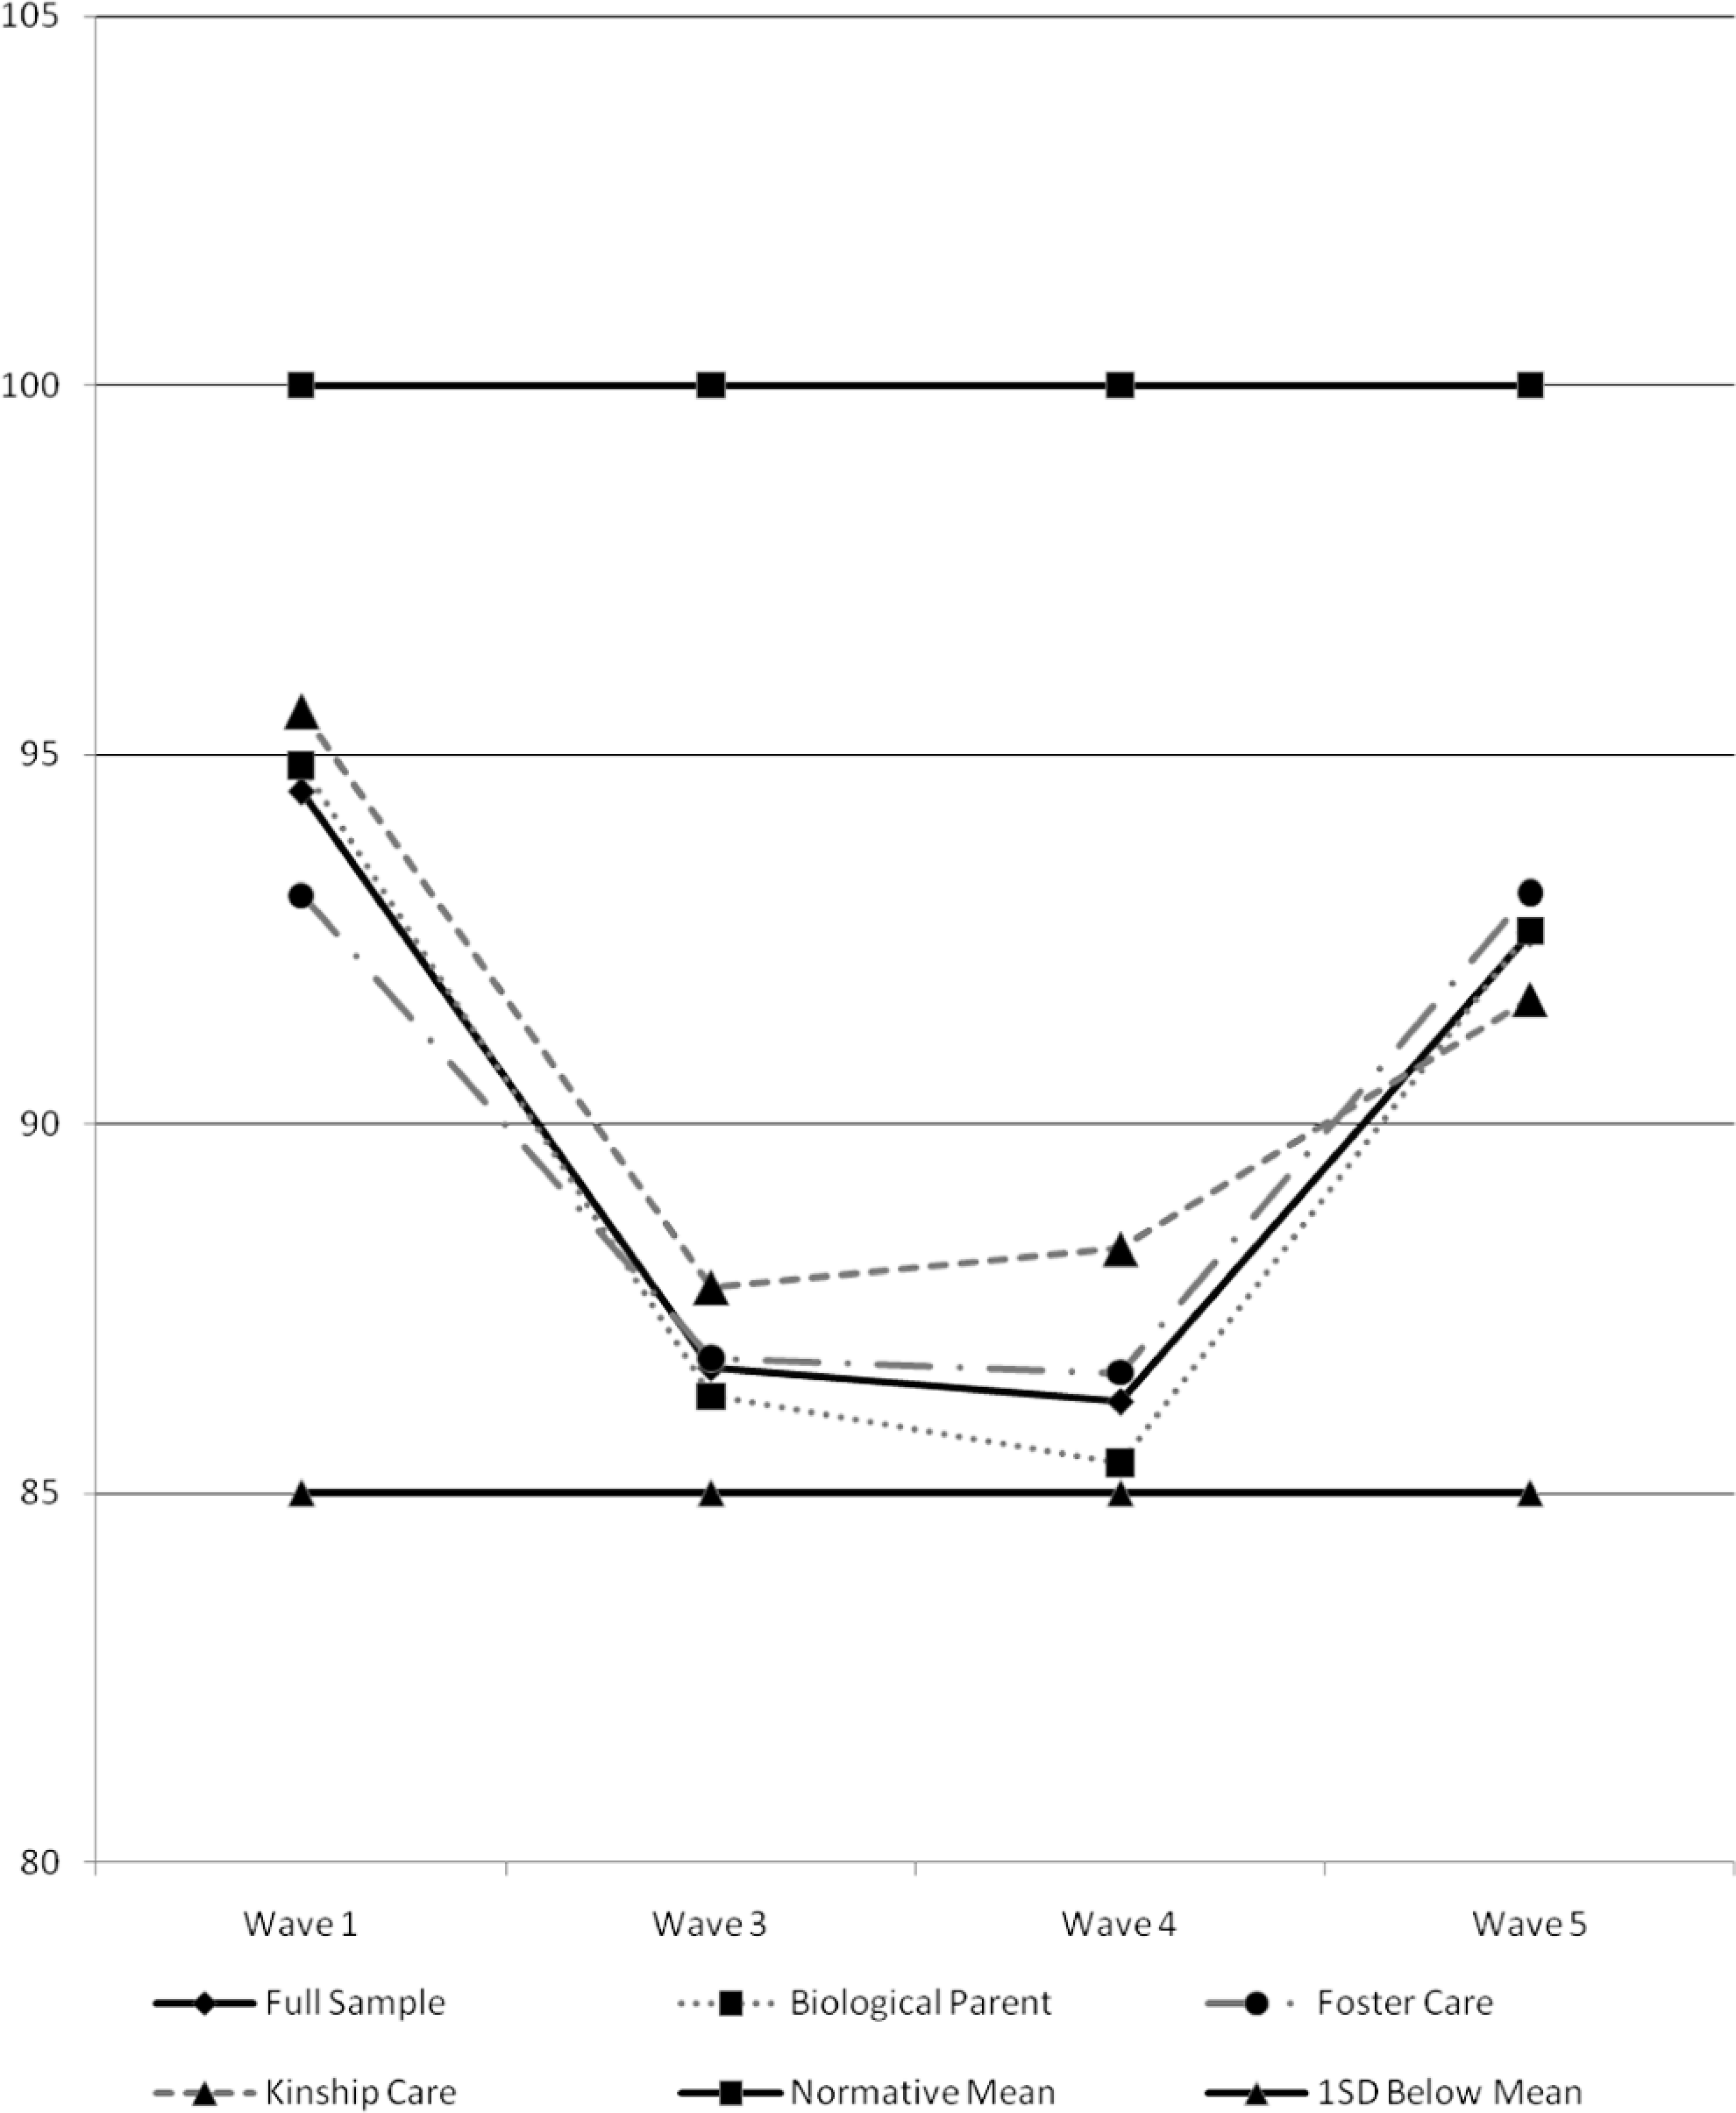
Growth trajectories for expressive communication. Note. Lines for normative mean and 1 SD below the mean represent data from the standardization sample.
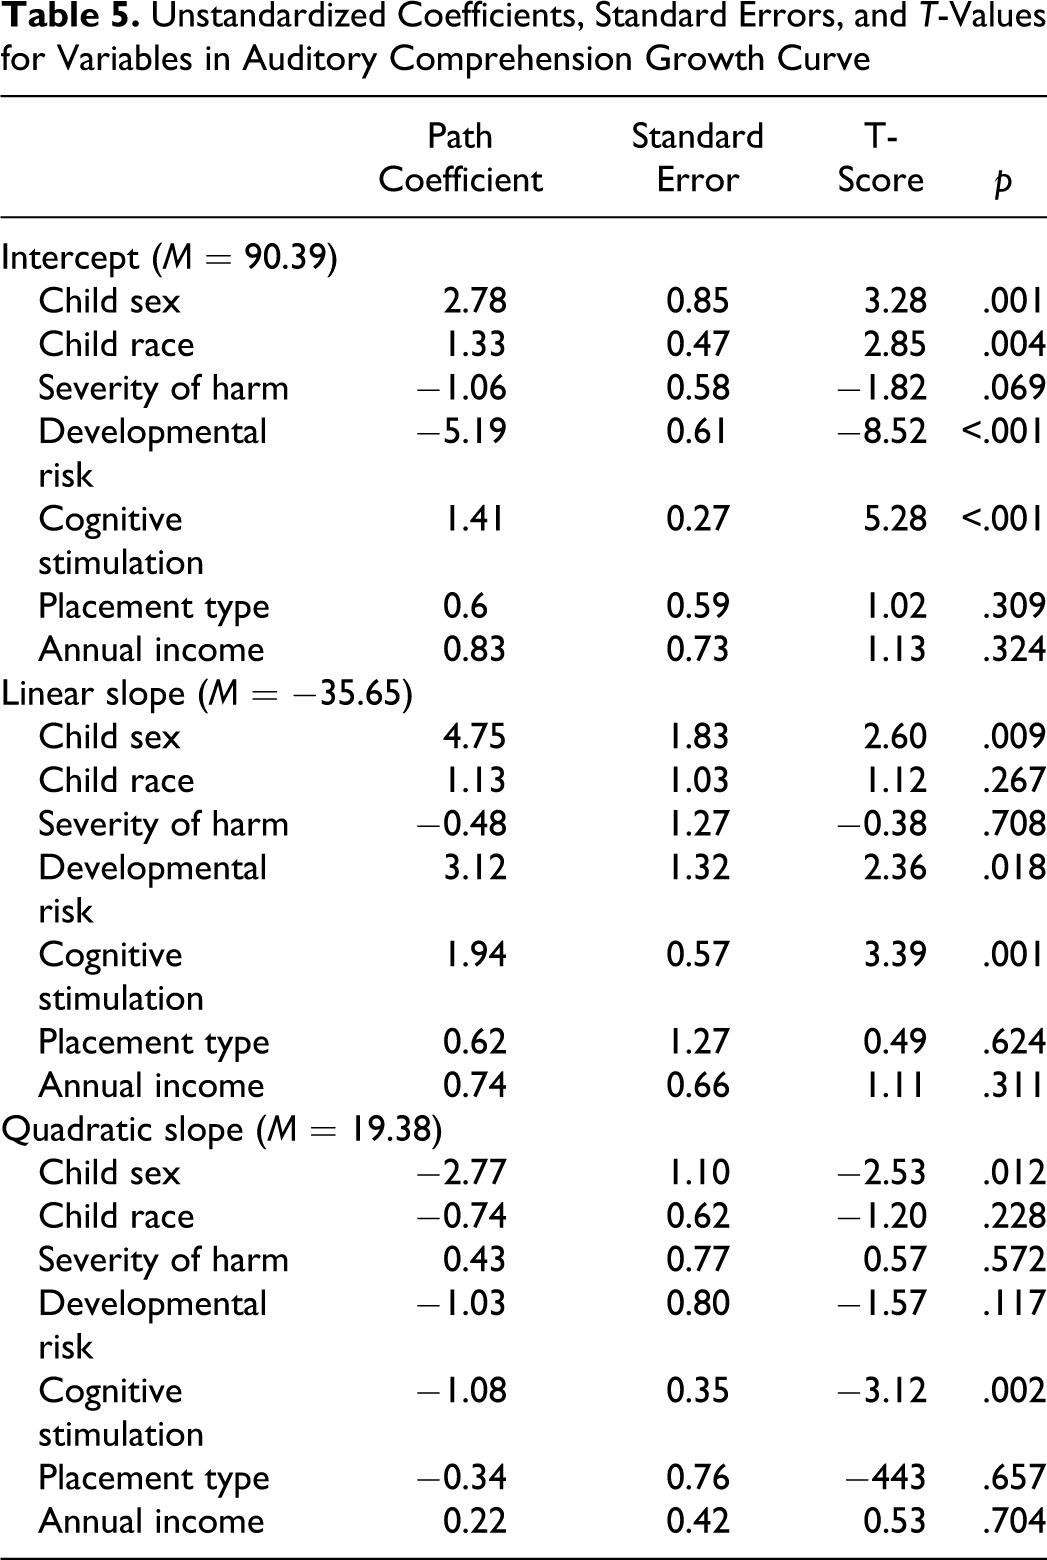
Once the shape of the curve was established, we conducted a second set of analyses in which the intercept, slope, and quadratic parameters were regressed on linear and quadratic slope variances. In addition to placement type, child sex, race, developmental risk, severity of risk of harm caregiver income, and cognitive stimulation in the home environment were used as predictor variables. These models fit the data well for both AC (χ2 = 39.51, df = 8, p < .001; CFI = .925; RMSEA = .064) and EC (χ2 = 16.41, df = 6, p = .01; CFI = .976; RMSEA = .042).The parameter estimates for each of the predictors in the model are listed in Tables 5 and 6 for AC and EC, respectively. For AC, child gender, race, developmental risk, and cognitive stimulation all accounted for significant variance in the intercept. Girls were more likely to have higher AC skills at Wave 3 as were White children. Lower levels of developmental risk and higher levels of cognitive stimulation were associated with greater Wave 3 AC scores. Child gender, developmental risk, and cognitive stimulation accounted for significant variance in AC linear slopes. As such, girls had a higher rate of AC development as did children with greater cognitive stimulation and, counter intuitively, children with higher developmental risk levels. It may be that the children at the highest developmental risk received greater services around language development and were able to develop AC skills at a faster rate than their higher functioning and lower risk peers. Finally, girls displayed a lower degree of curvature (i.e., more linear growth) in AC relative to boys. Further, higher levels of cognitive stimulation were also associated with less curvature in auditory growth. It seems that girls and children with greater cognitive stimulation continue to make gains in AC skill across the developmental periods sampled rather than peaking and leveling off.
Unstandardized Coefficients, Standard Errors, and T-Values for Variables in Auditory Comprehension Growth Curve
Unstandardized Coefficients, Standard Errors, and T Values for Variables in Expressive Communication Growth Curve
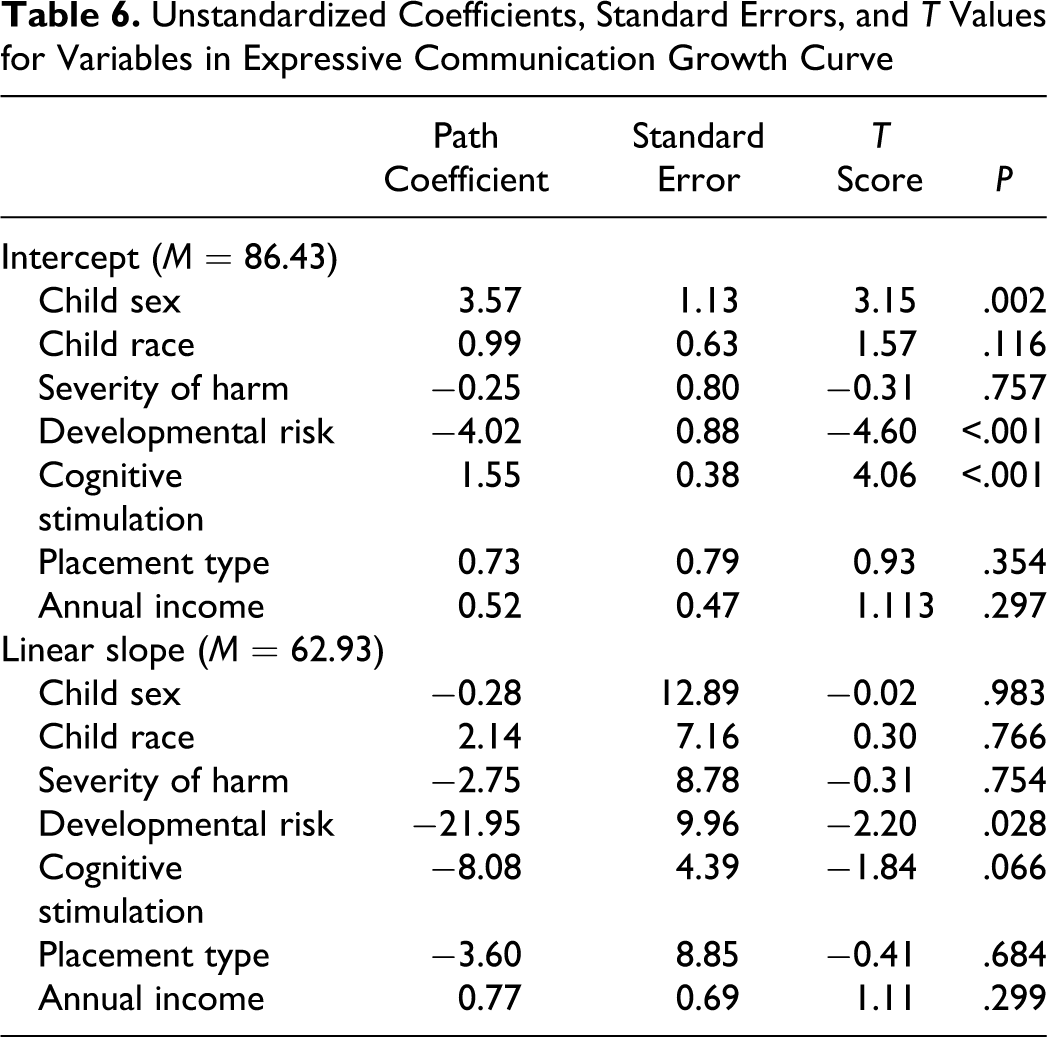
For EC, gender, developmental risk and cognitive stimulation accounted for significant variance in the intercept, indicating that girls had a higher level of EC at Wave 3 as did those children with lower levels of developmental risk and higher levels of cognitive stimulation. With respect to the linear slope, developmental risk accounted for significant variance. This indicates that those with higher levels of developmental risk have a lower growth trajectory for EC. Cognitive stimulation in the home trended towards significance, but given the sample size we would not feel comfortable interpreting such a small effect.
Discussion
Consistent with our hypotheses, results of the growth curve analyses revealed that maltreated children’s average AC and EC scores fell below the population mean at each wave of the study. These findings are generally consistent with those reported in several smaller cross-sectional studies of the effects of maltreatment on multiple aspects of language functioning (Beeghly & Cicchetti, 1994; Coster et al., 1989; Culp et al., 1991; Eigsti & Cicchetti, 2004; Hildyard & Wolfe, 2002; Katz, 1992). However, because all children in the present study had experienced maltreatment, it is not possible to determine whether children’s dampened language scores reflect the effects of maltreatment per se or the presence of familial sociodemographic risk factors. Maltreatment is more likely to occur among families at higher sociodemographic risk (e.g., Kotch et al., 1999; McLoyd, 1998; Wu et al., 2004) and the majority of families in the present sample were from low socioeconomic backgrounds.
It is notable that, for children in each placement type, mean scores for both AC and EC decreased significantly by Wave 3, when children were approximately 2 years old, and remained at the same low level at Wave 4, when children were approximately 3 years old. Given that children’s language skills typically burgeon at these ages (Bates, O’Connell, & Shore, 1984), these findings may suggest that the home environments of children in each placement type failed to provide adequate support for fostering optimal language development. These findings are also consistent with prior reports indicating that many maltreated children placed in nonparental care continue to exhibit developmental problems and that subtle forms of maltreatment, which may not lead to removal from parental care, result in negative developmental consequences (Blair, 2010; Bugental, Martorell, & Barraza, 2003). Unfortunately, children identified by the child welfare system are seldom tested for delays and do not receive services (Robinson & Rosenberg, 2004), despite mandates from the federal Keeping Children and Families Safe Act of 2003 (PL 108-36). This act requires states to make provisions for referral of a child under 3 years old, who is involved in a substantiated case of child maltreatment, to early intervention services funded under Part C of the Individuals with Disabilities Education Act of 1990 (IDEA, 21 USC § 106 [b] [2] [A]). The aim of Part C services is to support and enhance the development of infants and toddlers and to minimize the potential for developmental delay. Infants who are referred to Part C services receive a developmental assessment and an Individualized Family Service Plan (IFSP), that details the goals of the intervention and services that will be provided. Depending on the results of the developmental assessment, children may be monitored for developmental delay. Children whose development is determined to be delayed are entitled to services.
One reasons for the decrease in language skills among children in all placements may be that they were not referred for Part C services. Using NSCAW data, Casanueva, Cross, and Ringeisen (2008), found that only 12.7% of children in need of Part C services received an IFSP and only 11.7% had an IFSP between baseline and the 1-year follow-up. Further, infants and toddlers most likely to receive a referral to Part C services were those with an established medical condition. Only 9.7% of infants and toddlers with a developmental delay at baseline had an IFSP by the 1-year follow-up.
While the trajectories of AC and EC did not differ by placement site, variations within placement variables were associated with the language trajectories. Gender and developmental risk were associated with growth trajectories of AC and EC. Girls demonstrated higher AC and EC scores at baseline and a higher rate of auditory language development, consistent with findings from Huttenlocher, Haight, Bryk, Seltzer, and Thomas (1991) and Zubrick, Taylor, Rice, and Slegers (2007). Developmental risk at baseline also predicted differences in variations in both AC and EC. Consistent with other reports, children with higher levels of developmental risk demonstrated a lower EC growth trajectory (Aylward &Verhulst, 2000). Interestingly, children with higher levels of developmental risk demonstrated a higher rate of AC growth. Perhaps, these children had an established condition and were referred for services that supported their development. Cognitive stimulation scores were also significant predictors of more optimal auditory language performance for children. These findings are consistent with findings from many studies highlighting the important role of proximal caregiving factors in supporting children’s positive developmental outcomes (Huttenlocher, Haight, Bryk, Seltzer, & Thomas, 1991; Kelly et al., 1996; McLoyd, 1998; Roberts et al., 2005).
Interestingly, children’s language scores returned to baseline levels by Wave 5, when children were nearly 6 years old. Although children’s average scores were still below the population mean at this age, this improvement between Wave 4, when the children were approximately 3 years old and Wave 5 is encouraging and may reflect the positive influence of preschool and formal schooling in supporting these high-risk children’s language development. For example, classroom quality is associated with children’s development of language skills (Burchinal et al., 2000; Mashburn et al., 2008) and AC in kindergarten is positively correlated with quality teacher–child interactions in preschool (Bryant, Peisner-Feinberg, & Clifford, 1993). Furthermore, children’s language delays are often recognized by teachers, who refer children for testing and services, which can foster development.
The findings from this study must be considered in light of several limitations. First, because the nature of this study is descriptive, findings are not indicative of a causal effect. There is also no measure of the onset of formal schooling or services that children actually received while in care. Entry into formal schooling could have influenced services that children received from the school district which could have influenced their language performance. Finally, cognitive stimulation in the home environment, in this study, was only assessed at Wave 1. While there was a relatively low level of changes in placement, changes in the quality of the environment at later waves may have influenced development. Other studies have found that changes in the quality of the home environment in the preschool period are associated with changes in language development at school entry (Son & Morrison, 2010). Our decision to use cognitive stimulation at Wave 1 was based on preliminary analyses which suggested that the duration of out-of-home placement was not associated with language at any wave of development and that cognitive stimulation was significantly correlated across waves, suggesting relative stability in quality of the home environment.
Despite these limitations, this research is among the first to assess language trajectories of young maltreated infants and to determine whether trajectories differ by placement type. The findings have useful practice implications. First, all infants who come into contact with the child welfare system and have substantiated cases of maltreatment should be referred to Part C services and have their development monitored. Infants, regardless of where they are placed, need caregivers who provide home environments that not only keep them safe, but that also support their developmental needs. Infants need their caregivers to talk to them (Huttenlocher et al., 1991; Tomasello, Mannie, & Kruger, 1986), read to them (Roberts et al., 2005; Skibbe et al., 2006), and respond sensitively to their physical and emotional needs (Dozier, Stovall, Albus & Bates, 2001; Stovall & Dozier, 2000). All caregivers, regardless of placement type should be offered services to help them support the needs of the infants. Finally, practitioners should make every effort to refer infants in need of childcare to high-quality programs that have a low caregiver-to-infant ratio, a low caregiver turnover rate and caregivers who have special training in infant development and are sensitive to the needs of very young children. Whenever possible, child care should be centrally located to the foster/kinship and biological families so that if the infant returns home they can remain in the same child care placement. Research suggests that high-quality childcare is related to language development in preschool and moderates the effect of income on school readiness skills (Dearing, McCartney, & Taylor, 2009; NICHD Early Child Care Research Network, 2000). Furthermore, research suggests that maltreated children enrolled in low-quality infant care perform significantly worse than nonchild welfare children enrolled in the same classrooms (Katz, Dinehart, Ullery, & Kaiser, 2009).
In sum, when a child is maltreated, the child welfare system is charged with ensuring that she or he is safe while in the state’s care. If a child must be removed from a parent’s care to keep him or her safe, the state places the child outside of the home with a caregiver who can protect him or her from further maltreatment. They also provide biological parents with services so that if the child returns home she or he will not be maltreated. The state must also make every effort to place a child in a home that will remain consistent and to find a child a permanent home within a timely fashion. They are also required to foster child well-being. Unfortunately, the indicators of child well-being required by the government do not include age appropriate development, rather they include ensuring that families have the capacity to provide for children’s needs and that children receive appropriate services to meet educational, physical, and mental health needs. In this study, we found that the language development of the maltreated infants, in this sample, was below the population mean throughout the duration of the study and decreased significantly during their first 18 months in the state’s custody. It is likely that, within each placement type, there are groups of children whose development declines while in care, improves while in care, remains at risk or remains typical while they are in care. Future studies should try to determine which factors contribute to changes in developmental skills so that children’s well-being is supported while in the state’s custody.
Footnotes
This study was supported by the Wayne State University Research Grant Program. This document includes data from the National Survey on Child and Adolescent Well-Being (NSCAW), which was developed under contract with the Administration on Children, Youth, and Families, U.S. Department of Health and Human Services (ACYF/DHHS). The data have been provided by the National Data Archive on Child Abuse and Neglect. The information and opinions expressed herein reflect solely the position of the author/authors. Nothing herein should be construed to indicate the support or endorsement of its content by ACYF/DHHS.
The author(s) declared no potential conflicts of interest with respect to the research, authorship, and/or publication of this article.
The author(s) received no financial support for the research, authorship, and/or publication of this article.