
Abstract
Mobile health (mHealth) interventions use mobile technology (tablets and smartphones) delivery platforms for interventions to improve health outcomes. Despite growing acceptance, there is little understanding of how consumers engage with and adhere to mHealth interventions. This study analyzes usage data from the intervention arm (n = 42) of a randomized clinical trial testing the efficacy of the ezPARENT program and provides recommendations for using engagement and adherence metrics. Engagement was measured by parent usage (duration, frequency, and activity) of ezPARENT and adherence using an adherence index (the sum of individual modules completed, number of visits to ezPARENT, and maximum time between visits). Parents spent M = 37.15 min per module and had M = 13.55 program visits in the 3-month intervention period. Parents visited the program over a period of M = 69.5 days and completed 82% of the modules. These data provide support that parents will use intervention programs delivered digitally; engagement and adherence metrics are useful in evaluating program uptake.
According to the U.S. Department of Health and Human Services [USDHHS], children younger than 3 years old are at greatest risk of maltreatment (USDHHS, 2015). Additionally, 80.3% of the agents of maltreatment were parents (USDHHS, 2012). Research suggests that, by strengthening parenting skills and helping parents develop effective child management strategies, parent training (PT) programs can deter maltreatment and abuse of children (Altafim & Linhares, 2016; Child Welfare Information Gateway, 2011). PT programs that focus on increasing parent knowledge, managing stress, and improving parent–child relationships and child behavior may result in a reduction in child abuse and maltreatment (Altafim & Linhares, 2016; Barth, 2009; Self-Brown & Whitaker, 2008; Shannon, 2003). Providing strategies that emphasize nonabusive management techniques help improve communication and encourage more positive parent interactions with their child (Shannon, 2003). In their review, Altafim and Linhares (2016) reported that parenting programs resulted in reductions of the use of harsh words, physical discipline spanking, and the rate of hitting children with objects; lower rates of psychologically and physically aggressive behavior toward children; and a decrease in harsh parenting and negative discipline. Due to low parent participation rates in traditional face-to-face PT interventions, researchers and practitioners are beginning to use mobile devices (tablets and smartphones) as a delivery mechanism to provide on demand and flexible access to programs (Baumel, Pawar, Kane, & Correll, 2016; Breitenstein, Gross, & Christophersen, 2014; Self-Brown & Whitaker, 2008; Shorey, Ng, Danbjørg, Dennis, & Morelius, 2017).
Mobile health (mHealth) interventions use mobile technology (e.g., tablets and smartphones) as delivery platforms for interventions to improve health outcomes. mHealth interventions represent a promising and efficient mechanism to provide interactive and comprehensive behavior change interventions that address individual and health system barriers associated with face-to-face delivery (Ritterband et al., 2003; Tate, Finkelstein, Khavjou, & Gustafson, 2009), including geographic, logistic, and implementation challenges (Breitenstein et al., 2014). In addition, mHealth PT programs are beginning to show positive effects and high levels of parent satisfaction with the delivery methods (Breitenstein, Fogg, Ocampo, Acosta, & Gross, 2016; Shorey et al., 2017). Baumel, Pawar, Kane, and Correll (2016) reported that digital PT programs resulted in improvements in child behavior, parent behavior, and parenting self-efficacy.
Despite the growing acceptance of mHealth interventions, there is little understanding of how consumers engage with and adhere to these interventions (Eapen & Peterson, 2015; Greenspun, Coughlin, & Chang, 2014). A systematic review of digital delivery of PT interventions found that research reports of programs lacked a standardized approach to collection and analysis of usage data (Breitenstein et al., 2014). Of the 11 studies reviewed, 6 depended on parent self-report, 2 reported using an electronic tracking method, and the remaining studies did not provide a clear description of usage data collection (Breitenstein et al., 2014). To our knowledge, this is the first study to present a comprehensive assessment and description of methods for analyzing data of participant usage of a mobile PT intervention. This is important, because to understand parent engagement in mHealth interventions, we need to develop reliable and valid methods for evaluating program usage metrics.
mHealth Usage Metrics
Digital tracking data provide important information about parent interaction with the intervention, specifically how and when parents use the program and what content they access. Comprehensive analysis of usage metrics will expand our knowledge related to participant engagement and adherence as well as program effectiveness. Therefore, it is important for digital PT programs to adopt standardized approaches.
Labrique, Vasudevan, Kochi, Fabricant, and Mehl (2013) highlighted a need for intervention outcome assessment and empirical evidence supporting the use of mHealth interventions to inform implementation and uptake. Usage metrics include individual engagement and adherence to mHealth interventions. For example, usage metrics may include frequency of use, module and activity completion, time, and repeat activity (Donkin et al., 2013). However, there is a lack of consensus of engagement metrics with mHealth interventions and models of analytic strategies for evaluation (Ritterband, Thorndike, Cox, Kovatchev, & Gonder-Frederick, 2009). The purpose of this study was to describe usage data from the intervention arm of a randomized controlled trial (RCT) testing the efficacy of ezPARENT—a tablet-based PT intervention—and provide recommendations for using engagement and adherence metrics for mHealth interventions.
Engagement
Engagement is the level of activity within an mHealth intervention (Donkin et al., 2013). Level of activity includes the number of total modules or activities completed and the number of program log-ins (Donkin et al., 2013). Although engagement usage metrics are stored in mHealth interventions, they are frequently unreported (Donkin et al., 2013). Previous studies have measured engagement in mHealth interventions solely based on participant attrition (e.g., the proportion who do not complete the study or who do not provide follow-up data; Donkin et al., 2013). However, attrition alone limits the ability to quantify levels of exposure required to understand an individual’s interaction with program content. Focusing on individual interaction with program components allows comprehensive evaluation and a usage measure to relate to health outcomes. Expanding the concept of engagement to include duration, frequency, and activity provides measurable, objective, and meaningful information of individual navigation in an mHealth intervention.
Adherence
Adherence is the extent to which the user’s activity matches the mHealth program’s intended use as defined by program developers (Donkin et al., 2013; Kelders, Bohlmeijer, & Van Gemert-Pijnen, 2013; Van Gemert-Pijnen, Kelders, & Bohlmeijer, 2014). Adherence usage metrics provide data about patterns of use of an mHealth program. Adherence metrics allow for comparison of actual use and uptake of the intervention to that intended. Analysis of adherence and program outcomes can inform future intervention adaptations (Ritterband et al., 2009). In addition, this knowledge can be applied universally to mHealth programs spanning diverse behavior change interventions. ezPARENT—one of the first digitally adapted tablet-based PT programs—tracks all aspects of engagement generated by each parent enrolled in the program (Breitenstein et al., 2016). The purpose of this article is to analyze participant (n = 42) engagement and adherence with ezPARENT using digital usage data.
Method
Study Design
Data for this study were drawn from a small RCT (N = 83) conducted between 2013 and 2015 that compared ezPARENT to a health promotion control group (Breitenstein et al., 2016). Only parents in the intervention group (n = 42) were included in this descriptive study of parent use of ezPARENT over the 3-month intervention period.
Sample
Parent participants in the RCT were recruited from a large primary care center. Inclusion criteria were (1) parent or legal guardian of a child between the ages of 2 and 5 years, (2) child was receiving or eligible to receive Medicaid insurance (e.g., All Kids Assist or Share in Illinois), and (3) child received medical care at the pediatric primary care recruiting site. ezPARENT is only available in English; therefore, parents unable to speak and read English could not participate in this study. In the RCT, 41% (118/287) of parents screened were eligible to participate. Seventy percent (83/118) of parents enrolled in the study and were randomized to the ezPARENT (n = 42) or control condition (n = 41; Breitenstein et al., 2016).
The ezPARENT intervention participants were primarily mothers (95%), African American (57%) or Hispanic (33%), unmarried (81%), and earned less than $20,000 per year (71%). The mean age of participants was 33.2 years (Table 1). At baseline, parents reported their comfort with using applications on their smartphone or tablet. Seventy-six (32/42) percent reported feeling very comfortable, 7% (3/42) somewhat comfortable, 7% (3/42) a little comfortable and still learning, and 7% (3/42) were uncomfortable and did not use any applications. In addition, 86% (36/42) of the participants reported using the Internet daily, while 14% (6/42) used the Internet weekly.
Study Participant Demographics (Frequency [%]).
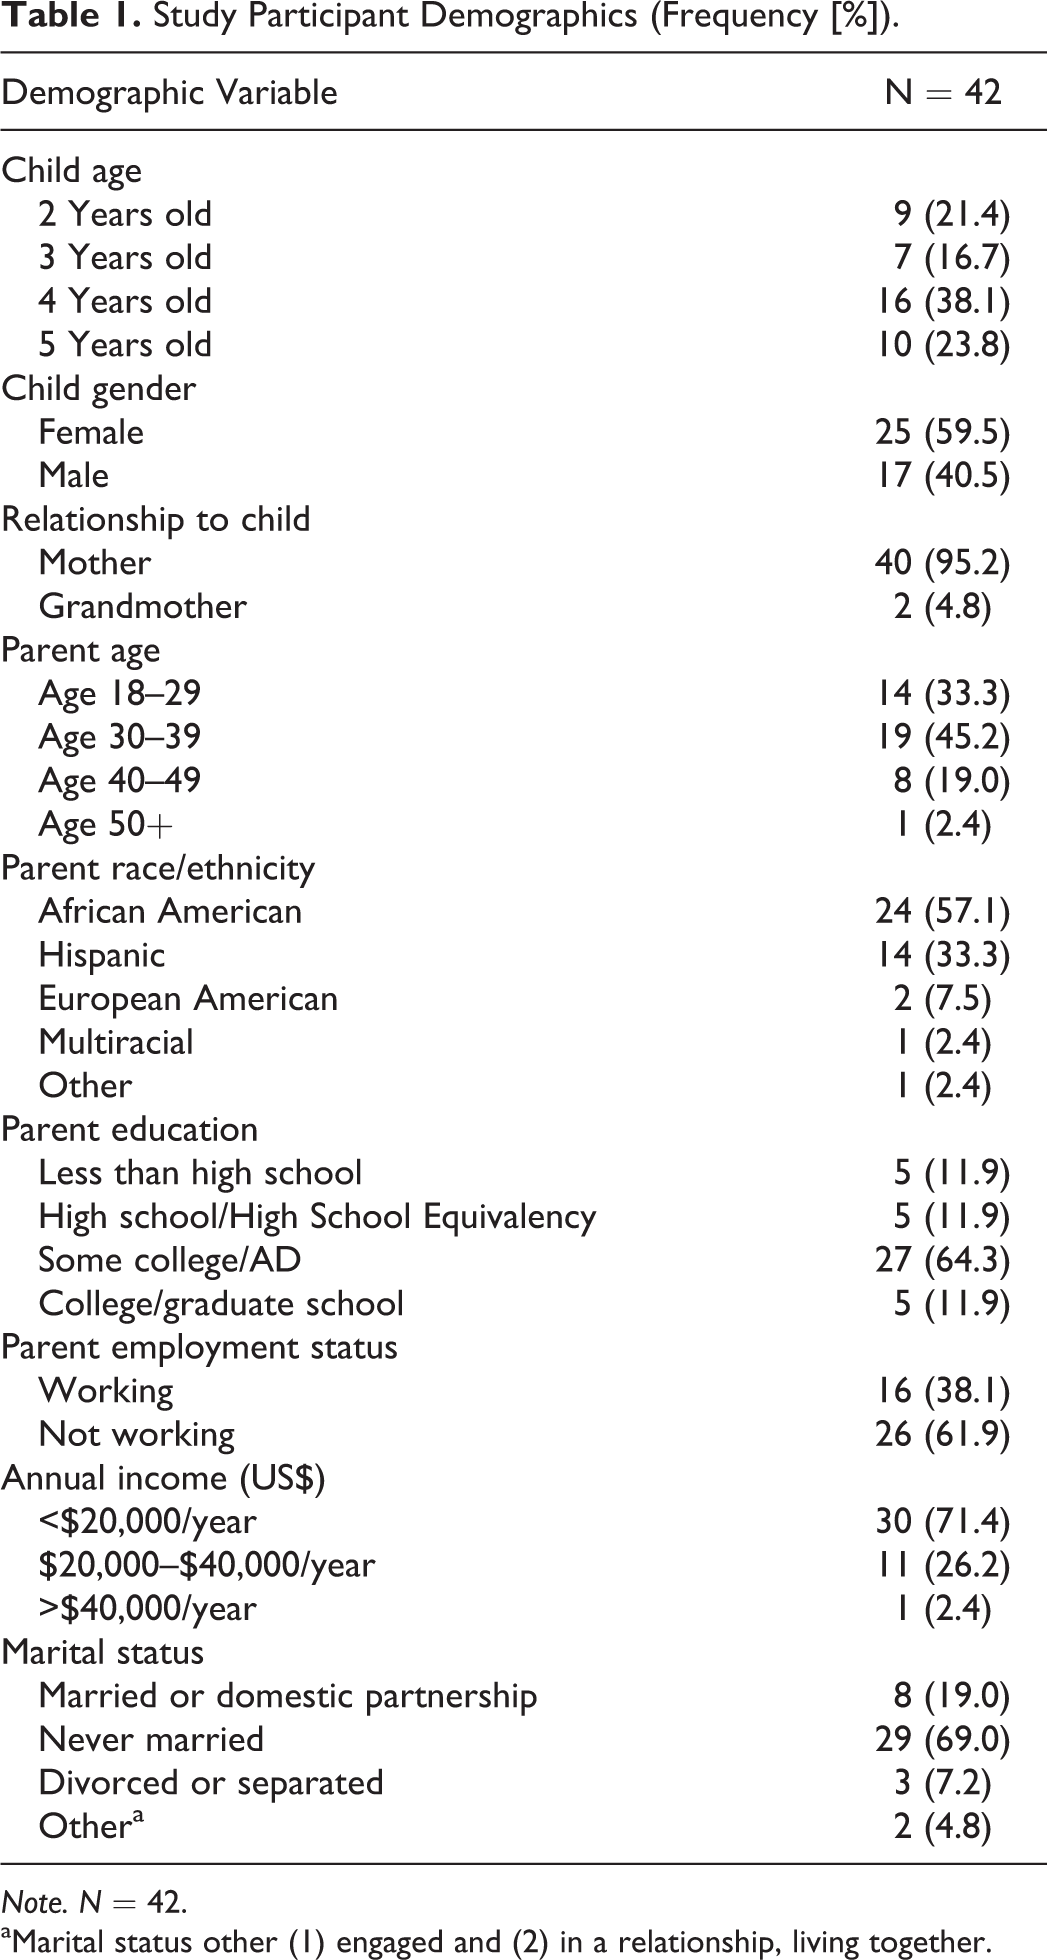
Note. N = 42.
aMarital status other (1) engaged and (2) in a relationship, living together.
Intervention
ezPARENT is a digital adaptation of the group-based Chicago Parent Program (CPP; Breitenstein, Shane, Julion, & Gross, 2015; Gross et al., 2009). The CPP addresses a critical risk factor for child maltreatment and poor parenting (Chen & Chan, 2016; Knerr, Gardner, & Cluver, 2013). It has been shown to be effective in reducing harsh parenting practices and improving parenting self-efficacy and positive parenting skills among a population of low-income urban parents of children aged 2–5 years (Breitenstein et al., 2012; Gross et al., 2009). The CPP group-based program is listed on the California Evidence-Based Clearinghouse for Child Welfare and the Substance Abuse and Mental Health Services Administration’s National Registry of Evidence-Based Programs and Practices.
ezPARENT is self-administered and downloaded on an android tablet as an application. We developed and tested the program systematically with input from three groups: the intended program recipients, the CPP developers, and computer scientists. For a detailed description of ezPARENT development, see Breitenstein, Shane, Julion, and Gross (2015). Six modules in ezPARENT teach evidence-based strategies for promoting positive parenting behavior and decreasing child misbehavior. Modules 1 and 2 focus on building parents’ positive relationships with their children; Modules 3, 4, and 5 address child behavior management skills; and Module 6 addresses stress management and problem-solving skills. There are several components in each module to teach the parenting strategies and present the content: Videos of a narrator and parent–child interactions that provide teaching of parenting skills and strategies. Reflection questions follow each video example to help parents understand the video examples and how to apply them with their children. Multiple-choice and true–false knowledge questions regarding core parenting strategies used to assess parents’ understanding of the program principles. Parents receive feedback for their correct or incorrect responses and can answer the questions multiple times. Interactive module activities that provide parents the opportunity to actively learn the strategies and skills. Practice assignments after each module that provide suggestions for parents to practice skills with their children. Parents then respond to a practice checklist at the beginning of the next module to report what skills they practiced. Bag of tricks for parents to add to when they learn a new parenting strategy and to which they can return in the review portion of the program for a quick review of the multiple program strategies. Module documents in a portable document format that are summary materials for the modules and are easily accessible in the review portion of the program.
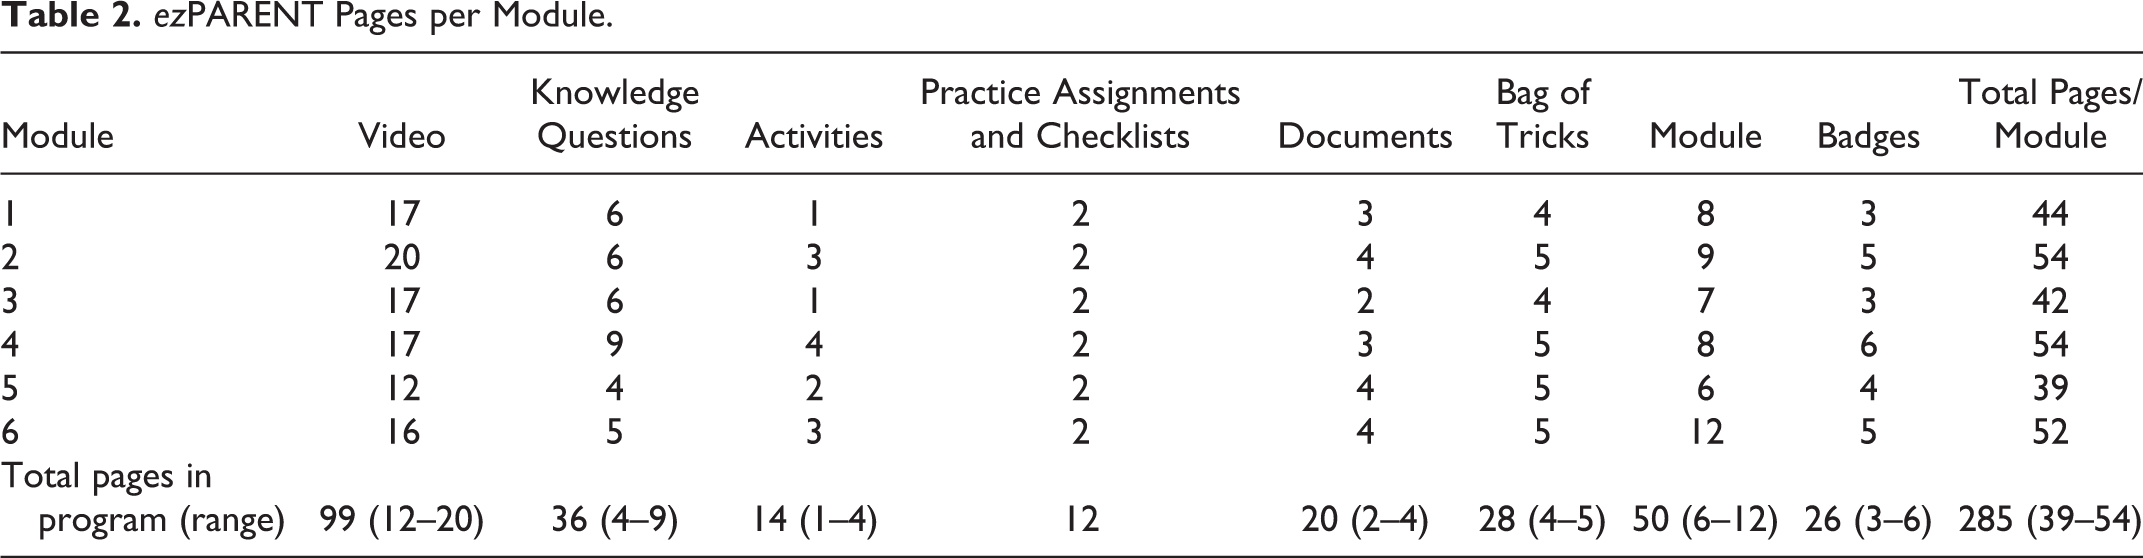
Parents automatically earn badges as they complete module content. There are 26 badges across the six modules: 14 for completion of activities, 6 for module completion, and 6 for practice assignment completions. Parents use the program by navigating different sections of the module based on topic (module pages). There are 285 distinct pages across the six modules (Table 2). During program development, we planned that each module would take less than 1 hr to complete (Breitenstein et al., 2015).
ezPARENT Pages per Module.
Procedures
After parents completed the consent process and baseline surveys, they were randomized to the intervention or control condition. All parents received an android tablet to use throughout the study. Study staff provided parents with a standardized description and tutorial of ezPARENT. Parents were given a suggested rate for module completion (one module every 1–2 weeks). There are two main reasons for this: (1) it provides parents time to practice the new skills that they learn with their children and (2) during development of the ezPARENT, our advisory group recommended this rate (Breitenstein et al., 2015). However, after a parent completes one module, the next module unlocks, so parents have access to that module and the ability to begin at any time.
Parents received automated text messages to encourage use of ezPARENT and provide praise and reinforcement for module completion. For example, if there were no use of the program 10 days after completion of a module, parents would receive a reminder text message to begin the next module. We provided 24/7 technology program and tablet support.
Measures
ezPARENT usage data were collected for all parents who used the program. All usage data were downloaded to our secure servers in one of two ways. First, if parents were connected to Wi-Fi while using ezPARENT, usage data were automatically downloaded in real time. Second, if the program was used off-line, usage data were logged and saved on the tablet. All usage data (online and off-line) were time-stamped with the date and time (hours, minutes, and seconds) to show that the parent used the program. The total number of data points in the usage database for all participants (n = 42) before data cleaning was N = 13,282.
The usage database initially included three variables: (1) participant’s unique identification number, (2) type of page accessed (page type), and (3) date and time page was accessed (date created). Page types are the main page types in the program (Table 2) and include videos, knowledge questions, activities, practice assignments and checklists, documents, bag of tricks, module, and badges.
Data cleaning
A small percentage of the original data set included data with uninterpretable time stamps (e.g., years 1970, 1999, and 2000). These data (n = 278) were uninterpretable. Our programmer partners felt these data were most likely a result of issues with the tablet and not related to the ezPARENT app. Because it was a small percent (0.02%) of the overall data and we had valid data for the five participants with the uninterpretable time stamps, we dropped the 278 cases but included the participants’ valid data in the analysis. After the database was cleaned, our total variable count for usage data was N = 13,004; the mean by participant was 309.7 (range = 17–702).
Model of Database Management and Analysis
ezPARENT sequence
ezPARENT is designed for users to move sequentially through the modules, with the ability to return to completed content. Creating a sequence of pages was required to track participant movement through the program pages. The first step in the sequencing was to map the progressive order of the 285 pages and assign a page number to each page. A variable was created to signify the page number in the sequence of the program.
Estimation of time spent on pages
ezPARENT does not time out or include an end time stamp when parents move to the next page. The time stamp represents when the user first accessed a page and the next time stamp entry is the next page accessed. Time spent on the program was calculated as the difference between these access points. However, it is challenging to estimate the time when pauses in the time stamped data are greater than the presumed time that would be spent on a page. These pauses ranged from several minutes to several days or weeks and signify the user was no longer engaged in the program. Including these would create a large positive bias in estimates of time spent in the program. Thus, to depict time spent in the program, we (1) identified how long users were likely to spend on a page and (2) estimated when users were no longer working on the page.
To obtain these estimates, we assessed the distribution of page visits using a stem-and-leaf diagram for each page opened. The distribution indicated that the video pages were watched for a longer length of time (median 90 s) than nonvideo pages (median 7 s). The distribution for time spent on video pages was a positively skewed normal distribution with many outliers, most ranging from 1 to 300 s. That is, most of the viewing times were less than 5 min, which makes sense because the program videos are less than 2 min in duration. The distribution of the nonvideo pages was normally distributed with a pronounced positive skew, with most observed values below 40 s. We chose to use the 5-minute (300 s) cutoff, which would insure that most durations not imputed were most likely reasonable estimates of how long the person remained engaged on the page. Therefore, all durations >5 min were replaced with 90 s for video pages and 7 s for nonvideo pages.
Time spent on modules
ezPARENT has six modules. Participant module duration was calculated by summing the total time of all pages per module. The mean module duration was then estimated by taking the mean of each participant’s module duration. To account for differences in the number of pages per module, participant-adjusted page duration by module was calculated by page duration divided by total number of module pages.
Estimation of visit time and time between visits
A visit to ezPARENT was operationalized as a period of time when a participant used the program uninterrupted. A visit was independent of modules; that is, an individual could spend time in multiple modules per visit. If the user left the program for greater than 20 min, we considered the next access to the program as a new visit. The 20-min cutoff for time between pages accessed was chosen because shorter cutoffs produced a distinctive and improbable pattern of visits. For example, there were more than twice as many 20 min or greater breaks between page accesses compared to 5- to 10-minute breaks. The time between each visit was estimated by examining the duration of time from the end of one visit to the beginning of the next visit. The time before the first visit was estimated from the time the participant was first given access to ezPARENT (e.g., following the baseline study appointment).
Analytic strategy
We conducted the following calculations for measures of engagement (duration, frequency, and activity). Duration of time spent in the program was calculated as the overall time spent per module and in the program. To assess for time differences between the modules, we conducted a multilevel model with modules nested within each participant. Frequency was operationalized as the number of visits to ezPARENT. Using the visit time variable, we calculated descriptive statistics to measure frequency of use. In addition, we evaluated the time between each visit to calculate the average time between visits.
ezPARENT activity was operationalized as the number of modules completed and the overall number of pages viewed per module and across all modules. Number of modules completed was determined by the module completion badge automatically awarded participants at the end of each module. The overall number of pages viewed by module was calculated as frequency of page clicks per module. Using a one-way analysis of variance (ANOVA), we looked at the proportion of pages viewed by module to assess for differences between modules and time, controlling for number of pages in the module.
To evaluate adherence (e.g., the extent to which the user’s activity matched the recommended dose [completion of six modules, one module approximately every 1–2 weeks]), we developed an adherence index (AI). The AI is the sum of three engagement measures: (1) number of individual modules completed (range = 0–6), (2) number of unique visits to ezPARENT, and (3) maximum time between visits. The sum of the standard scores was then transformed to a 0–100 scale for ease of interpretation (Einhorn & Hogarth, 1975; Wainer, 1976). We capped unique visits for the index at 18 (range = 2–49) because the data for visits were positively skewed (skew = 1.81 ± .365) and visits over 18 presented the positive tail and were outliers and did not indicate higher adherence. The maximum time between visits has a negative valence because greater time between visits would indicate less adherence to the suggested time frame. Higher AI scores indicate greater adherence to prescribed use of ezPARENT. Analysis of the AI included evaluation of descriptive statistics and assessment of variance of the index. In addition, we evaluated graphic depictions of high and low adherers to the program to provide examples of adherence patterns. Finally, as a preliminary validity estimate, we examined the relationship of participant demographic characteristics (parent age, ethnicity, education level, work status, and income) with the AI using a between-groups ANOVA for discrete variables (education and income) and Pearson correlations for continuous variables (age, ethnicity, and work status).
Results
Parent Engagement in the ezPARENT Program
Time spent by module and page
On average, parents spent 37.2 min per module (standard deviation [SD] = 22.2; range = .1–107.6 min; Table 3) and 37.1 s per page (SD = 51.1; range = 0–299; Table 4). Of participants that accessed a module, mean time per module ranged 26.4 min (Module 5) to 47.9 min (Module 2). Although each module contained the same components, they did not have an equal number of pages; therefore, when adjusting for the number of pages, there was a significant difference in time spent by module, F(5, 79) = 9.44; p < .001. That is, time spent per module decreased over time, and parents spent significantly less time in later modules than earlier modules. Parents spent the most time viewing video pages (M = 91.5 s) and the least time on bag of tricks pages (M = 8.6 s).
Mean Time (Minutes) per ezPARENT Module.
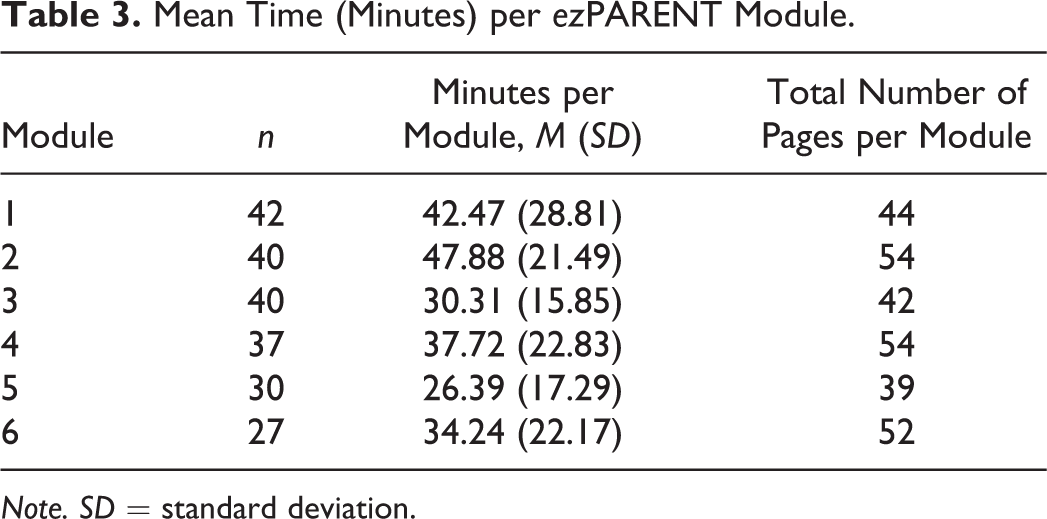
Note. SD = standard deviation.
Mean Time (Seconds) by ezPARENT Page Type.
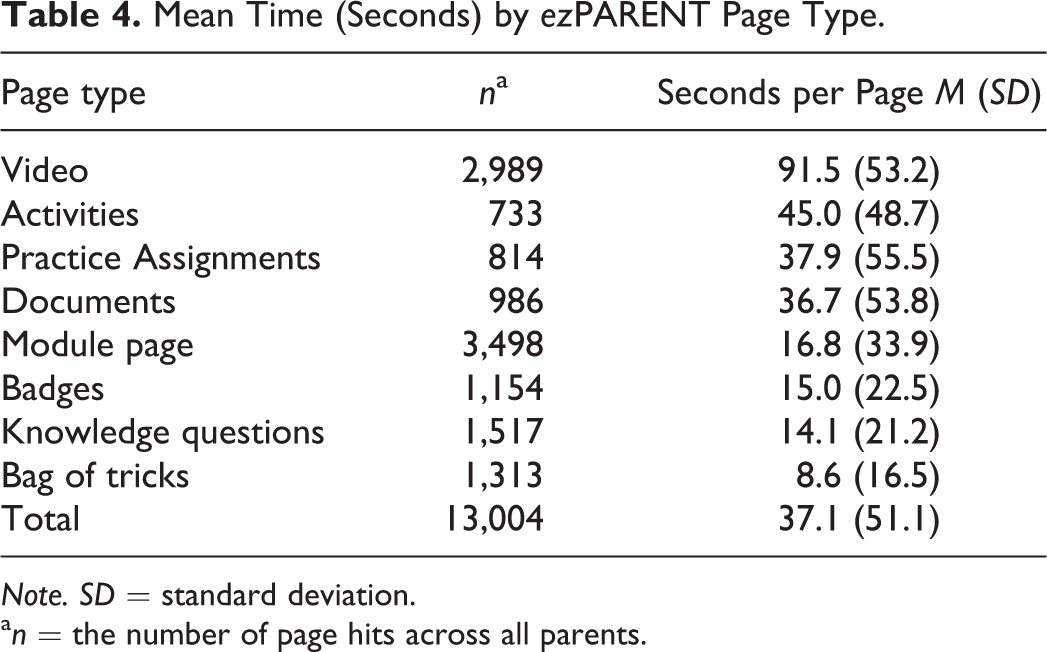
Note. SD = standard deviation.
a n = the number of page hits across all parents.
Frequency
The mean number of program visits was 13.6 (SD = 8.6; range = 2–49). Average length of time per visit was 14.1 min (SD = 17.1; range = .1–140). On average, participants visited the program over 69.5 days (SD = 20.9; range = 2–99). The mean number of days between visits was 5.5 (SD = 9.7; range = .01–86.3). That is, on average parents used the program every 5 to 6 days for an average of 14 min.
Activity
Participants completed on average 82% of the modules. Because module completion was required prior to unlocking the subsequent module, we expected module completion to drop off over time. Of the 42 parents in the intervention group, module completion was 97.6% (Module 1), 95.2% (Module 2), 92.9% (Module 3), 78.6% (Module 4), 69% (Module 5), and 59.5% (Module 6). Mean number of pages viewed by participants is depicted in Table 5. On average, participants revisited all pages in the program except for the video pages, which they viewed once.
Mean Number of ezPARENT Pages Accessed by Participant by Module.
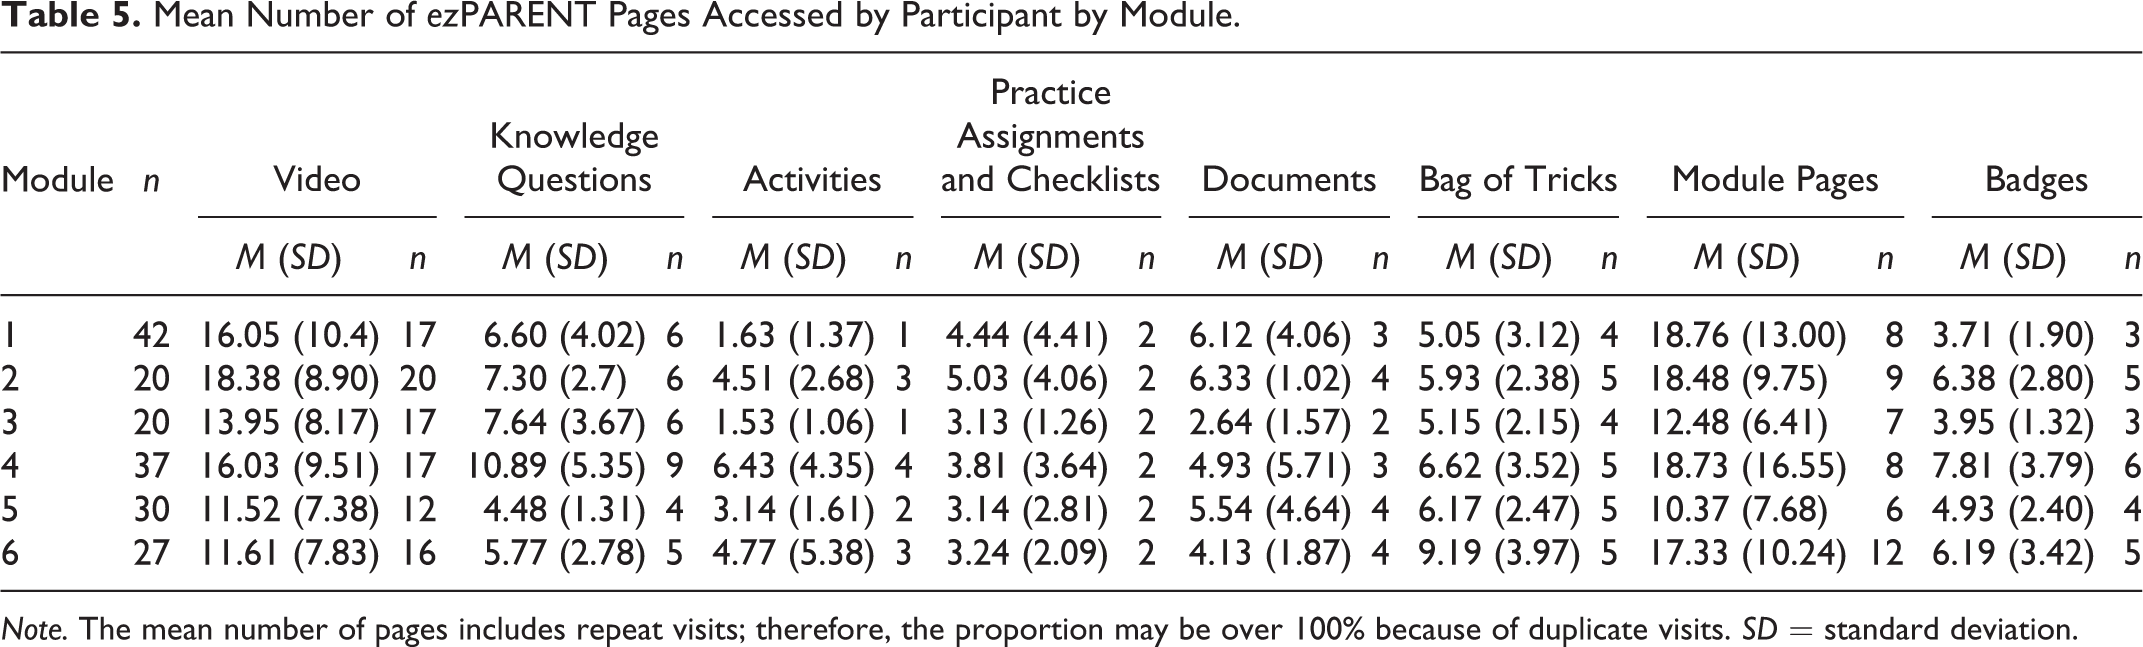
Note. The mean number of pages includes repeat visits; therefore, the proportion may be over 100% because of duplicate visits. SD = standard deviation.
Adherence
The median AI across the 42 intervention participants was 56.0 (SD = 21.2; range = 4.1–80.9). AI scores were normally distributed (skew = −0.437, standard error = .37), with a slight negative skew where the low tail max signified optimal level of adherence. Figure 1 includes examples of individual parent usage patterns of visits by day and by module, with the three highest AI scores. Figure 2 includes examples of individual usage patterns with the three lowest AI scores.
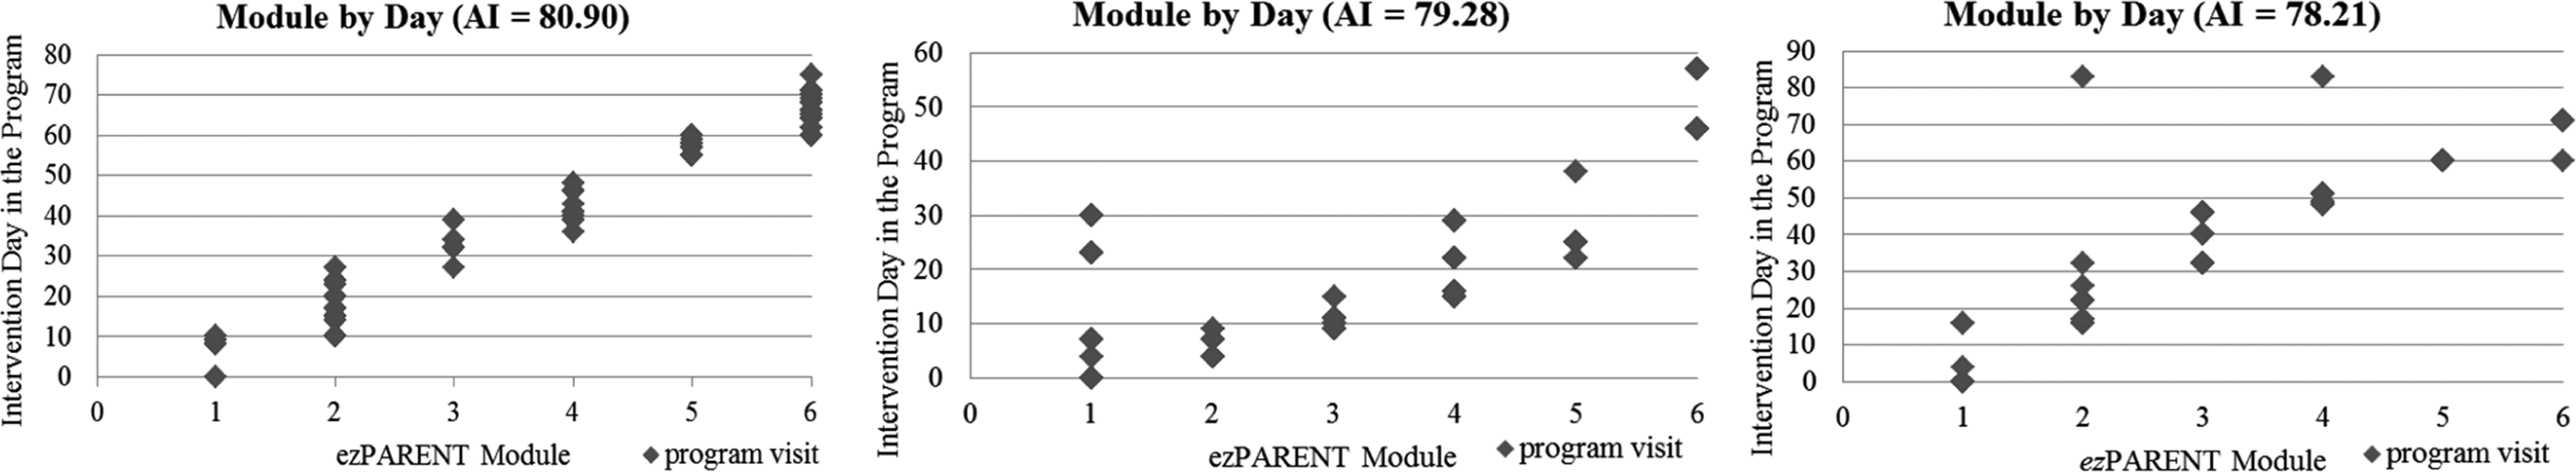
Examples of individual parent use patterns with high adherence index scores.
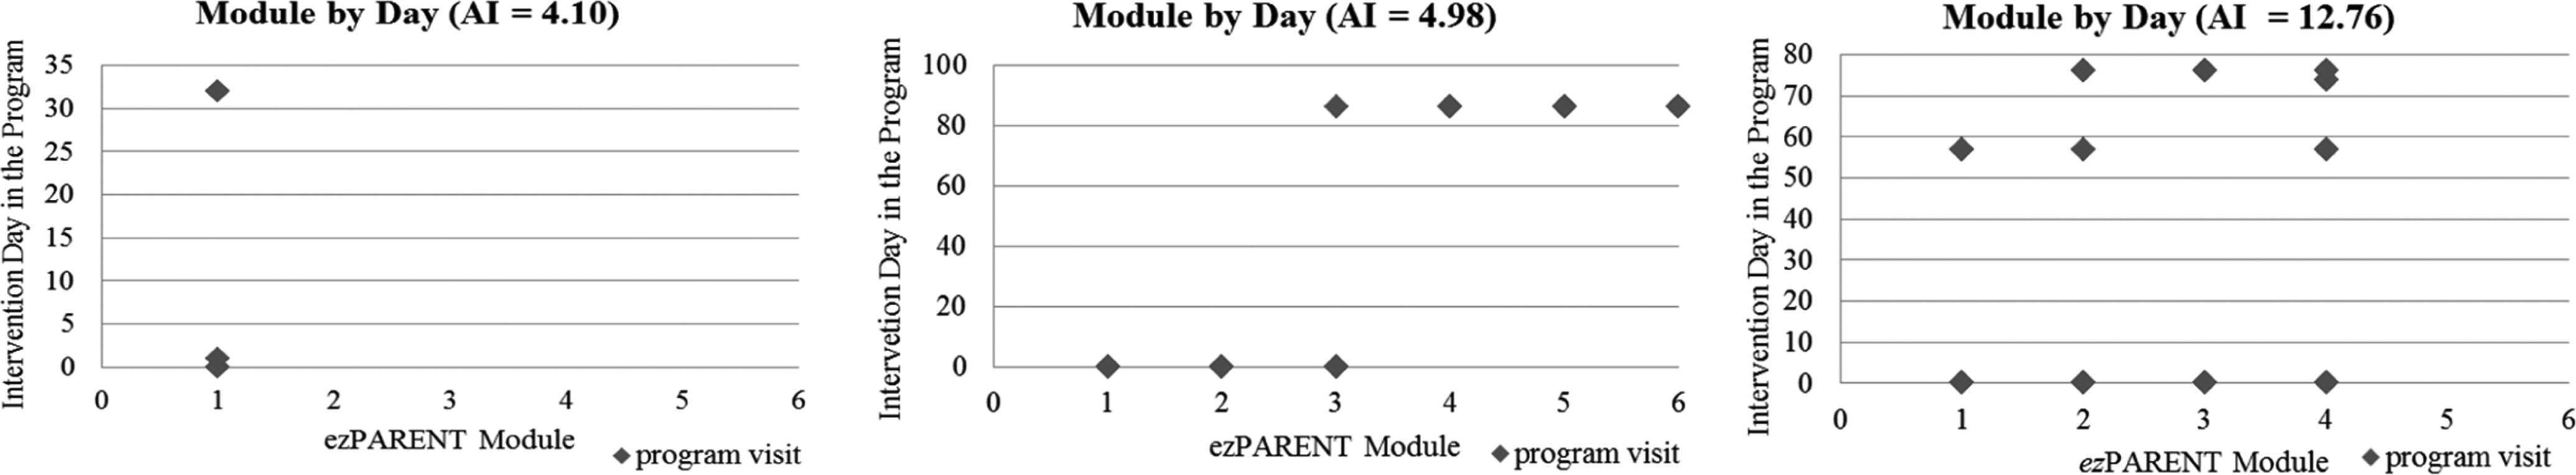
Examples of individual parent use patterns with low adherence index scores.
We examined relationships of AI scores with participant demographics (parent age, ethnicity, education level, work status, and income). There was a significant correlation between AI and parent age (r = .36, p = .019): Older parents had higher AI scores. There were no significant relationships between AI and ethnicity, education level, work status, or income.
Discussion
mHealth interventions may expand the reach and sustainability of family-focused, evidence-based interventions for child maltreatment prevention and health promotion. An additional benefit is the vast amount of usage data that can be collected and analyzed to understand and monitor parent program use. However, to date, many studies measure program use solely based on attrition or session log-ins (visits) and do not maximize the data provided by digital usage metrics (e.g., duration, frequency, and activity; Donkin et al., 2013). In this study, we comprehensively analyzed engagement and adherence to a self-administered PT intervention. This study also developed an AI for a behavioral mHealth intervention to capture multiple levels of engagement data. This is the first step in establishing metrics for adherence to mHealth interventions. Future testing is needed to demonstrate the validity of the index and generalizability of the index across various interventions.
Estimated time spent per module significantly decreased over time, and parents spent varying amounts of time on each page (Tables 3 and 4). There are a number of potential reasons for these findings. Over time, parents become more familiar with the program and the technology, resulting in more efficient use of the program. It is possible that parents began to lose interest in the program, accounting for drop off in duration and use. Another explanation relates to the content of each session. Of the six modules, the lowest duration of estimated time spent was for Modules 3 (“Say What You Mean and Mean What You Say”) and 5 (“Discipline Strategies and Using Time Outs”). Interestingly, these are the only two corresponding with content based on only one group-based session; other modules incorporated content from two group sessions. Also, Modules 3 and 5 had fewer pages than other modules. Because the content in Modules 3 and 5 was more focused on one topic, they may have required less time to complete. However, it is possible that the nature of the module content influenced parent engagement. Future usage research of mHealth PT programs could map usage with content by providing parents the opportunity to self-select content most applicable to their perceived parenting needs.
Others have reported similar findings related to program use changes over time (Glasgow et al., 2011; Mohr, Burns, Schueller, Clarke, & Klinkman, 2013). Indeed, a risk of digital delivery is the ability for parents to easily disengage or drop out in the absence of person-to-person contact (Christensen, Griffiths, & Farrer, 2009; Tate & Zabinski, 2004). Our findings indicate that participants in his study did not disengage. Although estimated time using the program per module decreased over time, the mean module completion rate was 82%, and 60% of parents completed all six modules. This completion rate is comparable or exceeds average parent attendance in group-based face-to-face programs, which typically ranges 35–50% in community settings (Breitenstein et al., 2012; Heinrichs, Bertram, Kuschel, & Hahlweg, 2005). In addition, up to 25% of parents that sign up for PT classes never attend one session (Breitenstein et al., 2012), compared to our sample, where only 2% (1/42) never completed a module. Attrition rates (e.g., 40% of our sample did not complete all six modules) are higher than average attrition rates (26%) for PT (Chacko et al., 2016). This may be because ezPARENT module completion depends on parents completing previous modules; therefore, if they stop using the program for a period of time, when they return, they start where they left off. Overall, our findings support assertions that digital access may increase parents’ ability to use and sustain activity in the program by addressing barriers to face-to-face program attendance (Ritterband et al., 2003; Tate et al., 2009).
A second key finding is the frequency with which parents visited the program. On average, parents visited the program 13.6 times, with an average estimated length of time per visit of 14.1 min. This supports the belief that parents will use a program at their convenience and that they will complete modules over time rather than all in one visit. This finding aligns with some advantages of mHealth interventions in that they are convenient, useful, accessible, and easily fit into busy schedules. Mapping out frequency and average time per visit has implications for program design. For example, it may be most advantageous to design programs that provide 10–15 min of discrete content that parents can complete. The use of usage data and instructional learning principles is key to effective program design (Hilgart, Ritterbrand, Thorndike, & Kinzie, 2012). Another strength of ezPARENT is parents’ ability to revisit the program repeatedly, which cannot be accomplished in face-to-face programs. Future research should evaluate how parents revisit ezPARENT over time and the relationship with parent and child outcomes.
An important component of any PT program is giving parents time to practice their new skills. We found that parents spent on average 5.53 days between visits, with some variability (e.g., some parents went through the program all in one sitting; others spent very little time in the program). The ability to collect such data will provide opportunities to answer empirical questions regarding how skill development is acquired and used over time.
A third key finding in this study is the overall adherence (Median AI = 56.02) to the program with very little instruction (e.g., one initial face-to-face visit at baseline that gave program instruction and text message pushes to encourage and reinforce program use) and the high variation in parent engagement in the program (Figures 1 and 2). Face-to-face program are designed to be delivered consistently across participants. Parent adherence to program content (e.g., the extent to which the intervention recipient receives the content as defined by program developers) is often evaluated by enrollment and attendance metrics and observational or self-report measures of engagement (Baker, Arnold, & Meagher, 2011; Garvey, Julion, Fogg, Kratovil, & Gross, 2006). Usage data of technology-driven programs provide an objective method to evaluate engagement and adherence of the program content. In addition, because the ezPARENT is a self-administered program, parents have control of when and how they use the program; therefore, evaluating the variability in adherence can inform program adaptations and delivery models.
Limitations and Future Research
Due to the small sample size, we do not have adequate power to detect relationships between parent characteristics and parent/child outcomes with engagement and adherence metrics. In addition, our relatively homogeneous sample (only children with Medicaid insurance and no fathers) limits our ability to generalize our findings more broadly. The fact that we provided tablets to parents and required an initial face-to-face meeting with parents for data collection may positively influence engagement. Our future study will focus on cost effectiveness of ezPARENT with provision of low cost tablets (less than $100/tablet) as a sustainable delivery method and implementation in primary care (Breitenstein et al., 2016). Finally, because parents do not log off and the program does not automatically log off after a period of inactivity, in the analysis, we had to generate estimated cutoff times. These cutoff times may potentially underestimate or overestimate our engagement metrics.
This work lays the foundation for future studies to examine the association of technology program usage and outcomes related to parenting and child maltreatment risk. Future efforts will focus on testing ezPARENT with a larger, more diverse sample; refining the AI to test the relationships of usage and overall parent and child outcomes; and generalizing findings across a more diverse population. In addition, testing the program among parents who are at heightened risk for maltreatment will provide an opportunity to evaluate unique usage patterns in this population. Evaluation of engagement in and adherence to the program and their relationship to intervention outcomes will provide further insight and knowledge to highlight the opportunities and address the limitations of mHealth interventions.
Implications for Child Maltreatment
Prevention is instrumental to reduce child exposure to harm and neglect (Nelson, Selph, Bougatsos, & Blazina, 2013). Findings from this analysis have implications for mHealth interventions that promote child well-being and prevent child maltreatment. First, the mHealth delivery method allows parents to complete interventions in a convenient manner. Self-delivered PT programs like ezPARENT can be used in combination with other forms of intervention and prevention to support positive parenting and promote child well-being. For example, an easy-to-use tablet-based behavioral PT program in combination with counseling, home visiting, or other evidenced-based programs might maximize family outcomes. The ability to monitor program use and completion is an important feature for tracking program engagement, particularly for parents that may be mandated to participate in a behavioral PT program. Tracking can be done in real time and allows practitioners a quick method for monitoring and responding to parent engagement positively or to nonengagement constructively.
The mHealth delivery model provides an opportunity for broad dissemination of family-focused interventions across different sectors of care (e.g., primary care, mental health, and community agencies). In these settings, prevention programs like ezPARENT have the potential to expand the reach and accessibility of programs for families in need. Our study findings support the use of mHealth delivery for parenting skills training, that parents use the program, and that there is the potential for positive public health impact by greatly extending the reach of interventions to help more parents and young children.
Footnotes
Declaration of Conflicting Interests
The author(s) declared no potential conflicts of interest with respect to the research, authorship, and/or publication of this article.
Funding
The author(s) disclosed receipt of the following financial support for the research, authorship, and/or publication of this article: This study was supported by a grant from The Robert Wood Johnson Nurse Faculty Scholars Program (Grant #73016).