
Abstract
Sexual violence (SV) is a significant public health problem. Using data from the 2005 Behavioral Risk Factor Surveillance System (BRFSS), this article provides state-specific 12-month SV prevalence data for women residing in 23 states and two territories. Overall, more than 500,000 women in the participating states experienced completed or attempted nonconsensual sex in the 12-month period prior to the survey. The collection of state-level data using consistent, uniform, and behaviorally specific SV definitions enables states to evaluate the magnitude of the problem within their state and informs the development and evaluation of state-level SV programs, policies, and prevention efforts.
Keywords
Sexual violence (SV) against women is a major public health problem with long-term negative impacts on the mental health, physical health, and social well-being of the victim (Basile, 2005; Golding, 1999). For the purpose of this article, SV is defined as nonconsensual completed or attempted penetration, unwanted nonpenetrative sexual contact, or noncontact acts (e.g., sexual harassment, being flashed, being forced to look at sexual materials) by any perpetrator (Basile & Saltzman, 2002). Although lifetime estimates may provide a better sense of the size of the problem of SV (Black et al., 2011), 12-month prevalence estimates are most helpful in understanding the scope of the current problem and in monitoring changes over time. However, only a few national studies of the U.S. adult population have evaluated the 12-month prevalence of rape or other types of SV. 1
Direct comparisons between the national studies are difficult because of the differing study populations and methods of data collection. The National Violence Against Women Survey (NVAWS), conducted in 1995 and 1996, provided national 12-month prevalence estimates for rape (defined as nonconsensual penetration) and attempted rape (Tjaden & Thoennes, 2006). Twelve-month data from the NVAWS indicate that 0.3% of women experienced completed or attempted rape in the previous year. These prevalence estimates translate to an estimated 302,091 women experiencing rape or attempted rape in the year preceding the survey (Tjaden & Thoennes, 2006).
More recent published national prevalence estimates of SV victimization are from the Centers for Disease Control and Prevention’s (CDC) Second Injury Control and Risk Survey (ICARIS-2), a national random-digit-dial (RDD) telephone interview conducted in mid 2001 through February 2003 (Chen, Kresnow, Simon, & Dellinger, 2007). Because the 20-min ICARIS-2 addressed many forms of intentional and unintentional injury, only one SV question was asked in relation to the preceding 12 months. Specifically, respondents were asked a single question that included a broad range of SV experiences, labeled unwanted sexual activity, which includes acts such as unwanted sexual touch. This study found that 2.5% of females reported unwanted sexual activity in the preceding 12 months (Basile, Chen, Black, & Saltzman, 2007).
The most recent national 12-month sexual violence prevalence estimates come from CDC’s National Intimate Partner and Sexual Violence Survey (NISVS). This ongoing surveillance system began collecting detailed information on sexual violence, intimate partner violence, and stalking in 2010. NISVS found that 1.1%, or an estimated 1.3 million women, were victims of completed, attempted, or alcohol-/drug-facilitated rape in the 12 months prior to the survey. In addition, 2% of women experienced sexual coercion (nonphysically forced penetration), 2.2% of women experienced unwanted sexual contact, and 3% of women experienced noncontact unwanted sexual experiences in the preceding 12 months (Black et al., 2011).
The national studies reviewed here minimally captured unwanted sexual contact and did not capture noncontact sexual abuse (with the exception of NISVS). However, previous national studies of college populations have examined various kinds of sexually abusive behavior that do not constitute rape. Fisher, Cullen, and Turner (2000), in their National College Women Sexual Victimization Survey (NCWSV), captured unwanted sexual contact with and without force that occurred during the school year. This included behaviors such as touching; grabbing or fondling of breasts, buttocks, or genitals; or kissing (Fisher et al., 2000). In addition to finding that 4.9% of college women experienced attempted or completed rape, they found that 2% of college women experienced attempted sexual contact with force, and 3% experienced attempted sexual contact without force. Rates of completed unwanted sexual contact were similar: 1.9% and 1.8% of college women experienced completed sexual contact with and without force, respectively.
SV data at the state level are even more limited than those at the national level. The 2010 NISVS report includes state-level data on SV victimization. However, based on the first year of data alone, NISVS was only able to produce state-level prevalence estimates for lifetime victimization for rape and “SV other than rape,” which includes being made to penetrate someone else, sexual coercion, unwanted sexual contact, and noncontact unwanted sexual experiences (Black et al., 2011). State-level lifetime prevalence estimates for rape among women ranged from 11.4% to 29.2%. State-level lifetime prevalence estimates for SV other than rape among women ranged from 28.9% to 58.0%.
Kilpatrick and Ruggiero (2003) estimated the rates of SV victimization (specifically, rape) within individual states using national estimates and extrapolating to states after adjusting for the state’s age and racial/ethnic breakdown according to Census information. These authors used information on the prevalence of rape and risk factors associated with rape from two national studies: the NVAWS (Tjaden & Thoennes, 2000) and the National Women’s Study (NWS) published by Kilpatrick, Edmunds, and Seymour (1992). As an example, based on national prevalence rates, the authors calculated that 1 of 8 women (12.9%) in the state of Georgia were victims of rape at some time in their life, which translates to 400,000 women in Georgia (Kilpatrick & Ruggiero, 2003). The work of Kilpatrick and Ruggiero did not include state-specific estimates of SV in the last 12 months.
The studies reviewed here are important because they demonstrate the magnitude of the problem of SV and highlight the need for ongoing surveillance of recent SV victimization to better inform and aid in the evaluation of programs, policies, and prevention efforts. State-specific data are valuable, in particular, because they enable states to evaluate the magnitude of the problem within their state and allow states to evaluate population characteristics that may be contributing to the prevalence of SV within their state. However, state-specific prevalence estimates describing recent victimization (e.g., 12-month estimates) are even more valuable because they describe the current burden of SV victimization on a state’s population. In addition, compared with lifetime prevalence estimates, 12-month estimates describe a much shorter and recent time period. As a result, it is much more likely that the victimization reported actually occurred in the current state of residence, whereas lifetime prevalence estimates likely include a more significant proportion of SV victimization that occurred in a previous state of residence. The lack of state-specific 12-month prevalence data for SV victimization remains a significant gap in the literature. Such data more accurately inform the development and evaluation of prevention and intervention programs and allow states to direct resources to those populations that are currently in the greatest need.
Prior to 2005, a small number of states included state-added SV questions to the CDC’s Behavioral Risk Factor Surveillance System (BRFSS), which is described below. However, the specific SV questions used varied from state to state and from year to year with respect to definitions, specific SV behaviors included, and time frame. Although the state-level data have provided important information to individual states (see, for example, findings from North Carolina in Cloutier, Martin, & Poole, 2002), the lack of consistency between states limits the utility of such data to make comparisons between state and national rates. To provide comparable state-level data, an optional module on SV was included for the first time in the 2005 BRFSS (www.cdc.gov/brfss). This article describes the first detailed state-specific 12-month SV prevalence estimates for multiple states using consistent survey methods and uniform definitions.
Method
Sample
The current study used data collected as part of the 2005 BRFSS. The BRFSS is an ongoing, yearly, RDD telephone survey developed by the CDC to provide surveillance of health behaviors and health risks among the noninstitutionalized adult population (18 years old and older) of the United States and several U.S. territories. The survey is administered in either English or Spanish, depending on the preferred language spoken by the study participant. The survey consists of a core questionnaire, rotated core questions, optional modules, and state-added questions (CDC, 2006d). In 2005, an optional module on SV was available for use at the discretion of each state/territory (CDC, 2006b). The SV module was administered to the entire survey sample in 18 U.S. states (Arizona, Colorado, Connecticut, Delaware, Florida, Hawaii, Idaho, Missouri, Mississippi, Nevada, Ohio, Oklahoma, Rhode Island, South Carolina, Tennessee, Vermont, Virginia, and Wisconsin), Puerto Rico, and the U.S. Virgin Islands. Five states (Massachusetts, Michigan, Nebraska, New Mexico, and Washington) administered the module to a randomly assigned split sample. A total of 115,030 participants completed the SV module. Among the 25 states/territories, response rates for the BRFSS core questionnaire ranged from 37.8% in Massachusetts to 72.7% in Puerto Rico, with a median of 51.7% (CDC, 2006c). Data were weighted to provide estimates that are representative of each state’s population. The design and characteristics of BRFSS are described in greater detail elsewhere (CDC, 2006a).
Overall, among the states administering the SV module, approximately 18.9% of all female respondents who completed the BRFSS core interview discontinued the survey before the start of the SV module (completion ranged from 60.0% in Tennessee to 94.4% in Washington). Because of the differing sets of optional modules administered across states, it is unclear how many of these respondents discontinued during a previous module or just prior to the SV module. An evaluation of respondents who dropped out of the interview before the SV module revealed that these respondents were significantly more likely to be older, have a lower annual income, and have less education than respondents who completed the SV module. Furthermore, in comparison with White non-Hispanic respondents, Black non-Hispanic, Asian non-Hispanic, and Hispanic respondents were significantly more likely to have discontinued prior to completion, while multiracial non-Hispanic respondents were less likely to discontinue.
Measures
The SV module was the final module administered, except in states (Arizona, Hawaii, Massachusetts, Michigan, Missouri, Nebraska, Nevada, New Mexico, Ohio, Oklahoma, Rhode Island, Vermont, Virginia, Puerto Rico, Virgin Islands, and Washington) that administered an optional intimate partner violence module subsequent to the SV module. Before beginning the SV module, respondents were told that the next questions inquired about the experience of SV. Respondents were explicitly informed that they could skip any question and that the entire module could be skipped if they considered answering such questions unsafe.
Questions in the SV module were designed to be behaviorally specific based on the earlier work of Koss, Gidycz, and Wisniewski (1987) and Kilpatrick et al. (1992) and are consistent with CDC’s uniform definitions of SV (Basile & Saltzman, 2002). The SV module included four initial questions related to SV victimization in the past 12 months: (a) “In the past 12 months, has anyone exposed you to unwanted sexual situations that did not involve physical touching? Examples include things like flashing you, peeping, sexual harassment, or making you look at sexual photos or movies?” (b) “In the past 12 months, has anyone touched sexual parts of your body after you said or showed that you didn’t want them to or without your consent?” (c) “In the past 12 months, has anyone attempted to have sex with you after you said or showed that you didn’t want to or without your consent, but sex did not occur?” and (d) “In the past 12 months, has anyone had sex with you after you said or showed that you didn’t want to or without your consent?” “Unwanted sex” was defined with the following statement:
Unwanted sex includes things like putting anything into your vagina [if female], anus, or mouth or making you do these things to them after you said or showed that you didn’t want to. It includes times when you were unable to consent, for example, you were drunk or asleep, or you thought you would be hurt or punished if you refused.
Respondents who did not report completed or attempted nonconsensual sex in the past 12 months were also asked, “Has anyone ever attempted to have sex with you after you said or showed that you didn’t want to or without your consent, but sex did not occur?” and “Has anyone ever had sex with you after you said or showed that you didn’t want them to or without your consent?” Only 12-month findings are reported in this article.
Twelve-month SV prevalence estimates were based on respondents who reported experiencing any of the following during the 12 months prior to the survey: unwanted sexual situations, unwanted sexual touch, completed nonconsensual sex, or attempted nonconsensual sex. Thus, the respondent must have experienced at least one incident to be counted as having experienced SV victimization but could have experienced multiple incidents during the time period referenced.
Analysis
Estimates of the number of women who experienced SV were calculated using 12-month prevalence estimates and 2005 state-level population estimates from the U.S. Census (U.S. Census Bureau, 2005). Weighted estimates of 12-month SV prevalence were calculated using SUDAAN, Version 9.0. Prevalence estimates were calculated by state of residence and by demographic characteristics (including race/ethnicity, age, income, and education). Chi-square tests and a multivariable logistic regression model were used to evaluate the association between 12-month SV prevalence and demographic characteristics. Following National Center for Health Statistics standards, estimates with a relative standard error (RSE) greater than 30% were deemed unstable and not reported (Hoyert, Heron, Murphy, & Kung, 2006). Estimates with a RSE between 23% and 30% were reported but noted as potentially unstable and should be interpreted with caution.
Results
Prevalence of Sexual Violence in the Previous 12 Months
Table 1 displays overall 12-month prevalence estimates of all forms of SV that were measured among all participating states and territories combined.
Twelve-Month Prevalence of Sexual Violence Against Women—25 States/Territories, 2005.
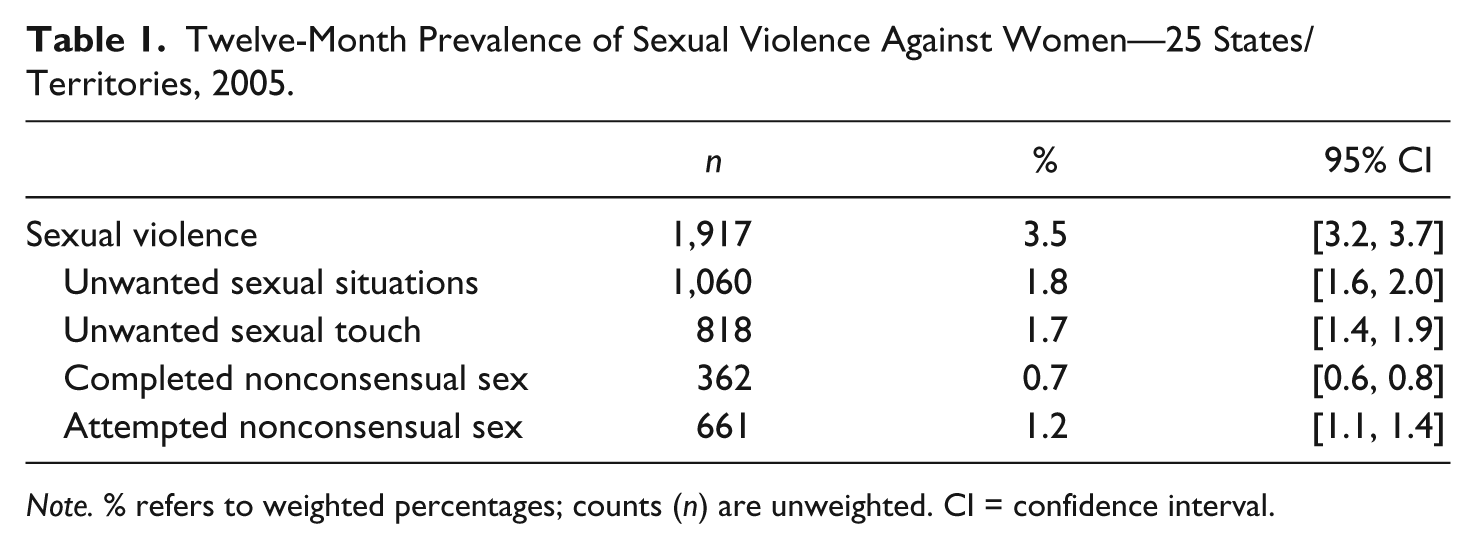
Note. % refers to weighted percentages; counts (n) are unweighted. CI = confidence interval.
Overall, 3.5% of women experienced at least one form of SV that was measured (unwanted sexual situations, unwanted sexual touch, completed nonconsensual sex, and/or attempted nonconsensual sex) in the previous 12 months. An estimated 1,649,400 women in the 25 states/territories surveyed experienced some form of SV in the 12 months prior to the survey. During the previous 12 months, 1.8% of women experienced an unwanted sexual situation, 1.7% experienced unwanted sexual touch, 0.7% experienced completed nonconsensual sex, and 1.2% experienced attempted nonconsensual sex. State-specific 12-month prevalence estimates varied substantially (Table 2). The 12-month prevalence of at least one form of SV ranged from 5.2% (Nevada) to 1.8% (Nebraska). The median 12-month prevalence estimate among participating states was 3.1%. For 8 of the states that administered the SV module, it is estimated that more than 100,000 women living in those states experienced some form of SV in the 12 months prior to the survey.
Twelve-Month Prevalence of Sexual Violence Among Women by State—25 States/Territories, 2005.
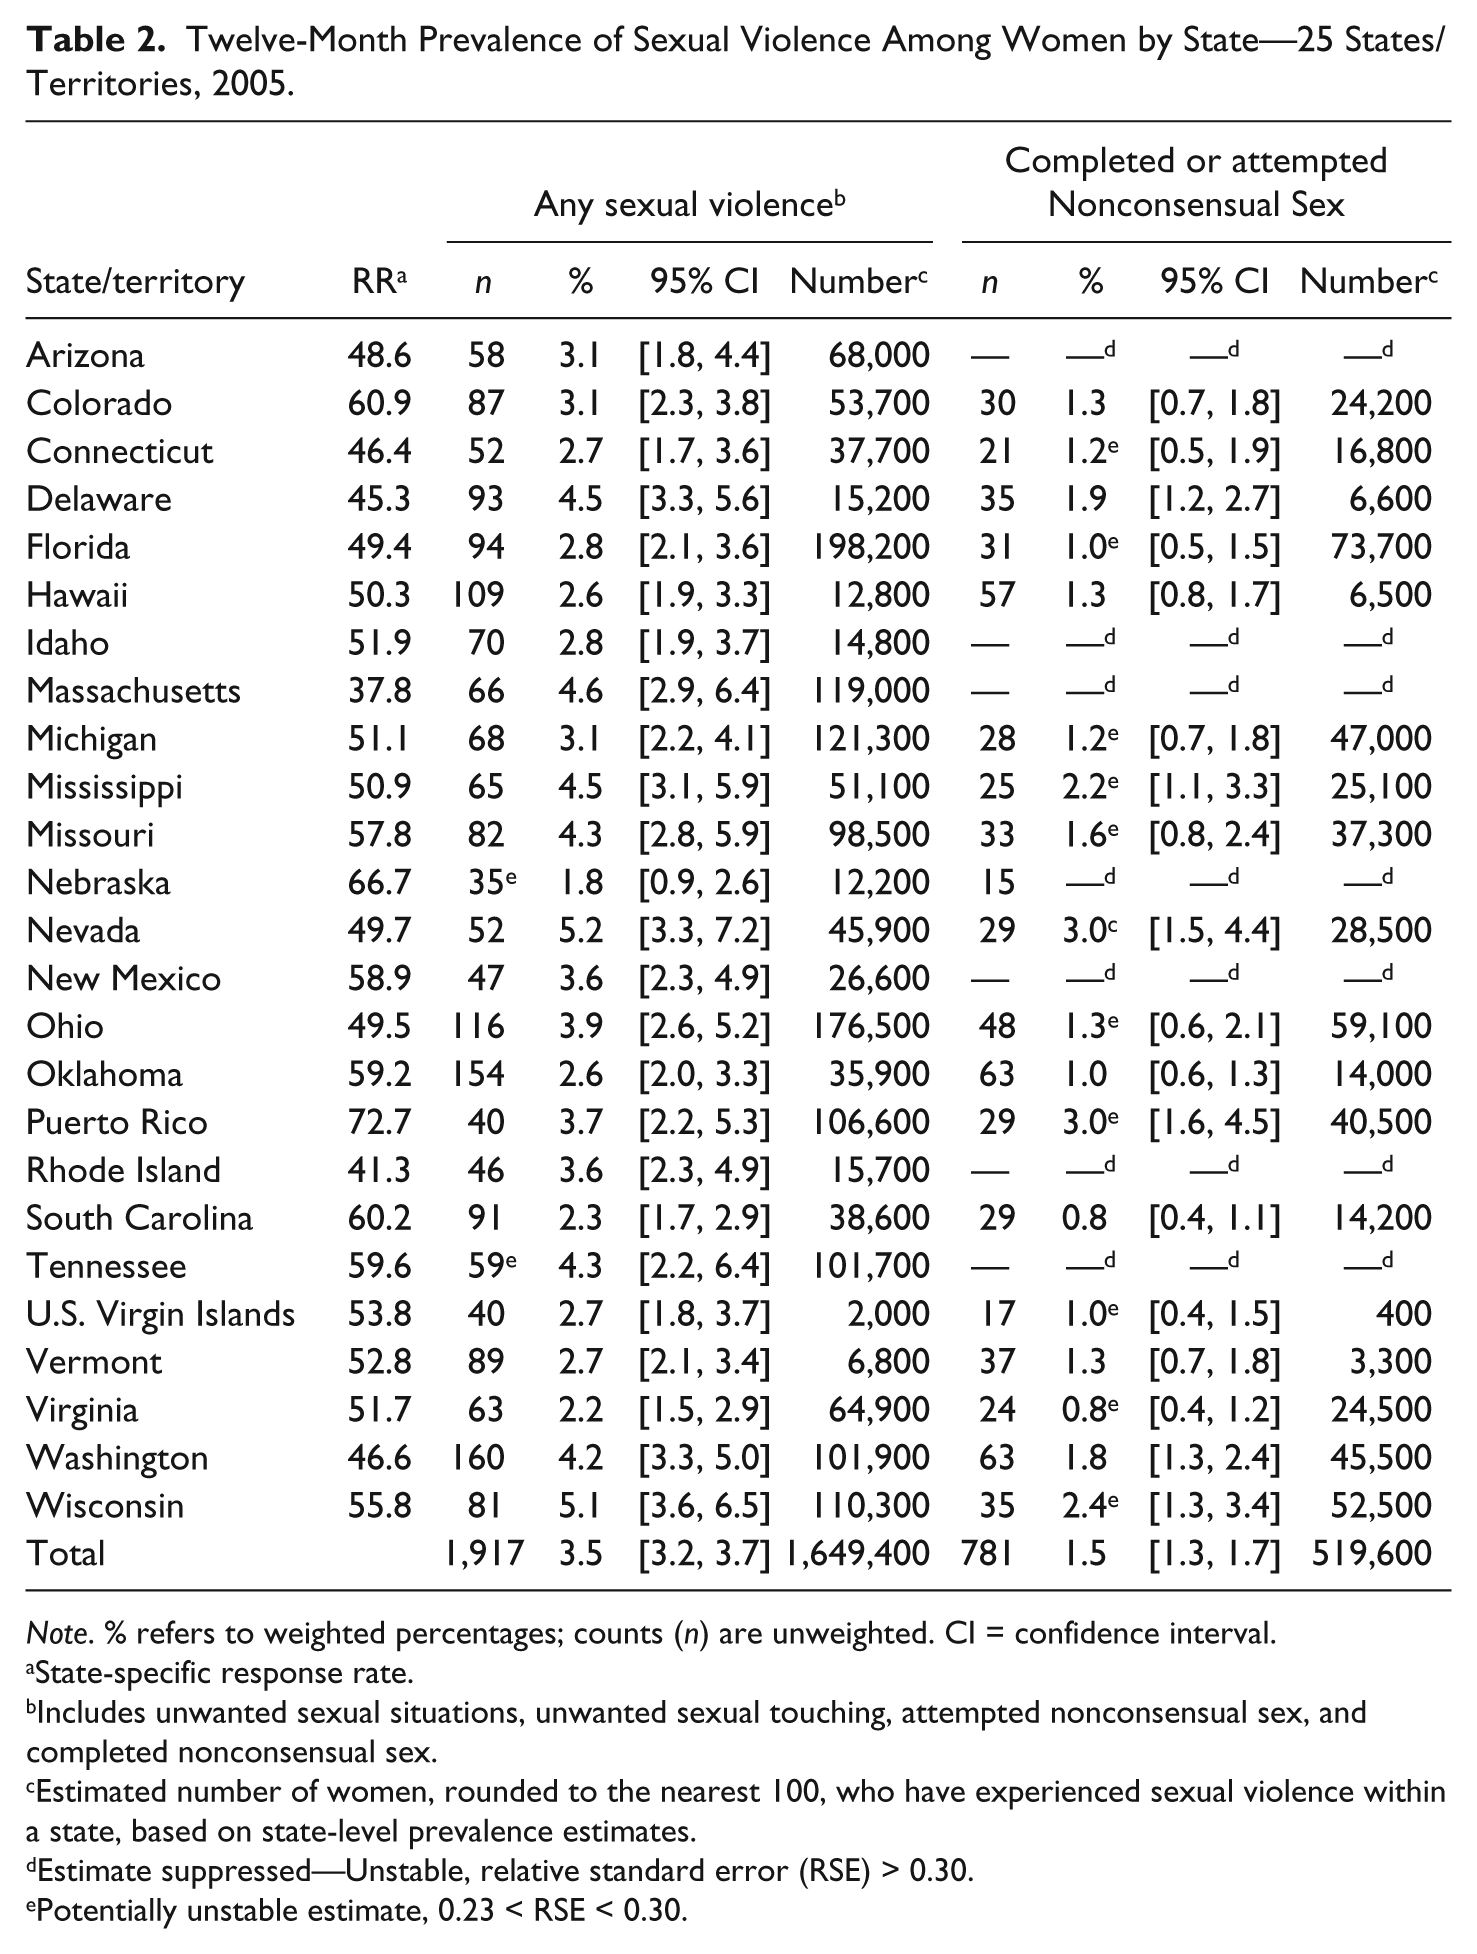
Note. % refers to weighted percentages; counts (n) are unweighted. CI = confidence interval.
State-specific response rate.
Includes unwanted sexual situations, unwanted sexual touching, attempted nonconsensual sex, and completed nonconsensual sex.
Estimated number of women, rounded to the nearest 100, who have experienced sexual violence within a state, based on state-level prevalence estimates.
Estimate suppressed—Unstable, relative standard error (RSE) > 0.30.
Potentially unstable estimate, 0.23 < RSE < 0.30.
Twelve-Month Prevalence of Completed or Attempted Nonconsensual Sex
Table 2 displays the 12-month prevalence of completed or attempted nonconsensual sex, overall and by state of residence. Overall, 1.5% of women (95% confidence interval [CI] [1.3, 1.7]) living in these states experienced completed or attempted nonconsensual sex in the previous 12 months.
Twelve-month prevalence estimates of completed or attempted nonconsensual sex varied substantially by state of residence, ranging from 3.0% (Nevada and Puerto Rico) to 0.8% (South Carolina and Virginia). The median 12-month prevalence estimate among participating states was 1.3%. Overall, it is estimated that in the 12 months prior to the survey, approximately 519,600 women experienced completed or attempted nonconsensual sex in states that included the SV module.
Sex of Perpetrator and Relationship of Perpetrator to Victim
Information was collected on the sex of the perpetrator and the relationship between the respondent and perpetrator for those who experienced completed or attempted nonconsensual sex in the 12 months preceding the survey. Approximately 98.1% (95% CI [96.8, 99.4]) reported a male perpetrator. The largest proportion of these male perpetrators were acquaintances (44.7%, 95% CI [38.0, 51.4]), followed by spouses/partners (41.7%, 95% CI [35.4, 48.1]). A small percentage were strangers (5.3%, 95% CI [2.4, 8.3]), followed by a person they had dated (3.6%, 95% CI [1.6, 5.6]). The estimated proportion of perpetrators who were persons they had dated, however, is potentially unstable and should be interpreted with caution. Due to small numbers, estimates of relationship type by race/ethnicity, and among women who indicated a female perpetrator, were unstable and are not reported.
Prevalence of Completed/Attempted Nonconsensual Sex by Demographic Characteristics
Table 3 displays 12-month prevalence estimates and adjusted odds ratios (AOR) for completed or attempted nonconsensual sex by demographic characteristics. Most race/ethnicity-specific estimates of the 12-month prevalence of completed or attempted nonconsensual sex were unstable and therefore not reported. Among estimates that were stable, the 12-month prevalence of completed or attempted nonconsensual sex was 1.2% among White non-Hispanic women, 2.0% among Black non-Hispanic women, and 2.3% among Hispanic women. No significant differences were observed between race/ethnic groups after adjusting for other demographic characteristics.
Twelve-Month Prevalence of Completed or Attempted Nonconsensual Sex, by Demographic Characteristics; Logistic Regression Model Examining Association Between Experience of Completed or Attempted Nonconsensual Sex in the Previous 12 Months and Demographic Characteristics—25 States/Territories, 2005.
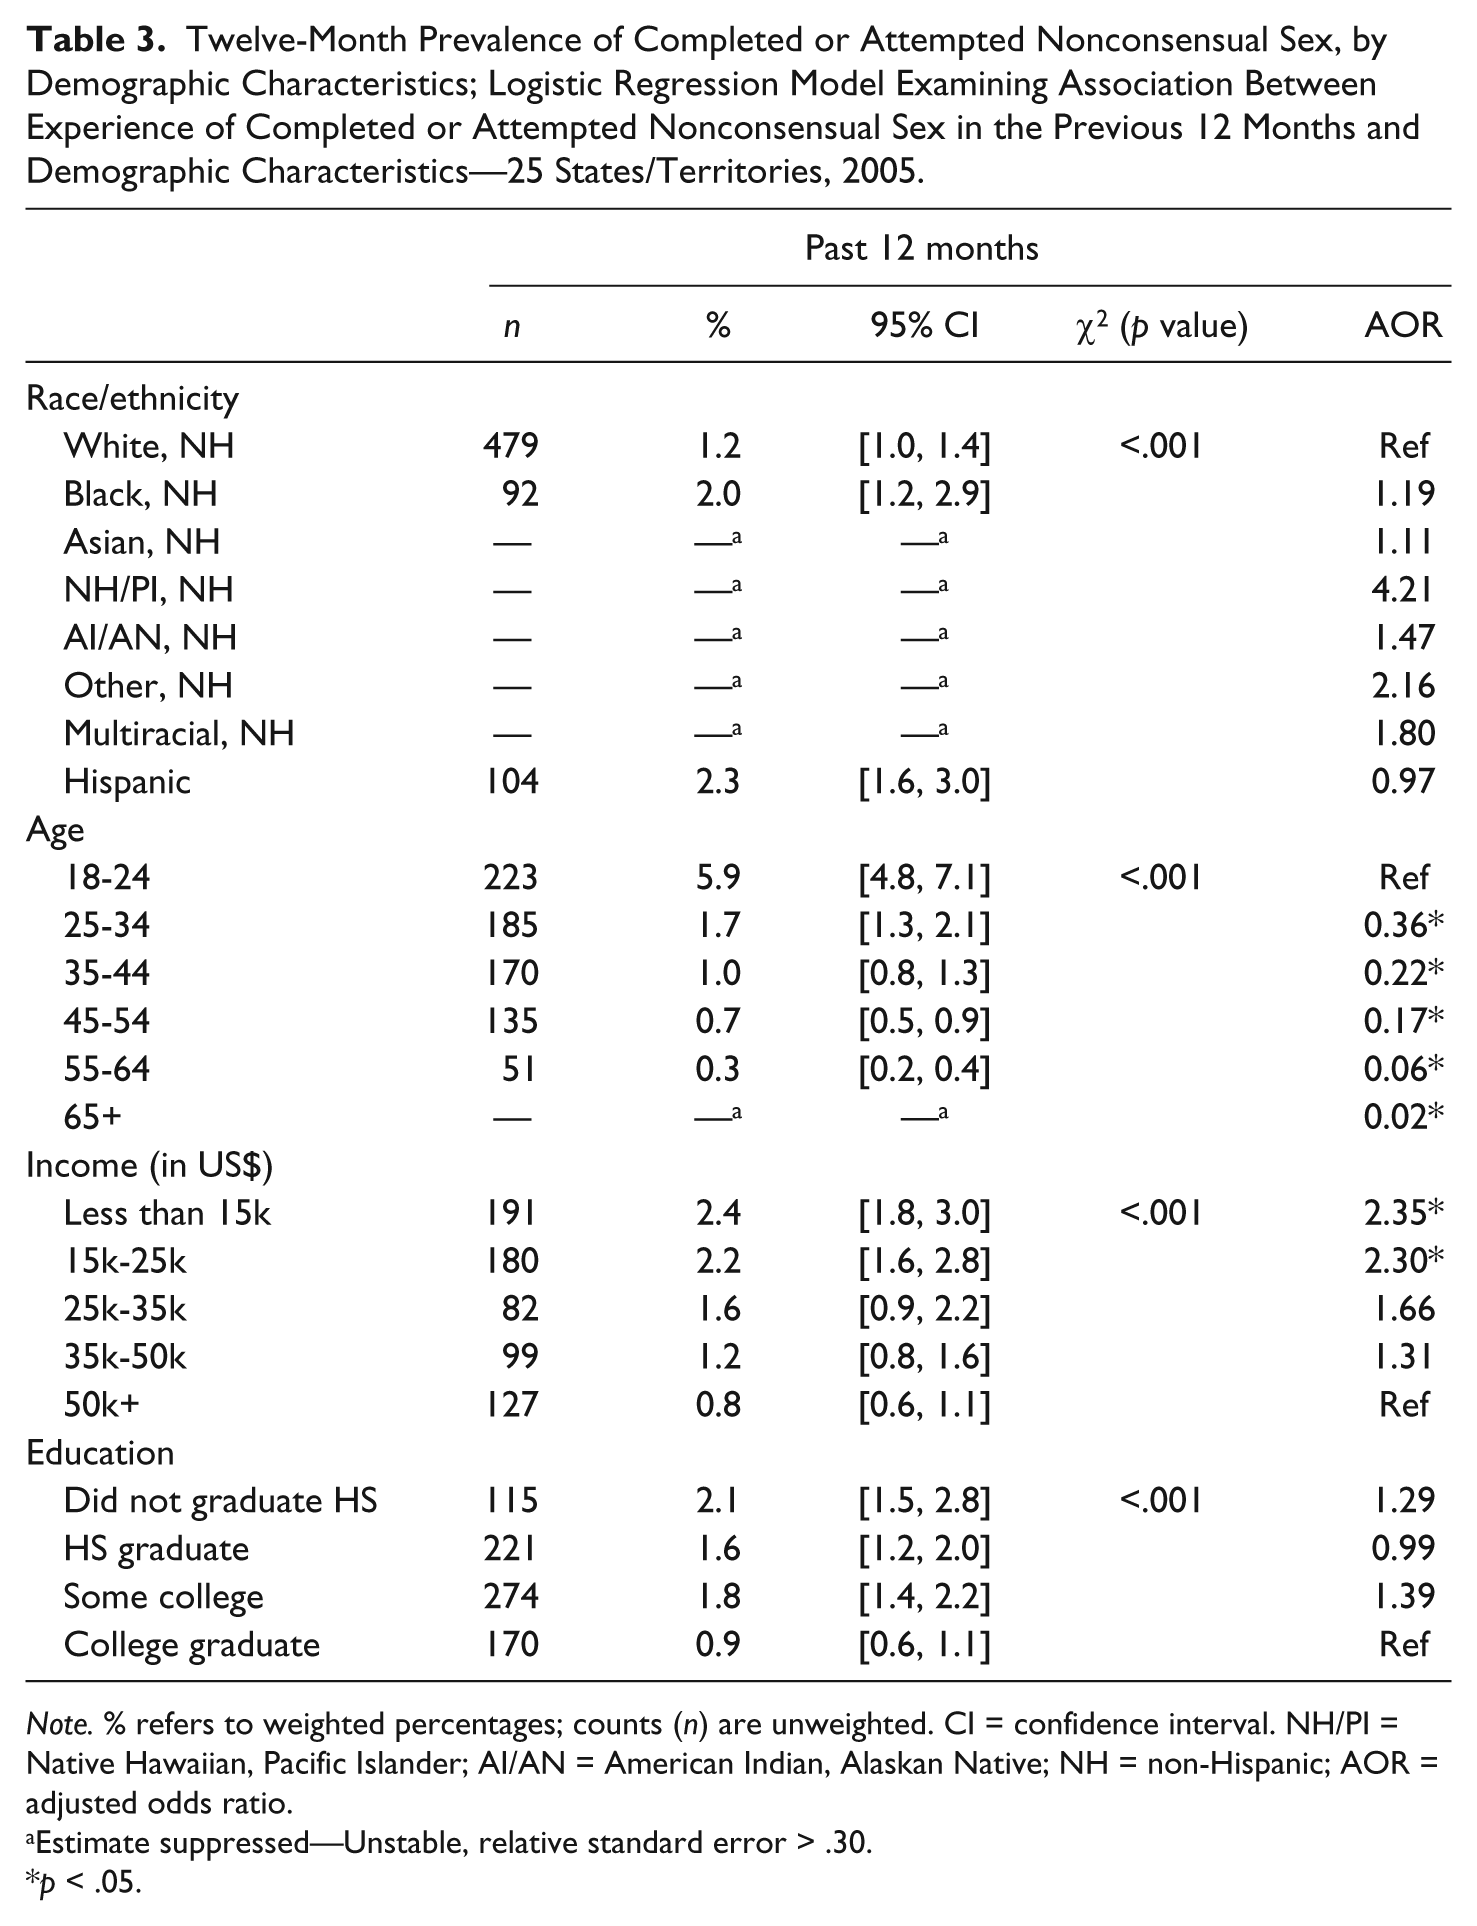
Note. % refers to weighted percentages; counts (n) are unweighted. CI = confidence interval. NH/PI = Native Hawaiian, Pacific Islander; AI/AN = American Indian, Alaskan Native; NH = non-Hispanic; AOR = adjusted odds ratio.
Estimate suppressed—Unstable, relative standard error > .30.
p < .05.
Significant differences were observed for age and income with 18- to 24-year-olds and those with household incomes at or below US$25,000 being at the highest risk compared with those with incomes above US$50,000.
Discussion
This study is the largest study of SV prevalence ever completed. It is also the first to provide state-level 12-month SV prevalence estimates for a large number of states using consistent definitions and uniform survey methods, and the first to provide 12-month state-level estimates of other types of SV beyond completed and attempted nonconsensual sex. State-level data on a range of SV outcomes provide valuable information to stakeholders and service providers. For example, the Rape Prevention and Education (RPE) Program is mandated by Congress and managed through partnerships between states and the CDC. The state RPE programs may benefit directly from numbers derived specifically from their state’s population; such information informs the development and evaluation of local prevention and intervention programs. States also benefit from the ability to compare the prevalence of SV in their state with the nation as a whole.
Variation in State-Level Prevalence Estimates
It should be noted that while data from the current study are representative of each participating state/territory and together are representative of the 25 states and territories surveyed, they are not nationally representative. Nonetheless, the overall prevalence estimates are consistent with the estimates found in other national studies (Black et al., 2011; Fisher et al., 2000; Tjaden & Thoennes, 2000). Although direct comparisons between studies are often difficult due to differing outcomes being measured (e.g., forced sex vs. combined attempted and completed forced sex) or time frame of reference (e.g., lifetime, 12-month, school year), overall, our findings related to the risk of SV among differing demographic groups are consistent with findings from previous surveys. For example, similar to previous studies, younger age and lower income were consistently associated with the risk of completed or attempted nonconsensual sex (Basile et al., 2007; Tjaden & Thoennes, 2006).
Importantly, state-specific 12-month prevalence showed considerable variation. Differences in state-specific prevalence rates are likely to be, at least in part, a reflection of differing demographics. Demographic characteristics may influence state prevalence rates in various ways. For example, a state with a younger population may have a higher 12-month prevalence rate compared with other states because rates of SV are highest in younger age groups. Similarly, state prevalence rates may be influenced by the relative size of racial/ethnic groups and by the average per capita household income.
In addition to demographic differences, states may vary substantially with respect to other factors (e.g., local cultural acceptance of gender-based violence). Future studies with sufficient power to provide stable state-specific rates adjusted for demographic factors such as age, race/ethnicity, and socioeconomic status may improve our understanding of the role these and other factors play with respect to the state-specific burden of SV.
Readers are cautioned against comparing estimates across states. No statistical testing has been conducted to identify whether differences are statistically significant. In addition, very few states have CIs that do not overlap with those for the highest estimate in the table; even fewer have CIs that do not overlap with the estimate for the entire U.S. population.
Importance of 12-Month Prevalence Estimates
Whereas lifetime prevalence estimates are important in understanding the full scope and burden of SV, 12-month estimates are more likely to detect the effects of policy and prevention efforts, particularly at the state level. However, most state-specific 12-month prevalence estimates of completed or attempted nonconsensual sex were unstable or potentially unstable, highlighting the challenge of obtaining state-specific estimates. Larger sample sizes, pooling 12-month state data across multiple years, and/or different survey strategies are required to provide the type of stable estimates that are best able to detect a change in 12-month SV prevalence. In addition, as previously mentioned, 12-month prevalence estimates are valuable because they describe the current burden of SV victimization within a state and are more likely to include victimization that occurred within a respondent’s current state of residence rather than a prior state of residence. By providing a more current and accurate description of the burden of SV victimization, state-specific 12-month prevalence estimates allow states to better allocate resources.
Strengths and Limitations
This study has a number of strengths. It is one of the only large-scale public health studies (N = 110,000) of SV since 1995. In addition, it is approximately seven times as large as any previous public health study of SV conducted in the United States. The large sample size, wide range of measures, and consistent methods allow, for the first time, information on the prevalence of 12-month SV victimization among a large number of states and a large number of demographic groups, compared with most previous studies. In addition, this study provides estimates of the full range of SV (including noncontact sexual abuse, unwanted sexual touch, and completed and attempted nonconsensual sex). Finally, the collection of SV data within BRFSS allows analyses of the associations between SV and the other health behaviors and adverse health outcomes assessed in the BRFSS. A study using these data found that nonconsensual sex experienced by women was associated with health conditions such as high cholesterol, stroke, heart disease, and heart attack, as well as risk behaviors such as smoking, excessive drinking, and HIV risk behaviors (Smith & Breiding, 2011).
A number of limitations also merit discussion. A limited number of questions could be included in the BRFSS optional SV module. Consequently, individual questions assessed victimization in relation to multiple SV acts that may have been experienced. Ideally, SV measures that assess each act individually and in a behaviorally specific manner should be used for clarity to facilitate respondents’ recall and to help minimize underreporting (Belknap, Fisher, & Cullen, 1999; Koss, 1992, 1993). Furthermore, while we included several types of SV that are not usually included in prevalence studies (i.e., noncontact abuse), the limited number of questions precluded an adequate measure of sexual coercion (similar to Abbey, McAuslan, Ross, & Zawaki, 1999; Testa & Dermen, 1999; and others).
In addition, the way that completed and attempted nonconsensual sex was defined is a limitation. Beyond nonconsensual penetration, the definition of nonconsensual sex included “making you do these things to them after you said or showed that you didn’t want to.” This allowed for respondents to include incidents of coercive sex as well as incidents of unwanted sexual experiences when incapacitated (e.g., drunk) in the measure of nonconsensual sex. Measuring these components separately would provide a clearer picture of women’s experiences with SV.
Another limitation is that some respondents who completed the BRFSS core did not complete the subsequent SV module; these respondents tended to be a racial/ethnic minority, have a lower annual income, have less education, and be older than respondents who completed the entire survey. With the exception of advanced age, each of these demographic characteristics has been associated with higher SV prevalence, suggesting that these results may be an underestimate of the true prevalence of SV. There are likely additional reasons why these data undercount the true prevalence of SV. For instance, a high likelihood of underreporting SV has been documented in the literature (Kilpatrick et al., 1992). An additional contributing factor may be the social stigma associated with being a victim of SV. However, while underreporting of SV remains of concern, two separate CDC studies demonstrated that the vast majority of telephone survey respondents believe that an RDD telephone survey should ask questions about SV (Black, Kresnow, Simon, Arias, & Shelley, 2006). In both studies, questions related to income had significantly higher refusal rates (15.1% and 11.6%) than those related to forced sex (0.2% and 1.0%).
Finally, this study is subject to the same difficulties faced by any RDD telephone study, particularly the inability to survey those not living in a stable household residence (prisons, nursing homes, military bases, college dormitories, shelters, homeless, transient populations) or those without a landline telephone. The increased use of cell-phone-only households, particularly among the young, and declining response rates have provided additional challenges to RDD studies in general (Galesic, Tourangeau, & Couper, 2006; Johnson, Holbrook, Cho, & Bossarte, 2006; Link & Kresnow, 2006; O’Brien, Black, Carley-Baxter, & Simon, 2006; Simon, Mercy, & Barker, 2006; Singer & Bossarte, 2006). However, many of those who are less likely to be included in this type of study may be more likely to experience SV, giving further support to the idea that the prevalence numbers presented in this study underestimate the true prevalence of SV.
Summary
The results of this study suggest that SV remains a major public health issue. The state-specific estimates indicate that there is significant variation in the 12-month prevalence of SV by state. These findings have important public health implications. The large numbers of women who reported victimization underscore the need for a renewed effort toward primary prevention of SV. An important part of that effort is the continued collection of state-level data using consistent, uniform, and behaviorally specific definitions of SV. This type of data is valuable because it better enables states to (a) gauge the magnitude of the problem within their own state, (b) examine unique characteristics in their state that may contribute to the prevalence of SV in their population, and (c) compare SV prevalence in their state with the prevalence of SV in the overall population of participating states. Furthermore, policymakers and program planners at the state and federal levels need consistent, comparable data collected over time to monitor the prevalence and temporal trends of SV and to inform program planning and evaluation (Basile & Saltzman, 2002). Finally, routine ongoing surveillance can be used to allocate resources to those populations in greatest need of intervention and prevention, track the burden of SV over time, and evaluate the impact of intervention and prevention efforts.
Footnotes
Authors’ Note
The findings and conclusions in this report are those of the authors and do not necessarily represent the official position of the Centers for Disease Control and Prevention (CDC).
Declaration of Conflicting Interests
The author(s) declared no potential conflicts of interest with respect to the research, authorship, and/or publication of this article.
Funding
The author(s) received no financial support for the research, authorship, and/or publication of this article.