
Abstract
To develop a tool to predict risk for return to a shelter, 150 women with children, exiting a domestic violence shelter, were evaluated every 4 months for 24 months to determine risk factors for returning to a shelter. The study identified four risk factors, including danger for murder, woman’s age (i.e., older women), tangible support (i.e., access to money, transportation), and child witness to verbal abuse of the mother. An easy to use, quick triage tool with a weighted score was derived, which can identify with 90% accuracy abused women with children most likely to return to shelters.
Introduction
Intimate partner violence (IPV) is a global epidemic with prevalence rates of one in three women physically or sexually assaulted over her lifetime (World Health Organization, 2013). Annually, an estimated 4.8 million women in the United States are victims of physical assault by an intimate partner (Center for Disease Control and Prevention [CDC], National Center for Injury Prevention and Control, 2011) and 1,200 women die from partner violence annually (CDC, 2008). The non-fatal consequences of abuse range from permanent injury to chronic physical health problems (Campbell, 2002), such as pain (Symes, McFarlane, Nava, Gilroy, & Maddoux, 2013) and mental health dysfunctions of depression and post-traumatic stress disorder (PTSD; Dillon, Hussain, Loxton, & Rahman, 2013). Partner violence is also associated with poorer pregnancy outcomes, increased risk of incident Human Immunodeficiency Virus (HIV) infection, and homelessness (Jewkes, Dunkle, Nduna, & Shai, 2010; Palladino, Singh, Campbell, Flynn, & Gold, 2011; Wenzel, Tucker, Hambarsoomian, & Elliot, 2006).
Shelters for abused women, also known as women’s shelters or domestic violence shelters, are used by many women to escape the abuse and secure safety for themselves and their children (Galano, Hunter, Howell, Miller, & Graham-Bermann, 2013; Macy, Johns, Rizo, Martin, & Giattina, 2011). Repeat use of shelters is common among abused women. Although none of the studies differentiated first-time users of a shelter from repeat residents, a study funded by the National Institutes of Justice estimated that 85% of shelter residents are repeat users (Lyon, Lane, & Menard, 2008). Women frequently exit and return to shelters several times before sustaining a life of safety and well-being (Brabeck & Guzmán, 2008). Information about the characteristics of women who exit and return to shelters compared with women who exit and do not return is scarce and primarily based on anecdotal evidence from shelter service providers. No prospective cohort-control study was found in the literature about characteristics of abused women who do and do not return to shelters.
Study Purpose
To maximize safety and functioning of abused women and their children and effectively tailor care programs for abused women entering shelters, information is needed to predict women’s likelihood of returning to shelters. Toward this end, this research developed a rapid assessment triage tool to predict likelihood of shelter return from a prospective cohort-control study of abused women with children who exit shelters and return within 24 months compared with abused sheltered women who do not return. Having such a tool, and understanding the factors associated with increased risk for returning to the shelter, can help frontline providers to better inform women about their likelihood of returning and enable abused women and providers to take actions that lessen the possibility of women returning and result in better outcomes for abused women and their children.
This research is part of a larger 7-year study used to examine the impact of safe shelter and justice services interventions for abused women and their children, the methods of which are described in detail by McFarlane, Nava, Gilroy, Paulson, and Maddoux (2012) as well as detailed characteristics of the participants (McFarlane, Nava, Gilroy, & Maddoux, 2015).
Method
Design
A prospective cohort-control design is followed with repeated measures every 4 months for 24 months.
Setting
The study occurred in a large urban metropolis in the United States with a population exceeding four million people. Five shelters designated for abused women with a collective bed capacity of 500 women form the study site. The shelters offer standard services of safe shelter, counseling, and advocacy.
Population and Sample Size Determination
Our eligible population was English- or Spanish-speaking abused women entering shelters for abused women for the first time and who had at least one child between the ages of 18 months and 15 years. The sample was set at 150 women based on a power analysis for the larger 7-year study of outcomes for abused women using shelters and justice services (McFarlane et al., 2012). This research is used to address outcomes for sheltered women.
Procedures
Following internal review board approval, recruitment began at five local shelters for abused women. Trained, bilingual researchers in English and Spanish approached all women entering the shelter and established eligibility criteria within 48 hr of entering the shelter. A total of 10 eligible women refused to participate, usually due to a lack of time, and 6 women were missed (i.e., left the shelter prior to screening). Eligible women were taken to a private room and were invited to participate in the study. After signing informed consent and completing the 60-min interview, all 150 women were offered US$30 cash. Two native Spanish and English speakers completed standard forward and backward translations of all questionnaires from English to Spanish and back to English. The researchers recorded the women’s responses. Recruitment, eligibility screening, and entry into the study continued daily for 13 months at the 5 shelters until 150 eligible women agreed to participate in this study.
Participants
The 150 women who participated in this study ranged from 18-52 years old, and 46% self-identified as Hispanic, 26% self-identified as Black, 11% self-identified as White, and the remaining self-identified as multi-racial or Asian. The length of the relationship with the abuser ranged from less than a month to 25 years with a mean of 7 years and standard deviation of 5.2 years. Most women reported they had completed secondary education or the equivalent.
Measures
To establish temporal sequencing, the measures were asked at entry into the study, prefaced with “During the last 4 months” and repeated every 4 months, prefaced by “Since we talked on (date of last visit).” A 4-month interval was selected to maximize stability of instruments and to minimize recall bias. All measures were completed within 48 hr of entry into the shelter. In addition to demographic characteristics, measures assessed severity of abuse; danger for murder; mental health symptoms of depression, anxiety, somatization, and PTSD; and measures of social support, marginalization, self-efficacy, and community resource use and difficulty. Women were asked to rate their perceived health state and the frequency their child had witnessed physical abuse. Child measures of internalizing and externalizing measures were also assessed. Psychometrics of all measures are presented elsewhere (McFarlane et al., 2012).
Rapid Assessment Triage Tool Development: Statistical Procedures
Prior to analysis, a set of risk factors were chosen that could be used to predict return to the shelter within 24 months. In total, 22 variables were tested including mother demographic information (i.e., age and length of time in relationship with abuser), mother abuse information (i.e., sexual abuse score, danger assessment score), and degree of child exposure to domestic violence (Blair, McFarlane, Nava, Gilroy, & Maddoux, 2015; Graham-Bermann & Perkins, 2010). The 22 independent variables were collected at the time the woman first entered the emergency shelter.
The relationship between each predictor variable and whether the woman returned to the shelter within 24 months was assessed by univariable categorical regression (Meulman, van der Kooij, & Heiser, 2004). Continuous variables were modeled using non-monotonic second-degree spline scaling with two interior knots based on preliminary inspection of Receiver Operating Characteristic (ROC) curve analysis showing non-linear relationships between the continuous predictors and outcomes (Meulman et al., 2004). The ROC curve is an important tool for diagnostic test evaluation in which the true positive rate (sensitivity) is plotted as a function of the false positive rate (100-specificity) for each value of a predictor variable (Zweig & Campbell, 1993). The area under the ROC curve (AUC) is a measure of how well a predictor can distinguish between those with and without an outcome of interest.
Consistent with the methods recommended by numerous authors (Moons et al., 2012; Steyerberg, Eijkemans, Harrell, & Habbema, 2001; Sun, Shook, & Kay, 1996), potential predictors were not eliminated based on the significance level of univariable analysis. Instead, to identify the subset of predictors with the highest prognostic ability to predict return to shelter, categorical regression using optimal scoring and lasso (L1) penalization was used (Tibshirani, 1996). Once the optimal predictors were selected using the lasso with .632 bootstrap (50 samples), final model coefficients and scoring were obtained using categorical regression with optimal scoring. Next, standard logistic regression was used to obtain the predicted probability of return to shelter from the score obtained from combining the set of optimal predictors into a regression equation.
Model discrimination was assessed by the AUC statistic and the discrimination slope. Model calibration was assessed with the Hosmer–Lemeshow test and by assessing the stratification capacity (Janes, Pepe, & Gu, 2008) and the sensitivity (probability of a positive result when outcome is present) and specificity (probability of a negative result when the outcome in not present) of the model at each level of stratification. Finally, model validation was addressed by bootstrapping the AUC and reporting the values and 95% confidence interval (CI) to maximize statistical efficiency and directly validate the final model (Skalská & Freylich, 2006). SPSS version 21.0 was used for all analyses.
Results
Rapid Assessment Triage Tool Development
Of the 150 women who exited the shelter, follow-up information on whether they returned within 2 years was available for 149 of them; 19.5% (n = 29) returned within 2 years and 80.5% (n = 120) did not return. Descriptive statistics of the potential predictor variables by whether or not the mother returned to the shelter after 24 months are shown in Table 1. In addition, standardized beta values are given for univariable categorical regressions for each potential predictor (see Table 1 note for more details regarding the categorical regressions). The beta weights provide a measure of effect size for the non-linear relationship between the predictor and return to shelter. Each significant beta corresponds to a chart in Figure 1 which shows the nature of the non-linear relationships between the predictor values and return to shelter. The predictor variable labels are shown on the x-axis and quantification scores shown on the y-axis. Higher quantification scores are associated with a greater likelihood to return to the shelter (Meulman et al., 2004).
Descriptive Statistics and Bivariate Analysis.
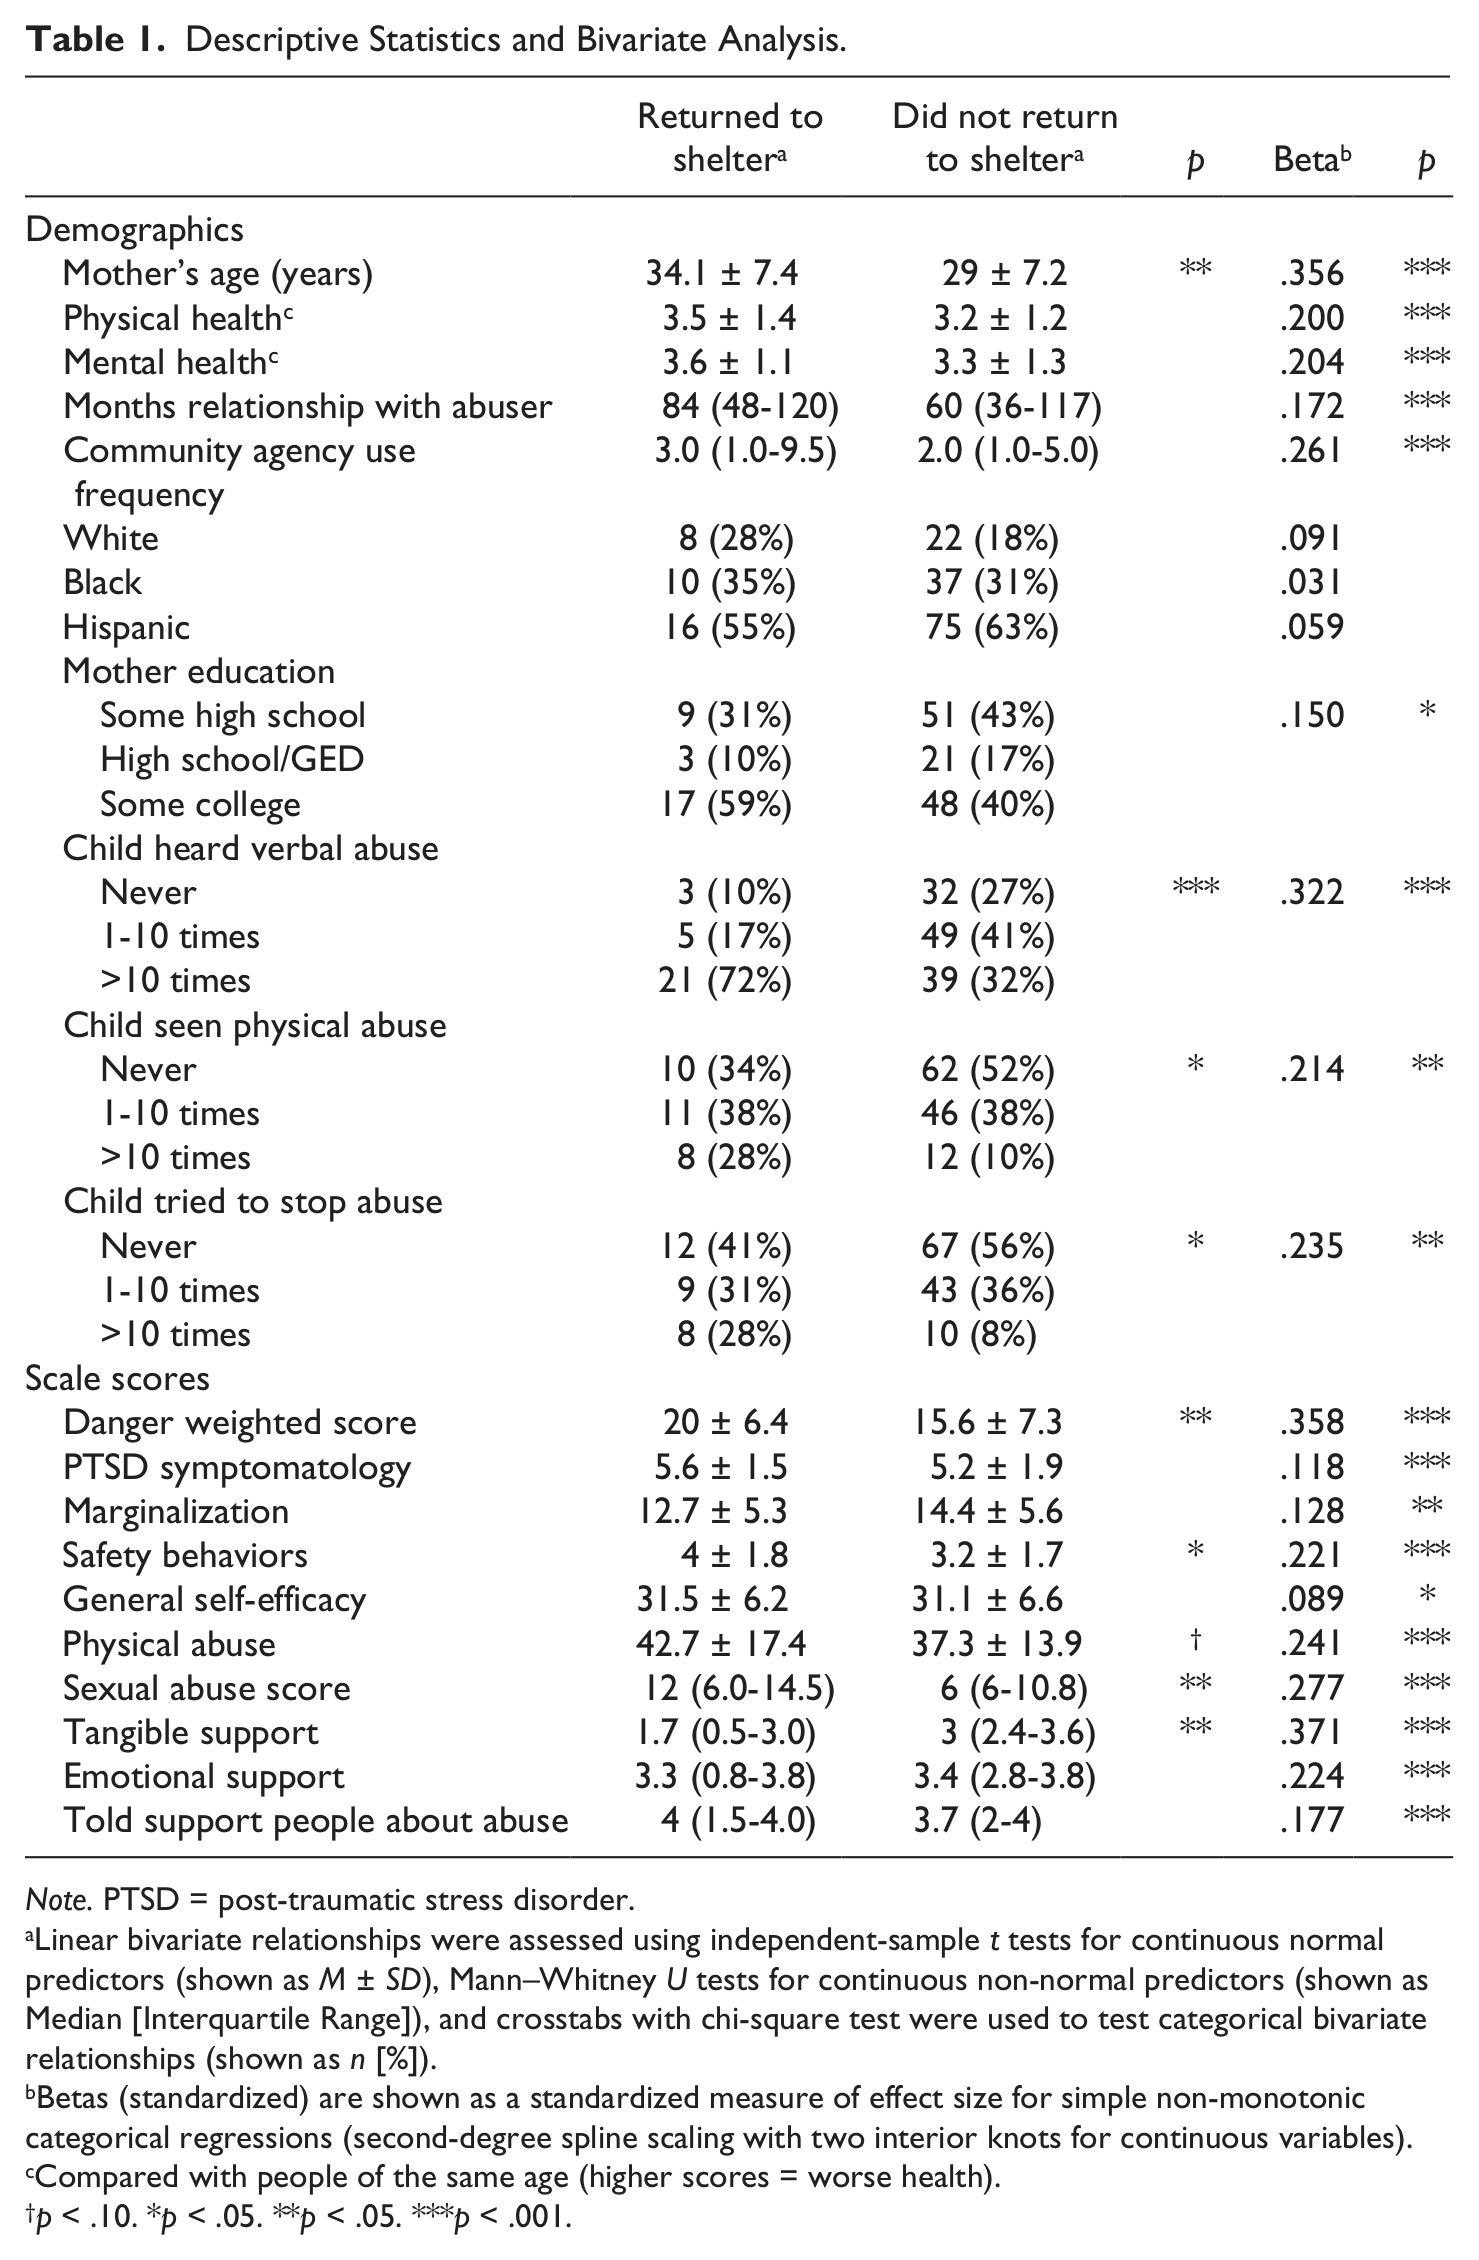
Note. PTSD = post-traumatic stress disorder.
Linear bivariate relationships were assessed using independent-sample t tests for continuous normal predictors (shown as M ± SD), Mann–Whitney U tests for continuous non-normal predictors (shown as Median [Interquartile Range]), and crosstabs with chi-square test were used to test categorical bivariate relationships (shown as n [%]).
Betas (standardized) are shown as a standardized measure of effect size for simple non-monotonic categorical regressions (second-degree spline scaling with two interior knots for continuous variables).
Compared with people of the same age (higher scores = worse health).
p < .10. *p < .05. **p < .05. ***p < .001.
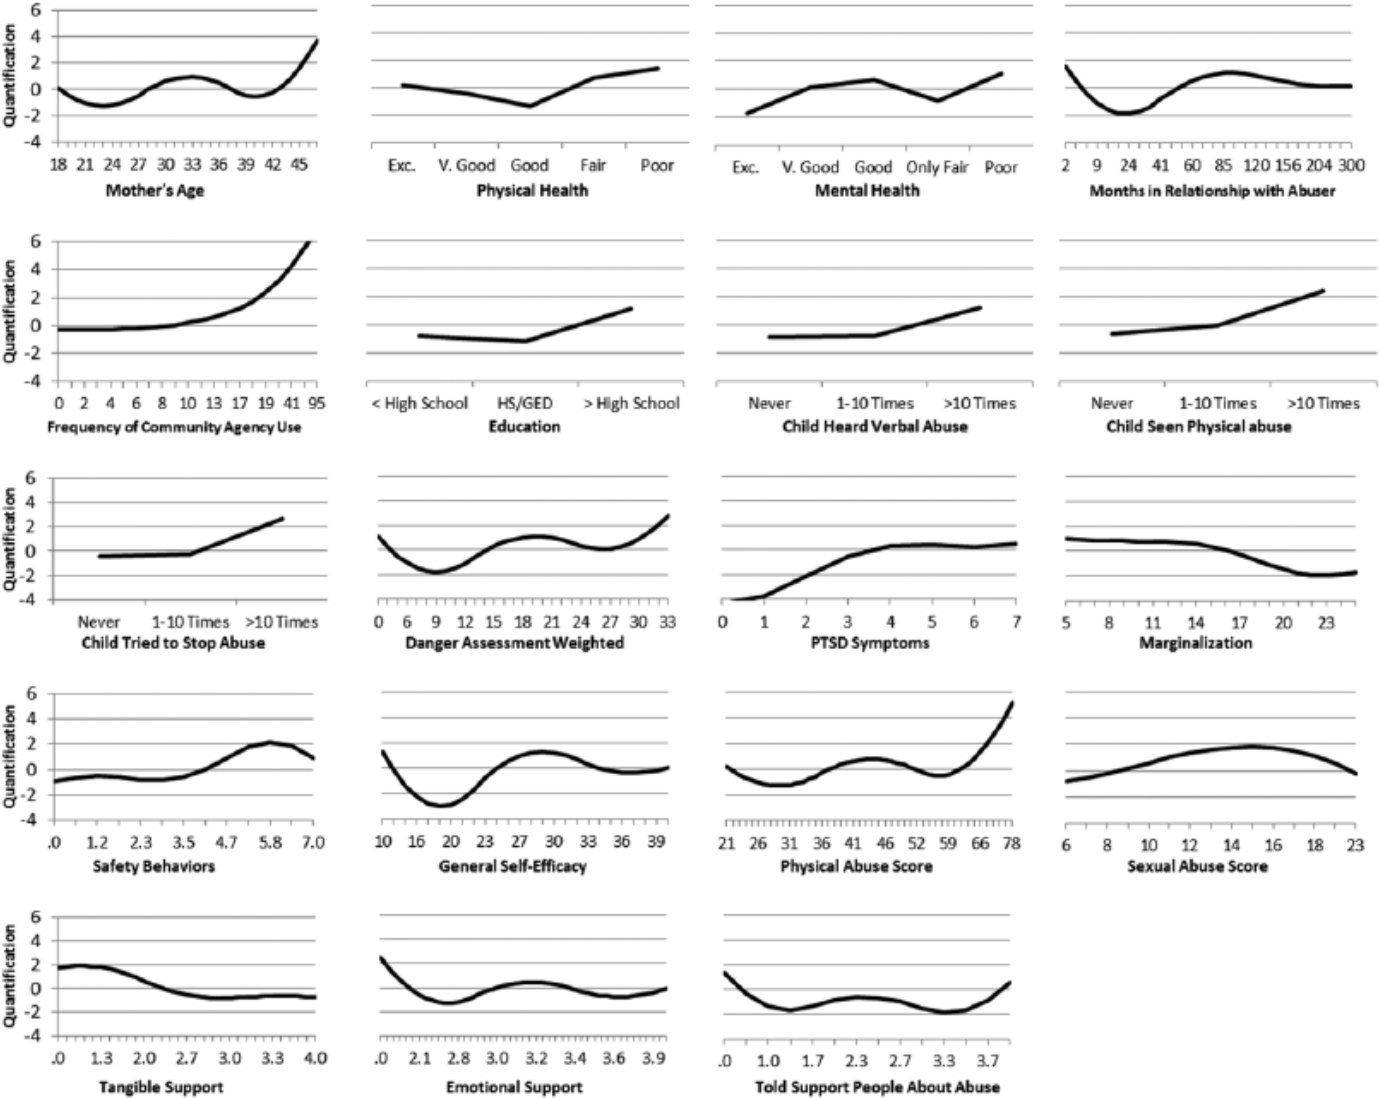
Transformation plots showing significant non-linear relationship between potential predictor variables and return to shelter at 24 months.
All 22 predictor variables were entered into the categorical regression with optimal scoring and lasso (L1) penalization 1 (Tibshirani, 1996). The final predictors were chosen by identifying the parsimonious optimal model. 2 Next, the final predictors were entered into a categorical regression (with no penalization). Both the categorical predictors and discretized (categorized) continuous variables were entered non-monotonically. More details about this procedure are given in the note of Table 2. Final model beta coefficients and associated model statistics, including AUC, are presented in Table 2, as well as the quantification scores and odds ratios of the discretized variables. The AUC was high at .90 (95% CI [.85, .96]; p < .001) indicating good model discrimination. After 2,000 cycles of bootstrapping, the average reduction in AUC was .003 (95% CI change <.01), suggesting very minimal overfitting. Furthermore, the discrimination coefficient, or in other words the absolute difference in the average prediction for women who did (M = 50.1%, SD = 28%) and did not (M = 12%, SD = 17.1%) return to the shelter, was 38.1% (SE = 5.4%, p < .001). Beta weights and the discretized scores for each category of each predictor were multiplied to create a regression equation for each model. These values were linearly transformed and final scores after transformation were used to create the rapid assessment tool (see Figure 1).
Model Coefficients and Performance.
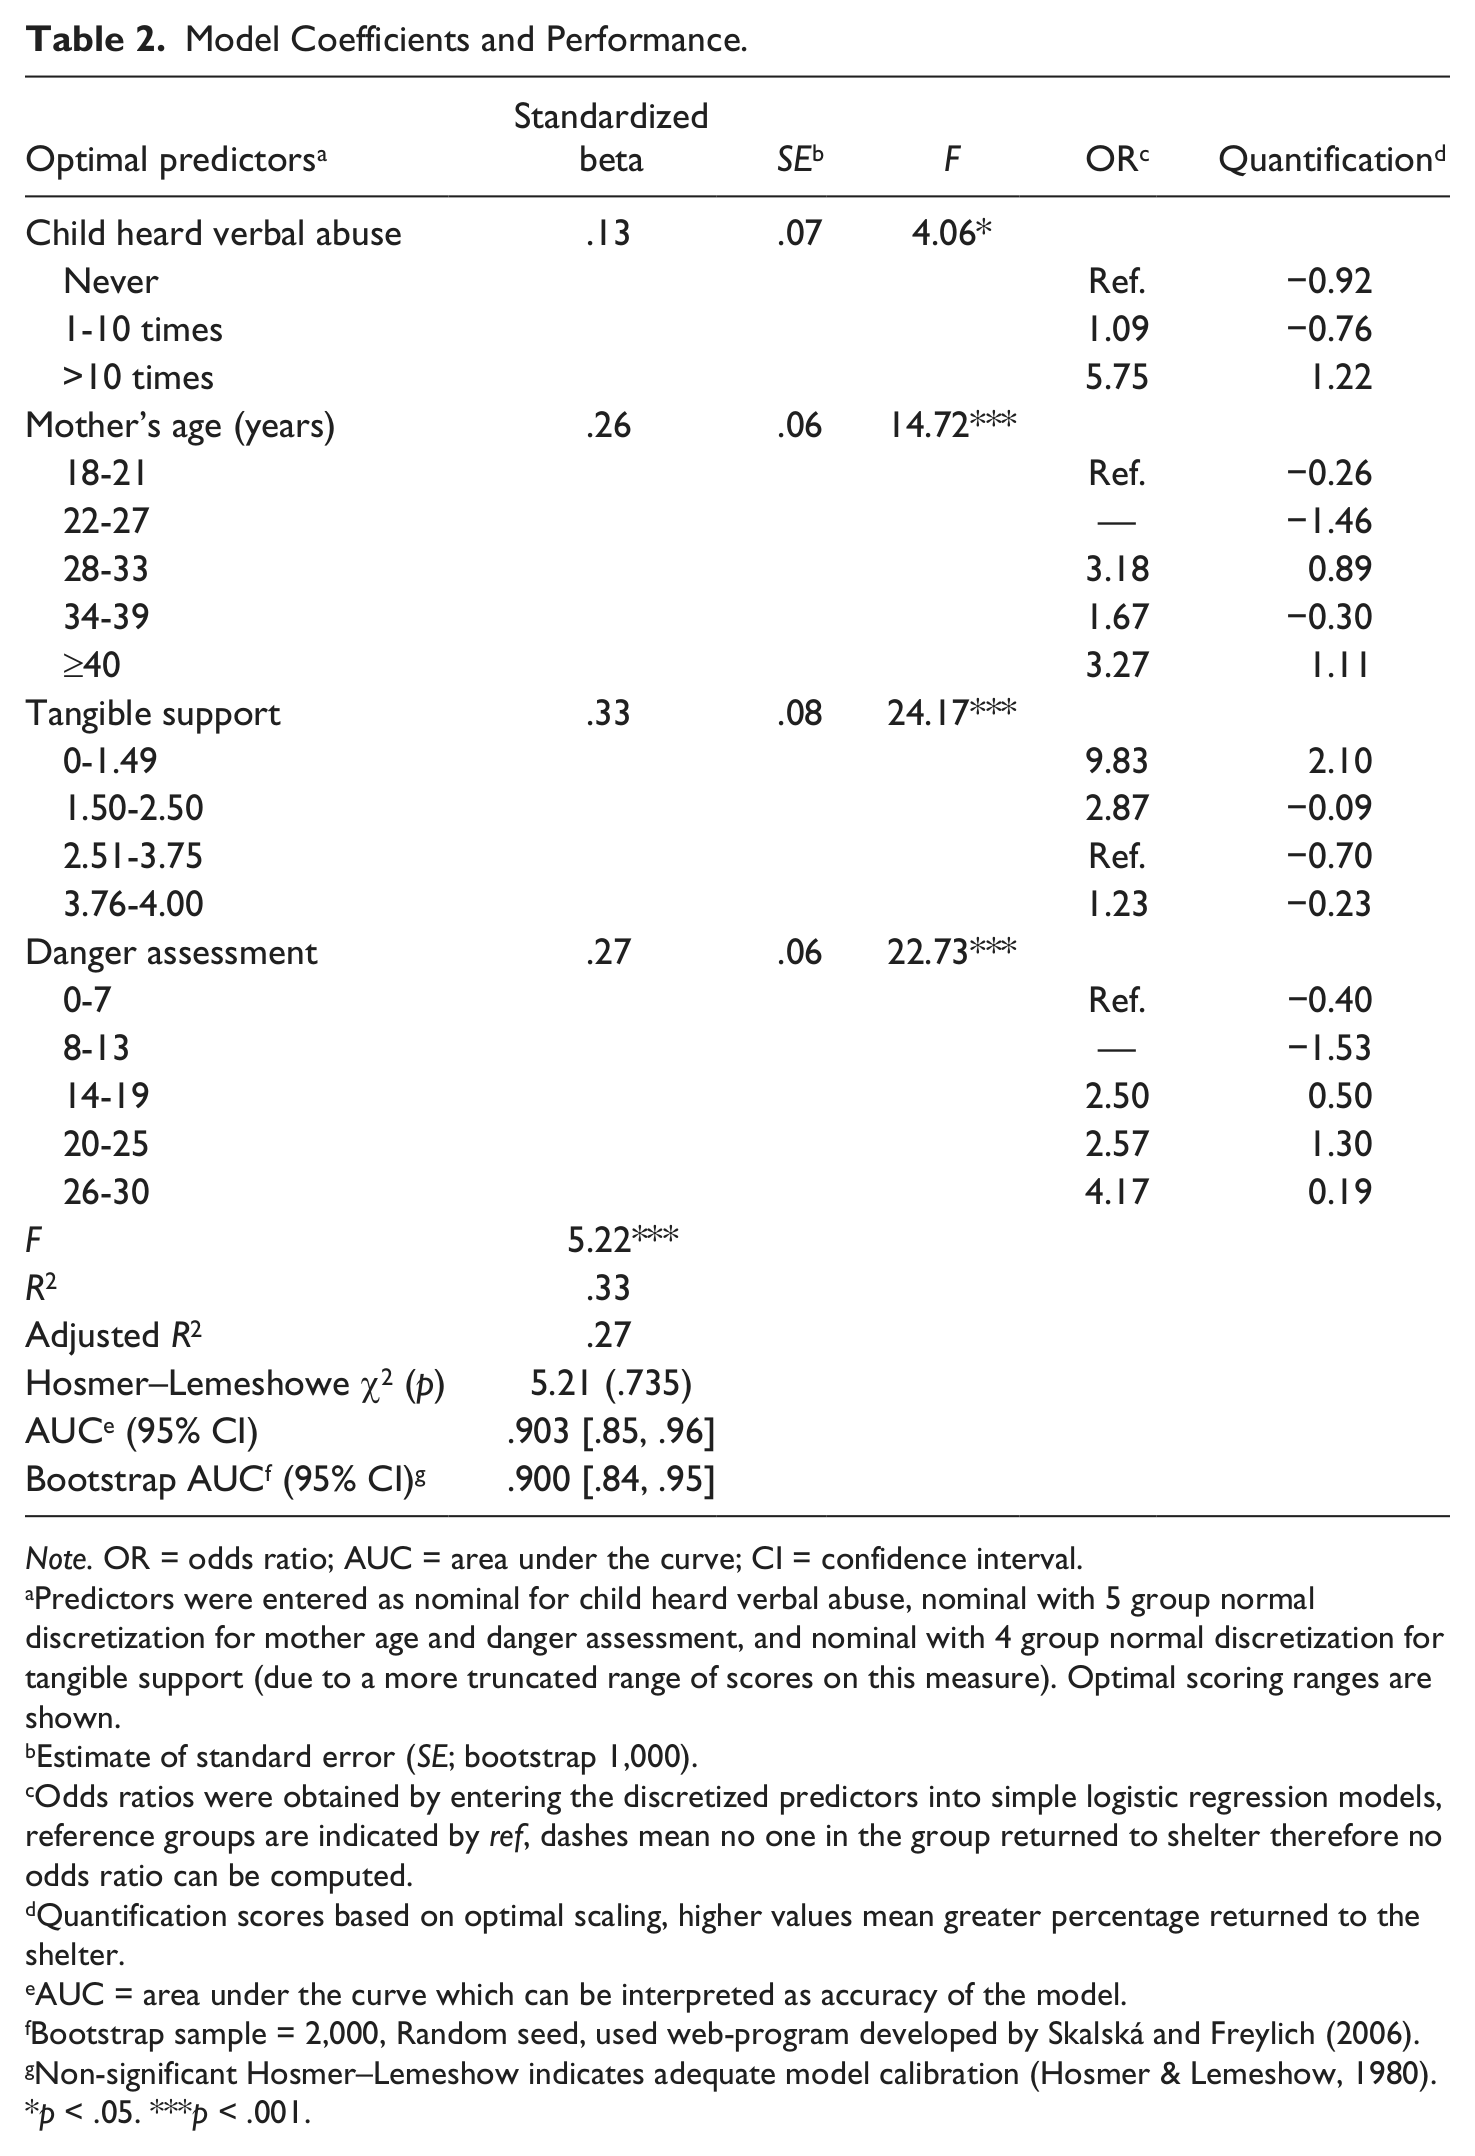
Note. OR = odds ratio; AUC = area under the curve; CI = confidence interval.
Predictors were entered as nominal for child heard verbal abuse, nominal with 5 group normal discretization for mother age and danger assessment, and nominal with 4 group normal discretization for tangible support (due to a more truncated range of scores on this measure). Optimal scoring ranges are shown.
Estimate of standard error (SE; bootstrap 1,000).
Odds ratios were obtained by entering the discretized predictors into simple logistic regression models, reference groups are indicated by ref, dashes mean no one in the group returned to shelter therefore no odds ratio can be computed.
Quantification scores based on optimal scaling, higher values mean greater percentage returned to the shelter.
AUC = area under the curve which can be interpreted as accuracy of the model.
Bootstrap sample = 2,000, Random seed, used web-program developed by Skalská and Freylich (2006).
Non-significant Hosmer–Lemeshow indicates adequate model calibration (Hosmer & Lemeshow, 1980).
p < .05. ***p < .001.
As shown in Table 3, the model successfully stratified the population into clinically relevant risk categories indicating good model calibration. Over one third of the women (37.6%) were classified into a very low risk group (predicted probability of <5%). Of these, none of the women returned to the shelter within 24 months. Of the women classified as having the highest risk (predicted probability of returning to the shelter >70%), 75% of them did return to the shelter within 24 months. As seen in Table 3, when the predicted probability of the woman returning to the shelter is greater than 40%, the probability that the woman will actually return to the shelter (sensitivity) was 58.6%, whereas the probability that the woman would not return to the shelter when she actually did not return (specificity) was 94.2%. Sensitivity and specificity are provided for each level of predicted probabilities.
Risk Stratification Table Assessing Models by Predicted Probabilities of Return to Shelter.
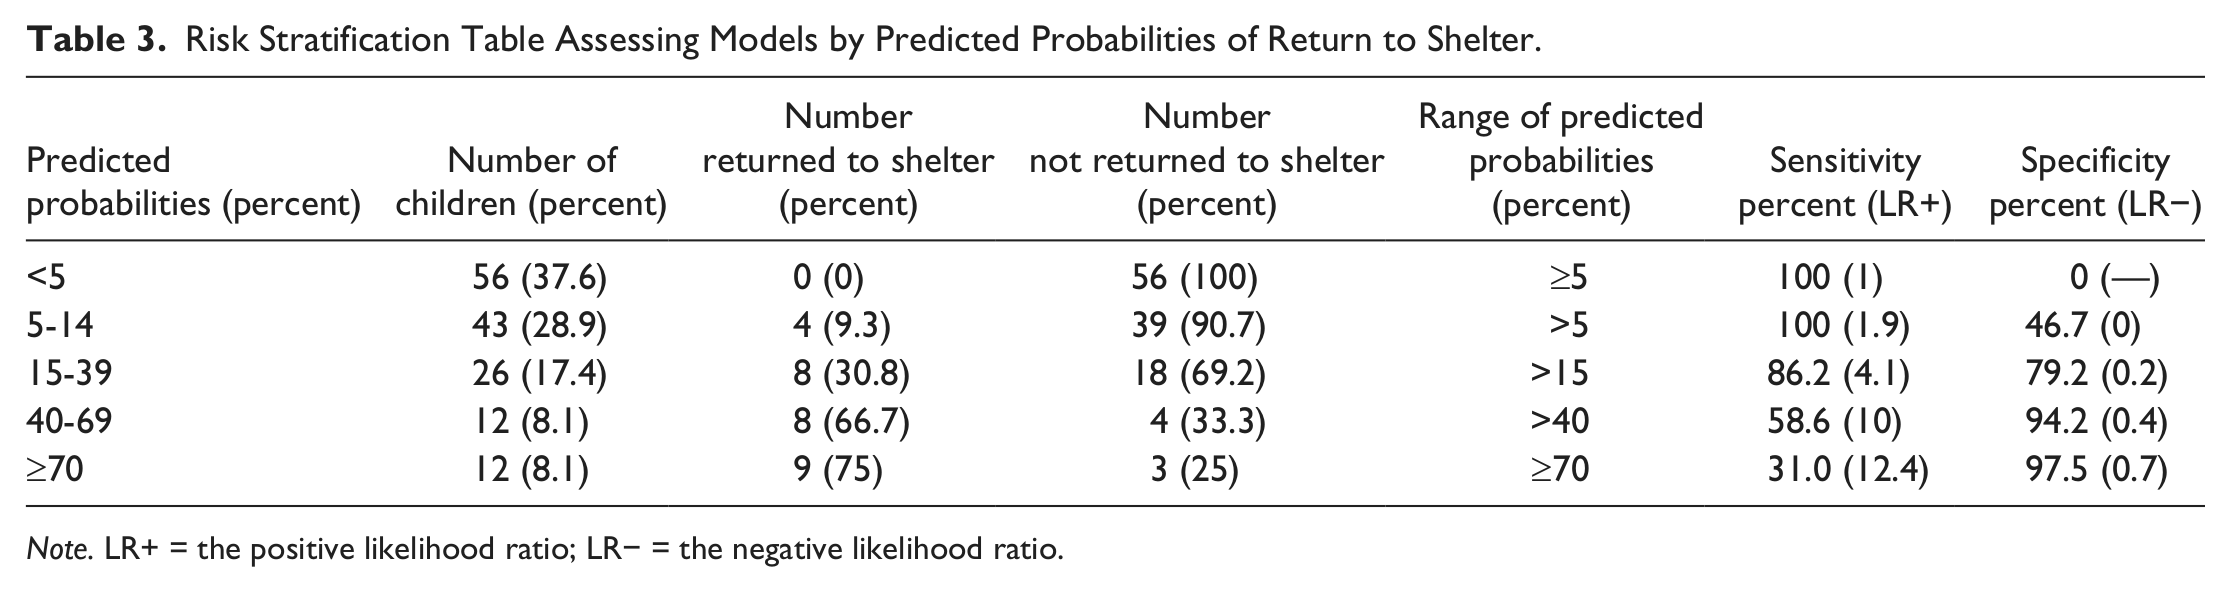
Note. LR+ = the positive likelihood ratio; LR− = the negative likelihood ratio.
In summary, a predictive tool was developed to predict whether or not a woman will return to a domestic shelter within 24 months of the time she first seeks protection from a domestic shelter. The accuracy of the models was good and suggests a useful tool for assessment of risk of returning to the shelter.
Rapid Assessment Triage Tool: Four Key Predictors
The four scores needed to assess the abused woman’s risk of returning to the shelter include: (a) woman’s age, (b) tangible support score, (c) danger score for murder, and (d) child witness to verbal abuse of the mother. The woman’s age is a simple, one question demographic item. Tangible support is assessed from 2 items answered about
three people who provide tangible support (i.e., money, transportation) during the last 4 months (Norbeck, Lindsey, & Carrieri, 1981, 1983). The danger assessment scale is comprised of 19 items answered on a yes/no scale, which are weighted and refer to risk factors that have been associated with murder in situations involving abuse (Campbell, 1986, 1995). Child witness to verbal abuse is measured by asking the mothers how many times the child has heard verbal abuse in the preceding 4 months. Child witness is investigator derived.
Each raw score obtained from the four risk factors mentioned above have corresponding weighted totals to account for the varying degree of risk associated with a particular outcome on a given measure. Once weighted scores are obtained for each of the four risk factors, a simple sum of the weighted scores provides an assessment with an overall risk factor score. These risk scores range from 286-548 which are categorized into minimal/no risk, some/low risk, moderate risk, high risk, and extreme risk of returning to the shelter. The total time needed to complete the four measures is about 4-6 min, and scoring can be completed by hand in approximately 1-2 min. The Rapid Assessment Triage Tool appears in Figure 2.
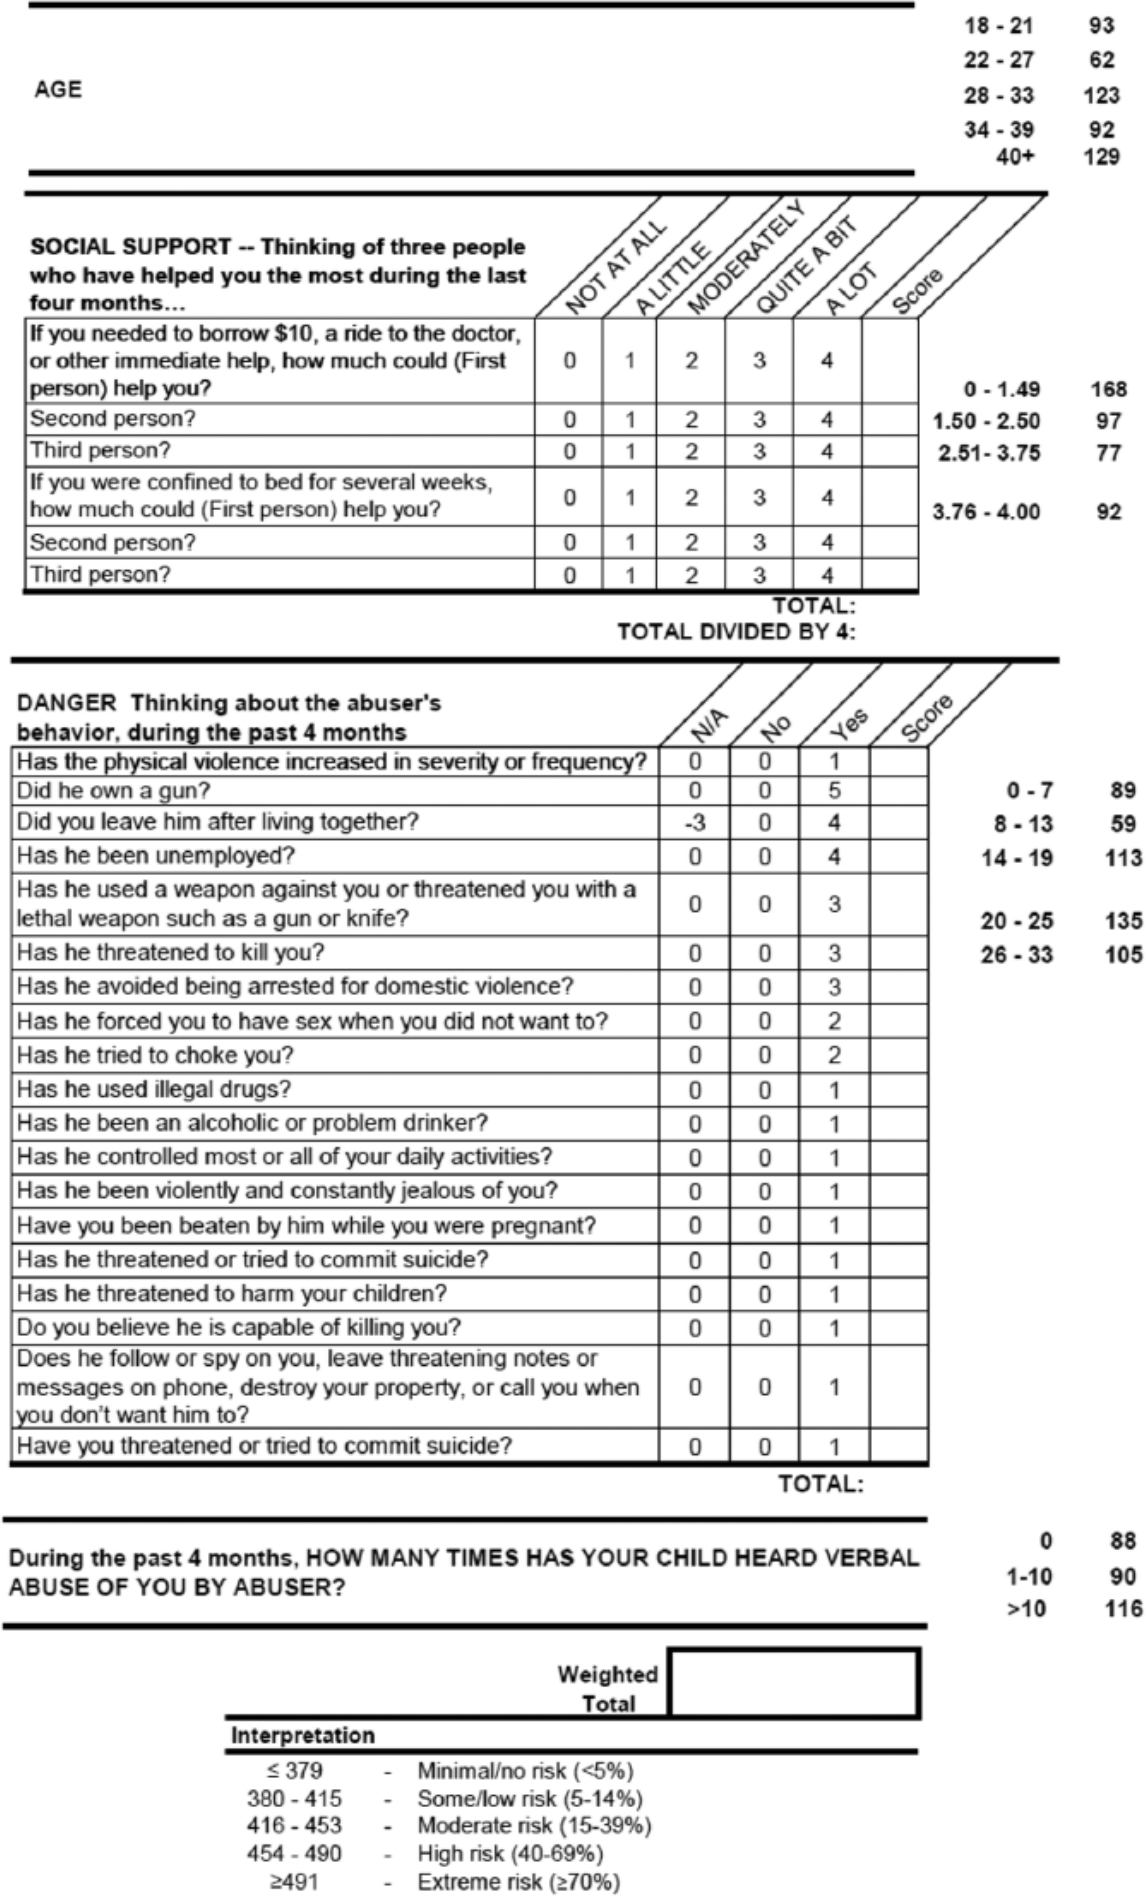
Rapid assessment triage tool.
Discussion
Our study identified four key risk factors, including woman’s age, tangible support, danger for murder, and child witness to verbal abuse of the mother. A triage tool derived from the four risk factors offers a predictability measure of return to shelter with 90% accuracy. Each factor is associated with several folds of increased risk to shelter return. For example, we found that older age is a risk factor. Women above the age of 40 were 3.27 times more likely to return to the shelter compared with those between the ages of 18 and 21.
We believe the tool can offer abused women and shelter service providers a way to predict return and intervene for best outcomes based on empirical evidence. For example, many abused women lack the ability to recognize the extreme danger and risk for murder associated with the abuse (Campbell, 2004) with the risk of being assaulted by their abusive partner potentially increasing 25 fold (Anderson & Saunders, 2003). A major predictor of return to the shelter is the danger level for murder. We found that women with reported levels of danger between 26 and 30 were just over 4 times more likely to return to the shelter compared with those with reported levels of danger between 0 and 7. Knowing one’s risk for murder and associated risk of returning to the shelter, can enable abused women and shelter providers to focus on safety and potentially prevent further trauma from the abuser and a return to the shelter.
Child witness to abuse of their mothers are associated with increased behavioral problems and compromised development (Durand, Schraiber, Franca-Junior, & Barros, 2011; Spiller, Jouriles, McDonald, & Skopp, 2012). Building on previous evidence, our study found that child witness to verbal abuse of their mothers is linked to repeat use of shelters. We found that mothers of children who heard abuse more than 10 times were nearly 6 times more likely to return to the shelter compared with women whose children never heard verbal abuse, which suggests a dose response impact on the child.
Although shelters are available as a resource to all abused women (Macy et al., 2011), the goal is to enable shelter users to advance to a safe lifestyle and not require further sheltered care. Available tangible support can make a difference in sustaining abused women’s successful transition out of the shelter service. Our study found having tangible support between 0 and 1.49 was associated with nearly 10 times greater likelihood of returning to the shelter compared with those with reported support between 2.51 and 3.75. To maximize shelter resources and serve the most women, shelters seek to limit repeat usage and demonstrate the effectiveness of their services and programs (Bennett, Riger, Schewe, Howard, & Wasco, 2004). Our triage tool indicates the need for shelter service providers to enable abused women to identify and maintain tangible support sources.
The value of shelter use and outcomes has been on political agendas for several years (Bennett et al., 2004; Brabeck & Guzman, 2008; Chanley, Chanley, & Campbell, 2001), yet evidence-based triage and plans of care are lacking. The rapid assessment triage tool can predict likelihood of return with 90% accuracy and thereby provide abused women and shelter providers with evidence for woman-focused care and potentially avert further shelter stays and sustain safer outcomes. In addition, the rapid assessment tool derived from this study has usefulness for service providers at homeless shelters, as many abused women are homeless because of partner abuse (Fisher, Hovell, Hofstetter, & Hough, 1995; Vostanis, Tischler, Cumella, & Bellerby, 2001; Wenzel et al., 2006).
Despite high prevalence and recognized adverse consequences, partner violence remains as a significant and largely unaddressed public health issue (Moyer, 2013). Recent policy development recognizes the importance of both violence screening and the provision of care. In January 2013, the U.S. Preventive Services Task Force (USPSTF) issued a recommendation for health-care providers to begin routine screening of women patients for partner violence (USPSTF, 2013). Following a positive screen, the USPSTF recommends that clinicians provide or refer women to intervention services, and this recommendation applies to women who do not have signs or symptoms of abuse (USPSTF, 2013). In addition, abuse screening is covered by the Affordable Care Act (ACA) and is available to a woman free of charge if she is insured (James & Schaeffer, 2012). The ACA coverage began in August of 2012 and includes both women and adolescent girls. Safe shelters have been a primary referral for abused women. First-time shelter users may increase as a result of increased screening and referral.
In conclusion, it is important to remember the rapid assessment triage tool was created on our data and thus “fits” very well to our data. The sample was a convenience sample. Participants were first-time shelter users. It is possible that with other samples the exact measures, cutoffs, and percent that is accurately predicted may be somewhat different. Of course, any tool developed will need further refinement and validation as it becomes more widely used. Future studies are needed to test applicability of the rapid assessment tool in shelters for abused women and abused women accessing homeless shelters. Outcome measurements should look both at the rate of repeat shelter usage and safety and well-being among the abused women who access those shelters and who are assessed with the rapid assessment triage tool. We anticipate the direct care cost might increase in the short term, but in the long run, efficient triage at the point of intake of abused women at shelters can be cost-saving and, more important, enhance safety and functioning for abused women and their children.
Footnotes
Acknowledgements
We appreciate the unflagging assistance and support of the administrators and staff of the five shelters in Harris County and the chief and staff of the Harris County District Attorney’s Office, Family Criminal Law Division.
Declaration of Conflicting Interests
The author(s) declared no potential conflicts of interest with respect to the research, authorship, and/or publication of this article.
Funding
The author(s) disclosed receipt of the following financial support for the research, authorship, and/or publication of this article: the Houston Endowment.