
Abstract
Why do we see persistence, recurrence, and new emergence of concentrated poverty in U.S. cities? In this article, we explore an understudied connection: whether an important part of the built environment—a series of attributes that constitute precarious housing—constitutes a durable substrate on which concentrated poverty predictably emerges and recurs and if so, how this might vary across the United States. Poverty grew fastest between 2000 and 2005–2009 in tracts that began the decade with high levels of rented one- to four-family housing, multifamily housing, housing between 20 and 25 years old, and households paying over 30% of their income for housing costs. In addition, poverty grew fastest in tracts with high percentages of black or Hispanic households in 2000.
Keywords
Introduction
A subset of neighborhoods attracts higher than average shares of vulnerable people and households. Previous analysis has shown that vulnerable people concentrate in a minority of households, and that these vulnerable households concentrate in “precarious” dwelling units (Pendall, Theodos, and Franks 2012). In this article, we explore whether and how concentrations of certain types of precarious dwelling units can make some neighborhoods highly sensitive to sudden changes in metropolitan poverty rates. We show that indeed, neighborhoods with high shares of rented one- to four-unit housing, multifamily housing, middle-aged housing, and overpayment are more sensitive to increases in poverty than those dominated by owner-occupied, very new, or very old structures. We also show that metropolitan areas differ in their neighborhoods’ level of sensitivity to high levels of precarious housing.
Although these findings may appear simply to confirm conventional wisdom, they fill an important gap in the literature on concentrated poverty. Much recent research has focused on the harms done by high neighborhood poverty rates to the people—especially the children and youth—who live there, especially for successive generations (Sampson 2012; Sharkey 2013). Other work has highlighted the important role of racial segregation in creating and reinforcing high neighborhood poverty rates (Massey and Denton 1993; Massey and Fischer 2000; Quillian 2012). The role of the built environment in exacerbating or protecting against rising neighborhood poverty has received more modest attention in recent years, however. The work we report here suggests that high-poverty neighborhoods are built literally on the bricks and mortar of the durable housing stock.
Policy to reduce concentrated poverty therefore necessarily should consider incorporating changes to the housing stock. In economically strong metropolitan areas, such change can often occur with the addition of new housing in different configurations and tenures and the attraction of new middle- or upper-income households, a process that need not generate displacement of low-income people. In weaker ones, however, changing the neighborhood housing stock may be much more difficult, especially as many such metropolitan areas continue to add single-family housing at their fringes.
The next section reviews the literature on the nature and status of concentrated poverty. After that, we discuss our data and methodological approach, present our results, and close with a discussion of policy implications and needs for further research.
Background: Concentrated Poverty and Its Causes
Concentrated poverty, sometimes under a different label, has drawn attention from researchers for generations. Living in an area of concentrated disadvantage can have powerful, detrimental effects on one’s life chances (Clampet-Lundquist et al. 2006; Currie and Moretti 2007; Currie and Yelowitz 2000; Ellen and Turner 1997; Kling, Liebman, and Katz 2007; Leventhal and Brooks-Gunn 2000; Ludwig 2012; Orr et al. 2003; Sharkey 2013). There are multiple ways that concentrated poverty could affect individual outcomes, including public safety, quality of schools, peer networks, public health, and so on. The negative effects of concentrated poverty are not limited to the disadvantaged neighborhoods and the people who live there, but to their entire metropolitan areas, which bear the costs of exclusion, isolation, and increased crime, as well as the economic costs that stem from the lack of connection between potential employees and jobs and increased sprawl (Downs 1994; Orfield 2002).
Motivated by these many concerns about the harmful impact of concentrated poverty, many researchers have described trends in concentrated poverty. Concentrated poverty has increased over the past four decades. In metropolitan areas, the percentage of residents in “high-poverty” neighborhoods (census tracts with over 30% poor residents) increased from 6.4% to 9.1% between 1970 and 1990 (Pendall et al. 2011). In the 1990s, the percentage of residents living in high-poverty neighborhoods declined to about 7.2% (Jargowsky 2003; Kingsley and Pettit 2003).
Since 2000, however, the percentage and number of people living in high-poverty neighborhoods increased again. By the second half of the decade, nearly 12% of metropolitan-area residents—nearly 30 million people in all—lived in high-poverty neighborhoods. Among these, 9.2 million lived in tracts with “extreme poverty” rates of 40% or more (Pendall et al. 2011). By 2010, the exposure of residents nationwide to extreme poverty rose to over 12.3 million (Bishaw 2014), as the country continued to suffer the disruption of a financial crisis that led to the loss of over 4.6 million homes to foreclosure since 2007 (CoreLogic 2013).
What forces contribute to these changes in concentrated poverty? A primary cause of changes in concentrated poverty is changes in the overall poverty rate. Jargowsky (1997) identified the metropolitan income structure—specifically, mean income and income inequality—as a substantial and significant determinant of the percentage of a metropolitan area’s blacks living in extreme poverty neighborhoods. Consistent with Jargowsky’s connection between metropolitan income structure and concentrated poverty, the phases of concentrated poverty change correlate strongly with changes in the national poverty rate since 1970. Rising poverty appears to create outsized increases in concentrated poverty, however. Between 2000 and 2005–2009, on average, a 1 percentage point gain in a metropolitan area’s poverty rate associated with a 1.8 percentage point gain in the percentage of residents living in high-poverty neighborhoods. 1
Race and ethnicity also contribute in many ways to the variation across metropolitan areas in levels of concentrated poverty and changes therein. First, Black non-Hispanics (“Blacks”) and Hispanics are at much higher risk than White non-Hispanics (“Whites”) of being poor, so metropolitan areas with high proportions of Black and Hispanic residents are at least indirectly more likely to have high levels of concentrated poverty (Osypuk et al. 2009). Blacks and Hispanics also live disproportionately in high-poverty neighborhoods even when they personally are not poor. Only 15% of Whites with family incomes below the poverty line live in neighborhoods whose poverty rates exceed 30%, whereas 17% of Blacks and 13% of Hispanics who are not poor live in such high-poverty neighborhoods (Pendall et al. 2011). At least in the 1980s, too, the drivers of poverty change varied depending on the predominant racial composition of the neighborhood, with mainly African-American neighborhoods sensitive to metropolitan job growth, for example, in ways that White and Hispanic neighborhoods were not (Galster and Mincy 1993). Racial segregation—which remains very high in some metropolitan areas—also contributes independently to metropolitan levels of concentrated poverty (Jargowsky 1997). Finally, racial and ethnic diversity is increasing in most U.S. metropolitan areas, contributing independently to rising concentrated poverty.
Even accounting for differences in poverty and racial composition, however, metropolitan areas differ substantially from one another in their level of concentrated poverty (Pendall et al. 2011; Jargowsky 1997; Kingsley and Pettit 2003). Researchers looking for further explanation have shifted downward in scale to explore the role of residential mobility in changing neighborhood poverty rates and racial composition (Freeman 2008). Logically speaking, neighborhood poverty rates can increase for a combination of reasons. Incumbent residents can remain in place but more become poor; higher-income out-movers can leave already poor incumbents behind; and poor newcomers can move in at high rates, with no change in incumbents’ poverty status.
Mobility rates in poor neighborhoods are high (Kingsley and Pettit 2007), but this does not generally translate to fast changes in the composition of neighborhoods. Indeed, poor neighborhoods tend to remain poor because residents who become better off and leave a poor neighborhood are often replaced by a new set of poor in-movers (Andersson and Bråmå 2004; Coulton et al. 2012). This process can create a process of change where corporate, nonprofit, and public resources are drawn into communities (Temkin and Rohe 1996). To the extent neighborhood poverty rates do fall—which was less common—this occurs much more via residential mobility (poor people move out faster than working-class people move in) than by changes in incumbent income levels (Coulton et al. 2012).
As individual mobility decisions help drive changes in neighborhood poverty levels, it is important to understand the contributions of variation in neighborhood attributes that households consider when they move (and even when they decide not to move). Racial composition is highly salient to movers, with nonpoor households of all races and all Whites avoiding neighborhoods with high proportions of Black and, to a lesser extent, Latino residents (Krysan and Farley 2002).
How Might Precarious Housing Affect Neighborhood Poverty?
Beyond these factors, what then is the influence of a built housing environment on concentrated poverty? The neighborhood housing stock is central to mobility decisions of all kinds (Clark and Dieleman 1996). Yet this form of built environment, which changes slowly—sometimes imperceptibly—has received too little attention in recent treatments of the roots and reproduction of concentrated poverty. 2 Recent work shows that people in poverty—like other vulnerable individuals—concentrate in certain kinds of housing units: almost 70% of people in poverty in 84 large metropolitan areas in 2005–2007 lived in rented housing, compared with an average of 32% of all residents (Pendall, Theodos, and Franks 2012). Sixty percent lived in non-single-family detached housing units, compared with 35% of all people, and 53% lived in housing units built before 1970, compared with 45% of all residents. People in poverty are also more likely to live in dwellings with more than 1.0 person per room (19% vs. 7.7% of all residents) and to pay over 35% of their income for housing (76% vs. 28%). Neighborhoods with large concentrations of such housing are also likely to accommodate outsized numbers of the near-poor. As poverty rates rise throughout a metropolitan area and the near-poor slip into poverty, their neighborhoods’ poverty rates are likely to rise faster than those of neighborhoods with less precarious housing.
That recent studies of the origins of concentrated poverty have paid little attention to the built environment is puzzling, considering that for at least 150 years, reformers have acted as if concentrated poverty is indeed caused at least partly by the built environment. As documented by Roy Lubove (1963), for example, the businessmen who formed the New York Association for Improving the Conditions of the Poor saw a degraded built environment as the cause of the imperfections of the poor: “What they are . . . they are made to a greater or less extent, by circumstances over which they have but little control; and vain will be the effort to elevate their character, without first improving their physical condition” . . . “Physical evils produce moral evils.” (pp. 2–5, 8)
By this logic, degraded and overcrowded tenements debased the character of their residents and thereby destined them to impoverishment. Then, as now, urban reformers suggested that the solution was mobility: immigrants should “escape from the city—for escape is your only resource against the terrible ills of beggery [sic], and the farther you go, the better” (Association for Improving the Conditions of the Poor, The Mistake, 1850, quoted in Lubove 1963, p. 7). In short, these early reformers thought that housing conditions bred poverty. Such thinking drove the first tenement reforms, with successive city ordinances reducing lot coverage and requiring access to light and air.
The U.S. experience of slum clearance and urban renewal from the 1930s through the 1960s saw the notion of physical revitalization linked with the protection of White, downtown business interests, and massive relocations of poor blacks (Self 2003; Stone 1989). Urban renewal proceeded against the backdrop of rapid suburbanization of White middle-class households, who used a wide variety of tools to exclude low-income people—especially blacks—from their new communities (Danielson 1976; Jackson 1985). Blacks, who were overcrowded, severely cost-burdened, and unable to buy homes at the beginning of this period, made steady progress in housing quality and homeownership, mainly because they moved into the older homes of the departing Whites (Boustan and Margo 2013; Sugrue 1996). Over the long term, their concentration in this older housing has impaired wealth building for Blacks (Coates 2014; Shapiro 2004).
As urban renewal failed and the budget to do it was exhausted, large-scale physical redevelopment of neighborhoods receded from prominence in federal policy and local practice (Crowley 2005). Starting in the early 1990s, however, the HOPE VI (Housing Opportunities for People Everywhere) program reasserted the importance of changing the built environment—specifically, distressed public housing projects—as a mechanism to reduce the concentration of poverty (Cisneros and Engdahl, 2009). A new emphasis on “mixed income housing” also translates on the ground to the transformation of the physical form of the city (Joseph, Chaskin, and Webber 2007). 3 Practitioners often attempt to foster income mixing by creating more diversity in structure types and ownership, but it is not clear how and whether housing mix really creates social mix (Musterd and Andersson 2005).
What then do theory and previous evidence suggest about the relationship of housing factors and concentrated poverty? Housing age is likely to be important, but not in a linear manner. Rosenthal (2008b) reported the impacts of a battery of tract-level characteristics on change in poverty between 1980 and 2000, finding that beyond impacts from social and economic characteristics of residents, the age composition of the housing stock also mattered. Finding that tracts with middle-aged housing (15–30 years old at the median) had significantly higher poverty growth than those dominated by young or older housing, Rosenthal concludes that old housing remains only when it is valuable; otherwise it is redeveloped. This finding is consistent with the broader literature on filtering (Baer and Williamson 1988; Kim, Chung, and Blanco 2013; Muth 1972). The oldest neighborhoods are at lower risk of rising poverty, that is, than middle-aged ones. Consistent with these results, Ellen and O’Regan (2008) and Jun (2013) found that neighborhood incomes rose faster when they had high shares of new and old housing than when middle-aged stock predominated, and Galster et al. (2003) found that neighborhoods dominated by the oldest homes were modestly less likely to see poverty increases than middle-aged neighborhoods.
A second housing element that has received attention is tenure. Rosenthal (2008b) found higher poverty growth in neighborhoods with low homeownership rates that correlate to a variety of long-lasting features of the built environment. Rosenthal (2008a) and Jun (2013) also found that homeownership positively correlated with rising income levels in the 1990s, and Galster et al. (2003) found that neighborhoods with higher levels of rental homes were strongly associated with the increasing poverty levels. There are likely several reasons for this, including that owners who occupy their home are more bound by attachment to place than investor owners. Neighborhoods with more rental units also have lower levels of social capital and higher rates of mobility (DiPasquale and Glaeser 1999).
However, it is likely that a simple measure of tenure alone is not sufficient to understand the complex dynamics at play: tenure and building structure are intertwined in important ways. Results from the American Housing Survey, a U.S. Census/U.S. Department of Housing and Urban Development (HUD) longitudinal study of housing units, suggest that about 24% of the single-family stock shifted between owner occupancy and rental between surveys at least one time, and that about one-third of the units in two- to four-unit buildings spent some time in both tenures (Eggers and Moumen 2011). One- to four-unit rental buildings are more frequently owned by unprofessional landlords with narrow profit margins who make fewer investments in the property (Garboden and Newman 2012) and are less motivated by cash flow than by long-term equity (Mallach 2006). Over time, these buildings experience declining owner occupancy on average (Eggers and Moumen 2011)—that is, their owners move away and operate as absentee landlords or sell their buildings to other nonoccupants—a shift that may associate with declining maintenance and reduced vigilance about tenant screening. The low quality of the buildings, the behavior of landlords, and the instability of tenure combine to make neighborhoods dominated by this housing stock more susceptible to rising metropolitan poverty rates than neighborhoods composed mainly of small owner-occupied buildings. Neighborhoods with high proportions of mobile homes may, for similar reasons related to depreciation and owner behavior, be more likely to experience rising poverty than other neighborhoods.
Units in buildings with five or more units are, of course, more likely to be rented than units in larger buildings, but they also have more stability of tenure on average than those in smaller buildings or detached housing (Eggers and Moumen 2011). Apart from units in the largest buildings (50+), only 70% of which were always rental between 1985 and 2009, more than three-quarters of the units in these larger buildings were always rental over that period. Again, considering that people in poverty tend to rent, it stands to reason that neighborhoods dominated by multifamily housing would have higher poverty rates than those dominated by single-family owner-occupied units. Whether their poverty rates would also exceed poverty in neighborhoods with high proportions of units in small-rental buildings, however, is unclear, and something we test in this study.
A third factor may relate to the physical structure of a house, but describes more about the relationship between a family and its home. Households facing housing cost burdens—for example, where they spend more than 30% of their income on housing—use a greater share of their income for housing. By definition, these households have less income to spend on other necessities, and frequently fewer reserves saved should they need to fund an emergency home repair or experience the loss of a job. Their concentration in certain neighborhoods may indicate family stresses that are otherwise difficult to detect and that could place them at risk of falling into poverty if they are not already poor; it may also indicate the presence of landlords who do not screen tenants’ ability to pay and who therefore are more likely to accommodate new households at or below the poverty line when regional economic conditions raise the number of such households.
With this context in mind, we ask the following question: What were the independent contributions of housing characteristics and racial composition at the census tract level in 2000 to tract-level poverty in 2005–2009, after holding constant Year 2000 poverty levels and changes in metropolitan poverty rates? 4
Data and Method
For this article, we use tract-level data from the 2000 Decennial Census and the 2005–2009 American Community Survey (ACS) for the top 100 most populated metropolitan areas (defined as of 2005). Nearly all tracts identified in the 2000 Decennial Census exist with the same boundaries in the 2005–2009 file. 5 This generates an analysis file of 40,780 tracts, ranging from 4,382 in New York to just 80 each in Boise and McAllen.
From both the Census and ACS, we calculate the share of households in each tract living below the poverty line in 2000 and 2005–2009. 6 The average tract poverty rate grew from 12.7% to 14.0% between 2000 and 2005–2009, reflecting nationally rising poverty rates (Table 1). The median poverty rate, however, rose from 8.3% to 9.8%; the spread between the median and mean is a consequence of the concentration of poverty in a subset of high-poverty tracts.
Descriptive Statistics, National Tract Data, Precarious Housing, and Concentrated Poverty (N = 40,780).
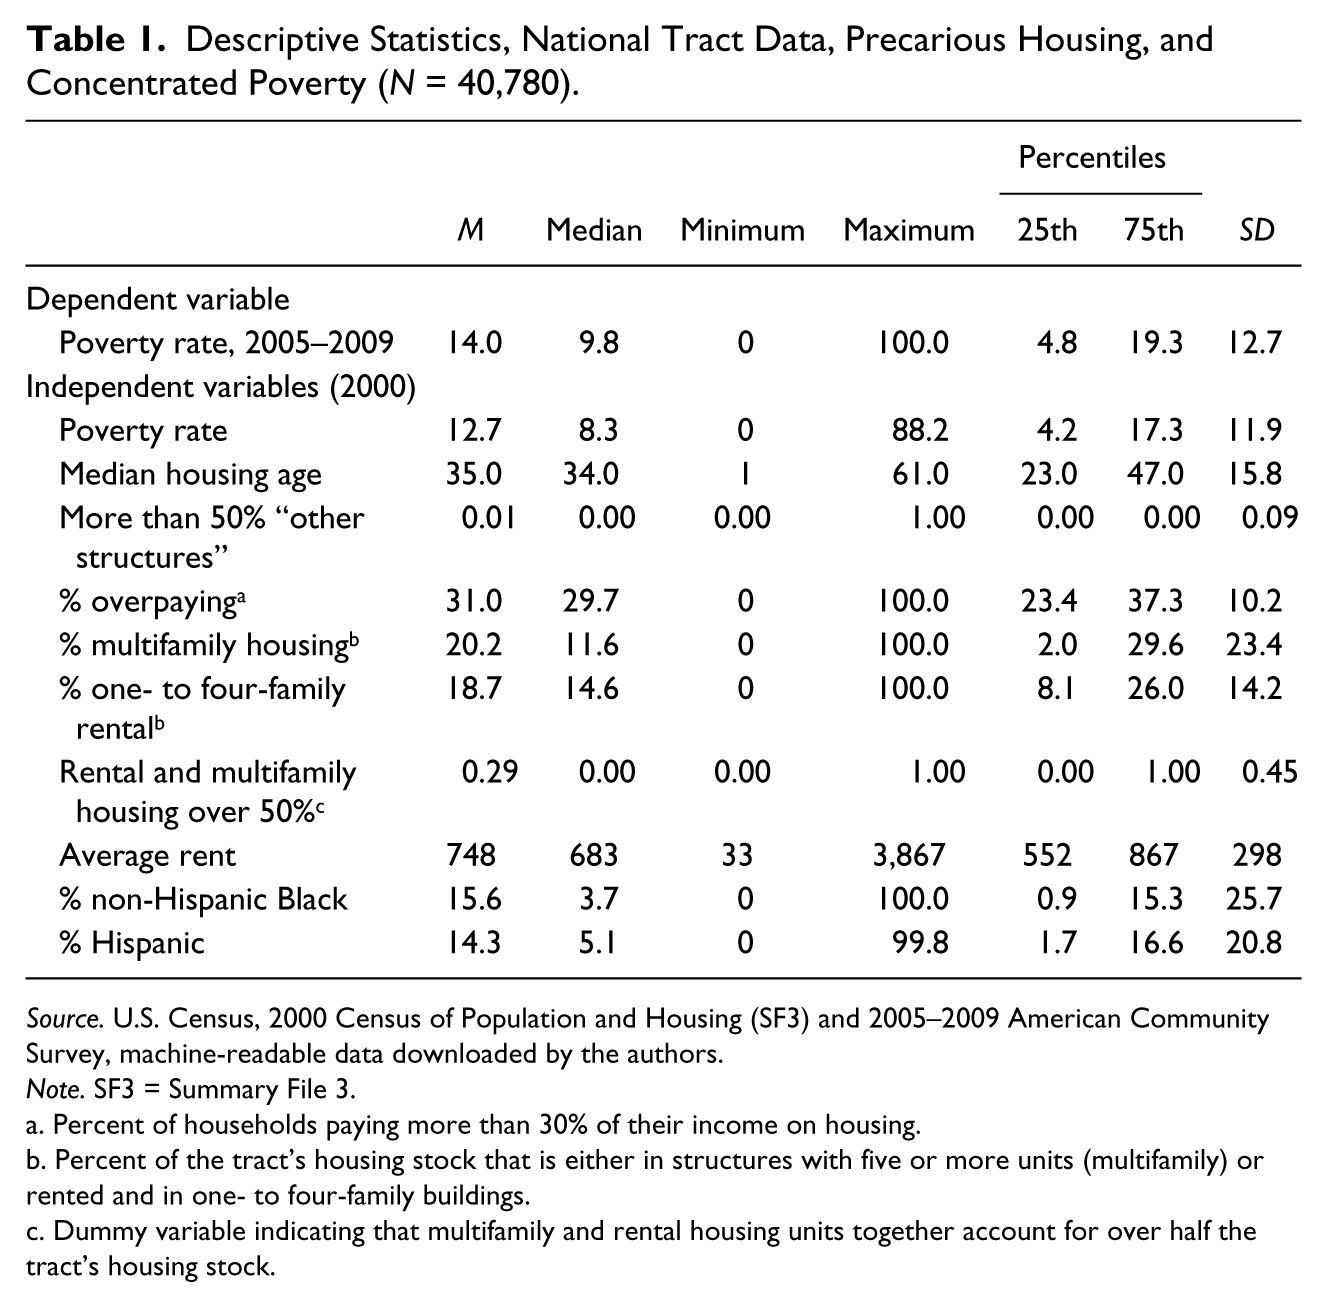
Source. U.S. Census, 2000 Census of Population and Housing (SF3) and 2005–2009 American Community Survey, machine-readable data downloaded by the authors.
Note. SF3 = Summary File 3.
Percent of households paying more than 30% of their income on housing.
Percent of the tract’s housing stock that is either in structures with five or more units (multifamily) or rented and in one- to four-family buildings.
Dummy variable indicating that multifamily and rental housing units together account for over half the tract’s housing stock.
From the 2000 Census Summary File 3 (SF3), we calculate each tract’s share of five “precarious housing” situations. The percentage of multifamily housing is the share of all units in a tract that are in buildings with five or more units. At the mean, 20.2% of housing across these tracts was in such buildings; the median value, however, was only 11.9% (Table 1). We then also calculate the share of the housing stock that is non-multifamily renter-occupied, which includes both single-family and two- to four-unit housing. 7 The mean value for one- to four-family rented of 18.7% is only slightly higher than the median, 14.6%. The median housing age, a variable taken directly from SF3, was 35 years on average and 34 years at the median nationwide, with a quarter of tracts having median ages under 23 years and a quarter over 47 years. (For use in the model, we also calculate the squared term of housing age.) To improve model fit, we calculate a dummy variable indicating whether multifamily housing and rental housing together represent over 50% of all housing in a tract; about 29% of tracts met this criterion. The final two measures are the percentage of households spending over 30% of their income on housing (about 31%, on average) and, out of a concern that such tracts may operate differently, a dichotomous measure representing whether over half of the housing units in the tract are “other” housing, which includes mobile homes, boathouses, recreational vehicles, and trailers. (Less than 1% of tracts met this condition.)
In addition to these precarious housing measures, we calculate from the 2000 Census the share of all homes that are renter occupied (to construct the multifamily + rental dummy variable described above), the average gross rent (US $748 at the mean nationwide, US $683 at the median), the share of tract population that is Black non-Hispanic (15.6% on average nationally, but only 3.7% at the median), the share that is Hispanic (14.3% and 5.1% for the average and median, respectively), and squared terms of each of the race/ethnicity measures. For the national analysis, we also include the nonweighted average percent increase across tracts in each metropolitan area’s poverty rate between 2000 and 2005–2009 to account for the important role of metro-wide poverty change in shaping tract-level outcomes.
To account for potential neighborhood effects, we also computed indices for more precarious and less precarious conditions compared with neighboring tracts. Each index sums six dummy variables indicating that the tract’s percent poverty, median housing age, overpayment, multifamily units, one- to four-unit rentals, or average rent in 2000 was at least one standard deviation “more precarious” or “less precarious” than the average value of the surrounding tracts. (With the first five indicators, higher values are more precarious, whereas for average rent, we consider higher values less precarious.) While the theoretical maximums for both indices were 6, the observed maximums were 3 for both; the average values were 0.21 and 0.14 for the more and less precarious index, respectively. We treat these indices as controls.
To learn about the relationship between precarious housing and neighborhood poverty rates, we run a transformed logistic two-stage regression for the national and for each of the top 100 metropolitan areas. The dependent variable is the log of the poverty rate in 2005–2009 divided by 1 − the log of the poverty rate in 2005–2009. Although the dependent variable of interest, poverty rate in 2005–2009, is continuous, we transform it because a linear function would not restrict predicted values to the range of possible values, 0 to 1. To account for the variation among tracts in the precision of the 2005–2009 poverty estimates, we weight the tracts by the inverse of the standard error of the dependent variable. 8 Independent variables include the five precarious housing factors described above. Other controls, measured as of 2000, include average gross rent, percentage black and percentage Black squared, percentage Hispanic and percentage Hispanic squared, and the indices for more and less precarious housing than neighboring tracts.
For the national regression analysis, the specification is as follows:
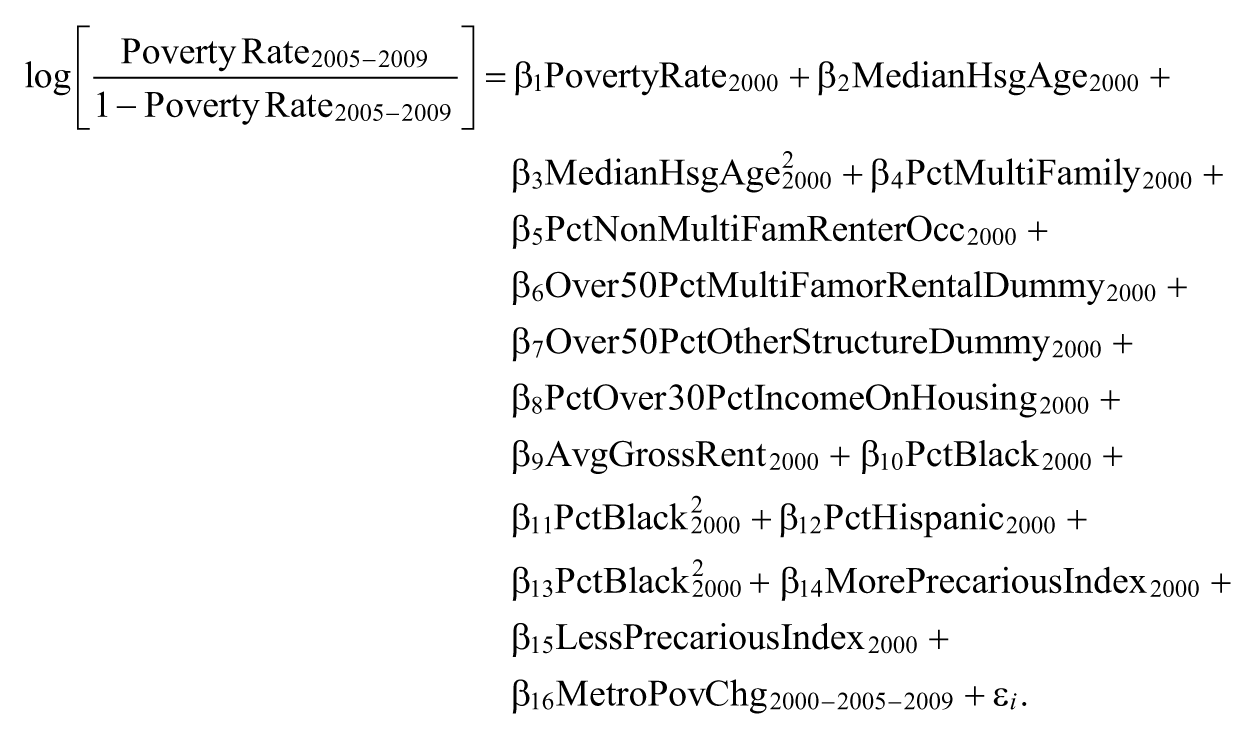
This design does have limitations. Future neighborhood poverty rates can be influenced by previous conditions: once a neighborhood’s poverty rate is high, it tends to stay high (Sampson 2012). This is why we control for poverty rate in the previous period. Also, poverty can cause disinvestment, vacancy, and abandonment of housing, leading in the process to increases in the precarious housing conditions we treat in this model as independent variables. We acknowledge that the analysis therefore provides only a partial view of a complex and dynamic process, yet we nevertheless feel that it is useful at least as an exploration of correlation and change.
The process is also likely to work differently in different metropolitan areas because of the relationship between race, nativity, and concentrated poverty and because of variance in metropolitan growth rates and land-use patterns. Rather than just accounting for each of these metropolitan conditions in a single national regression, we also run individual metropolitan-area regressions that take the same form, except that the metropolitan poverty change variable is not included. Results from select metros are presented below, demonstrating that different neighborhood characteristics matter in different metropolitan areas. Full results, available from the authors upon request, show that this intermetropolitan variation in the effect of precarious housing conditions and prior-year racial composition is nontrivial, underscoring the need for locally tailored approaches to address concentrated poverty.
Results: Housing Structure and Race Are Key Predictors of Poverty Change
Many explanations of concentrated poverty have pointed at racial segregation as a key driver of neighborhood poverty (Massey and Denton 1993; Massey and Fischer 2000; Quillian 2012). Most high-poverty neighborhoods are also dominated by Latino or African-American residents; Whites—even those below the poverty level—usually do not live in high-poverty neighborhoods. Our analysis suggests that key aspects of the housing stock—in particular, the dominance of neighborhoods by rental housing in one- to four-unit structures—are as important in magnitude in shaping the concentration of poverty as race.
Precarious Housing and Neighborhood Poverty
At the national level, we found that poverty grew fastest between 2000 and 2005–2009 in tracts that began the decade with high levels of rented one- to four-family housing, multifamily housing, housing between 20 and 25 years old, and households paying over 30% of their income for housing costs (Table 2). 9
Parameter Estimates: Contributors to Tract-Level Poverty Rates, and National and Metro-Area Regressions, 2005–2009.
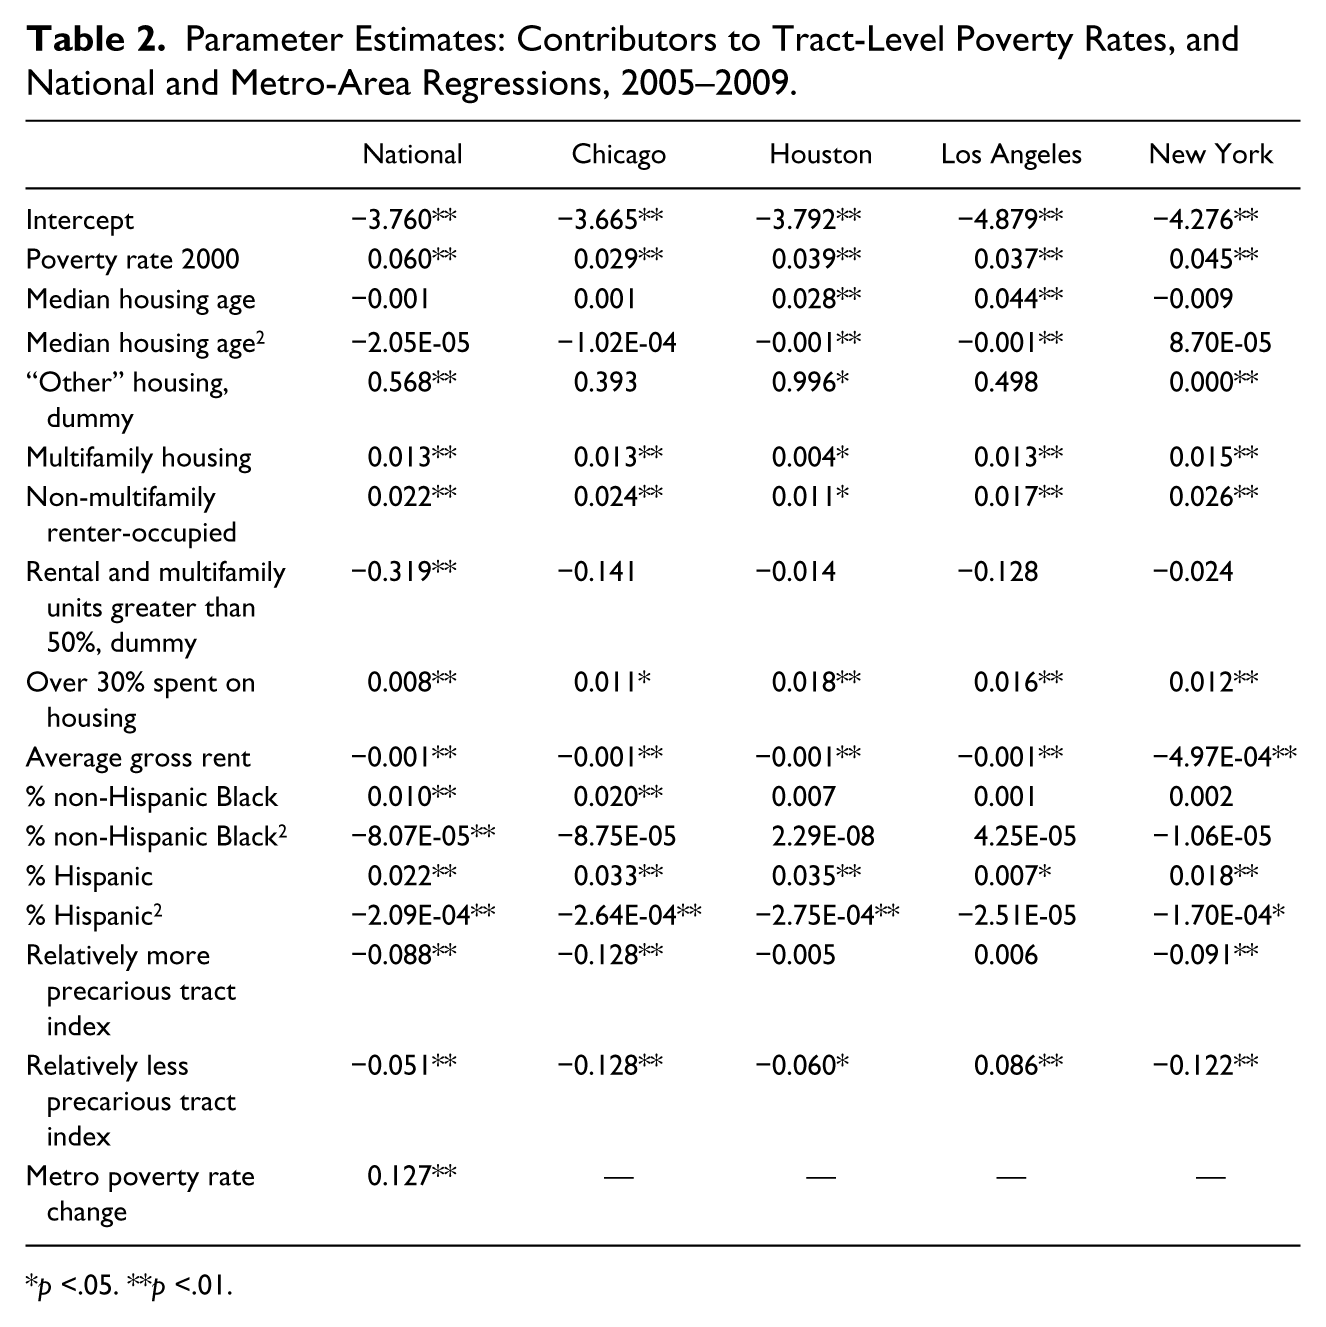
p <.05. **p <.01.
All else being equal, tracts with high shares of rented one- to four-family housing and multifamily housing were especially susceptible to rising poverty, with the former having an impact approximately twice the latter on 2005–2009 poverty rates. To illustrate the impacts on 2005–2009 poverty rates of different levels of both these types of precarious housing in 2000, we hold other conditions constant in 2000: poverty rate at 10%, median housing age at 30 years, 30% of households overpaying, average rent at US $750, 15% Black, and 15% Hispanic. We assume a metro-level poverty rate increase of 0.84 percentage points, the unweighted average across these 100 metros. All these figures are close to the national average of the tract values except housing age, which is closer to an average of 35 years.
As shown in Figure 1, if this tract had begun the decade with entirely owner-occupied one- to four-family housing, we would have expected its poverty rate to decline sharply from 10% (the baseline condition) to 4.6% between 2000 and 2005–2009. Beginning with 50% multifamily and 50% owner-occupied one- to four-family housing, poverty would have dropped only to 8.9% by 2005–2009. At the extreme, an entirely multifamily neighborhood would have had a poverty rate of 12.4% by 2005–2009: 7.8 percentage points higher than the entirely single-family owner-occupied neighborhood.
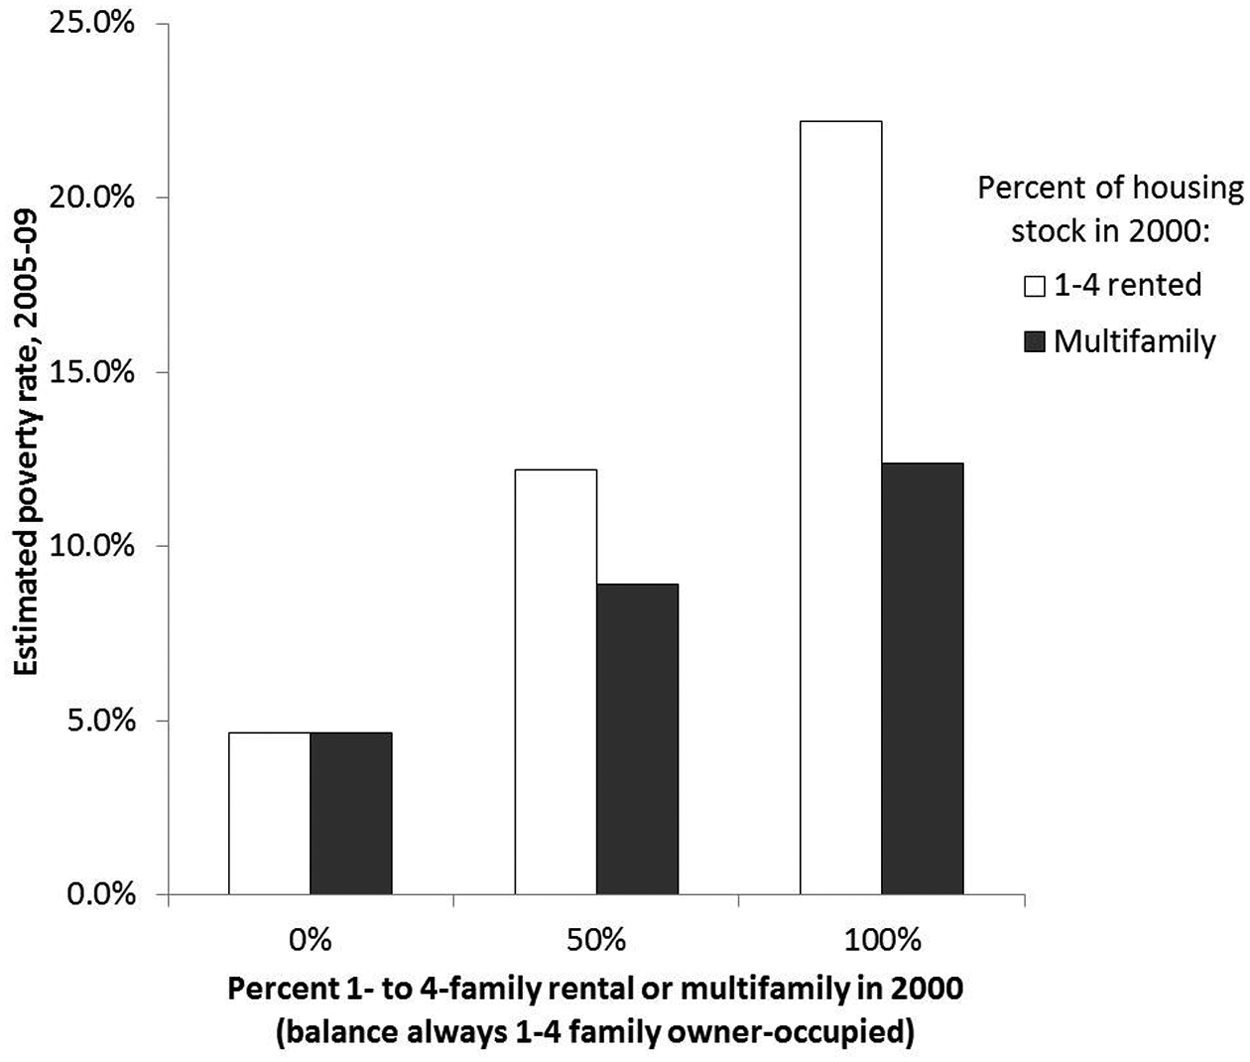
One- to four-family rental housing makes tracts more susceptible to poverty growth than multifamily housing, 100-metro average.
Figure 1 shows that poverty increased even more in tracts dominated by one- to four-family rental housing in 2000 than in those composed mainly of multifamily housing. With the same scenario assumptions as above, a tract with 100% one- to four-family rentals is expected to have had poverty rates by 2005–2009 of 22.2%, almost 10 percentage points higher than those of tracts composed entirely of multifamily housing.
Other precarious housing conditions also set the stage for poverty growth between 2000 and 2005–2009, but less markedly so. A 10 percentage point difference in overpayment as of 2000 from the mean value in our national tract analysis, for example, associated with about a 0.7 percentage point difference in poverty by 2005–2009. The median age of the housing stock had no significant relationship with changes in poverty at the national level between 2000 and 2005–2009, a result that contrasts with Rosenthal’s (2008b) findings. (Rosenthal’s treatment of socioeconomic status also differed somewhat from ours, especially our treatment of structure type and owner occupancy together.)
A Look at Four Large Metros
To investigate regional differences, we ran the same simulation separately for all 100 metro areas. We arrived at broadly comparable results. Percentage multifamily was significantly and positively associated with poverty in 60 metros. In the remainder of metros, multifamily housing was not statistically significantly associated with poverty, and in no cases was it significantly negatively associated. Similarly, the percentage of housing in one- to four-family rentals was significantly and positively associated with poverty in 56 metros, not significant in 41, but significantly and negatively associated in three (Honolulu, Little Rock, and Poughkeepsie).
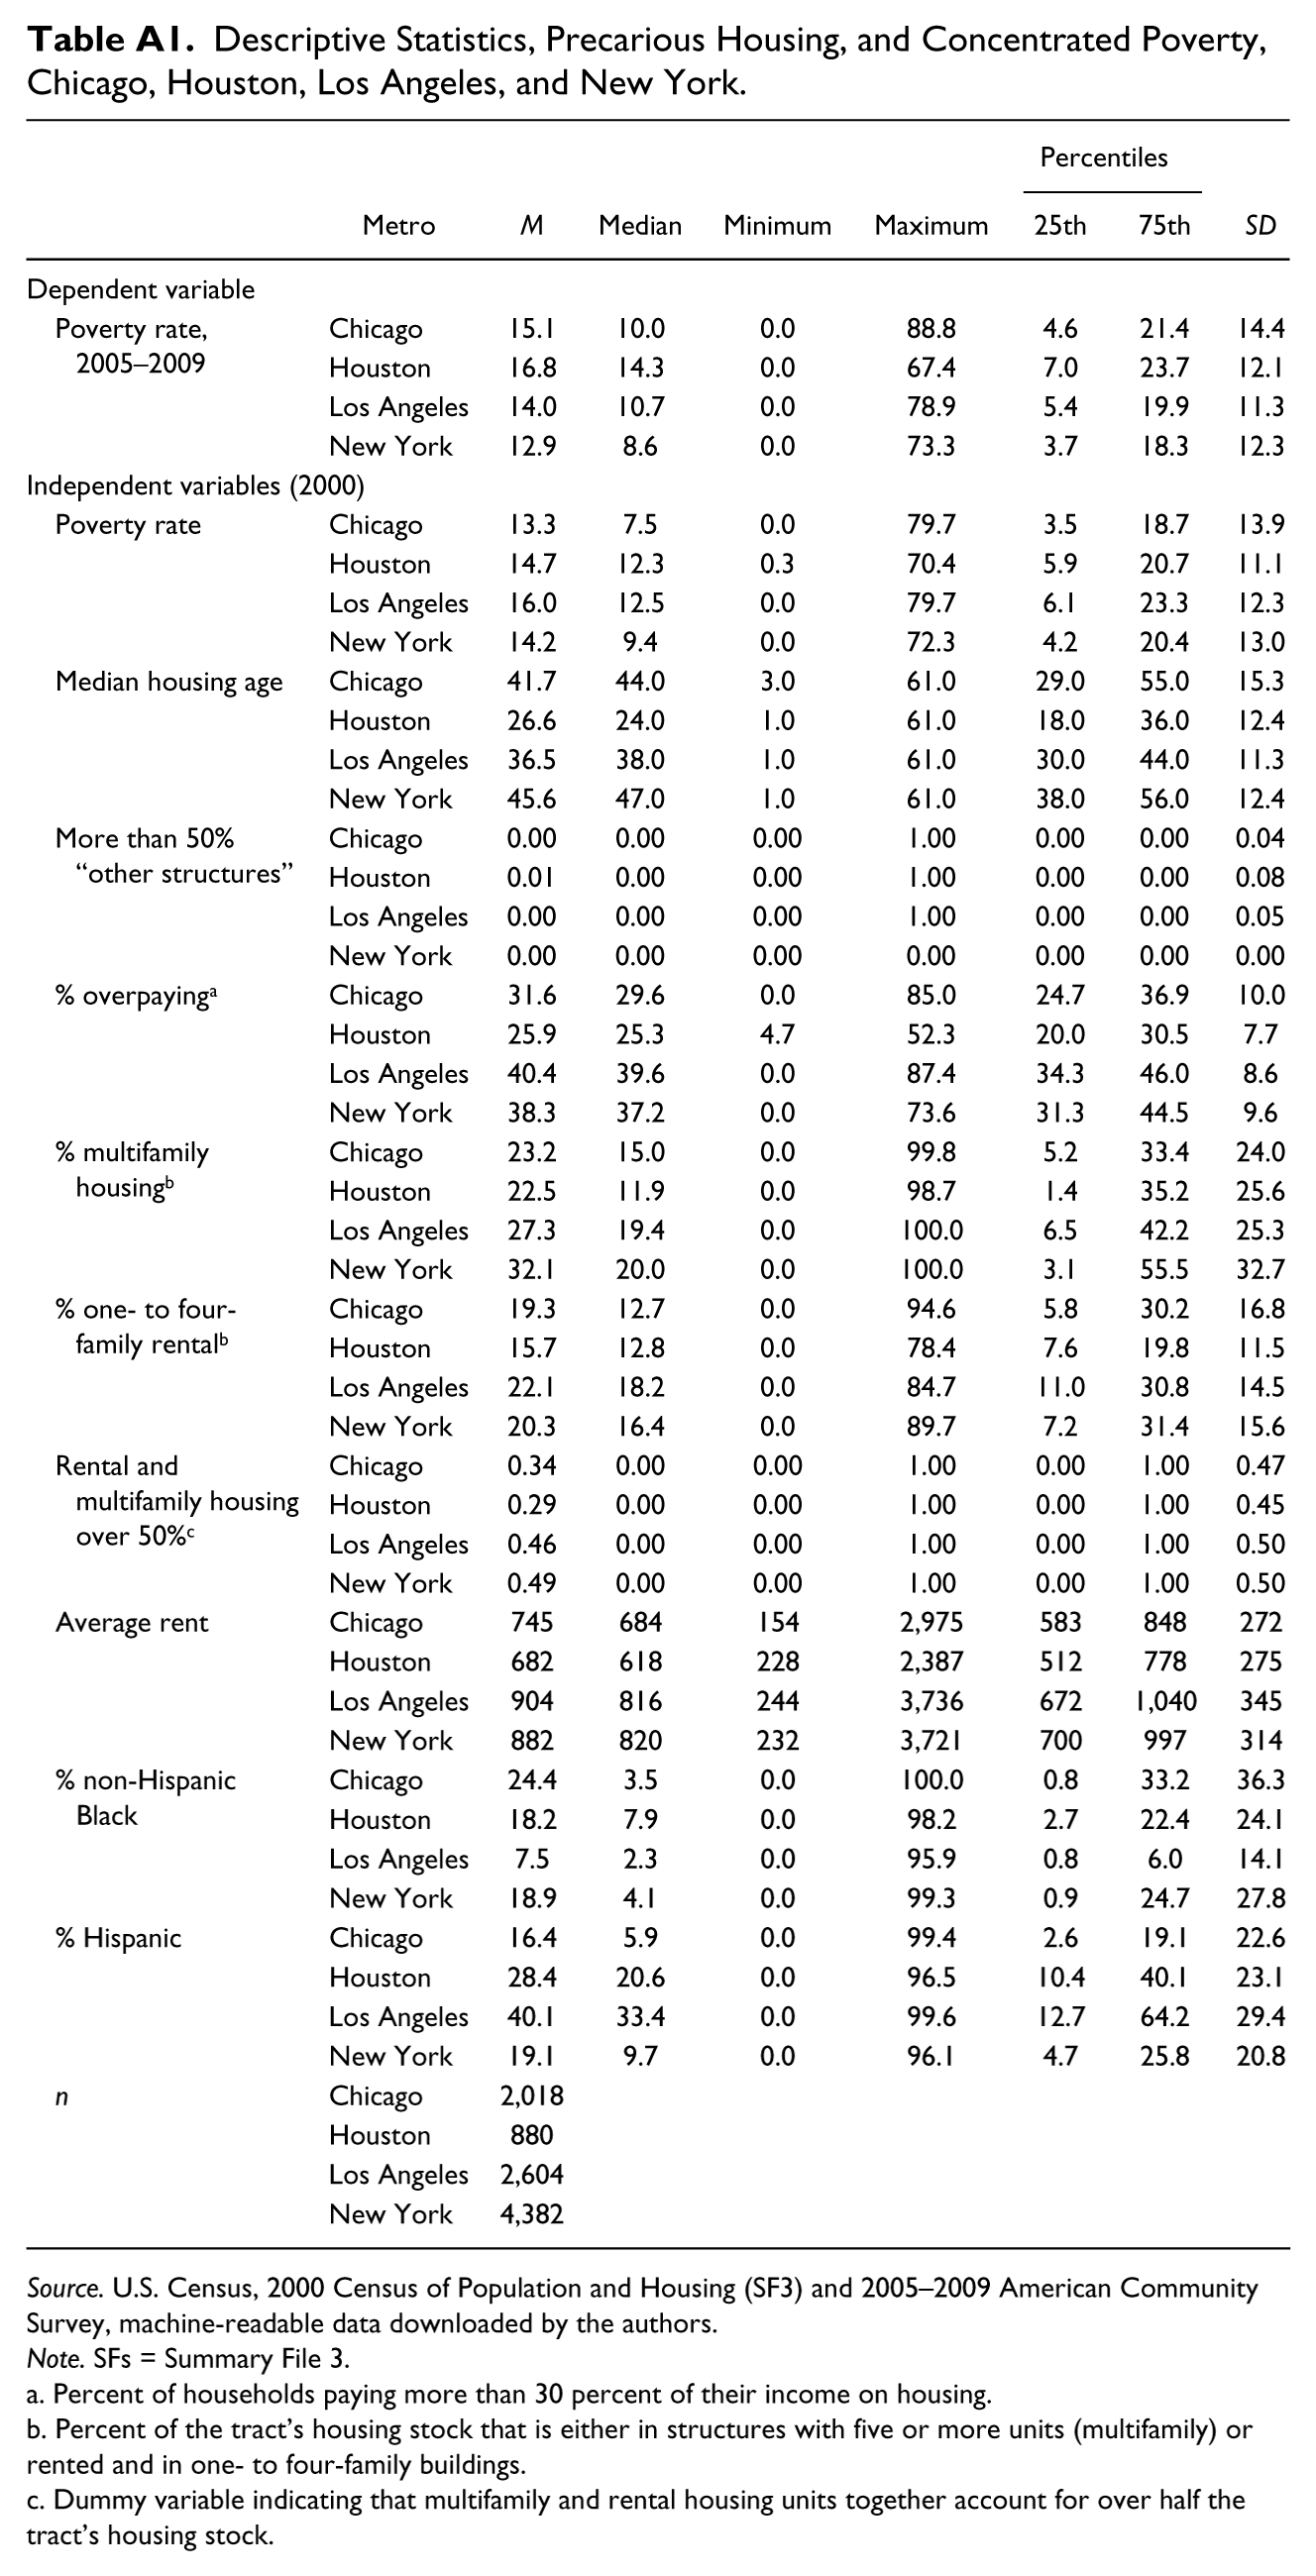
Differences in the magnitude of impact merit further discussion. To illustrate different ways in which housing factors influence changes in neighborhood poverty, we present metropolitan areas containing the four largest cities in the country, each with fairly different housing stocks: Chicago, Houston, Los Angeles, and New York. (Descriptive statistics for these four metropolitan areas appear in Table A1 of the appendix.) Importantly, in each case, we see that tracts with high concentrations of either multifamily housing or one- to four-unit rental housing in 2000 were associated with higher poverty by 2005–2009 than in tracts dominated by one- to four-family owner-occupied housing.
Probing further, we see that the relationship between these precarious housing measures and poverty growth—even holding constant the other neighborhood characteristics including race—is much stronger in Chicago than in Houston, Los Angeles, or New York (Figure 2). The disparities stem partly from differences among the changes in metro-level poverty: Chicago’s rate increased by 1.5 percentage points, whereas New York’s and Los Angeles’s declined by 1.2 percentage points and 2.1 percentage points, respectively, between 2000 and 2005–2009. (We return below to the way in which precarious housing amplified the effect of rising metro-level poverty.) However, see Houston, where poverty also rose, by 1.3 percentage points; the relationship between poverty change and one- to four-unit rental stock is weaker than in other metros, but the sensitivity of multifamily neighborhoods to rising poverty was lower than Chicago’s but higher than Los Angeles’s or New York’s.
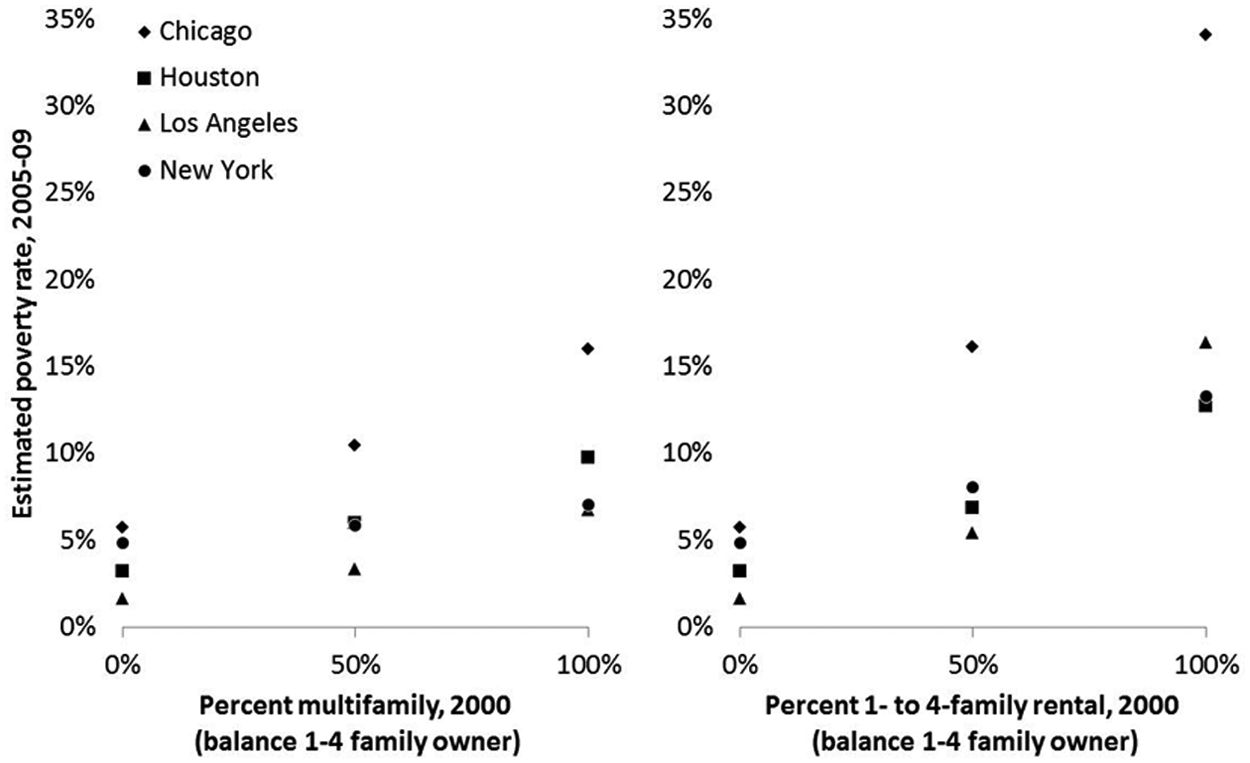
Poverty rate in 2005–2009 associated with varying percentages (2000) of multifamily or one- to four-unit rentals in Chicago, Houston, Los Angeles, and New York Core Based Statistical Areas (CBSAs).
Chicago stands out as especially subject to strong variations in the experience of local poverty change based on initial neighborhood housing conditions. Our simulated neighborhood would have reverted from a 10% poverty rate to just a 5.7% poverty rate in Chicago if it had been entirely one- to four-family owner-occupied housing, whereas if it had been entirely one- to four-family rented housing, the poverty rate would have more than tripled to 34%. Neighborhoods in the other three metro areas were less sensitive than those in Chicago to their initial one- to four-family mix. For example, our scenario neighborhood, if composed entirely of one- to four-family rentals in Los Angeles, would have ended the decade with about a 16% poverty rate, while similar starting points in New York and Houston would have yielded increases to about 13%.
The impact of multifamily housing on poverty was also important in all these metro areas, but not nearly as great in magnitude as one- to four-family rentals. Chicago’s poverty rate would have increased to 16% in a neighborhood composed entirely of multifamily housing; poverty would actually have declined from 10% to about 7% in our scenario-based 100% multifamily neighborhoods in Los Angeles and New York and stayed at about 10% in Chicago.
Looking at other precarious housing factors, we see that neighborhood overpayment rates in 2000 also consistently associated with rising poverty in Chicago, Houston, Los Angeles, and New York, with very similar impacts to both one another and the national rates. Among the four large metros, Houston and Los Angeles showed a significant relationship between housing age and poverty, consistent with Rosenthal’s (2008b) finding. To illustrate, assume two Los Angeles tracts similar on all dimensions in 2000 except the housing age, with one being very new (median age of 5 years) and the other being 30 years old at the median. The newer neighborhood would have experienced a decline in poverty 3 percentage points greater than the older neighborhood between 2000 and 2005–2009 (or an increase 3 percentage points smaller, if initial conditions were unfavorable enough to counteract the falling metropolitan poverty rate). This effect attenuates with the median age of the tract’s housing in both Houston and Los Angeles, consistent with our theory.
The fact that age matters in Los Angeles and Houston but not in New York and Chicago, however, may point to a broader set of differences among metropolitan structures between the Sunbelt and the Midwest and Northeast that remain for further exploration. It would be worth researching whether our observations in Houston and Los Angeles truly measure the effect of the age of the stock or, alternatively, a cohort effect, in particular, the effect of a particular tranche of Sunbelt apartment construction during the housing boom of the early 1980s.
Race/Ethnicity and Neighborhood Poverty
Although our principal line of inquiry is around the impact of housing structure on neighborhood poverty, it is important to relate these built environment factors to racial/ethnic dynamics, as our analysis attempts to tease apart these often confounded factors. Substantial previous research has linked racial segregation to concentrated poverty (Massey and Denton 1993; Massey and Fischer 2000; Quillian 2012). Our analysis confirms that the Black and Hispanic shares of neighborhood residents in 2000 were directly and significantly related to changes in neighborhood poverty between 2000 and 2005–2009. To illustrate the impact of racial composition, we once again created hypothetical census tracts with 2000 poverty rates of 10%, but this time holding the housing stock constant at about national average levels. 10
A relatively undiverse tract, in which 85% of Year 2000 residents were White non-Hispanic, 8% Black, and 7% Hispanic, would have reverted by 2005–2009 to a poverty rate of only 6.0% by 2005–2009 (see Figure 3). If the neighborhood had begun the decade with 50% White residents and a quarter each Black and Hispanic, its 2005–2009 poverty rate would have been 4.2 percentage points higher: 10.2%.
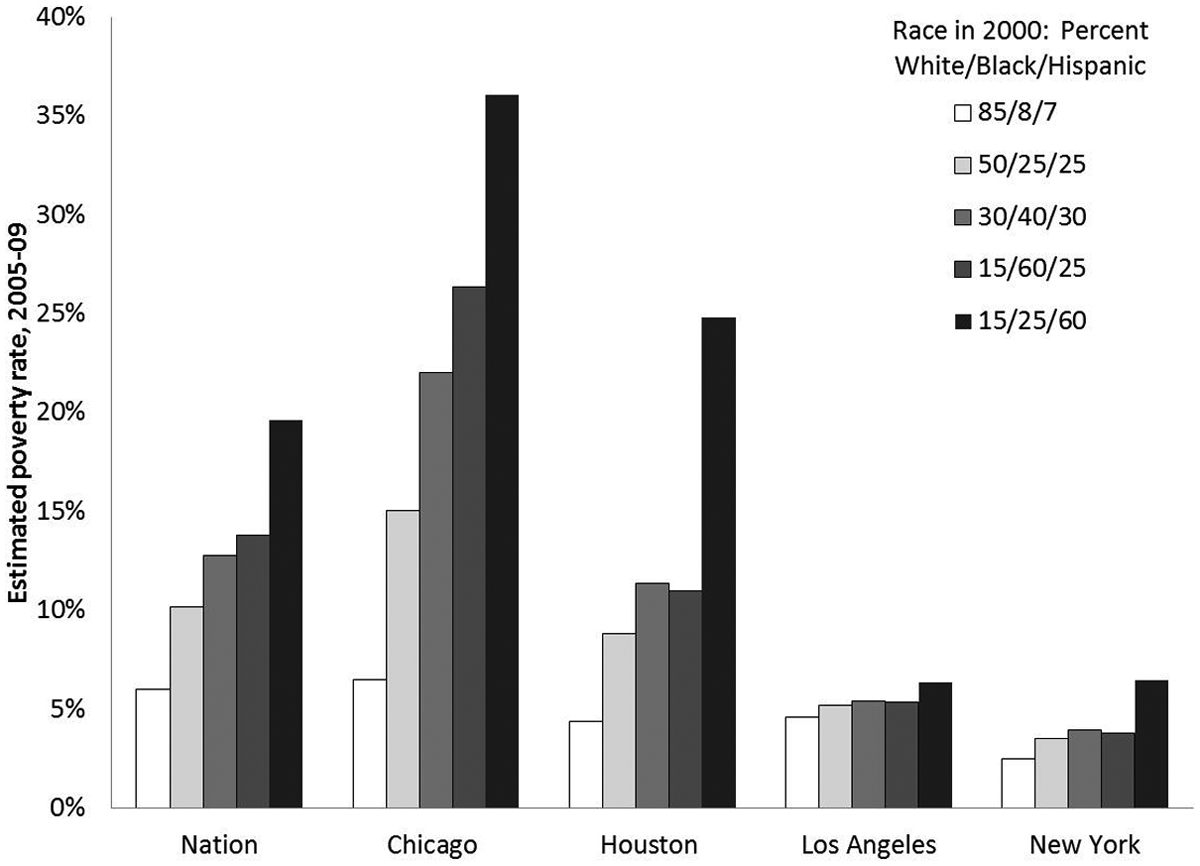
Poverty rate in 2005–2009 associated with varying percentages (2000) of racial/ethnic composition in the nation, Chicago, Houston, Los Angeles, and New York Core Based Statistical Areas (CBSAs).
Changes in poverty rates were more sensitive to high concentrations of Hispanics than high concentrations of Blacks. In this same hypothetical tract, a mix of 15% White, 60% Black, and 15% Hispanic in 2000 would have yielded a poverty rate of 13.8% in 2005–2009, compared with a poverty rate of 19.6% in a tract with 15% White, 15% Black, and 60% Hispanic. We did not pursue explanations for why the presence of Latinos would make a neighborhood so much more vulnerable to rising poverty than the presence of African-Americans, but at least two forces could be explored with further research. First, heavily Hispanic neighborhoods may have been growing in population faster on average than predominantly African-American neighborhoods, and the fastest growing Latino neighborhoods may have attracted disproportionate numbers of low-income residents. Second, a large Latino presence may signal the concentration of especially recent immigrants, and recent immigrants were particularly adversely affected by the economic crisis. We discount a third explanation—differences in poverty change between African-Americans and Hispanics—on the grounds that the two groups had similar changes in their poverty rates over this time period.
The average national impacts of racial composition in 2000 mask significant variation across metropolitan areas, as shown in Figure 3. Chicago and Houston, for example, were more sensitive to 2000 racial composition than were Los Angeles and New York. The ratio between the poverty rate in 2005–2009 in a 50%/25%/25% White/Black/Hispanic neighborhood and that in a mostly White neighborhood (85% White, 8% Black, 7% Hispanic) would have been 2.3:1 in Chicago and 2.0:1 in Houston, compared with 1.7:1 nationally, and just 1.4:1 in New York, and 1.2:1 in Los Angeles.
How then do racial composition and housing-stock characteristics relate? First, they have roughly comparable relationships with changing neighborhood poverty levels. To illustrate this, we developed four neighborhood scenarios; all four had other values set at or close to national averages, with poverty rates in 2000 set at 10%. They are as follows:
High ownership: 85%, one- to four-unit owner-occupied; 10%, one- to four-unit rented; 5%, multifamily; 70% White, 15% Black, and 15% Hispanic.
Highly White: 70%, one- to four-unit owner-occupied; 15%, one- to four-unit rented; 15%, multifamily; 85% White, 8% Black, and 7% Hispanic.
High rental: 20%, one- to four-unit owner-occupied; 45%, one- to four-unit rented; 35%, multifamily; 70% White, 15% Black, and 15% Hispanic.
Highly nonwhite: 70%, one- to four-unit owner-occupied; 15%, one- to four-unit rental; 15%, multifamily; 10% White, 45% Black, and 45% Hispanic.
At the national level, the high ownership and highly White neighborhoods would have had 2005–2009 poverty rates of just 6.0% (Figure 4). The high rental and highly nonwhite neighborhoods, by contrast, would have had estimated poverty rates of 12.8% and 17.7%, respectively. Racial composition associated more strongly with rising poverty than did housing-stock composition in Chicago and Houston, however. Chicago’s highly nonwhite neighborhood would have had a poverty rate of nearly 34% in 2005–2009, and Houston’s rate would have been 18.5%, compared with 18.7% and 8.7% for the two metro areas’ highly rental neighborhoods. In Los Angeles and New York, by contrast, the highly rental neighborhood ended the period with higher poverty than the highly nonwhite neighborhood.
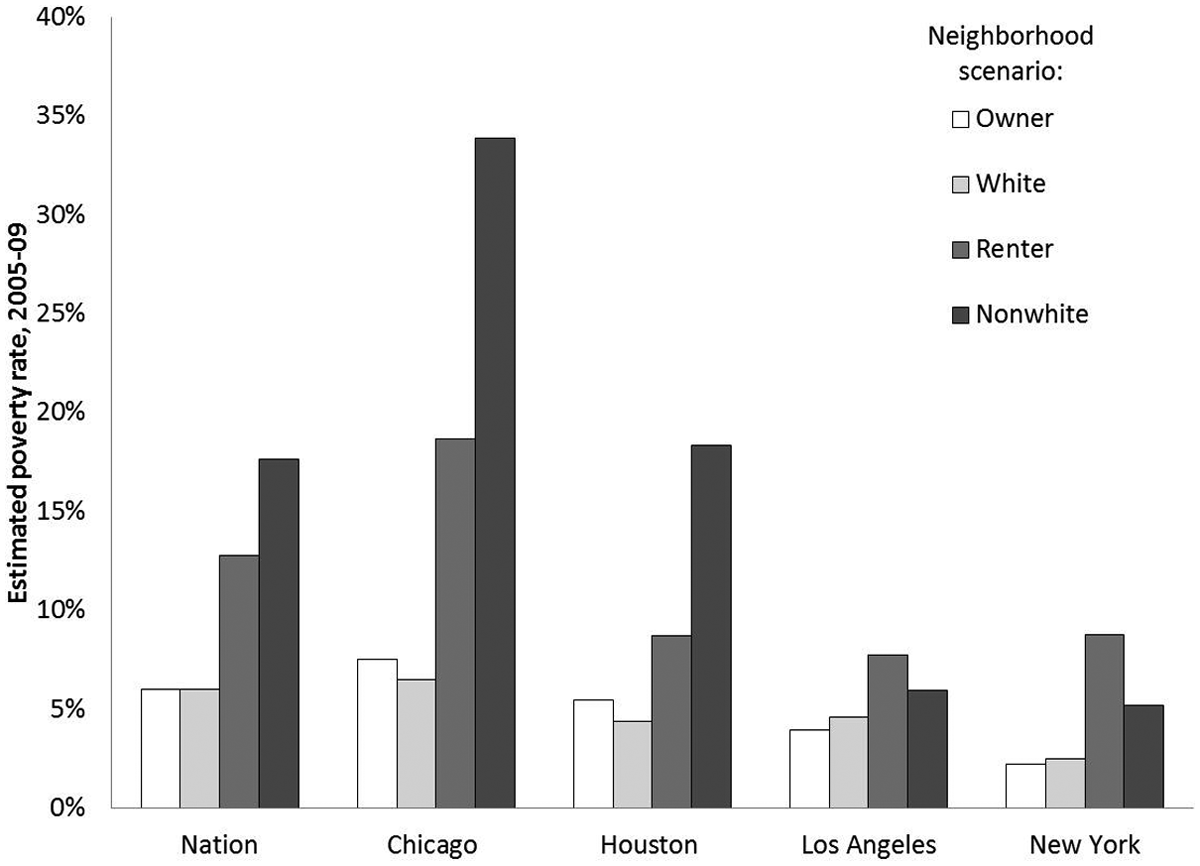
Poverty rate in 2005–2009 associated with housing-stock and racial composition scenarios in the nation, Chicago, Houston, Los Angeles, and New York Core Based Statistical Areas (CBSAs).
This finding deserves more research. Los Angeles and New York had rental vacancy rates averaging 5.0% and 6.1% across the tracts in our data set, respectively, compared with 10.6% in Chicago and 15.8% in Houston. It is possible that when rental housing is scarce, nonpoor households of all races look for housing even in neighborhoods dominated by African-Americans and Latinos and remain in place if they already live in such neighborhoods dominated by African-Americans and Latinos and remain in place if they already live in such neighborhoods. Housing prices are also generally higher in Los Angeles and New York than in Chicago or Houston, offering another inducement for nonpoor housing searchers to overcome preconceptions about neighborhood quality that are based on neighborhood racial composition and shift attention instead to neighborhood housing characteristics.
The Influence of Metro-Level Poverty Changes
The national analysis underscores the importance of changes in the overall metropolitan-area poverty rate and the magnifying impact of tract conditions at one point in time on responses of tracts to metro-level poverty changes. We explore this by comparing statistically identical tracts in two different metro areas. Tracts A and B differ only in their metro areas’ poverty growth: 0 percentage points and 1 percentage point. Assuming that both tracts began with a low poverty rate (5%) and 100% owner-occupied one- to four-unit housing, Tract B’s poverty rate would have been 0.4 points higher than Tract A’s (Figure 5) by 2005–2009. 11 Holding the poverty rate constant at 5% but increasing the percentage renter-occupied one- to four-unit housing from none, to 50%, to 100%, the impact of a 1-point difference in the metro-level poverty rate increases to 1.1 and 1.8 points, respectively (see Figure 5).
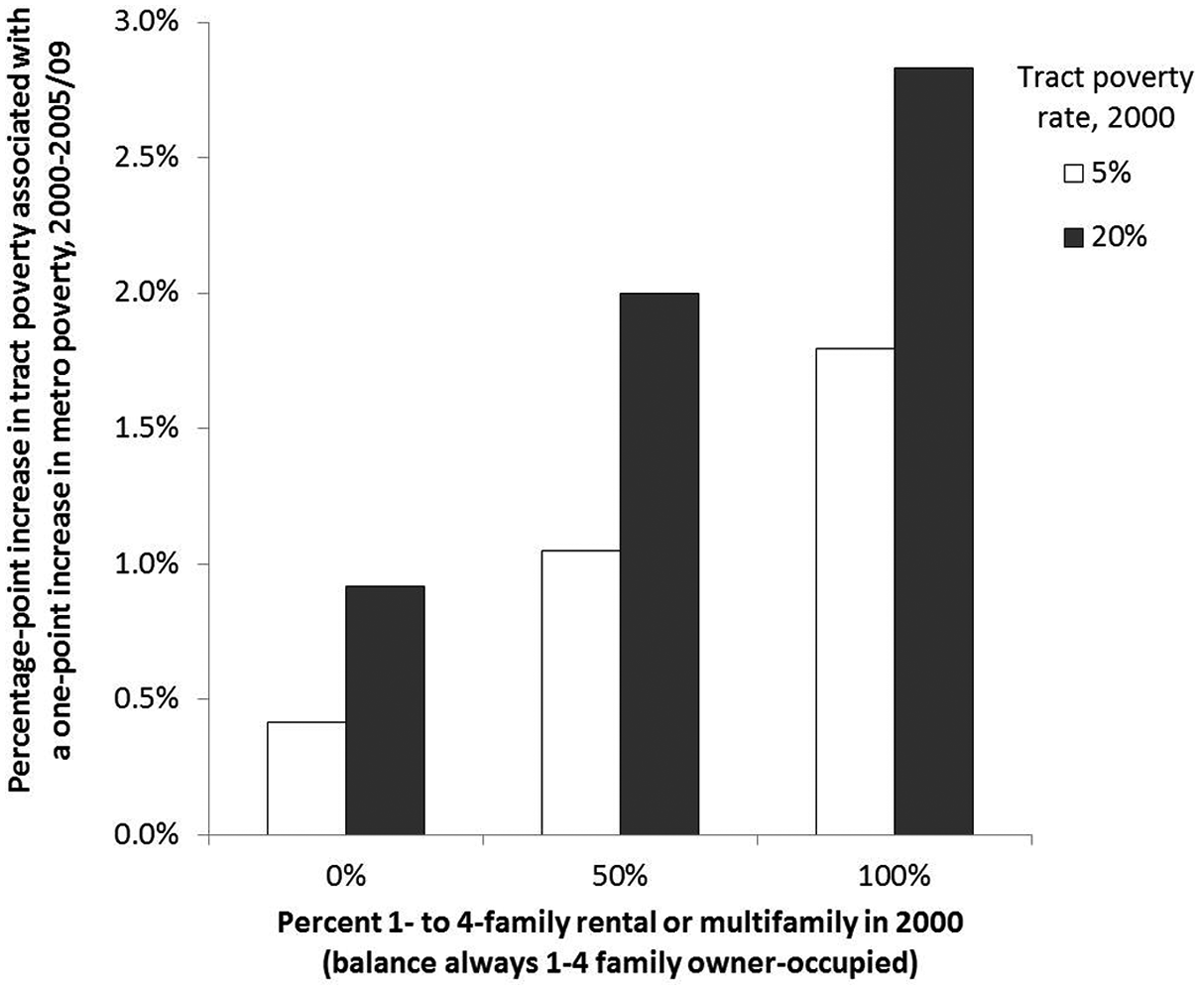
Percentage point increase in tract poverty associated with a 1-point increase in metro poverty by percentage of housing stock that is one- to four-unit rental.
The results would have been even more pronounced if Tracts A and B had begun with poverty rates of 20%. If both tracts had begun with entirely owner-occupied one- to four-unit housing, poverty in Tract B (in the metro area where poverty rose by 1 percentage point) would have increased by 0.9 points more than in Tract A (where the metro poverty rate stayed the same). If both had begun with entirely rented one- to four-unit units, Tract B’s poverty rate would have increased 2.8 points more than Tract A’s: a very high impact of a minor difference in the growth of the two metro areas’ poverty rates.
Discussion and Implications for Policy and Practice
Our analysis shows that concentrations of Hispanics and African-Americans, housing structures of certain kinds, and preexisting poverty levels are all important starting points for subsequent changes in neighborhood poverty. Neighborhoods with high concentrations of rented one- to four-family housing and apartments, Hispanics, and African-Americans were all significantly and meaningfully more vulnerable to rising poverty in the 2000s than those with more owner-occupied housing and higher percentages of White residents. Such places appear to depart even in the short term from the stability that characterizes most U.S. tracts over an intercensal period (Wei and Knox 2013).
The contribution of racial segregation to concentrated poverty is already well-established, and we confirm it here. On average, neighborhoods with high percentages of African-Americans and especially those with high percentages of Latinos were much more susceptible than predominantly White neighborhoods to rising poverty since 2000. Our findings about the contributions of precarious housing are new, however. Specifically, we find that rented one- to four-family structures strongly predisposed neighborhoods toward rising poverty in the 2000s, and that multifamily structures (whether rented or owned) also did, but less markedly so.
The independent impacts of neighborhood housing composition and racial composition, moreover, are often comparable with one another, though the relative importance of each depends on the metropolitan area. In our example, the effects of racial composition were more pronounced than those of housing composition in Chicago and Houston, but the importance was the opposite in New York and Los Angeles. Further examination of other populous and diverse metropolitan areas reveals no obvious rule about which is more important.
Neighborhoods with high concentrations of small-rented buildings are, of course, often those with high percentages of African-Americans and Latinos because of decades-long feedback loops among the housing stock, tenure, housing prices, and racial composition. With lower homeownership rates and incomes compared with Whites, both Blacks and Hispanics gravitate disproportionately toward rented housing, and they often find such housing in small buildings. Even when Blacks and Hispanics buy homes, they may find them disproportionately in neighborhoods with relatively high percentages of rented housing if housing prices in those neighborhoods are lower than those composed mainly of owner-occupied homes. Blacks and Hispanics are also more likely to live just above the poverty line than Whites and are therefore disproportionately among those falling into poverty during a downturn. Insofar as Blacks and Hispanics concentrate in a limited number of neighborhoods because these neighborhoods contain most of the housing that works for them, those neighborhoods will be especially susceptible to rising metropolitan poverty rates—but also especially alleviated by falling metropolitan poverty.
Notwithstanding these indirect effects leading from housing characteristics to race and then to poverty rates, our findings still suggest a more direct connection between housing characteristics and neighborhood poverty. Even holding constant its racial composition, a neighborhood composed mainly of rental housing is likely to house disproportionate numbers of people living near the poverty line, and these people are at risk of falling into poverty—thereby helping reclassify their neighborhoods as high-poverty neighborhoods—when national or metropolitan-level economic conditions sour.
Intriguingly, the relationship between the housing stock and poverty appears especially strong in neighborhoods dominated by rentals in one- to four-unit structures. As we hypothesized in the background section, this suggests that household, housing unit, and landlord characteristics may combine to make such neighborhoods highly susceptible to rising metropolitan poverty rates. The United States relies heavily on these units and neighborhoods to accommodate low-income families. This is increasingly true as the incomes of the bottom quintile of households—most of whom are renters—fell by 15% in real terms between 2000 and 2012. Rapid depreciation of these units means that without subsidy, they cannot remain both inhabitable and affordable for long. Indeed, in weak-market metros and in light of the foreclosure crisis, many are being left vacant or abandoned. Garboden and Newman (2012) suggested that professional property management and bundling small properties could both help extend the lives of some small-rental buildings, but either of these would require either higher rents or operating subsidies.
Our research has identified problems that can occur, however, when certain neighborhoods are dominated by rentals in small buildings. Such a housing composition makes neighborhoods especially susceptible to rising metropolitan poverty rates. To reduce the exposure of these cities and their low-income residents to concentrated poverty, then, initiatives are needed to increase the diversity of the housing mix in small-rental neighborhoods, to upgrade and professionalize (while not significantly reducing affordability of) small-rental units, and finally, to build more small rentals in neighborhoods now dominated by single-family owner-occupied homes.
Such initiatives must account for metropolitan housing market characteristics, as our exploration of New York, Los Angeles, Chicago, and Houston shows. In housing markets with at least moderate levels of demand and growth, the preservation of unsubsidized small buildings in small-rental neighborhoods through bundling and professional management may be a cost-effective way to secure long-term affordability. Some neighborhoods may be ripe for higher-density redevelopment plans, which—if done well—could gradually help add owner-occupied units (townhomes and condominiums) without reducing the number of viable low-cost rentals. In the meantime, cities and inner suburbs can reduce their own, and their citizens’, exposure to the harms caused by concentrated poverty by creating new opportunities for low-income households to live in established owner-occupied neighborhoods. Such measures might include, for example, relaxing restrictions on accessory dwelling units and allowing conversions of single-family homes to duplexes or triplexes, especially on larger corner lots. They might also include community land trusts and other mechanisms for limited-equity homeownership by low-income households (Temkin, Theodos, and Price 2013). Measures to reduce metropolitan areas’ overreliance on a limited number of neighborhoods to accommodate the poor and near-poor also include the redevelopment of underperforming retail space as mixed-income housing, especially in conjunction with improvements in mass transit.
Cities with weak housing markets, however, have fewer viable options for reducing the risk of concentrated poverty through diversifying the housing stock of small-rental neighborhoods. Some cities spend funds to demolish abandoned units, but it is not clear whether these actions alone can reduce persistently high poverty levels. They may reduce the total number of households living in poverty if they demolish enough units, but the remaining households—living in an increasingly thinned-out neighborhood—are not likely to differ from those who lived there previously. Those who own houses will eventually leave their homes. Absent market demand for owner-occupied houses in these declining neighborhoods, the vacant units are likely to be either rented out or abandoned, setting the stage for further demolition and reduction of neighborhood density and vitality. Efforts to reduce exclusionary zoning are also important, but they have limits in metropolitan housing markets with weak housing demand and ample existing supplies of low-cost rental housing in centrally located neighborhoods. Diversifying and renewing the housing stock of weak-market city neighborhoods will thus likely require actions to reduce housing overproduction in suburban and exurban jurisdictions where new construction continues despite slow or no household growth at the metropolitan level.
Policy makers and practitioners have too often enacted strategies to upgrade poor neighborhoods as either only people focused, or as purely focusing on physical redevelopment (Kubisch et al. 2010). This article’s findings add to that debate, in a way that we hope will further erode that dichotomy. Physical environment changes alone do not solve the problems of poverty. The built environment matters, and a people-only focused strategy that does not address a housing stock that is largely composed of rental housing in small buildings seems unlikely to succeed—as households made better off by the intervention will always be able to depart for neighborhoods providing better opportunities (Coulton et al. 2012). Both policy and practice need to accommodate the complicated interplay between place and people.
Although some local policy approaches could gradually reduce cities’ exposure to concentrated poverty, it is important not to lose sight of the obvious relationship between rising national and metropolitan poverty rates and rising concentrated poverty, falling into the trap of thinking that housing-only efforts will be sufficient. National policies and decisions shape the level and character of national economic growth, benefiting some families and some regions much more than they do others. National and metropolitan initiatives to increase wages, produce jobs, and sustain transfer payments and tax provisions that benefit low- to medium-skill people and families and thereby reduce national and metropolitan poverty levels thus need to be considered intrinsic, in addition to place-based work, to reducing concentrated neighborhood poverty.
Footnotes
Appendix
Descriptive Statistics, Precarious Housing, and Concentrated Poverty, Chicago, Houston, Los Angeles, and New York.
| Percentiles |
||||||||
|---|---|---|---|---|---|---|---|---|
| Metro | M | Median | Minimum | Maximum | 25th | 75th | SD | |
| Dependent variable | ||||||||
| Poverty rate, 2005–2009 | Chicago | 15.1 | 10.0 | 0.0 | 88.8 | 4.6 | 21.4 | 14.4 |
| Houston | 16.8 | 14.3 | 0.0 | 67.4 | 7.0 | 23.7 | 12.1 | |
| Los Angeles | 14.0 | 10.7 | 0.0 | 78.9 | 5.4 | 19.9 | 11.3 | |
| New York | 12.9 | 8.6 | 0.0 | 73.3 | 3.7 | 18.3 | 12.3 | |
| Independent variables (2000) | ||||||||
| Poverty rate | Chicago | 13.3 | 7.5 | 0.0 | 79.7 | 3.5 | 18.7 | 13.9 |
| Houston | 14.7 | 12.3 | 0.3 | 70.4 | 5.9 | 20.7 | 11.1 | |
| Los Angeles | 16.0 | 12.5 | 0.0 | 79.7 | 6.1 | 23.3 | 12.3 | |
| New York | 14.2 | 9.4 | 0.0 | 72.3 | 4.2 | 20.4 | 13.0 | |
| Median housing age | Chicago | 41.7 | 44.0 | 3.0 | 61.0 | 29.0 | 55.0 | 15.3 |
| Houston | 26.6 | 24.0 | 1.0 | 61.0 | 18.0 | 36.0 | 12.4 | |
| Los Angeles | 36.5 | 38.0 | 1.0 | 61.0 | 30.0 | 44.0 | 11.3 | |
| New York | 45.6 | 47.0 | 1.0 | 61.0 | 38.0 | 56.0 | 12.4 | |
| More than 50% “other structures” | Chicago | 0.00 | 0.00 | 0.00 | 1.00 | 0.00 | 0.00 | 0.04 |
| Houston | 0.01 | 0.00 | 0.00 | 1.00 | 0.00 | 0.00 | 0.08 | |
| Los Angeles | 0.00 | 0.00 | 0.00 | 1.00 | 0.00 | 0.00 | 0.05 | |
| New York | 0.00 | 0.00 | 0.00 | 0.00 | 0.00 | 0.00 | 0.00 | |
| % overpaying a | Chicago | 31.6 | 29.6 | 0.0 | 85.0 | 24.7 | 36.9 | 10.0 |
| Houston | 25.9 | 25.3 | 4.7 | 52.3 | 20.0 | 30.5 | 7.7 | |
| Los Angeles | 40.4 | 39.6 | 0.0 | 87.4 | 34.3 | 46.0 | 8.6 | |
| New York | 38.3 | 37.2 | 0.0 | 73.6 | 31.3 | 44.5 | 9.6 | |
| % multifamily housing b | Chicago | 23.2 | 15.0 | 0.0 | 99.8 | 5.2 | 33.4 | 24.0 |
| Houston | 22.5 | 11.9 | 0.0 | 98.7 | 1.4 | 35.2 | 25.6 | |
| Los Angeles | 27.3 | 19.4 | 0.0 | 100.0 | 6.5 | 42.2 | 25.3 | |
| New York | 32.1 | 20.0 | 0.0 | 100.0 | 3.1 | 55.5 | 32.7 | |
| % one- to four-family rental b | Chicago | 19.3 | 12.7 | 0.0 | 94.6 | 5.8 | 30.2 | 16.8 |
| Houston | 15.7 | 12.8 | 0.0 | 78.4 | 7.6 | 19.8 | 11.5 | |
| Los Angeles | 22.1 | 18.2 | 0.0 | 84.7 | 11.0 | 30.8 | 14.5 | |
| New York | 20.3 | 16.4 | 0.0 | 89.7 | 7.2 | 31.4 | 15.6 | |
| Rental and multifamily housing over 50% c | Chicago | 0.34 | 0.00 | 0.00 | 1.00 | 0.00 | 1.00 | 0.47 |
| Houston | 0.29 | 0.00 | 0.00 | 1.00 | 0.00 | 1.00 | 0.45 | |
| Los Angeles | 0.46 | 0.00 | 0.00 | 1.00 | 0.00 | 1.00 | 0.50 | |
| New York | 0.49 | 0.00 | 0.00 | 1.00 | 0.00 | 1.00 | 0.50 | |
| Average rent | Chicago | 745 | 684 | 154 | 2,975 | 583 | 848 | 272 |
| Houston | 682 | 618 | 228 | 2,387 | 512 | 778 | 275 | |
| Los Angeles | 904 | 816 | 244 | 3,736 | 672 | 1,040 | 345 | |
| New York | 882 | 820 | 232 | 3,721 | 700 | 997 | 314 | |
| % non-Hispanic Black | Chicago | 24.4 | 3.5 | 0.0 | 100.0 | 0.8 | 33.2 | 36.3 |
| Houston | 18.2 | 7.9 | 0.0 | 98.2 | 2.7 | 22.4 | 24.1 | |
| Los Angeles | 7.5 | 2.3 | 0.0 | 95.9 | 0.8 | 6.0 | 14.1 | |
| New York | 18.9 | 4.1 | 0.0 | 99.3 | 0.9 | 24.7 | 27.8 | |
| % Hispanic | Chicago | 16.4 | 5.9 | 0.0 | 99.4 | 2.6 | 19.1 | 22.6 |
| Houston | 28.4 | 20.6 | 0.0 | 96.5 | 10.4 | 40.1 | 23.1 | |
| Los Angeles | 40.1 | 33.4 | 0.0 | 99.6 | 12.7 | 64.2 | 29.4 | |
| New York | 19.1 | 9.7 | 0.0 | 96.1 | 4.7 | 25.8 | 20.8 | |
| n | Chicago | 2,018 | ||||||
| Houston | 880 | |||||||
| Los Angeles | 2,604 | |||||||
| New York | 4,382 | |||||||
Source. U.S. Census, 2000 Census of Population and Housing (SF3) and 2005–2009 American Community Survey, machine-readable data downloaded by the authors.
Note. SFs = Summary File 3.
Percent of households paying more than 30 percent of their income on housing.
Percent of the tract’s housing stock that is either in structures with five or more units (multifamily) or rented and in one- to four-family buildings.
Dummy variable indicating that multifamily and rental housing units together account for over half the tract’s housing stock.
Declaration of Conflicting Interests
The author(s) declared no potential conflicts of interest with respect to the research, authorship, and/or publication of this article.
Funding
The author(s) disclosed receipt of the following financial support for the research, authorship, and/or publication of this article: This study was supported by John D. and Catherine T. MacArthur Foundation.