
Abstract
This paper seeks to identify which resilience-oriented policies are being enacted and factors that influence policy adoption. We develop clusters of policies related to three types of resilience: ecological, engineering, and community. Among large U.S. cities, we find wide variation in the number and type of policies enacted. Through multivariate analysis, we identify factors that are associated with the adoption of these policies. Similar to earlier work on sustainability and climate change policy, our results show that larger cities are more likely to adopt all three types of resilience policies. Wealthier and liberal cities adopt more ecological resilience policies. Cities that are members of city networks also adopt more policies, but not all networks significantly influence policy adoption suggesting that network goals and connections are important. We also find that among these large cities, it is the smaller of them that appear to benefit most from membership in networks.
Keywords
Introduction
Cities confront intertwined social and environmental challenges. Recently these challenges have included climate change, a pandemic and other public health issues, racism, extremism, and inequality. In the face of these multifaceted issues, many cities have embraced resilience as a new organizing principle (Meerow and Newell 2019). Broadly defined, “resilience is the ability to prepare and plan for, absorb, recover from, and more successfully adapt to adverse events” (National Research Council 2012, 1). Cities are increasingly developing plans, establishing offices, and organizing policy around the concept of resilience (Fastiggi, Meerow, and Miller 2020; Moser et al. 2019). The policy platform associated with resilience is broad and ambitious ranging from improving disaster response to addressing underlying drivers of social vulnerability to changing approaches to governance (Meerow and Newell 2019; Therrien, Usher, and Matyas 2020). In many instances, local resilience efforts have been supported by state and national governments, international organizations, and nonprofits that provide funding and guidance (Moser et al. 2019; Cutter 2016). To help guide continued investment in urban resilience, it is important to consider and examine the factors that encourage cities’ adoption of resilience policy.
Although resilience has become an important concept in urban governance, few studies have analyzed the factors associated with resilience policy adoption. Surveys suggest that practitioners use different definitions of resilience to fit their city's context and needs (Keenan 2018; Meerow and Stults 2016). Given the numerous definitions of resilience and the diverse institutional context, translating concepts into specific policies to allow for interjurisdictional comparison is complicated (Lesnikowski et al. 2019; Keenan 2018). Not surprisingly, differing definitions of resilience generate divergent sets of prescribed policies (Béné et al. 2018; Ribeiro and Pena Jardim Gonçalves 2019). To provide some order to the policy mix, we have constructed three conceptual domains of resilience based on accepted analytical frameworks and theories. They are ecological resilience, engineering resilience, and community resilience. In this paper, we ask: What characteristics of cities are associated with the adoption of ecological, engineering, and community resilience policies and programs?
In the next section, we review relevant literature to provide context and background for our research. This is followed by a discussion of the data and methods used in this study. In the Results section, we report the patterns of policy adoption and identify the variables that are associated with city enactment of the three types of resilience policies. The implications of the findings are explored in the final section of the paper.
Resilience: Typologies and Concepts
The dramatic increase in the use of resilience in policy discourse and academic research has led some to argue that resilience is replacing sustainability (Davoudi et al. 2012). This contention highlights the conceptual overlap in the two concepts (Zhang and Li 2018) and the role both play as normative, aspirational goals for urban policy (Beilin and Wilkinson 2015). Moreover, resilience is also increasingly used by cities to frame their efforts to prepare for the impacts of climate change rather than the more traditional mitigation or adaptation frames (Kythreotis and Bristow 2017; Woodruff et al. 2018).
Holling (1996) introduced the concept of ecological resilience to describe the capacity of a complex ecological system to persist or to absorb change while preserving its structure and function. Holling's work is foundational to current understanding of social-ecological systems, that is, natural and human systems are strongly coupled, behave in complex nonlinear ways, and are continuously changing and evolving (Davidson et al. 2016; Meerow, Pajouhesh, and Miller 2019). Examples of disturbances from human activities related to ecological resilience are deforestation, pesticide use, pollution, environmental characteristics, and land use change, among others (Chambers, Allen, and Cushman 2019; Peterson, Allen, and Holling 1998). Chambers, Allen, and Cushman (2019) operationalized the concept by looking at major factors that affect ecological resilience. These factors not only include natural disasters (drought, fire, plant invasions) but also anthropogenic disturbances (over harvesting, urban and energy development), environmental factors (climate change), ecosystem attributes and processes (water storage), and management actions related to resilience (Chambers, Allen, and Cushman 2019). Policies and programs derived from ecological resilience address natural and human disturbances and stresses on ecological systems and include energy conservation, water quality improvement, air pollution reduction, greenhouse gas reduction, investment in green industry, and development of green infrastructure.
Holling (1996) differentiates ecological resilience from engineering resilience, which “concentrates on stability near an equilibrium steady state, where resistance to disturbance and speed of return to the equilibrium are used to measure the property” and focuses on “efficiency, constancy, and predictability” (Holling 1996, 33). Engineering resilience is concerned with quick recovery to a previous state after a disturbance (Albright and Crow 2021; Davidson et al. 2016; Folke 2006; Holling 1996). One approach to engineering resilience includes enhancing local infrastructure to lessen or ideally prevent disturbances or stresses (Woods 2015). Engineering resilience broadly covers activities such as construction and technology that help systems withstand and recover. Inherently, engineering resilience is related to the context of risk management (Sansavini 2017). Reducing the damage from physical shocks dominates engineering policy prescriptions which involve hazard mitigation policies and programs such as hardening infrastructure to withstand extreme weather.
Community resilience is a multifaceted concept that has been treated broadly as “the interconnected network of systems” that impact human society, “including the socioeconomic, ecological, and built environments” (Fitzpatrick 2016, 58). However to some scholars, it more narrowly addresses the socioeconomic dimension by focusing on the needs and vulnerabilities of local residents (Norris et al. 2008; Magis 2010). Factors such as the distribution of community resources, the level of public engagement and collective action, and considerations of equity encompass community resilience (Magis 2010; Fitzpatrick 2016). Berger (2017) also outlined “fostering community cohesion and support” as the major components of community resilience. Therefore, policies derived from this conceptualization include efforts to target city programs to the most vulnerable residents and neighborhoods, hiring dedicated resilience staff as well as creating a more transparent and engaged policy process.
To date, the urban resilience literature has primarily been theoretical (Therrien, Usher, and Matyas 2020) with multiple syntheses and conceptual papers putting forward different definitions and frameworks of urban resilience (Feldmeyer et al. 2019; Hernantes et al. 2019; Moser et al. 2019; Ribeiro and Pena Jardim Gonçalves 2019). Recently, interest has grown in empirical studies of resilience plans (Croese, Green, and Morgan 2020; Meerow, Pajouhesh, and Miller 2019; Woodruff et al. 2018), policy (Therrien, Usher, and Matyas 2020; Woodruff et al. 2021), and institutionalization (Fastiggi, Meerow, and Miller 2020; Kernaghan and da Silva 2014). These studies identify various city characteristics associated with resilience efforts. Funding availability and source, staff capacity, leadership and political buy-in, disaster experience, and network membership have been shown to be important considerations in shaping city resilience planning and policy (Fastiggi, Meerow, and Miller 2020; Kernaghan and da Silva 2014). However, these prior studies have tended to focus on a single case study (Croese, Green, and Morgan 2020; Fainstein 2018; Fastenrath, Coenen, and Davidson 2019) or take a descriptive, qualitative approach (Fastiggi, Meerow, and Miller 2020; Woodruff et al. 2018). We build on this earlier work by quantitatively modelling predictors of city adoption of policies across three different conceptualizations of resilience: ecological, engineering, and community. As one of the few larger-n, quantitative studies of resilience, this paper contributes to theory building and advances the urban resilience field toward new questions and hypothesis testing (Biesbroek et al. 2018).
Influences on Policy Adoption
City governments naturally vary in the public policies they adopt and implement. This variation can be seen not only in policy priorities themselves, but also in the number of policies enacted. Some cities have robust policy agendas while others exhibit substantially less enthusiasm for policy activism. Cities often learn from nearby cities about the relative success and failure of new policies (Grossback, Nicholson-Crotty, and Peterson 2004). Although public policies may not always produce the expected outcomes, they sometimes achieve their intended effect. For instance, policies focused on vulnerable people have been shown to help protect them from natural and human-caused disasters (Abbasi Dolatabadi, Seyedin, and Aryankhesal 2016). A comparative study of eight cities found that new targeted policy prescriptions and investments are producing more resilient urban development (Plastrik, Coffee, and Cleveland 2019). Local governments around the globe are enacting a broad array of policies and marshaling more policy instruments in an effort to build resilience (Coaffee et al. 2018).
Policy adoption decisions of local governments in the U.S. are influenced by many factors. Hajnal and Trounstine (2010) identified four overarching theoretical perspectives that have dominated the empirical inquiry into urban policymaking: economic imperatives, political considerations, local needs, and institutional structures. Their study of city government spending choices in three policy arenas over a 15-year period showed that no single theoretical explanation was sufficient; instead, each of the perspectives contributed to the spending patterns, albeit somewhat differently across the policy categories.
Clearly, the explanations for the variation in policy adoption are many and multifaceted. Researchers have pursued the policy adoption question in ways that reflect the Hajnal and Trounstine (2010) formulation but with different emphases and labels. In general, many prior analyses of urban policy enactments have examined explanations that involve problem severity, political ideology, political institutions, policy diffusion, and capacity. The discussion that follows expands on these potential explanations for policy adoption.
Problem Severity
Problem severity and proximity can be an important influence on policymaker behavior. The more severe the problem, the more salient it becomes to the public, and consequentially, to local officials (Spence, Poortinga, and Pidgeon 2012; Spence and Pidgeon 2010; Portney 1991; Hannibal, Sansom, and Portney 2019). Additional studies argue that not only the severity of the problem but also its proximity is important (Hannibal and Portney 2020; Hughes, Runfola, and Cormier 2018). Visible, local problems are more likely to motivate a response from local government than global issues would (Hughes, Runfola, and Cormier 2018). Seeking solutions to salient issues often stimulates the consideration of new approaches by policymakers (Mullin 2008). For instance, municipalities are more likely to join other jurisdictions in the creation of collaborative watershed partnerships if they have experienced locally severe pollution problems from agricultural or urban runoff (Lubell et al. 2002).
A community's experience with major problems such as disasters, in theory, should have an impact on its adoption of resilience policies. An extreme event such as a disaster elevates awareness of a community's risk and provides a window of opportunity for enacting new policy (Fastiggi, Meerow, and Miller 2020). As the community addresses the disaster's aftermath, the challenges of recovery can lead policymakers to consider policies that could reduce future risk, as Albright and Crow (2021) showed in their research on local flooding responses in Colorado. This finding has been borne out in research on the local effects of climate change as well. Communities that have experienced casualties from extreme events such as floods and hurricanes demonstrate a greater commitment to climate change policies (Zahran et al. 2008). However, this finding is not universal: research by Krause (2012) found little evidence that severe weather events yielded greater support for the enactment of climate policy.
Similarly, the social vulnerability of a community exacerbates problem severity and can motivate policy. Social vulnerability refers to the social factors that influence the ability of communities and their populations to anticipate, respond, and recover from disturbances and disasters (Cutter, Boruff, and Shirley 2003; Van Zandt et al. 2012). Social vulnerability is typically characterized by race, income, age, disability, language, housing, household structure, and mobility options (Cutter, Boruff, and Shirley 2003; Flanagan et al. 2011). Research has demonstrated that vulnerable populations are more prone to disaster, often hit hardest, and slower to recover (Chakraborty et al. 2014; Chakraborty, Collins, and Grineski 2018; Finch, Emrich, and Cutter 2010; Peacock et al. 2014; Van Zandt et al. 2012). Recurrent disturbances can lead to cumulative effects, resulting in widening disparities (Howell and Elliott 2019). As opposed to focusing on income or poverty alone, the concept of social vulnerability recognizes that multiple factors ultimately lead to differential abilities to prepare, respond, and recover from disasters (Finch, Emrich, and Cutter 2010). Resilience plans often propose actions to combat racism and increase economic opportunity (Woodruff et al. 2018; Meerow, Pajouhesh, and Miller 2019). Consequently, communities with greater social vulnerability may adopt more resilience policies. As mentioned above, issues that relate to vulnerability are highly visible and local, likely making them more salient to city government.
Political Ideology
While problem severity may be influential in policy adoption, political ideology shapes how problems are perceived and affects support for related policies. For instance, in the U.S., political ideology has a much stronger impact on climate change perceptions than objective climate conditions do (Marquart-Pyatt et al. 2014; Zahran et al. 2006). Indeed, political orientation is consistently found to be the strongest predictor of an individual's views on climate change (Hannibal, Liu, and Vedlitz 2016; Liu, Vedlitz, and Shi 2014). Gurney, Hamlet, and Regan (2021) suggest that political ideology may affect local perceptions of and response to disasters, with these windows of opportunity less likely to catalyze action in cities with resistant political contexts. Conversely, liberal political ideology and Democratic partisan affiliation have long been linked to support for environmental policies (McCright and Dunlap 2010; Wood and Vedlitz 2007; Rosenbaum 2017). For example, Zahran et al. (2008) show that the odds of a jurisdiction joining the Cities for Climate Protection (CCP) program increase as the net Democratic presidential vote in a jurisdiction increases. By extension, it seems likely that cities with a more liberal populace would adopt more resilience policies.
Political Institutions
Political institutions matter in many ways, but especially in policy adoption (Lubell, Feiock, and Ramirez 2005; Nelson and Svara 2012; Ruhil 2003). The structure of city government, that is, whether a city operates with a mayor-council form or a council-manager form, has been shown to influence policy adoption (Nelson and Svara 2012). Some studies have found that mayor-council governments, the more politicized of the two structures, are more likely than council-manager governments to enact symbolic policies (Clingermayer and Feiock 1990). With regard to climate change, Krause (2011) found that mayor-council cities were more prone to join the Mayor's Climate Protection Agreement, an accord that committed the city to reducing the volume of its greenhouse gas emissions. Research in Florida showed that cities with a mayor-council form of government were less likely than council-manager governments to use an important regulatory component of smart growth: density bonuses (Ramírez de la Cruz 2009). This was attributed to the tendency for mayor-council structures to be less professionalized than council-manager systems and “therefore less likely to adopt innovative instruments for delivering public services…” (Ramírez de la Cruz 2009, 236). Although it is apparent that political institutions and particularly, the form of government matter, the direction of their impact with respect to policy adoption is mixed.
Policy Diffusion
Policy learning and horizontal diffusion have been shown to have an impact on the adoption of policies. Organizational membership networks are mechanisms that promote diffusion and learning and thus policy transference from one jurisdiction to another. Network membership makes a significant difference in the number of climate change measures that city governments adopt (Krause 2012; Rashidi and Patt 2018). Cross-national research looking into the impact of membership in the CCP program demonstrated its ability to motivate local policy action (Lee and Koski 2014). “Cities that are members of the CCP program are addressing climate change diligently through more arduous steps of implementation and monitoring in comparison with non-members” (Lee and Koski 2014, 489). Network membership may similarly motivate the enactment of resilience policy.
Although networks provide participating cities multiple benefits that can help them overcome barriers to policy adoption, this support may be more valuable in some cities than others (Busch 2015; Woodruff 2018). Smaller, lower-capacity cities may experience greater benefit from network membership than cities that are already policy leaders. Previous studies have shown innovative cities are more likely to join networks (Kern 2014; Woodruff 2018) and that networks are positively associated with policy adoption (Krause 2011; Rashidi and Patt 2018), but to the best of our knowledge no study has considered the differential benefit of networks.
Capacity
Entities with greater capacity, however defined and measured, are better equipped to consider new policies. Population size is an indicator of a city's capacity because larger jurisdictions typically have more resources available to them than their smaller counterparts do (Bausch and Koziol 2020). Consequently, the policy agenda of larger cities is likely to be more robust. This was found to be the case with regard to the promotion of climate policies (Lee 2013; Lee and Koski 2014; Yeganeh, McCoy, and Schenk 2020). Additionally, a survey of planning directors in Midwestern communities showed that larger cities outpaced smaller ones in the number of sustainability-related programs and activities they had implemented (Conroy and Iqbal 2009). One of the lessons of the Lubell, Feiock, and Handy (2009) research on cities in California's Central Valley was that smaller cities require infusions of technical, financial and planning assistance in their efforts to become more sustainable.
Capacity is also reflected in the financial situation of the city. Cities with greater affluence have more resources and are better able to afford the adoption of innovative or costly policies (Lubell, Feiock, and Handy 2009). Many researchers have pointed out that high income places are positively correlated with policy adoption (Lee 2013; Mathy 2007; Rashidi and Patt 2018; Tobin 2017). Research on sustainability policy, for example, has found a stronger prevalence for adoption among wealthier cities (Portney 2013; Lubell, Feiock, and Handy 2009). Dire fiscal conditions may serve as a constraint on local officials’ ability to adopt policies, particularly those in which the benefit of a policy may not be immediately apparent (Betsill 2000). In a survey of officials in medium and large U.S. cities, respondents identified a lack of financial capacity as a significant obstacle in their efforts to pursue many sustainability policies and programs related to environmental protection, economic development, and social equity (Saha and Paterson 2008).
Methods
The sample for this study is the 101 largest cities in the United States, ranging from New York City to Spokane, Washington. We focus on large cities in this research because their actions and decisions have an impact on the greatest number of people. 1
Dependent Variables: Ecological Resilience, Engineering Resilience, and Community Resilience Policies
To create a set of policies and programs related to ecological, engineering, and community resilience, we relied on a database of resilience policies developed by Woodruff et al. (2021). Woodruff and associates generated an expansive protocol of 109 resilience policies, drawing on the diverse literature on urban resilience as well as actual city resilience plans and programs. After testing the protocol on two large cities, in 2018 a web-based search of city documents such as city ordinances, department pages, city council meeting minutes, and zoning codes was undertaken for evidence of adoption and implementation of resilience policies in large U.S. cities.
Using a binary approach, policies were coded as present or absent. A dichotomous measure is a fairly standard way to gauge policy adoption in larger-n comparative studies (Bae and Feiock 2013; Opp, Osgood, and Rugeley 2014). For a policy to be coded as present it had to: (1) fulfill the description of the policy; (2) have sufficient evidence that the policy was in effect or the program was being implemented; and (3) be a city policy, that is, the city authorized and either funded or implemented the policy or program. 2 For most policies and programs, a stated intent to build resilience was not necessary. In other words, the policies help build resilience but may not be framed or described by cities as resilience. For example, providing disaster warnings in multiple languages makes cities more resilient by reducing vulnerability in an at-risk population, but cities do not necessarily classify their multilingual disaster warnings as part of their resilience agenda.
As Woodruff et al. (2021) explained, there might be a number of different ways that a city could be credited with having a policy or program. For instance, a city with a single green infrastructure demonstration project and a city that employs various tools to promote green infrastructure would both be counted as having a green infrastructure program. Although coding for the presence of policies does not capture their context and depth, this approach is essential to compare a larger sample of cities and develop an index for statistical analysis (Biesbroek et al. 2018). Conversely, having a policy coded as absent may mean that either the city does not have the specific policy or that the policy is not documented online.
In order to explore the relationship between city characteristics and adoption of different types of resilience policies, we developed three clusters of policies for ecological, engineering, and community resilience using data from the Woodruff et al. (2021) database. These policies and programs were categorized based on their nature and intent. Policies related to pollution reduction and prevention, energy and natural resource conservation, climate change mitigation and adaption contribute to ecological resilience. The engineering resilience cluster is comprised of policies and programs that have as their primary intent hazard mitigation and recovery, often with a security focus and/or a redundancy component. Our third cluster, community resilience, incorporates policies intended to assist vulnerable populations as well as programs involving city government outreach and engagement. The total number of policies categorized is 68. The ecological resilience category consists of 24 policies, the engineering resilience category is comprised of 20 policies, and 24 policies reflect community resilience. Appendix lists the component policies and programs in each of the three categories. We then summed the number of resilient policies each city had enacted or implemented in each resilience category. An implicit assumption in our approach of quantifying the number of policies adopted is that more policies is better or represents greater effort to build resilience (Lesnikowski et al. 2019).
Independent Variables
To model the characteristics of cities’ adoption of different types of resilience policy, we collected data from numerous secondary sources. We are interested in the impact of five kinds of characteristics of cities: (1) problem severity, (2) political ideology, (3) political institutions, (4) policy diffusion, and (5) capacity. Table 1 summarizes the labels with their component variables used in the analysis, providing their source and descriptive statistics for the 101 cities. We then develop multivariate models using the three resilience clusters as the dependent variables.
Descriptive Statistics of Variables (n = 101).
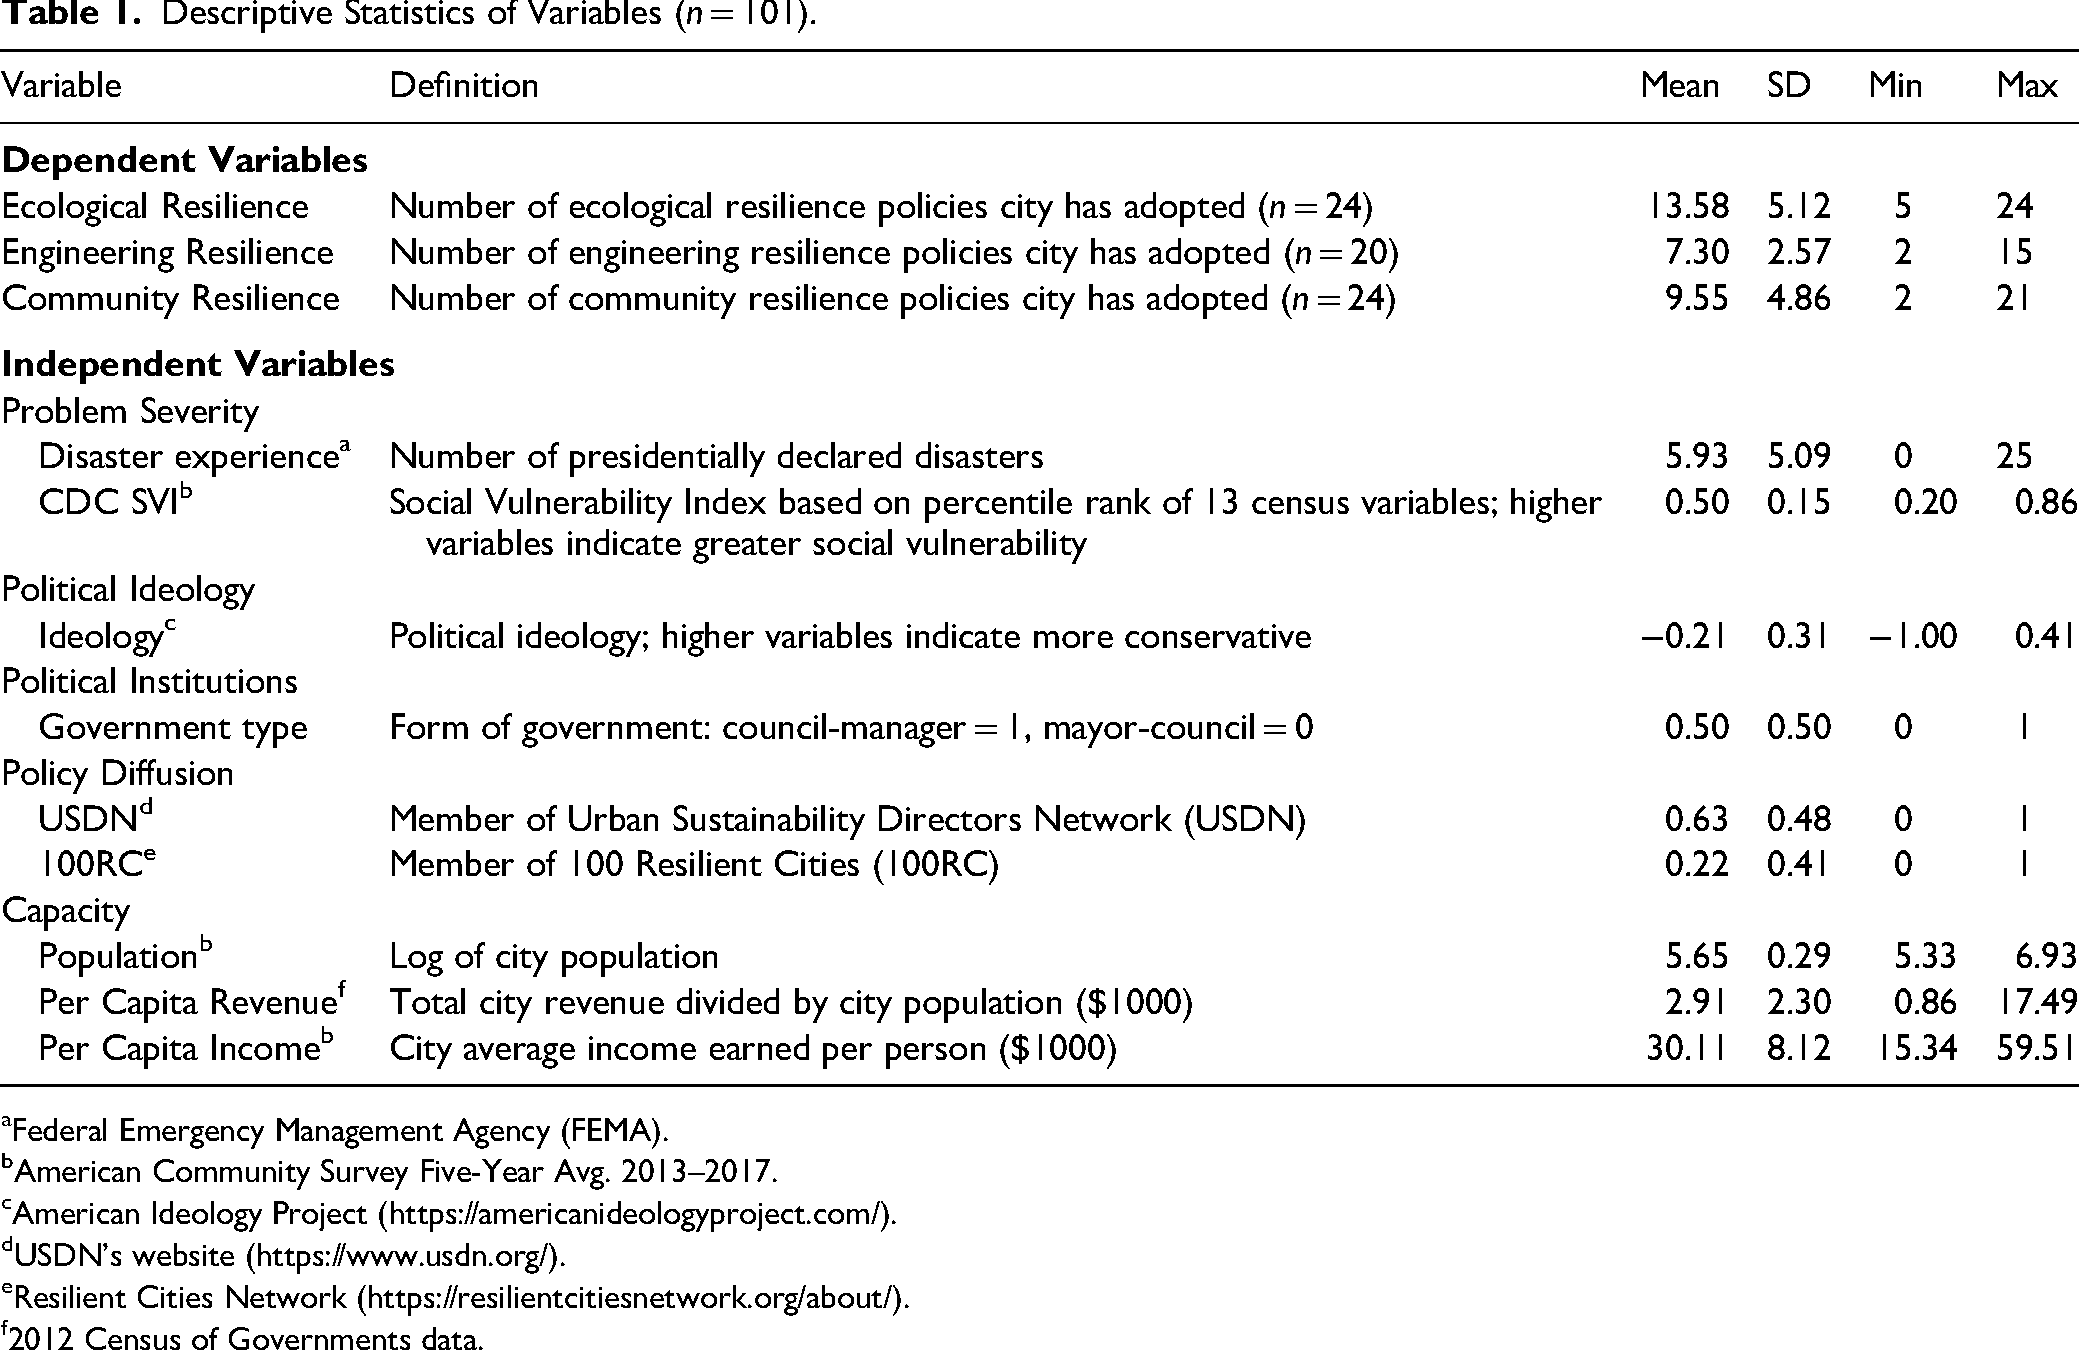
Federal Emergency Management Agency (FEMA).
American Community Survey Five-Year Avg. 2013–2017.
American Ideology Project (https://americanideologyproject.com/).
USDN's website (https://www.usdn.org/).
Resilient Cities Network (https://resilientcitiesnetwork.org/about/).
2012 Census of Governments data.
To describe problem severity, we include two variables: disaster experience and social vulnerability. The number of presidentially declared disasters in the county in the past 10 years, available from the Federal Emergency Management Agency (FEMA), is used to operationalize disaster experience. To calculate social vulnerability, we use the Centers for Disease Control and Prevention Social Vulnerability Index (CDC SVI) (Flanagan et al. 2011). The CDC SVI ranks communities on 13 census variables, including poverty, age, race, vehicle access, and housing type that were collected from the American Community Survey (ACS) 2013–2017. These variables are grouped into four themes: socioeconomic status, household composition and disability, minority status and language, and housing and transportation. ile ranks for variables in each theme are summed, then a percentile rank is calculated for each theme. The final index is an overall percentile rank of the city sum of the theme percentile rankings (Flanagan et al. 2011). Typically, the CDC SVI is applied to census tracts or counties but here we calculate the index at the city level. It is important to note that since the index is based on rankings, it is a relative measure of a city's social vulnerability. The index essentially indicates the social vulnerability relative to the other 100 cities in the sample. 3
To capture political ideology, we use estimates of policy preferences developed by Tausanovitch and Warshaw (2013). Although electoral behavior in presidential elections is a common operationalization of political ideology (Zahran et al. 2008), vote shares can be a product of short-term forces and produce a less accurate measure of policy preferences (Tausanovitch and Warshaw 2013). Tausanovitch and Warshaw (2013) estimate political ideology using data from multiple policy preference surveys, which together include over 275,000 respondents. Using multilevel regression with poststratification, mean policy preferences for every large city in the U.S were estimated. To test for the impact of political institutions, we focus on the form of government in each city. Cities are coded as either having a council-manager form (1) or mayor-council form (0). Cities in the sample are relatively evenly distributed across these two forms of government.
To assess the role of diffusion, we include city membership in two networks: Urban Sustainability Directors Network (USDN) and 100 Resilient Cities (100RC). Although other membership organizations such as Local Governments for Sustainability (ICLEI) and C40 address resilience issues, we use USDN and 100RC due to their prominence in the sustainability and resilience fields, respectively. USDN is a peer-to-peer learning network of more than 200 communities that shares best practices with local government sustainability practitioners across the United States and Canada. Compared to ICLEI, USDN is more actively engaged with U.S. cities of various sizes. 4 We collected membership data from USDN's website. Of the cities in our sample, 64 are members of USDN. 100RC, a $164 million dollar initiative funded by the Rockefeller Foundation, provided financial and technical support to participating cities to build resilience to “chronic stresses and acute shocks”. Although the program ended in July 2019, the network of participating cities has continued as the Resilient Cities Network. The initial program only included 100 cities globally, but 100RC has had a profound impact on the discourse and practice of urban resilience (Fastenrath, Coenen, and Davidson 2019; Leitner et al. 2018; Taylor et al. 2021). Among the cities in our sample, 22 are members of 100RC; 21 sample cities are members of both organizations.
Lastly, we include three variables to represent city capacity: population, per capita income, 5 and city government revenue per capita. Population and per capita income are taken from the ACS 2013–2017. To improve the distribution of population and reduce the influence of New York City, an outlier with a population more than 8 million, population is log transformed. Data from the 2012 Census of Government are used to generate per capita revenue values. We calculate city total revenue by summing all sources of revenue and dividing city total revenue by population. To avoid issues of multicollinearity between the financial capacity variables, we include per capita income and city revenue in separate models.
To explore whether network membership is more important for some cities than others, we test interactions between membership in 100RC and population. We run multivariate models using the different city characteristics for the ecological, engineering, and community resilience types. We tested for but found no serious violations of regression assumptions. All variance inflation factor (VIF) scores are well below acceptable standards (the highest is 2.03), indicating no problems with multicollinearity. No issues were detected with heteroskedasticity of nonlinearity. We use ordinary least squares regression to fit the models and the coefficient estimates are relatively stable across the models.
Ecological Resilience Results.
*Indicates significance at the 0.05 level.
**Indicates significance at the 0.01 level.
***Indicates significance at the 0.001 level.
Engineering Resilience Results.
*Indicates significance at the 0.05 level.
**Indicates significance at the 0.01 level.
***Indicates significance at the 0.001 level.
Community Resilience Results.
*Indicates significance at the 0.05 level.
**Indicates significance at the 0.01 level.
***Indicates significance at the 0.001 level.
Results
Patterns of Policy Adoption
Cities consistently adopt more policies related to ecological resilience than the other two resilience policy types. On average, cities have adopted 14 (58%) of the 24 ecological resilience policies and programs included in the analysis compared to 7 (35%) of the 20 engineering and 10 (42%) of the 24 community resilience policies. While adoption of ecological, engineering, and community resilience policies is positively correlated, the relationship is weak. In other words, cities that score high in one category also tend to score higher in the others but patterns of policy adoption vary across cities. Large, progressive cities like New York City and San Francisco have high rates of adoption of resilience policies across all categories. But most cities seem to specialize in one or two categories of resilience. Of the 101 largest U.S. cities, 71 score highest on ecological resilience, 14 on engineering resilience, and 16 score highest on community resilience.
Figure 1 presents the distribution of scores among the three resilience indices as a percentage of policies in each category. City adoption rates for ecological and community resilience policies are shown on the X and Y axes; engineering resilience is reflected in the size of the bubble, with larger bubbles indicating a higher engineering resilience score. Double circles signify two cities with the same scatter scales but with different engineering resilience scores. Thickness of a circle line shows the cities with the same score as another city. The diagonal line demonstrates that most cities score higher on ecological resilience policy adoption than on community resilience policy.
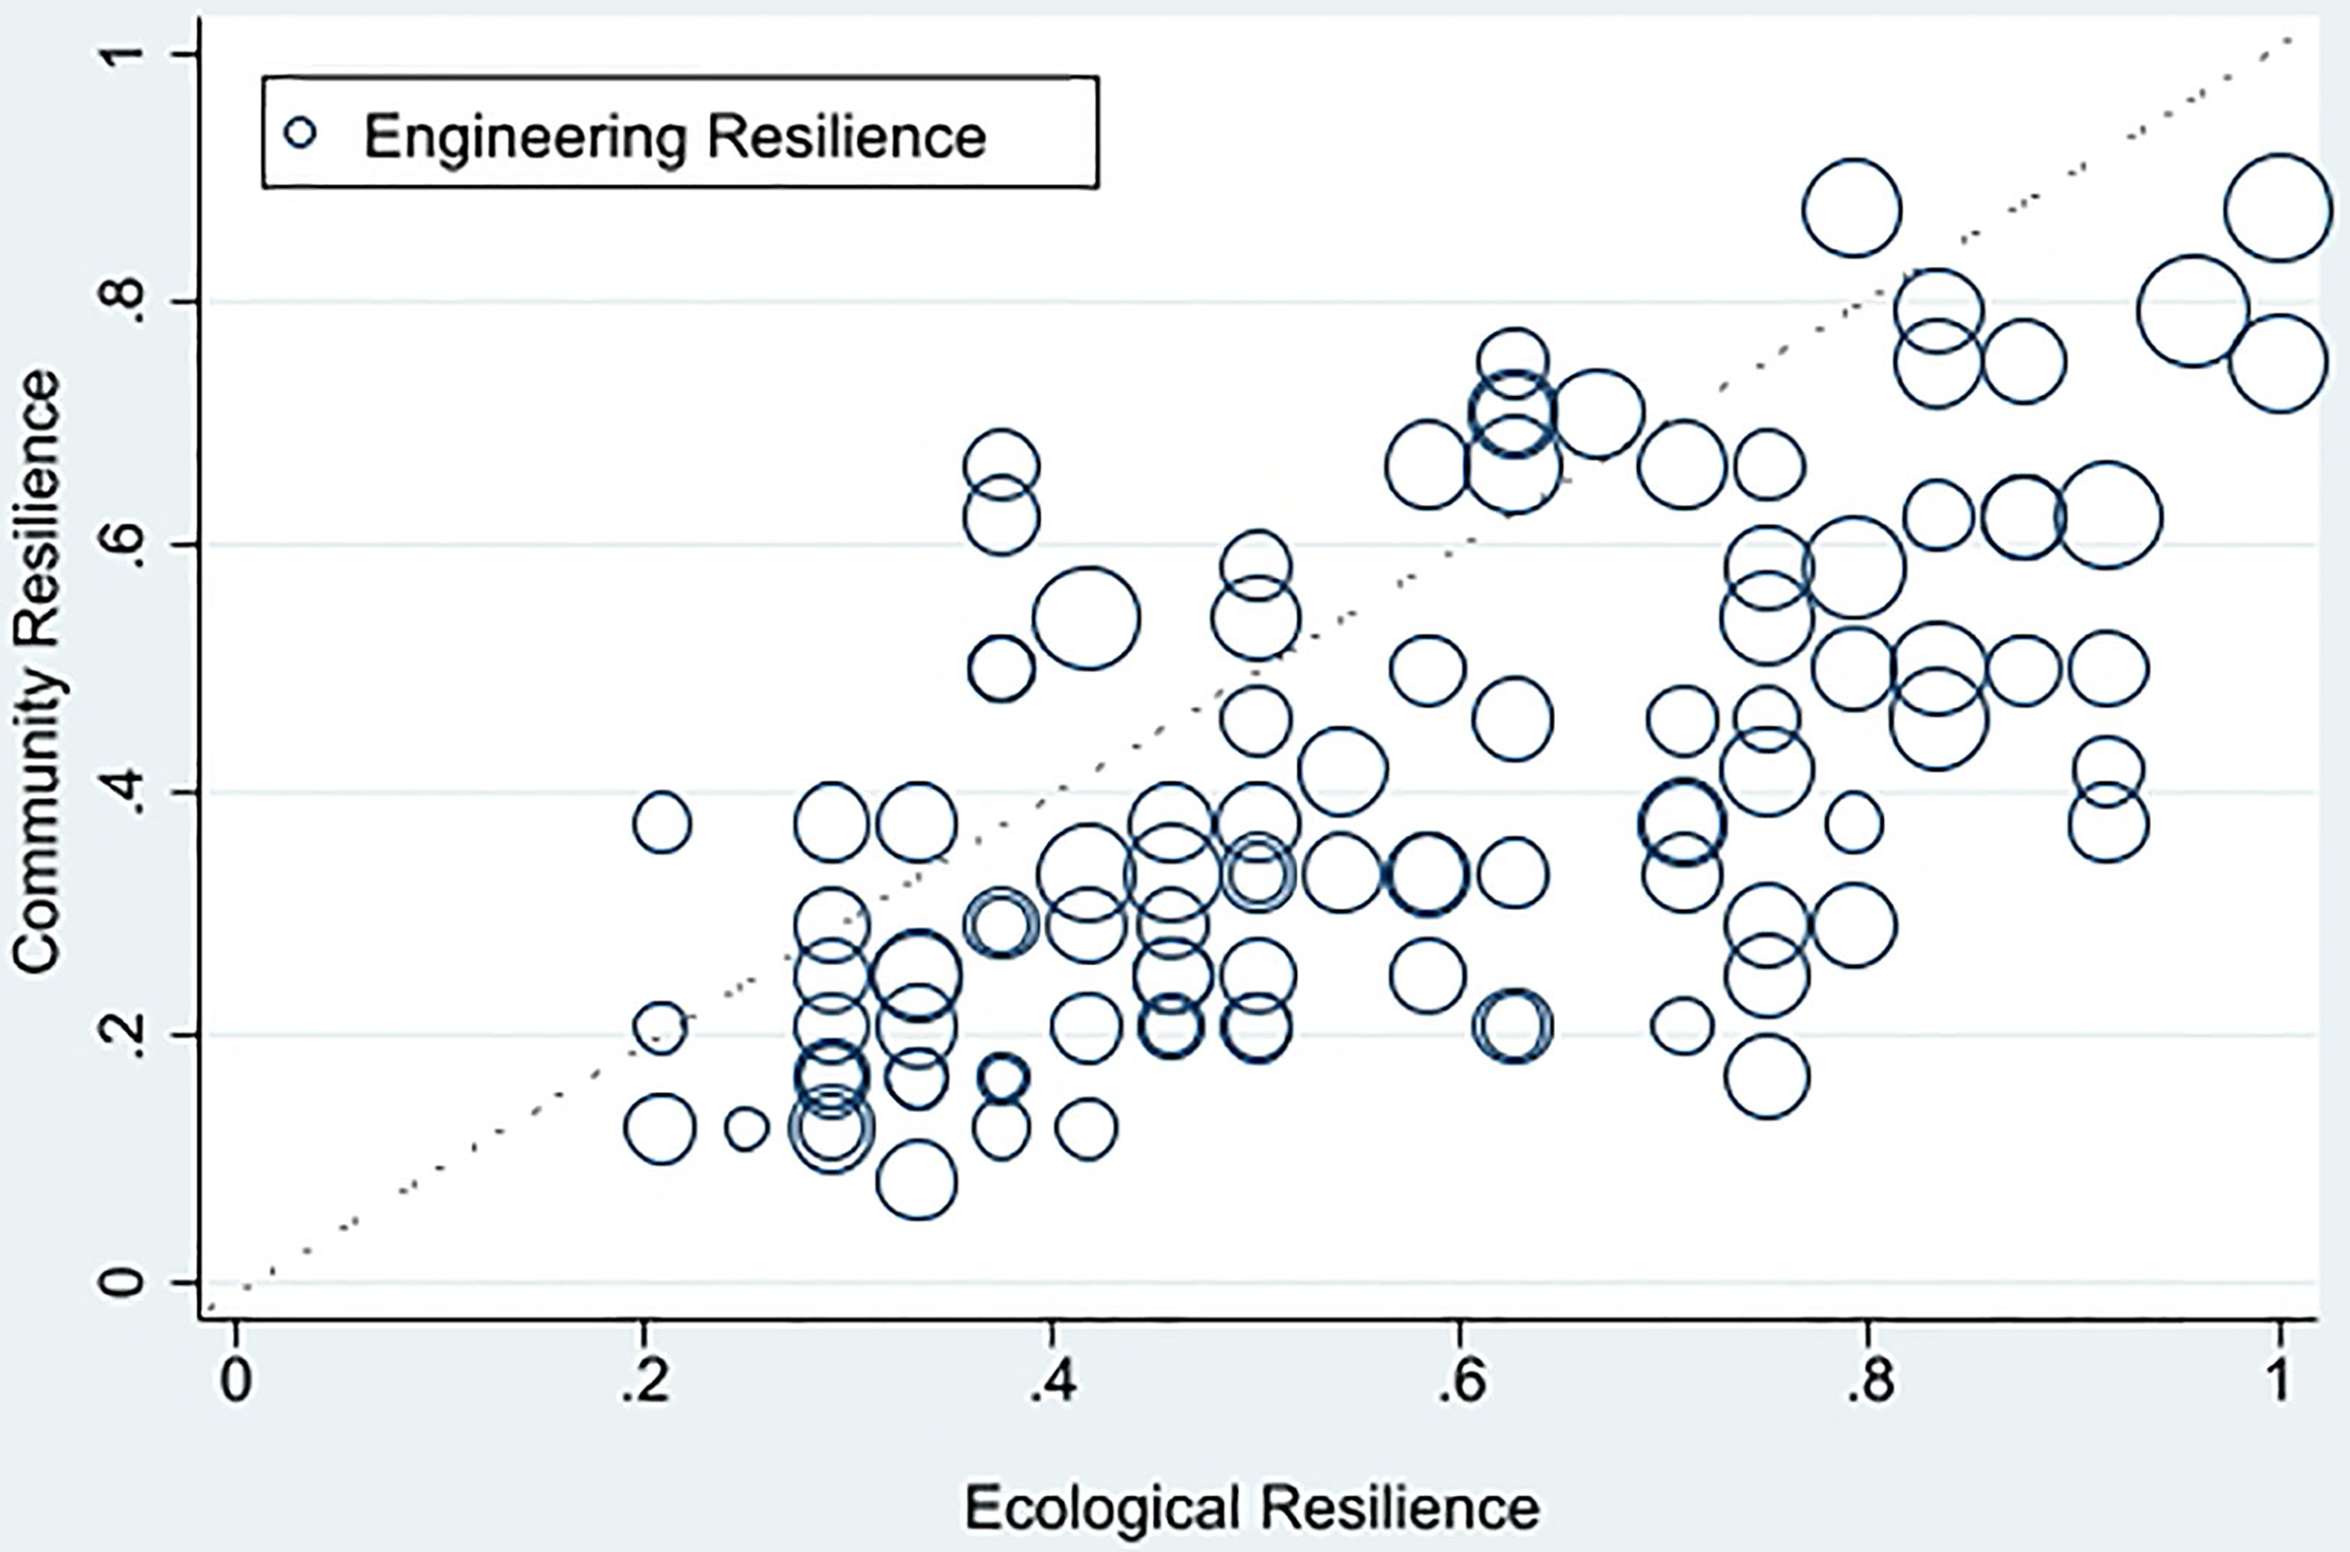
Distribution of city policy adoption. Comparing city adoption of community, ecological, and engineering resilience. Cities that fall above the diagonal line have adopted relatively more community resilience policies than ecological resilience. Engineering resilience is shown by size of bubble.
Many of the ecological resilience policies have relatively high rates of adoption across the country. These include green infrastructure programs (96 cities), comprehensive environmental planning (91 cities), stormwater quality protection or improvement programs (90 cities), and city green fleet policies (87 cities). Many of these policies or programs involve the city “greening” an existing city function to make it more resilient. The least popular among the ecological policies involves city-underwritten subsidies or rebates to assist residents in purchasing and installing grey water reuse systems. Only nine cities offer such a program.
Among the engineering resilience policies, the most prevalent are the replacement of or upgrades to storm drainage (92 cities), building codes that take hazards into account (84 cities), early warning systems that notify residents in emergencies (79 cities), and the imposition of stormwater utility fees (68 cities). Conversely, policies intended to harden critical infrastructure are among the least common engineering resilience efforts. Hardening electric generation plants has been adopted by only three cities but as the 2021 winter storm in Texas illustrated, weatherization of electric generation is critical to ensure service at times of severe weather when demand can surge. Hardening schools (4 cities), drinking water treatment plants or distribution (11 cities), transportation infrastructure (14 cities), electric distribution (15 cities), and wastewater treatment plants (18 cities) are also uncommon. The fact that relatively few cities have policies to harden critical infrastructure may reflect the reality that complex governance arrangements are involved in providing these services. Generation of electricity, for example, is often done by a private industry regulated by state or independent agencies. Cities may not have direct authority over critical infrastructure, thus limiting their ability to implement related hardening policies. However, it is also important to recognize that the lack of hardening policies may reflect a limitation of our approach which relies on data from a search of publicly available websites and sources. Information on hardening strategies may not be readily available due to potential security concerns.
Community resilience captures the needs of residents of the community, the efforts of the city government to address those needs, and the city's collaboration with other entities. Most frequently adopted are policies promoting city data collection to support transparency (83 cities), city participation in the community rating system (76 cities), and programs to train citizens in disaster responses (72 cities). Cities are much less likely to engage disadvantaged residents in resilience efforts (14 cities) or create “resilience hubs” in diverse neighborhoods (16 cities). A relatively small number of cities are pursuing more regional approaches to resilience: 19 cities collaborate with their Council of Government, 24 cities with their Metropolitan Planning Organization, and 38 cities with county government.
It is clear that resilience policies with a social equity component have not been widely adopted by large cities. For example, while 96 cities have a green infrastructure program, only 18 have an explicit policy to prioritize green infrastructure in neighborhoods with greatest need. As noted above, 14 cities engage disadvantaged communities in resilience efforts, and only 19 cities have conducted social vulnerability studies. This finding is consistent with existing critiques of urban resilience (Fainstein 2018; Vale 2014; Ziervogel et al. 2017).
Multivariate Regression
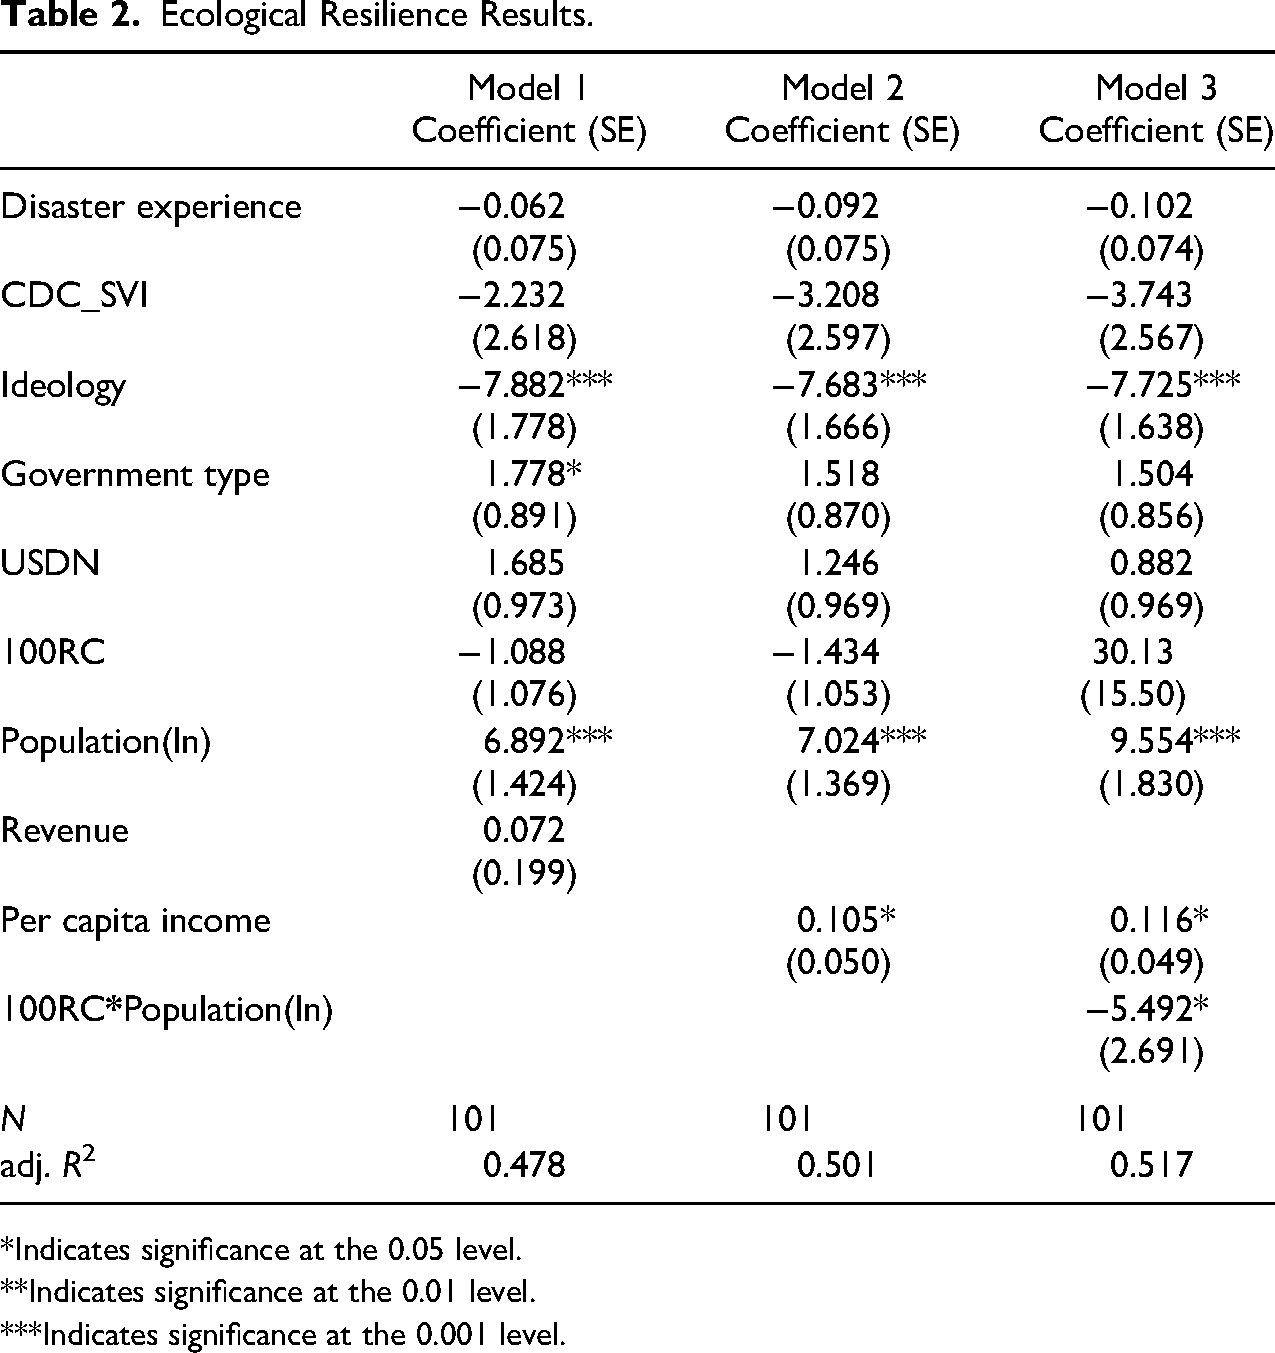
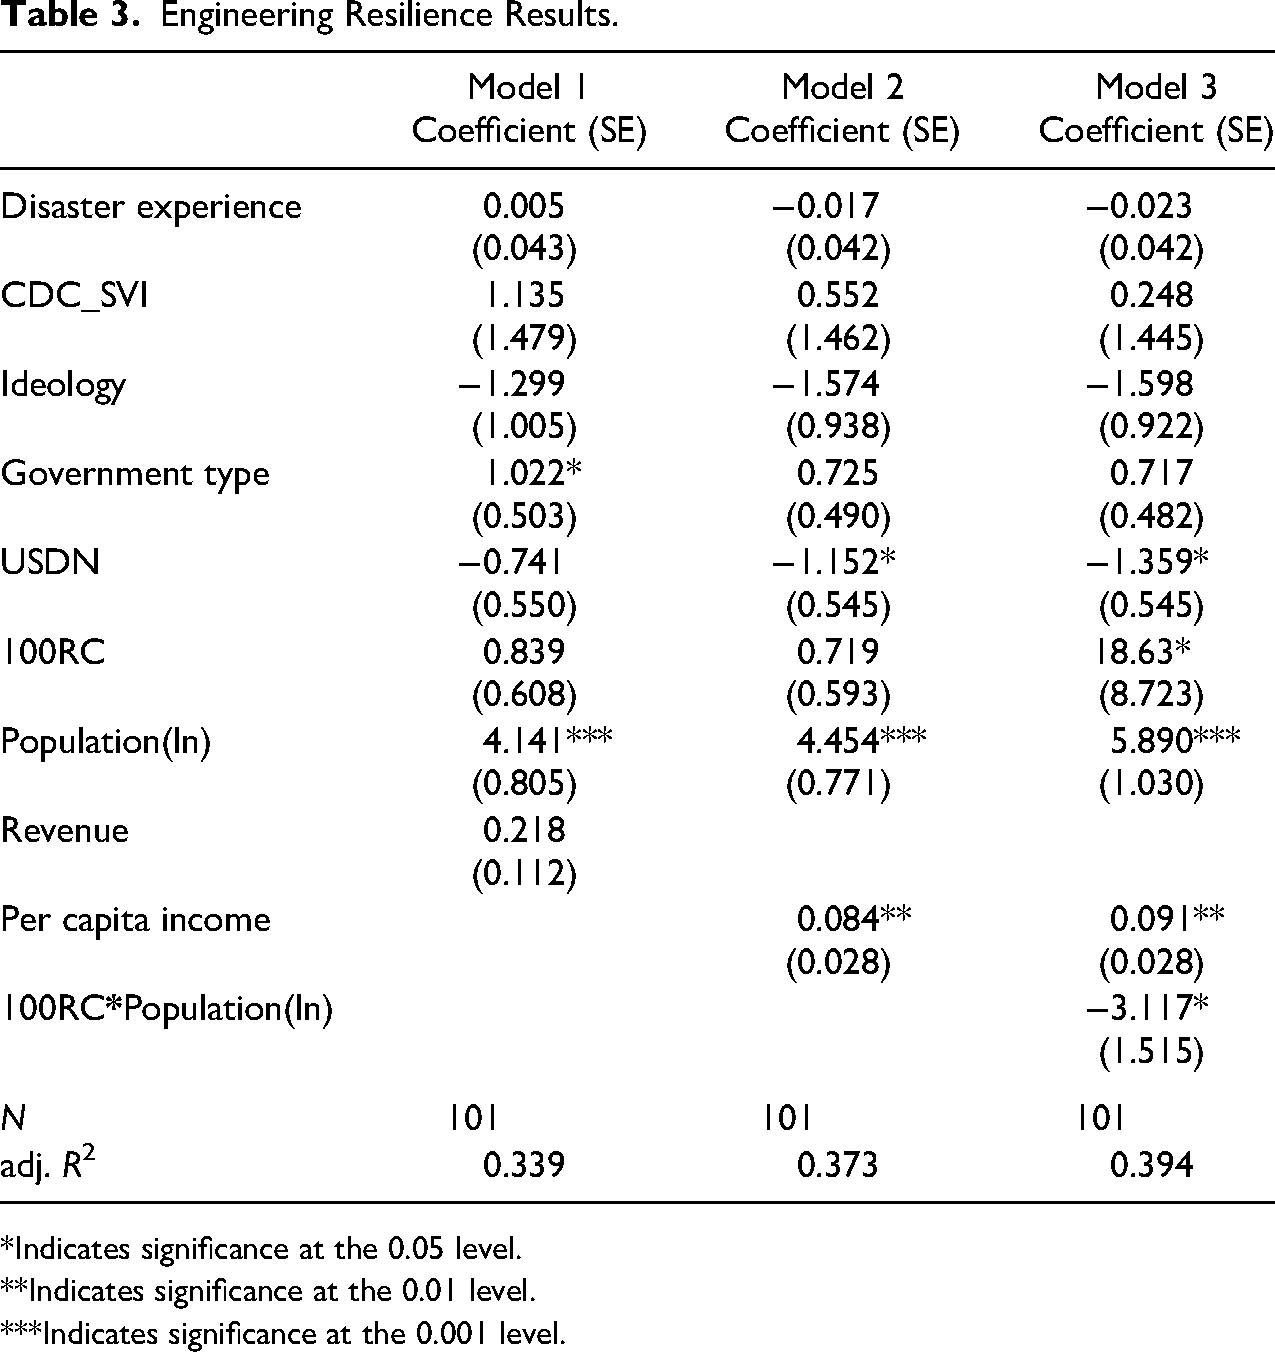
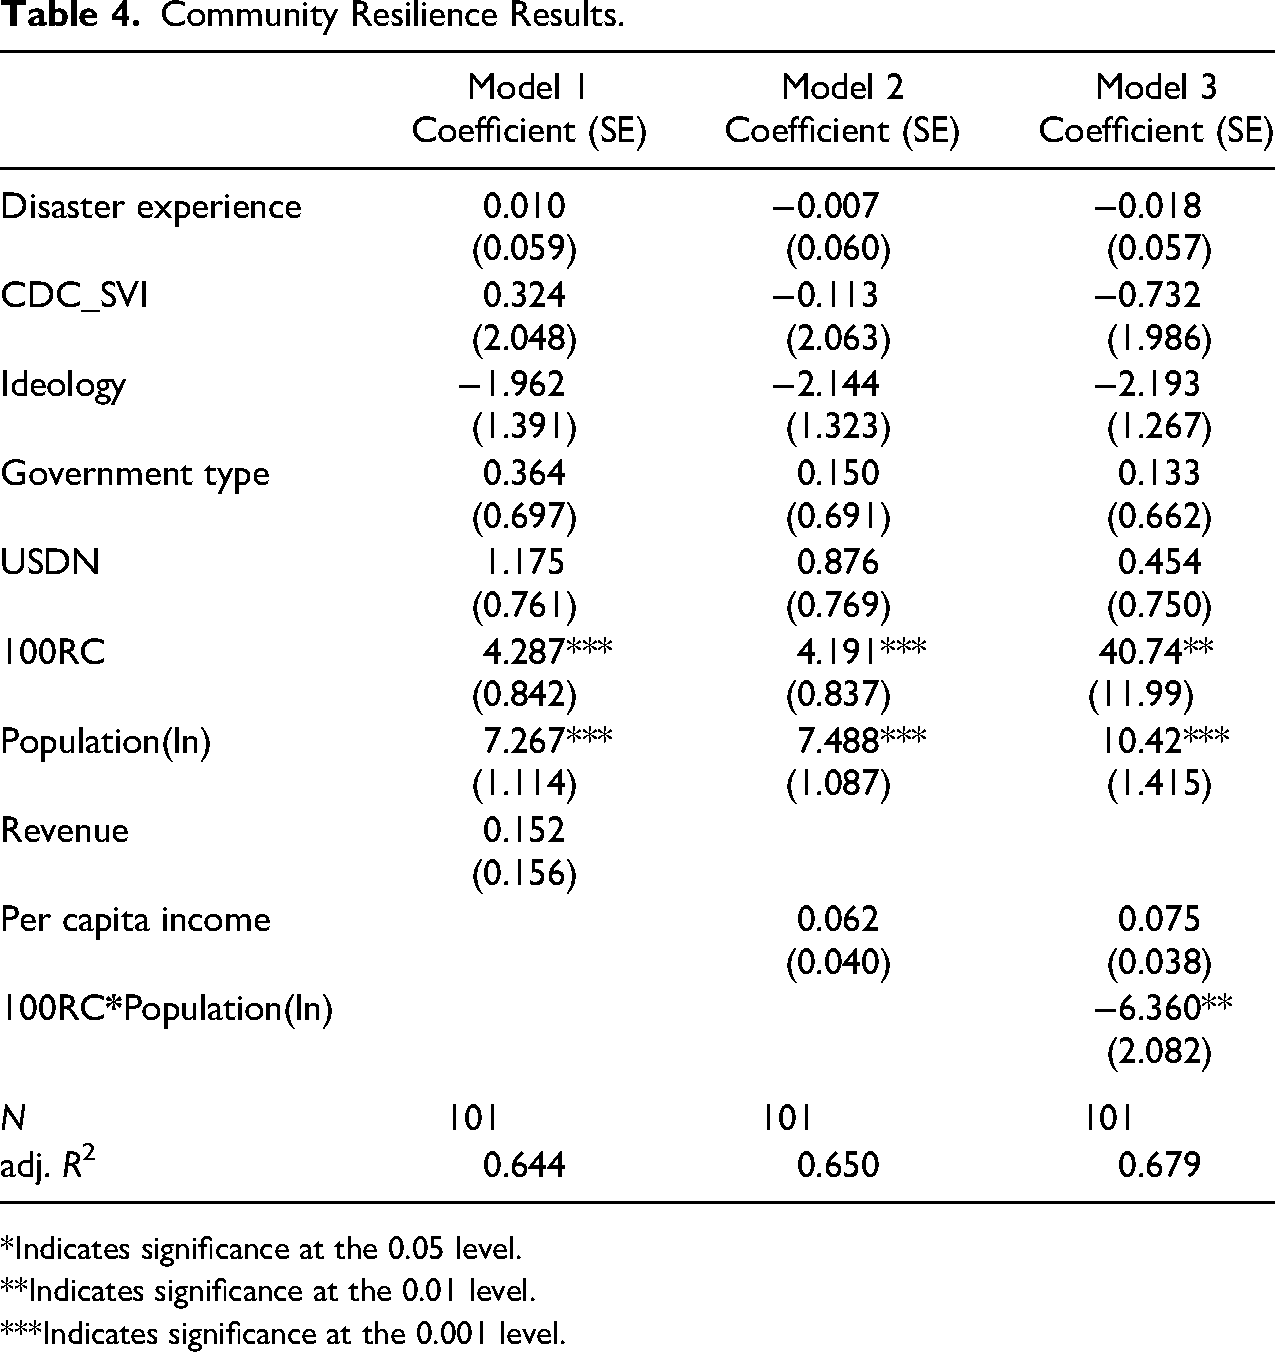
Tables 2, 3, and 4 show the results from the multivariate regression: ecological resilience (Table 2), engineering resilience (Table 3), and community resilience (Table 4). Model 1 and Model 2 in each table focus on eight independent variables; these models describe from 34% to 65% of the variance in our measures of resilience policy adoption. Model 1 includes total city revenue per capita while Model 2 includes per capita income. We separated city revenue and income to reduce multicollinearity and to independently interrogate the influence of city and community capacity. Per capita income measures community capacity; revenue focuses on the resources of city government. Model 3, which retains the per capita income variable, adds an interaction between city membership in 100RC and population. Model 3 describes 52%, 39%, and 68% of the variance for ecological, engineering, and community resilience, respectively. With regard to ecological resilience, ideology, population, and per capita income are consistently significant in the models. Engineering resilience models show that USDN, 100RC membership, population, and per capita income are important factors. Lastly, our community resilience models indicate the importance of 100RC membership and population. In the following discussion of our results, we focus on Model 3 in each of the tables.
Population is a strong predictor of the enactment of resilience policies, with larger cities more likely to adopt resilience policies. This is consistent with the literature that a significant relationship exists between policy adoption and population size of cities (Bausch and Koziol 2020; Conroy and Iqbal 2009; Lee 2013; Lee and Koski 2014; Yeganeh, McCoy, and Schenk 2020). Our models indicate that larger cities adopt more policies related to ecological resilience, engineering resilience, and community resilience. Among our three dependent variables, engineering resilience has the strongest relationship with population size.
Per capita income is positively correlated with ecological resilience and engineering resilience, but it is not significant in the community resilience model. More affluent cities have a greater likelihood of adopting engineering resilience and ecological resilience policies than less affluent places do. However, this is not the case with governmental finances—total city revenue per capita was not found to be significantly related to resilience policy adoption.
As noted earlier, prior empirical studies have found a strong relationship between ideology and environmental concern. Our results also demonstrate that political ideology has a significant impact on adoption of policies related to ecological resilience but not engineering resilience or community resilience. However, the directions of the relationships are consistent throughout engineering resilience and community resilience. Cities that are more liberal tend to adopt more ecological resilience policies than more conservative cities do. Although political ideology has an impact, government form is not found to be important in our models.
The findings related to membership organizations and policy diffusion are mixed. Member cities of 100RC tend to enact more engineering and community resilience policies than nonmember cities, but membership is not a statistically significant factor when it comes to ecological resilience. The relationship is particularly strong for community resilience. Although we find a significant relationship between USDN membership and engineering resilience policy adoption, the results indicate that member cities of USDN are less likely to adopt engineering resilience policies. This unexpected finding suggests that while city networks can play an important role in supporting local policy, networks vary in their influence across policy agendas.
In general, we find that more populous and 100RC cities are more likely to adopt resilience policies. However, our interaction result shows a negative coefficient for all of our models. Although the effect of population on policy adoption is positive, the negative interaction term indicates that the effect of 100RC membership is more important for the smaller cities in our sample. Finally, it is notable that social vulnerability and disaster experience—measures of problem severity and proximity—are not statistically significant in any of the models.
Discussion and Conclusion
Our analyses reveal variable patterns of adoption and implementation of ecological, engineering, and community resilience policies across large U.S. cities. Surveys of practitioners have shown that cities have diverse definitions of resilience, modifying the concept to fit their city's needs and context (Keenan 2018; Meerow and Stults 2016). These varying definitions may be reflected in policy adoption with cities “specializing” in different types of resilience policies. While previous studies have found that the engineering resilience frame was most common among cities (Meerow and Stults 2016), we find that most cities score highest on ecological resilience with policies more closely aligned with sustainability.
Across ecological, engineering, and community resilience, population size is the single city attribute driving policy adoption irrespective of the type of resilience. Beyond population size, the explanation for policy adoption varies somewhat. As noted, ideology is significant only in the ecological model, with more liberal cities adopting more of these policies. This is consistent with previous studies that have found a positive relationship between liberal ideology and environmental protection (Liu, Vedlitz, and Shi 2014). It is notable that ideology is not significant in the engineering resilience and community resilience models, suggesting that these may be frames that could possibly bring both conservatives and liberals to engage in resilience policy. Wealthy cities are more likely to enact ecological and engineering resilience policies, but wealth is not significant in community resilience models. One of the explanations for this pattern may be that affluent cities are more willing to adopt engineering resilience policies that are costly upfront and have a lengthy implementation period (Madni 2018). Also, wealthier communities can better absorb the potentially high cost of adopting ecological resilience policies (Stefanes et al. 2016).
Prior studies led us to expect that disaster experience and social vulnerability would be related to the adoption of resilience policy, particularly community resilience policies. The fact that neither variable had a significant relationship with adoption of any kind of resilience policy may indicate that resilience is viewed as a global policy issue (Hughes, Runfola, and Cormier 2018). As noted, although a city's resilience agenda is locally focused, it seems that capacity is more influential than local needs, at least as defined by disaster experience and social vulnerability. It is also possible that alternative operationalizations of problem severity could yield different findings.
Our results suggest that many of the factors that are associated with sustainability and climate change policy also increase adoption of resilience policy. Just as more populous and wealthy cities are more likely to engage in sustainability and climate change policies, they are more likely to enact resilience policies. There are two potential interpretations of this finding. First, these factors are important to urban innovation. The same cities that led innovation on sustainability and climate change policy may now be playing a leading role in resilience policy.
Alternatively, the similarity in results with previous studies on sustainability and climate change policy may be due to the conceptual overlap of resilience with these policy agendas. Resilience and sustainability are conceptually muddled in the academic literature (Meerow and Newell 2019). In practice, they are also closely linked (Croese, Green, and Morgan 2020; Fastenrath, Coenen, and Davidson 2019). A review of 100RC resilience strategies (Croese, Green, and Morgan 2020) found that many included or were aligned with Sustainable Development Goals as set out in the United Nations’ 2030 Agenda for Sustainable Development. This raises the question of whether resilience represents a new policy agenda (Fastiggi, Meerow, and Miller 2020).
Indeed, our three clusters of resilience policies include some sustainability and climate change policies, especially the ecological cluster. Some scholars have suggested that substantive policy may not be as important to resilience as how policy and programs are implemented. They argue that resilience represents a novel approach to urban governance that emphasizes collaboration, experimentation, and learning (Fastenrath, Coenen, and Davidson 2019; Therrien, Usher, and Matyas 2020). But how policy is implemented—the level of collaboration or experimentation, for instance—is difficult to measure and beyond the scope of this paper. To the extent that the how aspect is captured among our community resilience policies, those data reveal that city collaboration with county governments (38 cities) and with nongovernmental groups (43 cities) is occurring at a relatively nominal level.
Further, our results suggest that to advance resilience policy, cities need human and financial resources. Small, lower-income cities may not have sufficient staff and resources to implement a robust resilience agenda. City networks such as 100RC provide one potential avenue to increase support for resilience policy. Our findings show that membership in 100RC is most advantageous for the smaller cities in our sample. Networks can help small, lower-capacity places access funding, technical support, and other resources. However, larger and richer cities are the most active in city networks (Krause 2011; Lee 2013; Woodruff 2018). Indeed, the four largest U.S. cities are members of 100RC. The tendency of similar cities to participate in the same networks may limit the ability of networks to serve as a tool to advance policy efforts in additional cities (Woodruff 2018).
Previous studies have found networks to increase adoption of sustainability and climate change policy (Curley et al. 2021; Pitt 2010; Rashidi and Patt 2018). Here, we found that although USDN membership is negatively associated with engineering resilience policy, membership in 100RC positively influenced enactment of engineering and community resilience policies. Different results between USDN and 100RC may reflect 100RC's explicit focus on resilience, but it may also reflect differences in the type of network. City networks tend to vary in organizational structure and in the services they provide (Busch 2015; Croese, Green, and Morgan 2020). USDN is essentially open to U.S. and Canadian municipal sustainability directors while 100RC is more exclusive, selecting cities from a pool of applicants focused on resilience and underlying vulnerabilities. This may result in a selection bias issue where 100RC membership represents cities that have expressed interest and willingness to take action. The 100RC is structured in a way that may be more effective in encouraging policy adoption in that it provided funding, technical support, and peer-to-peer learning opportunities. It also required participating cities to develop resilience strategies. The combination of funding, technical support, and required products may lead to better long-term outcomes by encouraging cities to institutionalize resilience (Kernaghan and da Silva 2014).
Some limitations are present in this study. Although ecological, engineering, and community foci are important, other city policies can contribute to the creation of resilient places. Subsequent research could explore the relationship between community characteristics and the enactment of specific resilient-related policies in land use, transportation, public health, and economics. This avenue of research could illuminate the diversity in city resilience efforts and identify the factors underlying different approaches. While we focused on characteristics easily measured with secondary variables, the literature on resilience governance suggests that policy adoption may also be influenced by a number of local variables we did not include such as the presence of policy champions and the availability of funding (Fastiggi, Meerow, and Miller 2020; Keenan 2018; Kernaghan and da Silva 2014). Additionally, including not only tangible inputs but also intangible inputs that affect a city's capacity level could be tested (Loh 2015). Future studies may consider the relationship between these localized characteristics and adoption of resilience policies. Expanding the inquiry to include smaller cities and other jurisdictions such as county governments would provide a more comprehensive view of activity at the local level. We focus on large cities which we expect are more likely to have resilience policies but this also likely influences our results.
To date, the literature on urban resilience has primarily been theoretical with few empirical studies. The empirical studies that do exist are case studies or more qualitative in their approaches. As more cities embrace resilience, the need for large-n studies to describe patterns of policy adoption and provide a foundation for new resilience theory is paramount. Our findings create a baseline for additional research as cities seek to become more resilient in the face of myriad social and environmental challenges.
Supplemental Material
sj-docx-1-uar-10.1177_10780874221150793 - Supplemental material for Ecological, Engineering and Community Resilience Policy Adoption in Large US Cities
Supplemental material, sj-docx-1-uar-10.1177_10780874221150793 for Ecological, Engineering and Community Resilience Policy Adoption in Large US Cities by Ki Eun Kang, Ann O’M Bowman, Bryce Hannibal, Sierra Woodruff and Kent Portney (deceased) in Urban Affairs Review
Footnotes
Acknowledgements
This project was funded by Texas A&M University President's Excellence Fund. The authors would also like to thank the many students that assisted with data collection.
Disclosure Statement
Any opinions and conclusions expressed herein are those of the authors and do not necessarily reflect the views of the U.S. Census Bureau or Department of State. This work was mostly or entirely completed while Dr. Bryce Hannibal and Dr. Sierra Woodruff were at Texas A&M University.
Declaration of Conflicting Interests
The author(s) declared no potential conflicts of interest with respect to the research, authorship, and/or publication of this article.
Funding
The author(s) disclosed receipt of the following financial support for the research, authorship, and/or publication of this article: The Texas A&M University (grant number T3).
Supplemental Material
Supplemental material for this article is available online.
Notes
Author Biographies
References
Supplementary Material
Please find the following supplemental material available below.
For Open Access articles published under a Creative Commons License, all supplemental material carries the same license as the article it is associated with.
For non-Open Access articles published, all supplemental material carries a non-exclusive license, and permission requests for re-use of supplemental material or any part of supplemental material shall be sent directly to the copyright owner as specified in the copyright notice associated with the article.