
Abstract
This paper descriptively documents the early childhood care and education (ECE) landscape in neighborhoods that experienced socioeconomic (SES) ascent and descent in the Chicago Metropolitan Area (MSA) between 2009 and 2019. Using data from the Illinois Early Childhood Asset Map and the American Community Survey, we analyze changes in ECE seats across provider types. SES ascent was most prevalent in Cook County, where zip code tabulation areas (ZCTAs) that ascended had a greater increase in ECE seats than the rest of the MSA. We do not find statistically significant differences in ECE availability between descending and stable ZCTAs, regardless of their location within the MSA. We also find little evidence that SES neighborhood change is associated with changes in the supply of Head Start or ECE capacity measured as the number of children per seat. Our study contributes to urban and educational research by highlighting how neighborhood SES change intersects with ECE access.
Keywords
Introduction
Neighborhood socioeconomic ascent—a process that includes gentrification and other forms of neighborhood upgrading—has reshaped urban areas across the United States (U.S.) over recent decades, as affluent and middle-class families (often White) move to low-income and often racially and ethnically segregated neighborhoods (Owens and Candipan 2019). While a growing literature has examined the relationship between neighborhood socioeconomic (SES) change—both ascent and descent—and the educational experience (Barton and Cohen 2019; Bischoff and Tach 2020; Candipan 2020; Pearman 2019; Candipan and Brazil 2022), most of this work focuses on the K–8 grade span. Little existing research has analyzed the potential impact of neighborhood change on the early childhood care and education (ECE) landscape, despite its critical role in child development and school readiness, in particular for low-income children, and its potential to mitigate socioeconomic inequalities (McCoy et al. 2017). The relatively sparse work in this area leaves a critical gap in our understanding of how foundational resources for children and families are shaped by urban transformation, providing an opportunity to uncover how broader patterns of urban inequality are reproduced (or potentially mitigated) through access to early educational resources.
In this paper, we explore the relationship between neighborhood SES change and access to ECE, considering the variety of providers (e.g., center- and home-based) that make up the ECE landscape in the U.S. We focus on neighborhood SES ascent, examining its association with early childhood education (ECE), while also considering how SES descent corresponds with access to ECE services. Using ECE data from the Illinois Early Childhood Asset Map (IECAM) and zip-code level sociodemographic characteristics from the American Community Survey (ACS), we examine changes in the number of ECE seats in neighborhoods that experienced SES ascent and descent between 2009 and 2019 in the Chicago Metropolitan Statistical Area (MSA). We further examine the relationship between neighborhood SES ascent and descent and changes in access to Head Start, which provides high-quality ECE for children in poverty. Our study thus sheds light on how neighborhood change may shape access to a key component of the early childhood safety net.
We find that neighborhood SES ascent is associated with more licensed ECE seats, especially center-based seats for infant and toddlers, and more license-exempt seats for 3–5-year-olds but only in the urban core of the MSA. This pattern of results aligns with a distribution of parental preferences in which high SES parents prefer formal care options. These findings are exacerbated in ascending neighborhoods that experience increases in the share of White residents, underscoring the racial dynamics of neighborhood change. Despite observing modest to large changes in the number of ECE seats in ascending neighborhoods, we do not find that these translate into greater capacity. Neighborhood SES ascent is not associated with changes in Head Start seats. Altogether, our descriptive study contributes to the literature on neighborhood SES change and education by extending its focus to the ECE sector. While existing studies mostly examine neighborhood change in relation to K–8 or K–12 grade spans, much less attention has been paid to ECE, even though it represents a key component of the U.S. educational experience for children and parents.
Our paper further adds to the broader literature in urban studies, which has examined the impact of neighborhood SES change on neighborhood amenities, but largely focuses on housing, public amenities such as greenspace, and commercial establishments, overlooking shifts in ECE as a key neighborhood amenity (Delmelle and Nilsson 2020; Glaeser, Kim and Luca 2018; Guerrieri, Hartley and Hurst 2013; Kosta 2019; Pearsall and Eller 2020). Finally, our study contributes to the neighborhood effects literature by highlighting one pathway through which neighborhoods may impact young children during a critical developmental period in the life course that is understudied in this literature (Leventhal 2018). Thus, understanding the relationship between ECE and neighborhood change is important because ECE plays a critical role in supporting working parents, promoting child development and school readiness, and reproducing existing inequalities (Bassok and Galdo 2016). Our study therefore contributes key insights that lay the foundation on which future research on this topic can build.
Early Childhood Care and Education in the United State
The ECE landscape in the U.S. consists of a patchwork of public and private options that working parents use to varying degrees. This structure reflects conflicting views around the role of private versus public actors in the care and education of children, as well as changes in family dynamics and the role of women as primary caregivers (Kamerman and Gatenio-Gabel 2007; Cohen 1996). The broadest definition of ECE involves all types of care, including care provided at home by relatives or caregivers, paid or unpaid (Bassok, Fitzpatrick and Loeb 2011; Kamerman and Gatenio-Gabel 2007). Within more institutionalized settings, care can be center-, home-, or school-based. The availability of these options depends on the age of the child, and, usually, formal settings must meet state licensing requirements. In general, school-based ECE is only available for 4- and 5-year-olds in preschool and kindergarten. The availability of school-based options for 4-year-olds is related to the expansion of state-funded preschool and universal pre-K programs (UPK), which often rely on mixed delivery systems that include schools plus a variety of other settings (Friedman-Krauss et al. 2024; McCormick et al. 2022; Weiland et al. 2022; Woodyard, Sass and Fazlul 2023). The mixed-delivery structure of early childhood education in the United States reflects deeper political and normative tensions around public responsibility, privatization, and equity—tensions that shape differences in access to care. However, the existence of UPK does not mean that most four-year-olds are enrolled in a program given issues with access and family preferences regarding care (Friedman-Krauss et al. 2024; Stanford 2023; Weiland et al. 2022).
Options for 3-year-olds are less common within school settings but are available in some states and localities that have expanded the reach of their pre-K programs to younger children (Braga et al. 2024). Apart from school-based options, 3- to 5-year-olds can attend ECE in center- or home-based settings. Center-based care may be for-profit, non-profit, and publicly funded (e.g., Head Start, UPK, or other state programs) (Stockstill 2023). This variation underscores the central role of the private sector in ECE provision in the U.S., particularly for the youngest children. Indeed, formal care options for infants and toddlers are almost entirely limited to private providers or publicly funded programs such as Early Head Start, which serves children up to age 3 (compared to Head Start, which serves children ages 3 to 5). Costs vary by provider type and may also vary by family income, depending on the state; for example, Head Start is free for eligible families (Office of Head Start 2024; Stockstill 2023).
Head Start and Early Head Start are federally funded programs designed to serve children from low-income families by providing access to high-quality early childhood education and related services. Eligibility is based on family income thresholds (i.e., below the federal poverty guidelines), receipt of federal assistance (i.e., Temporary Assistance for Needy Families (TANF) or Supplemental Security Income (SSI) programs), or experiences such as homelessness, with children in foster care automatically qualifying. In addition to early childhood education, Head Start programs offer a comprehensive suite of services aimed at supporting the overall well-being of children and their caregivers. Although federally funded, programs are operated by community-based organizations or other non-profit providers (Office of Head Start 2024), allowing adaptation to community needs within performance standards, which contributes to variation in services across geographic areas (Friedman-Krauss, Barnett and Duer 2022).
Research on Head Start and other ECE programs has generally highlighted the benefits of early education on children's school readiness and cognitive outcomes, particularly in the short- and medium-term, and especially for children from disadvantaged backgrounds (Bai et al. 2020; Dodge et al. 2017; McCoy et al. 2017). Much of the evidence comes from programs serving 4- and 5-year-olds (Gormley and Gayer 2005; Gormley et al. 2018; Woodyard, Sass and Fazlul 2023). Evidence for infants and toddlers is more limited, though existing studies suggest positive outcomes of attending preschool for 3-year-olds (Ansari et al. 2019; Braga et al. 2024; Ruzek et al. 2014). Studies on Early Head Start show similar evidence (Vogel et al. 2013). Findings on longer-term outcomes are more mixed but generally indicate persistent benefits of attending high-quality ECE programs (Bai et al. 2020; Bartik, Gormley and Adelstein 2012; Bauer and Schanzenbach 2016; McCoy et al. 2015).
Access to ECE Services and Quality Across Neighborhood SES
Past studies show that there is unequal access by neighborhood SES in the types and quality of ECE services. Higher-SES neighborhoods have more availability of preschool and childcare options (Bassok, Fitzpatrick and Loeb 2011; Bassok and Galdo 2016). Additionally, more socioeconomically advantaged neighborhoods have been linked to higher quality ECE services across several dimensions, including the type of care (formal vs. informal), the education and training of caregivers, and process measures of quality (i.e., those related to teacher–child interactions in the classroom), which are particularly important for child development (Bassok and Galdo 2016; Burchinal et al. 2008; McCoy et al. 2015). Even among Head Start programs, location in a less economically disadvantaged neighborhood correlates with higher classroom quality (McCoy et al. 2015).
Interestingly, while some studies found less availability of center-based ECE options in lower-SES neighborhoods (Burchinal et al. 2008; Hatfield et al. 2015; Shuey and Leventhal 2018), other research shows a U-shaped relationship in both access to ECE and certain quality measures with greater availability of childcare and preschool options in the highest- and lowest-SES neighborhoods (Bassok, Fitzpatrick and Loeb 2011; Bassok and Galdo 2016; Dowsett et al. 2008) and a similar pattern for teaching quality measured based on provider education and training (Dowsett et al. 2008). This pattern likely reflects the targeted provision of high-quality ECE programs, such as Head Start, in disadvantaged areas (Bassok, Fitzpatrick and Loeb 2011; McCoy et al. 2015; Shuey and Leventhal 2018). Although Head Start programs were historically concentrated in high-poverty areas, more recent evidence suggests a broader distribution across neighborhood types (McCoy et al. 2015).
Differential access to specific types of ECE services and providers among higher- and lower-SES areas may also reflect parental preferences and needs for childcare. Research shows that parents with higher income and more education are more likely to use childcare outside the home (Chaudry et al. 2011; Kulic et al. 2017) and are more likely to rely on formal ECE options and center-based childcare, in particular (Kulic et al. 2017), which are typically considered of higher quality (McCormick et al. 2022; Weiland et al. 2022). This may reflect the preferences of higher-SES parents, but may also correspond with their ability to pay for these options (Chaudry et al. 2011; Pilarz, Sandstrom and Henly 2022). In contrast, lower-SES parents are more likely to use informal care, relying instead on relatives or other home-based providers (Chaudry et al. 2011; Kulic et al. 2017).
Beyond cost, SES differences in ECE utilization may correspond with the varying needs of parents. Center-based care is rarely offered during non-traditional hours or weekends (Chaudry et al. 2011), which many low-income parents need (Carrillo et al. 2017; Harknett, Schneider and Luhr 2022), but informal care arrangements and some home-based settings may facilitate having childcare during non-traditional times (Han 2004; Harknett, Schneider and Luhr 2022). That said, the childcare arrangements of most working parents are complex and often include both formal and informal options that may benefit from access to different alternatives regardless of income.
These collective factors may further lead to variations in the ECE landscape along racial/ethnic lines. Past research has shown that children of color are more likely to attend subsidized programs (Hollett and Frankenberg 2022), and Head Start also tends to serve large shares of Black and Hispanic children (Stockstill 2023). Prior work has documented high levels of racial segregation across ECE classrooms, including center-based classrooms (Awkward-Rich 2024; Stockstill 2023; Edara, Hollett and Frankenberg 2025). Additionally, parental preferences in ECE settings also differ by ethnicity (Awkward-Rich 2024). These differences may be attributable to multiple factors, including occupational, racial, and ethnic segregation (Laurito, Wildsmith and Guzman 2024; Tesfai and Thomas 2020) that shape parental preferences and needs for specific ECE settings, in particular for parents working non-traditional hours or who have less flexibility.
The ECE Landscape in Socioeconomically Ascending Neighborhoods
Neighborhoods are not static environments, but rather they evolve over time as socio-demographic and cultural shifts reshape urban landscapes (Hwang 2016; Sampson, Morenoff and Gannon-Rowley 2002). A growing body of research has explored how these neighborhood changes, including processes such as socioeconomic ascent and descent, influence access to resources and reshape community dynamics (Candipan and Brazil 2022; Hyra et al. 2019; Pearman 2020; Schnake-Mahl et al. 2020). Although neighborhood SES ascent encompasses a wide range of processes, much of this research has focused on gentrification, a process characterized by the influx of middle- and upper-income residents into historically low-income neighborhoods, as one prominent type of neighborhood change. Gentrification has been linked to the displacement of long-term residents, either physically through rising housing costs and evictions or culturally via changes to the social fabric and character of neighborhoods (Freeman 2006). These transformations often affect community resources, including educational institutions, as population changes shift the demand for services (Candipan and Brazil 2022; Pearman 2020).
Recent studies examining links between neighborhood SES change and education has typically focused on K–12 schools or grades (Candipan 2019; Candipan 2020; Candipan and Brazil 2020; Freidus 2019; Pearman 2019). Despite the documented evidence that access to ECE varies by neighborhood SES (Bassok and Galdo 2016; Burchinal et al. 2008; Hatfield et al. 2015), this literature has largely ignored the relationship between neighborhood SES change and changing access to ECE.
Various reasons potentially explain why neighborhood SES ascent may affect access to ECE though the nature of these changes is ambiguous (supplemental Table A1). Prior studies show that higher-SES parents are more likely to use care outside of the home (Chaudry et al. 2011) and rely on formal care arrangements in center- or school-based settings (Kulic et al. 2017). In this case, incoming higher-SES parents may attract new licensed ECE options to the neighborhood for infants and toddlers, as well as more center-based options for 4- and 5-year-olds if they prefer private ECE providers to public pre-K programs. Some urban scholars argue that reforms to educational amenities are tied to broader city-led revitalization renewal efforts targeting marginalized neighborhoods, which often have a large presence of minority residents (Cucchiara 2013). In this case, city officials view high-quality educational amenities as important neighborhood resources that not only contribute to the overall well-being of lower-income residents but also attract higher-income (often White) residents to increase the community income base, which will then lead to private investment in the improvement of other neighborhood institutions and amenities (Zuk et al. 2018).
Additionally, evidence from elementary schools in gentrifying neighborhoods has shown that higher-SES parents (particularly White) bypass the local school when there are other options (Bischoff and Tach 2020; Candipan 2020; Pearman and Swain 2017), which, for the ECE sector, may entail new center-based options for preschool-aged children. That said, given that school-based ECE settings are considered higher quality (McCormick et al. 2022), higher-SES parents in some neighborhoods may prefer these settings for their preschoolers. If this is the case, the supply of center-based ECE may remain unchanged for preschool children. This assumes that those parents can secure seats in public school-based preschool programs, which may not be the case if these are oversubscribed.
In parallel, to the extent that neighborhood SES ascent leads to displacement and lower residential stability of longtime residents (Freeman et al. 2024; Zuk et al. 2018), it may disrupt the social networks that low-income parents use to establish informal care arrangements within the neighborhood (Burchinal et al. 2008; Shuey and Leventhal 2018). Thus, lower-SES parents in ascending neighborhoods may need to find alternative childcare as those within their social support networks leave the neighborhood. If these parents prefer home-based providers (Chaudry et al. 2011), this may result in an increase in this type of provider or in license-exempt home providers in neighborhoods experiencing SES ascent to meet the needs of these parents. For non-White parents, they may seek options that provide identity-affirming frameworks for their children, which would be met by a variety of private providers. These dynamics assume that parents opt for childcare within their neighborhood, as some studies suggest (Connors et al. 2021; Crosnoe et al. 2016). If both higher-SES and lower-SES parents opt for care outside the residential neighborhood, the landscape of ECE services in ascending neighborhoods may remain unchanged.
These changes may be patterned across racialized lines as neighborhoods undergoing SES ascent often experience an influx of White households accompanied by the displacement of minority residents, resulting in racial and ethnic disparities in how gentrification affects residents who remain (Hwang and Sampson 2014). The historical legacy of neighborhood disinvestment by race helps explain the highly correlated dimensions of income and racial segregation, and their contribution to processes of neighborhood change (Rucks-Ahidiana 2021; 2022). That is, neighborhood ascent is often not contingent on class change alone but is an inherently racialized process that relies on the deprivation of racialized non-White neighborhoods (Dantzler 2021). The long history of disinvestment in Black neighborhoods suggests that neighborhood ascent in these areas may take a different form than in White neighborhoods, leading to distinct changes in their access to ECE resources. Thus, the intersection of race and class in ascending neighborhoods may result in an ECE resource configuration that largely benefits the preferences and needs of high SES and often White parents, potentially resulting in a reconfiguration of ECE services where what is available, what is needed, and what is affordable does not reflect the demand of low SES parents of color.
Neighborhood SES ascent may affect the availability of Head Start differently than private providers. This is because Head Start is a federally funded program targeted at low-income children and families. Neighborhoods experiencing SES ascent may see a decline in Head Start demand, potentially resulting in fewer providers and seats for this program.
Neighborhood Descent and ECE
In terms of other types of neighborhood SES change, given the U-shaped relationship between neighborhood SES and the supply and quality of ECE (Bassok, Fitzpatrick and Loeb 2011; Dowsett et al. 2008), neighborhood SES descent may also correlate with changes in the landscape of ECE resources, including attracting Head Start providers or other providers that may be preferred by lower-SES parents (e.g., home based or home-based licensed exempt). However, considering other work finds less availability of ECE in lower-SES neighborhoods (Hatfield et al. 2015), we may observe no change or even a decline in ECE resources after neighborhood SES descent.
Finally, it is important to frame these changes within structural and institutional constraints that may limit how rapidly different types of providers may respond to changes in demand for ECE services. License-exempt providers may experience more rapid change because they may face fewer regulatory barriers to offering services than licensed providers. In contrast, Head Start providers may be slower to change. Once Head Start grants are awarded, they last for five years, and the competitive process to award new grants may also take longer relative to the licensing process for center- or home-based options.
Study Context: Chicago Metropolitan Area
Our study setting, the Chicago Metropolitan Area, provides an appropriate context to examine the link between neighborhood SES ascent and ECE resources, given recent urban transformation processes in Chicago and its surrounding areas (Greenlee 2019). Further, the Chicago MSA, like the rest of Illinois, includes various types of ECE providers, allowing us to examine changes across a variety of ECE settings. 1
License-exempt providers in Illinois include home-based care for three or fewer children from a single household or for relatives, and childcare centers recognized by the Illinois State Board of Education, such as those in commercial centers or churches providing temporary care while children's regular caregivers are engaged in other activities nearby (IECAM 2024). ECE providers in Illinois can serve children from six weeks of age to 13 years old, though school-age providers typically focus on before- or after-school care. In this paper, we focus on providers serving children up to 5 years old.
Illinois also operates the Preschool for All (PFA) program for 3-,4-, and 5-year-olds who are yet ineligible for kindergarten. This program began in 2006 and was later expanded starting in 2017 (Friedman-Krauss et al. 2024). While PFA operates across the state, it is not a truly universal program as priority is given to children meeting at least two risk factors—for example, low income, history of neglect, low parent education, among others (Friedman-Krauss et al. 2024). Starting in 2019, Chicago also expanded access to preschool with their own PFA program. In Chicago, the focus was on expanding school-based pre-K seats for 4-year-olds as school-based capacity was deemed underutilized. While the program prioritized expansion in the most socioeconomically disadvantaged areas of Chicago, the number of school-based preschool seats grew in neighborhoods across the SES spectrum (Gonzalez, Sabol and Schanzenbach 2024).
These changes should be placed within the specific economic and racial geographies of Chicago neighborhoods. Chicago is a highly segregated city by race and ethnicity, with much of these dynamics being replicated across the MSA (Sandoval 2011; Sampson 2013). Thus, while SES ascent has been linked with racial and ethnic changes across some Chicago neighborhoods, the racial hierarchy of neighborhoods remains persistent, with neighborhoods that have large shares of Black and Hispanic residents less likely to experience SES ascent compared to White neighborhoods (Timberlake and Johns-Wolfe 2017; Hwang and Sampson 2014).
Data and Measures
This study combines several administrative data sources. We use publicly available zip code tabulation area (ZCTA) level data from the Illinois Early Childhood Asset Map (IECAM) from fiscal year 2009–2010 and 2018–2019, normalized to 2010 ZCTA boundaries. ZCTAs are generalized representations of ZIP Codes, are the smallest geography for which the data are available, and are commonly used in past research to examine ECE and neighborhood SES (Bassok and Galdo 2016; Hatfield et al. 2015), as well as gentrification and neighborhood change more generally (Lee and Reina 2024). The IECAM data include provider and authorized seat counts by provider type for a given fiscal year (July 1st of one year to June 30th of the following year).
To capture neighborhood characteristics, we match IECAM data with zip code-level sociodemographic information from the 2007–2011 and 2017–2021 American Community Survey (ACS). We use the information from the ACS to identify neighborhoods that have experienced socioeconomic (SES) ascent, descent, or stability between 2009 and 2019 and to obtain other relevant demographic characteristics of the neighborhood. Because the ECE data span fiscal years starting in July 2009, we aim to capture both changes in ECE availability and neighborhood SES from 2009 to 2019. Note that we end our study in 2019 to avoid confounding induced by the effect of the pandemic on the ECE sector (Ali, Herbst and Makridis 2021; Lee and Parolin 2021). Throughout the paper, we refer to our study period as 2009 and 2019. We supplement the IECAM data with information on the number of schools offering pre-K and kindergarten programs in each ZCTA from academic years 2009–2010 and 2018–2019 to account for the supply of school-based providers of ECE, drawn from the National Center for Education Statistics (NCES).
We restrict the IECAM data to ZCTAs within the Chicago MSA. The Chicago MSA includes the city of Chicago, which is the largest city in the state and the third largest in the nation. Chicago is part of Cook County, which is the most populous county in Illinois with more than five million residents (Illinois Department of Public Health 2020). The rest of the Chicago MSA includes areas farther away from Chicago, including such counties as DuPage, Lake, Will, and Kane, among others.
There are 340 ZCTAs whose borders intersect with the Chicago MSA. Of these, 58 are in the city of Chicago, 116 are in the immediately surrounding areas of Cook County, and the remaining ZCTAS (166) are located farther away from Chicago and outside of Cook County. Due to missing data in some of the sociodemographic indicators we use to construct our measure of SES change, our final sample includes 332 ZCTAs in the Chicago MSA, with 172 of those located in Cook County, including the 58 Chicago ZCTAs.
Independent Variable: SES Change
Our key independent variable captures neighborhood SES change. We create a three-category variable that identifies ZCTAs as having experienced SES ascent, descent, or stability from 2009 to 2019. To identify these neighborhoods, we calculate ZCTA-level SES scores using factor analysis with principal components extraction based on five indicators of housing and economic health: median household income, median rent, median home value, proportion of the population in professional occupations, and proportion of the population with a college degree. A similar approach has been used in prior work (Candipan and Bader 2022; Owens and Candipan 2019; Van Criekingen and Decroly 2003). Socioeconomic ascent is analytically distinct from, but often intertwined with, neighborhood racial dynamics. Following past work on neighborhood ascent and racial stratification (Owens and Candipan 2019; Rucks-Ahidiana 2021; Abdi et al. 2025), we intentionally exclude racial composition from our measure of ascent to maintain a conceptual distinction between socioeconomic change and racial transition. Including race in the calculation of the ascent index would conflate these processes, limiting our ability to examine how neighborhood SES ascent relates to racial dynamics.
Because ACS data are not provided at the ZCTA level, we use population-weighted geographic reapportionment to fit these measures into ZCTA boundaries. The five measures load onto a single factor in each year; the factor scores then become each ZCTA's SES score. We calculate the relative rank in SES score of all ZCTAs in the Chicago MSA in both years, then calculate their percentile rank change between 2009 and 2019. 2 Using this information, we classify a ZCTA in the MSA as having ascended (descended) if their percentile rank change increased (decreased) by at least five points, and to have remained stable if their percentile rank did not change or changed by less than five points. While prior work at the census tract-level has used higher thresholds (e.g., 10 points) (Ellen and O’Regan 2011; Owens and Candipan 2019), we believe a higher threshold would not be appropriate given the larger sizes of ZCTAs.
Dependent Variables: ECE Seats
For our outcomes of interest, we examine changes in the number of authorized seats (overall and by provider type) for the following: licensed center-based, licensed home-based, license-exempt, and preschool Head Start (serving children aged 3 to 5). 3 Recall that licensed providers can care for more than three children in a facility other than a home or for up to eight children (12 with an aide) in a private home. License-exempt home-based providers provide care for up to three children or children who belong to the same family. This type of ECE provider includes care given by relatives, friends, or neighbors. The care may happen in the child's home or the caregiver's home (IECAM 2024). We include seats for children starting at six weeks up to age 5. In addition, we also calculate the total number of seats as the sum of center-based, home-based, and licensed-exempt seats. To understand variation by age, we also obtained the number of seats for infants (0 to 1 years of age), toddlers (2 years of age), and preschool-aged children (3 to 5 years of age) across ECE settings. These variables are available in the IECAM.
Apart from the raw number of authorized seats, we construct ECE capacity measures by calculating the number of children under 5 years of age per authorized seat within a ZCTA. This measure helps us understand whether any observed changes in the number of seats reflect parallel changes in capacity. We create this measure for the number of children per total ECE seats (licensed center-based, licensed home-based, and license exempt) and the total number of children per licensed seats as the sum of center-based and home-based seats. We examine licensed settings separately using licensing as a proxy of ECE quality (Bassok and Galdo 2016). Calculating the number of children per authorized seat allows us to identify areas that are underserved by ECE resources. Following past work, we consider an area to be underserved by ECE resources if the number of children per authorized seat is greater than three (Malik, Hamm and Schochet 2018), so that there is triple the number of children per authorized seat. We consider ZCTA to be severely underserved if the number of children per authorized seat exceeds six. Note that, in calculating whether an area is underserved by ECE resources, we do not count Head Start providers given their targeted nature. We also do not count pre-K programs that are offered in schools. Thus, it is possible that an area is underserved by non-Head Start and non-school ECE resources but still provides other options for families, including for families with low incomes.
Control Variables
We include information on several ZCTA-level sociodemographic factors as control variables in our analyses. Specifically, we account for the share of White residents within a ZCTA, 4 the number of children under 5 years of age living in that ZCTA, population density, the number of pre-K and kindergarten programs, and the number of Illinois PFA sites. We measure these variables at baseline, as well as calculate the change in these factors between 2009 and 2019. We focus on these variables in our analyses because they correlate both with SES change as well as with the availability of ECE services in an area (Bassok, Fitzpatrick and Loeb 2011; Brown 2018; Burchinal et al. 2008; McCormick et al. 2023).
Methods
Our analysis is descriptive in aim. To contextualize neighborhood SES change and the ECE landscape, we begin by characterizing and mapping ZCTAs in the Chicago MSA that have experienced various types of socioeconomic change: ascent, descent, or stability. We document the number and percentage of ZCTAs experiencing socioeconomic change (stability) and note differences between ZCTAs located in Cook County, which we consider as the urban core of the MSA because it contains the city of Chicago and its surrounding environments (Crouch et al. 2020; Meyer and Esposito 2015), and ZCTAs located in areas outside of Cook County. Because nearly all ZCTAS in Chicago experienced SES ascent or stability, we are unable to perform separate analyses for this city due to little variation in the SES change measure. We then identify and map ZCTAS across the MSA that are underserved by ECE resources based on the number of children per seat. We examine the distribution in 2009 and also in 2019.
Next, we investigate the change in the number of seats, identifying how this change differs between ZCTAs that experienced SES ascent or descent and those that remained stable. To do so, we perform an ordinary least squares regression analysis estimating the following specification:

In this model, we regress the change in outcomes between 2009 and 2019 on a set of two indicator variables capturing the change in SES for a given ZCTA focusing on whether it experienced SES ascent or descent between the two time periods. The coefficients of interest are
The model also includes a vector X’ of baseline demographic controls described in the prior section to account for differences between the ZCTAs at the start of the sample period that could correlate with SES change and with the supply of ECE resources. We prefer the use of baseline controls because the change in these control variables is likely influenced by our SES variables, which would make change variables inappropriate controls in this context.
To explore whether the relationship between neighborhood SES change and the supply of ECE providers and seats varies by whether ZCTAs are in the urban core of the MSA, we estimate the same regression as in equation (1) but add an interaction between the SES variables and an indicator denoting whether the ZCTA is in Cook County. We also interact all baseline controls with the Cook County indicator, essentially estimating equation (1) as a fully interacted model. Estimating a fully interacted model is more appropriate because we cannot assume that baseline differences are operating similarly in Cook County and the rest of the MSA (Feigenberg, Ost and Qureshi 2023). In this way, we can recover the difference in outcomes between Cook County and the rest of the MSA, free from any potential bias induced by baseline differences across these two areas and how they influence neighborhood SES change and the outcomes.
Neighborhood racial composition is an important dimension to consider given high levels of residential racial segregation in Chicago and the racial dimension of neighborhood change (Hwang and Sampson 2014; Timberlake and Johns-Wolfe 2017). Thus, we investigate how socioeconomic ascent and race jointly correspond to changes in the distribution of early childhood education by descriptively mapping neighborhood racial change during our study period and estimating a series of supplementary regression models that account for the interaction between SES ascent and changes in the share of White residents.
Results
Geographic Distribution of Ascending and Descending ZCTAs
We begin by examining the geographic locations among ZCTAs experiencing SES change—ascent, descent, and stability—across the Chicago MSA to contextualize and motivate the regression analyses that follow (Figure 1). ZCTAs that experienced SES ascent, descent, or stability are found across the MSA, but there are notable differences by location within the MSA. Almost all ZCTAs that experienced SES change in Chicago ascended, with only two experiencing descent. By contrast, Chicago's surrounding ZCTAs in Cook County exhibited greater variation—some of these ZCTAs experienced SES ascent, while others descended. In areas outside of Cook County, a greater number of ZCTAs experienced either SES descent or remained stable, with fewer areas experiencing SES ascent. While purely descriptive, these results from Figure 1 suggest that SES ascent is more common in the urban core, while SES descent tends to occur in areas farther away from the urban center of the MSA. Indeed, while the average percentile rank in 2009 was similar between Cook County and the rest of the MSA, this difference increased by 5 points by 2019—Cook County's average percentile rank was higher, whereas the rest of the MSA experienced a relative SES decline (supplemental Table A2).
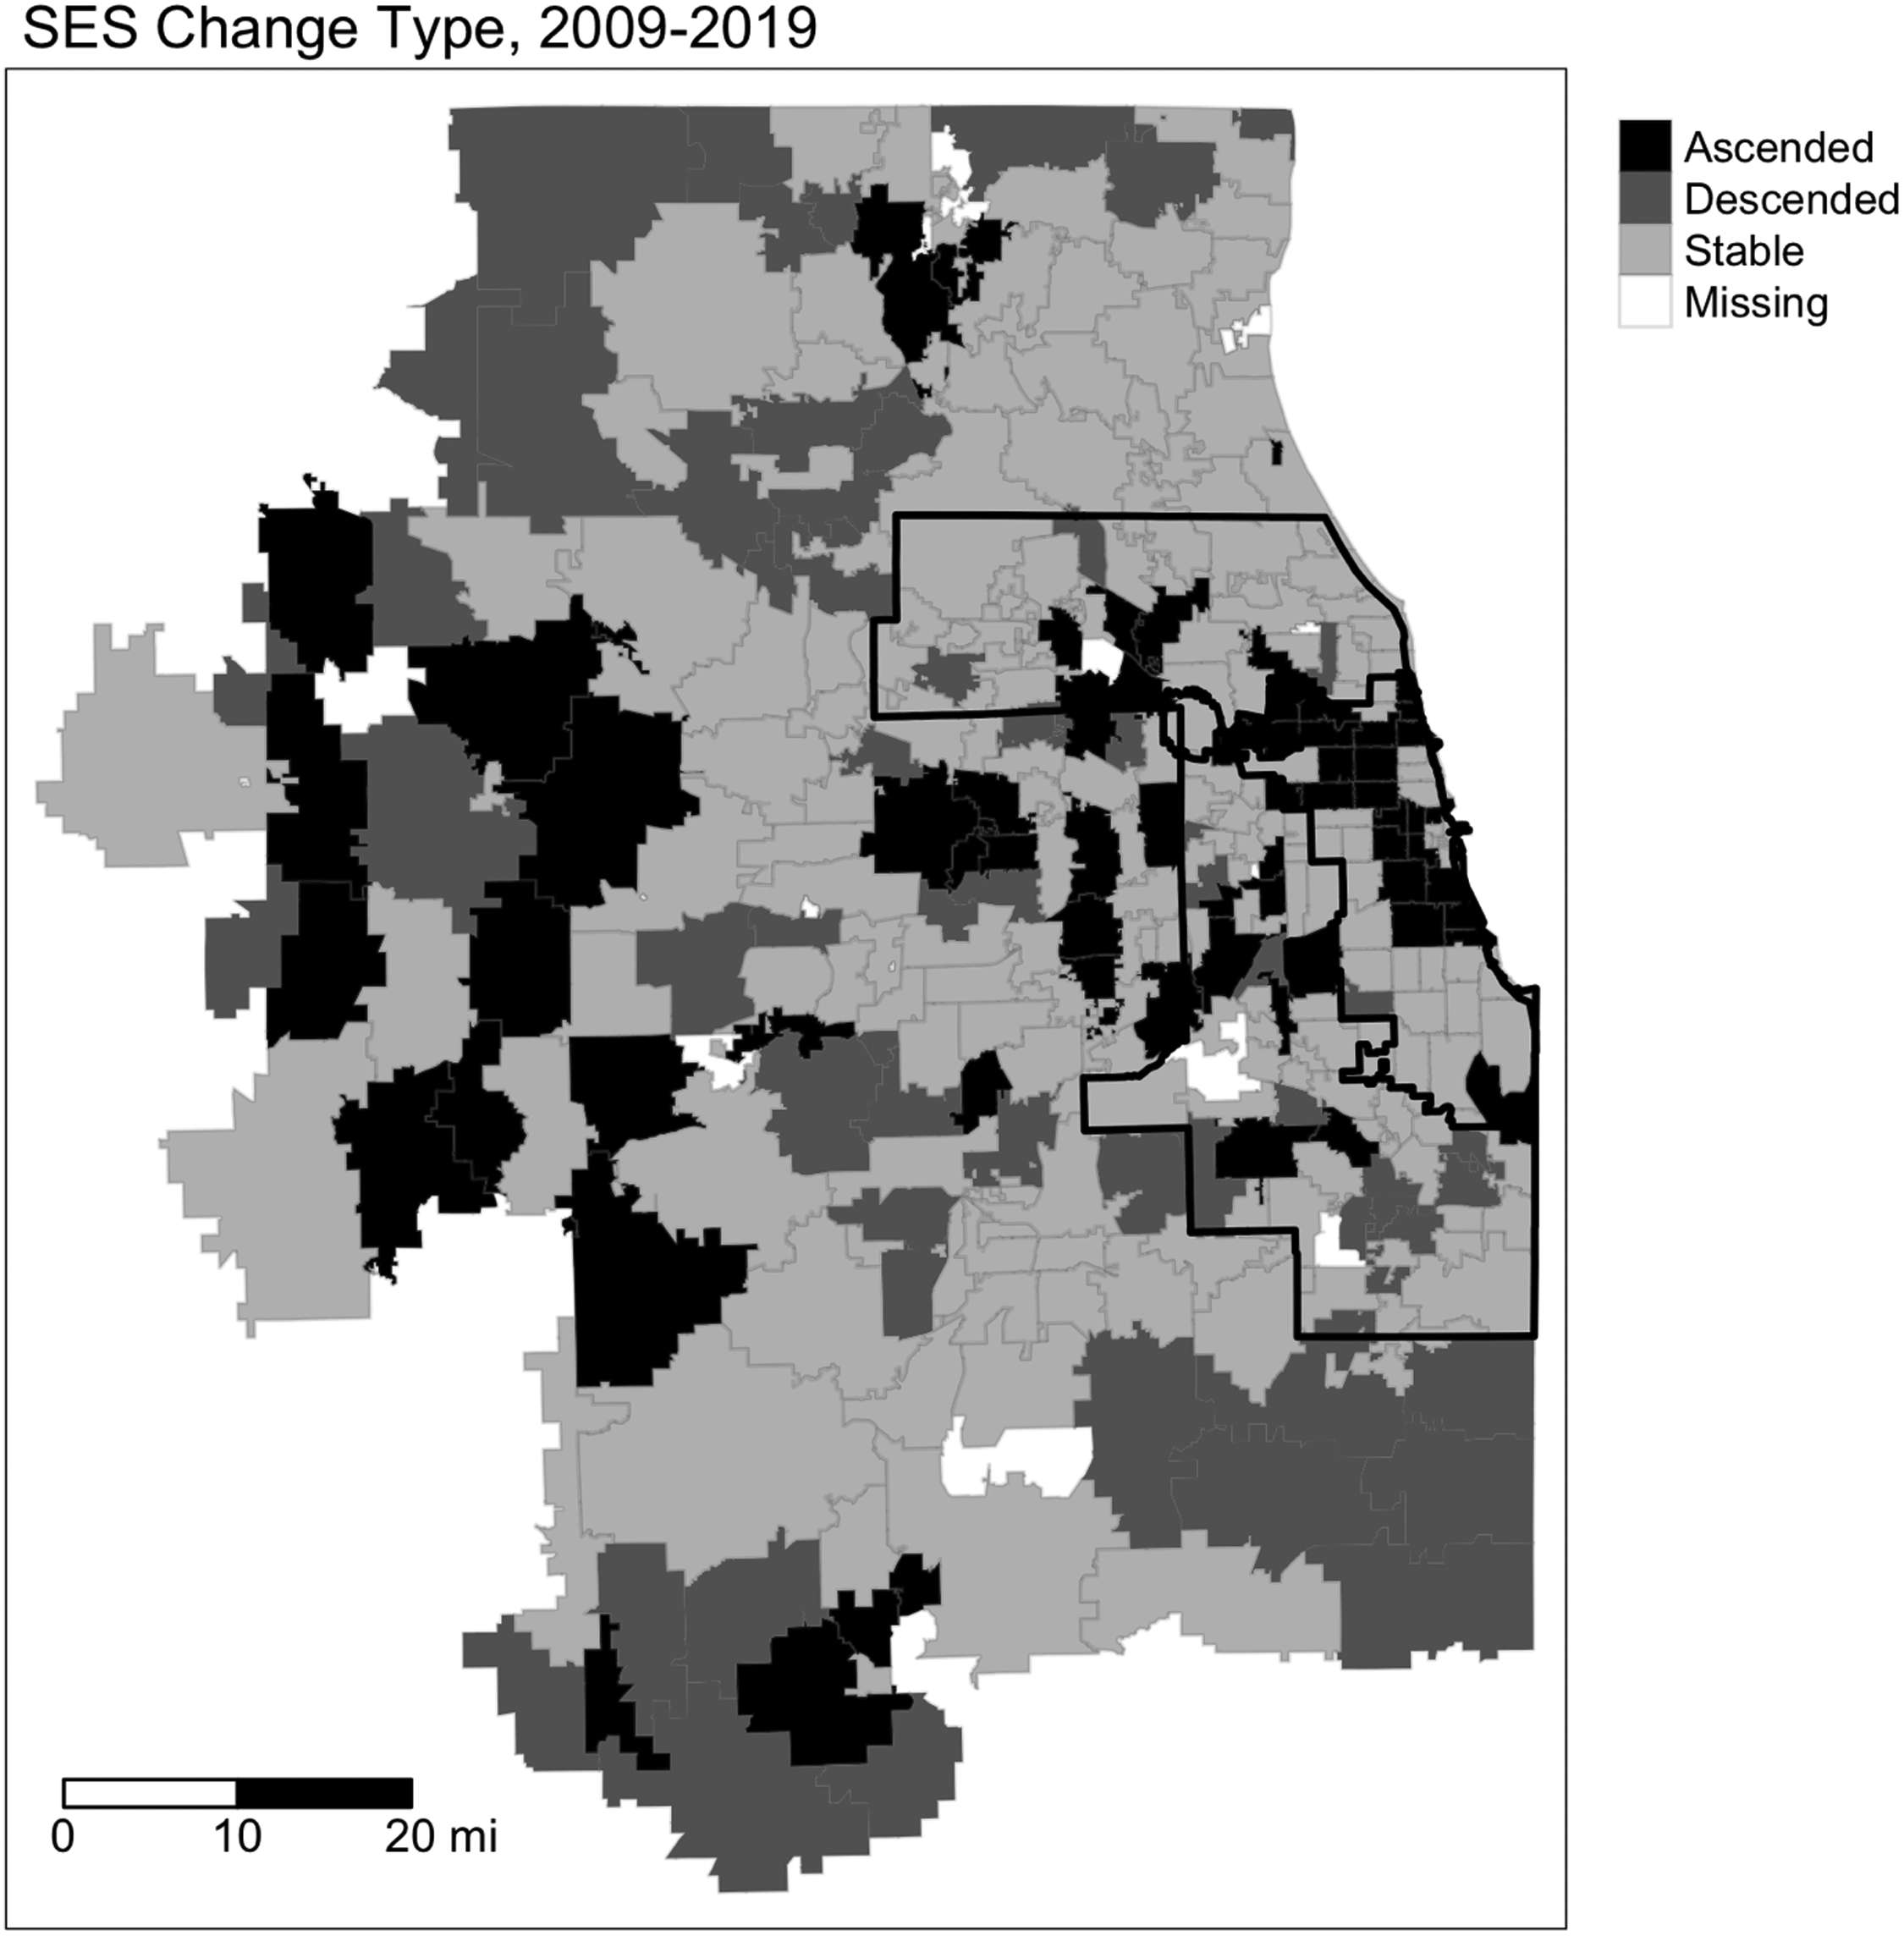
SES ascent status by ZCTAs in the Chicago MSA.
These changes generally overlap with changing racial demographics (supplemental Figure A1), as past research on neighborhood SES change has shown (Owens and Candipan 2019). Specifically, as Panel A shows, some of the ZCTAs in Chicago that experienced socioeconomic ascent also saw declines in the share of Hispanic residents, while some of the ZCTAs that saw increases in this share largely experienced SES stability. There is more variation outside of Chicago. Several ZCTAs that saw increases in the share of Hispanic residents also experienced SES ascent, while others experienced descent or remained stable. However, patterns are different when we examine changes in the share of Black residents. While several of the SES ascending ZCTAs within Chicago saw declines in the share of Black residents, most of the ZCTAs in the rest of the MSA saw little change, regardless of whether they experienced SES ascent, descent, or stability. These results suggest that associations between SES ascent and changes in ECE access should be interpreted in light of these descriptive racial patterns.
Figure 2 shows the distribution of ZCTA SES types in terms of the total number (Panel A) and percentage (Panel B). Of the 332 ZCTAs in the MSA, more than 60 percent (200) remained stable, 62 (19 percent) descended, and 70 (21 percent) ascended. More than half of these ascending ZCTAs (41) are in Cook County with the remaining 29 located in the rest of the MSA. Conversely, the majority of ZCTAs that experienced SES descent is located outside of Cook County (44 vs 18), aligned with our observations from Figure 1.
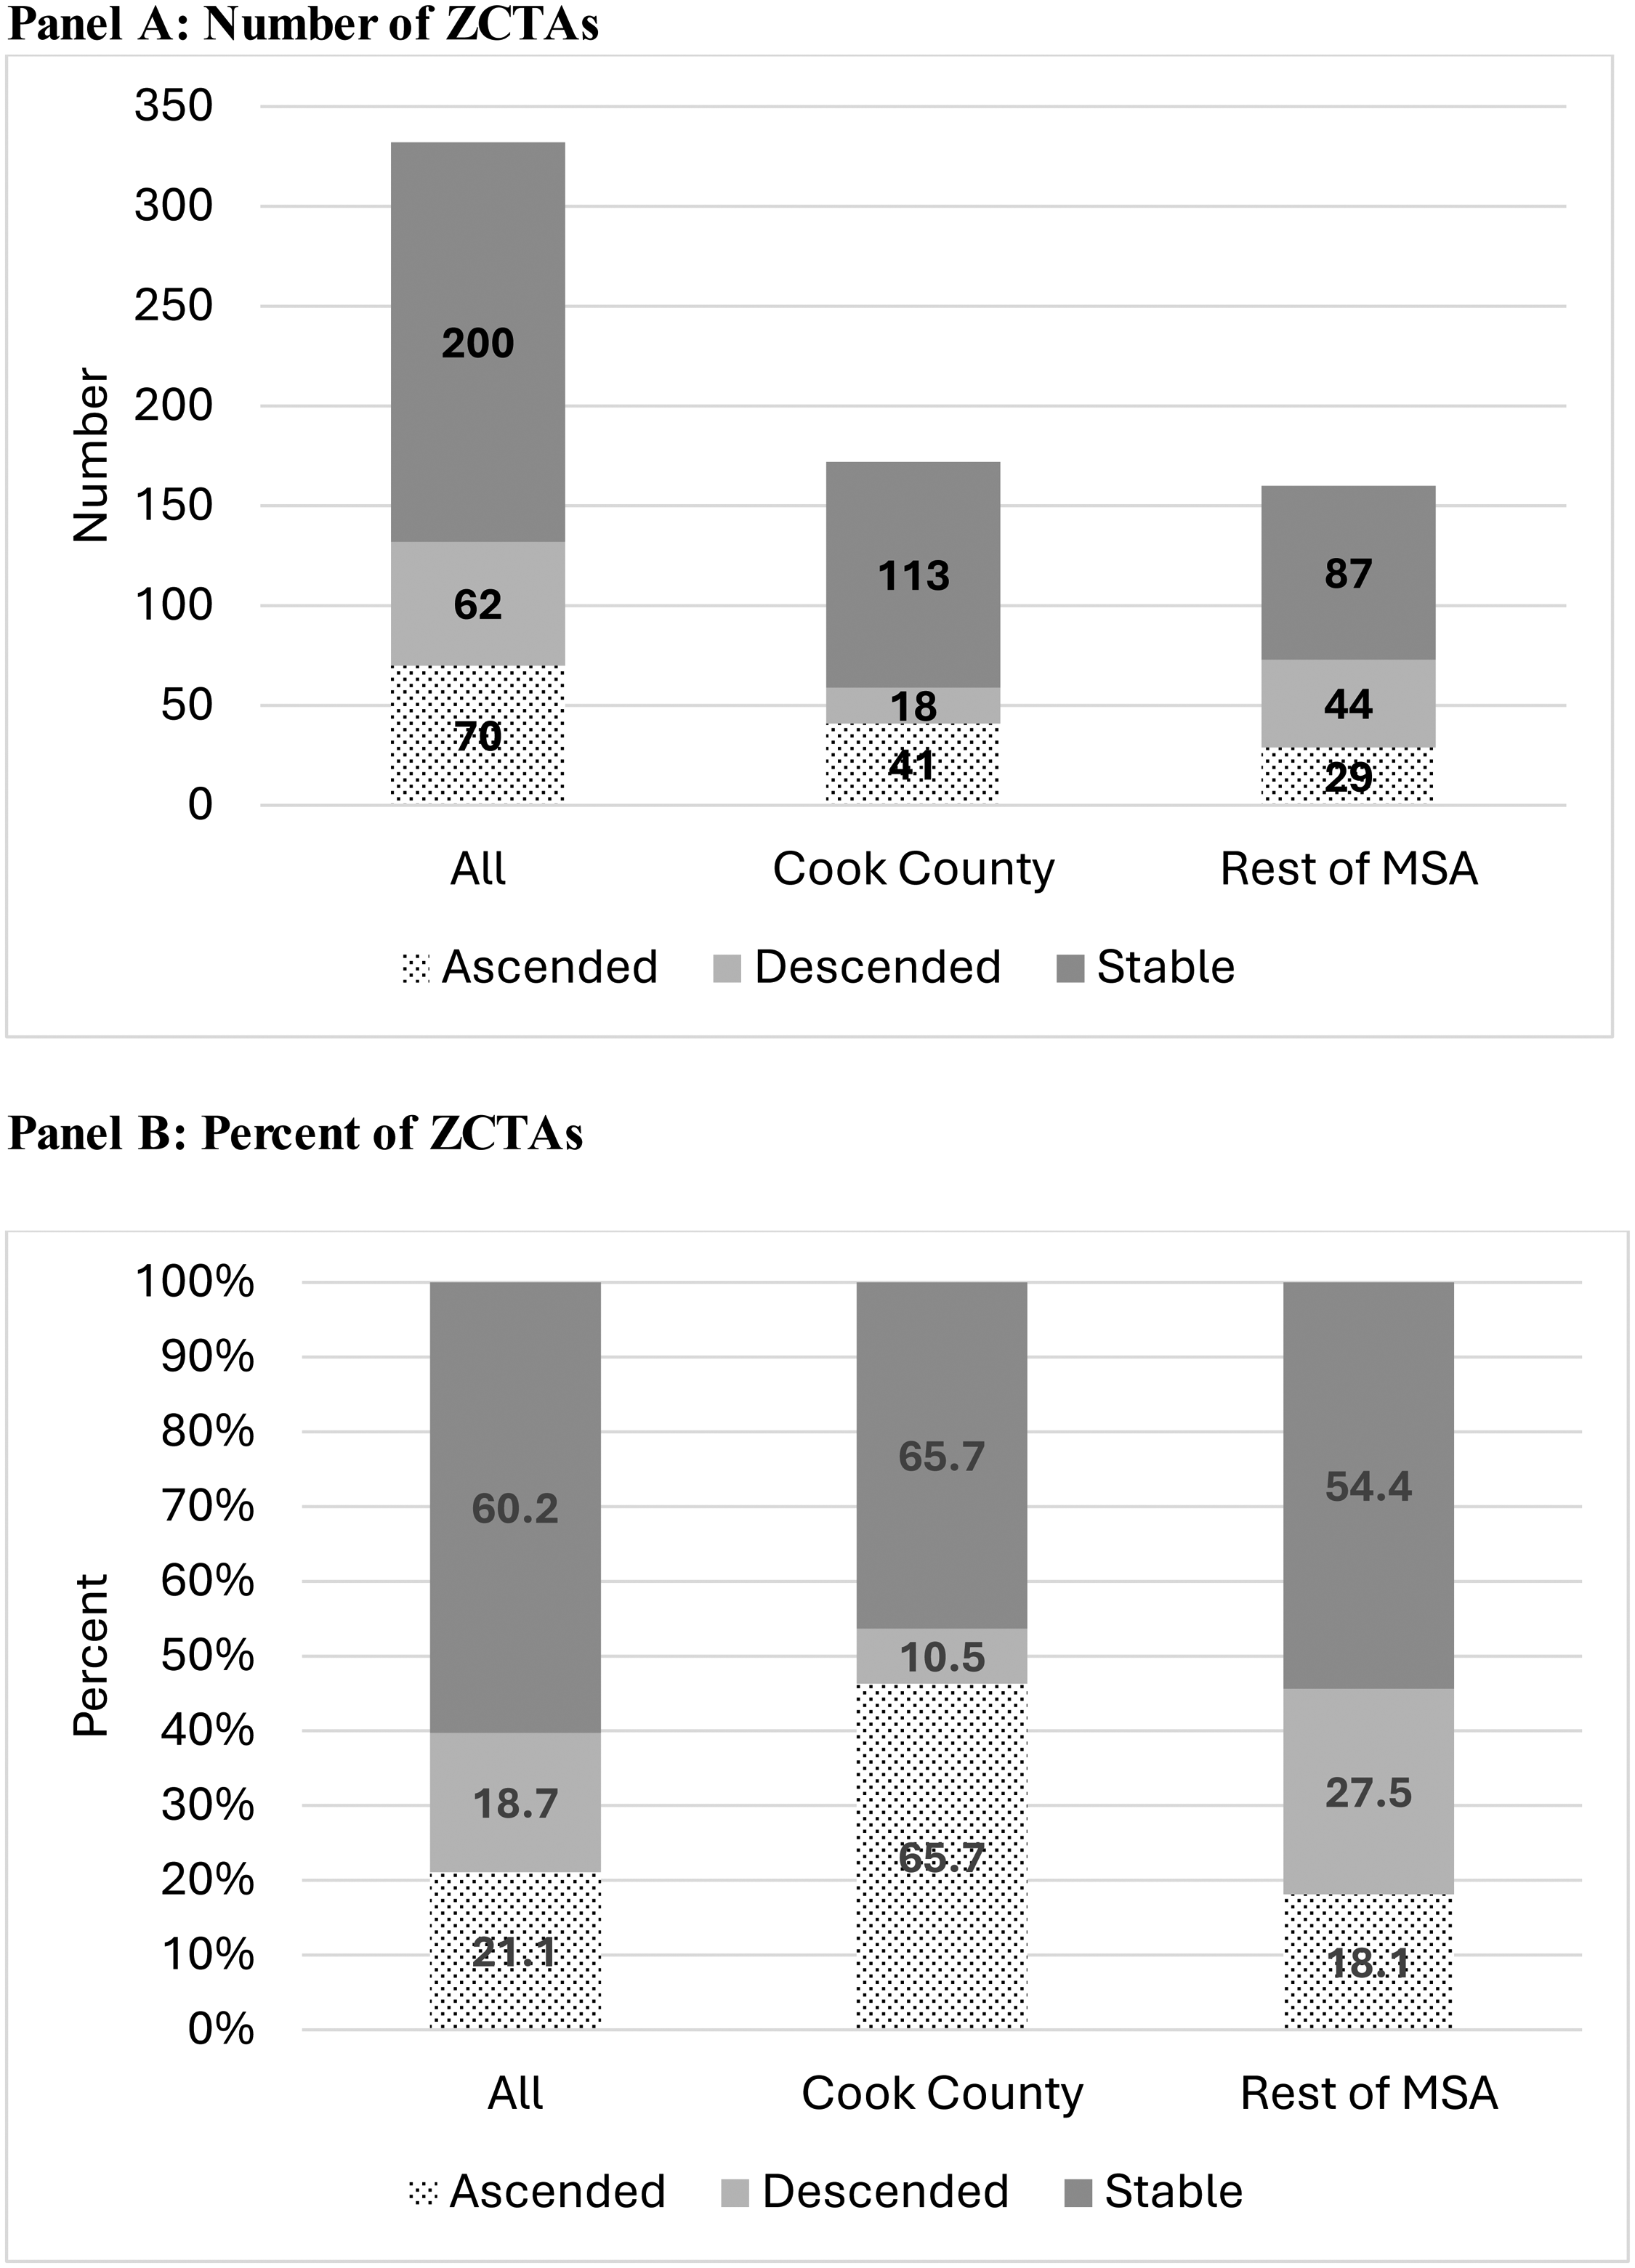
Distribution of Chicago MSA ZCTAs by type and location in Cook County or the rest of the MSA
Next, Figure 3 examines geographic patterns in ECE resources, focusing on areas that are underserved or severely underserved by ECE resources to understand how these patterns correspond with the neighborhood SES changes documented above. In 2009, areas underserved by ECE resources were present throughout the MSA regardless of location, with several ZCTAs showing far fewer available ECE seats than the number of children needing them. By 2019, most ZCTAs maintained their status from 2009; however, some ZCTAs, particularly within the city of Chicago, improved and were no longer classified as underserved. Conversely, a small number of ZCTAs transitioned into the underserved category during this period, with these areas primarily outside Chicago. These patterns suggest that areas in which most ZCTAs experienced SES ascent saw an improvement in ECE resources, while worsening ECE capacity seems to occur in areas that experienced SES stability or descent. 5 We investigate these patterns more formally in the regression analyses that follow.
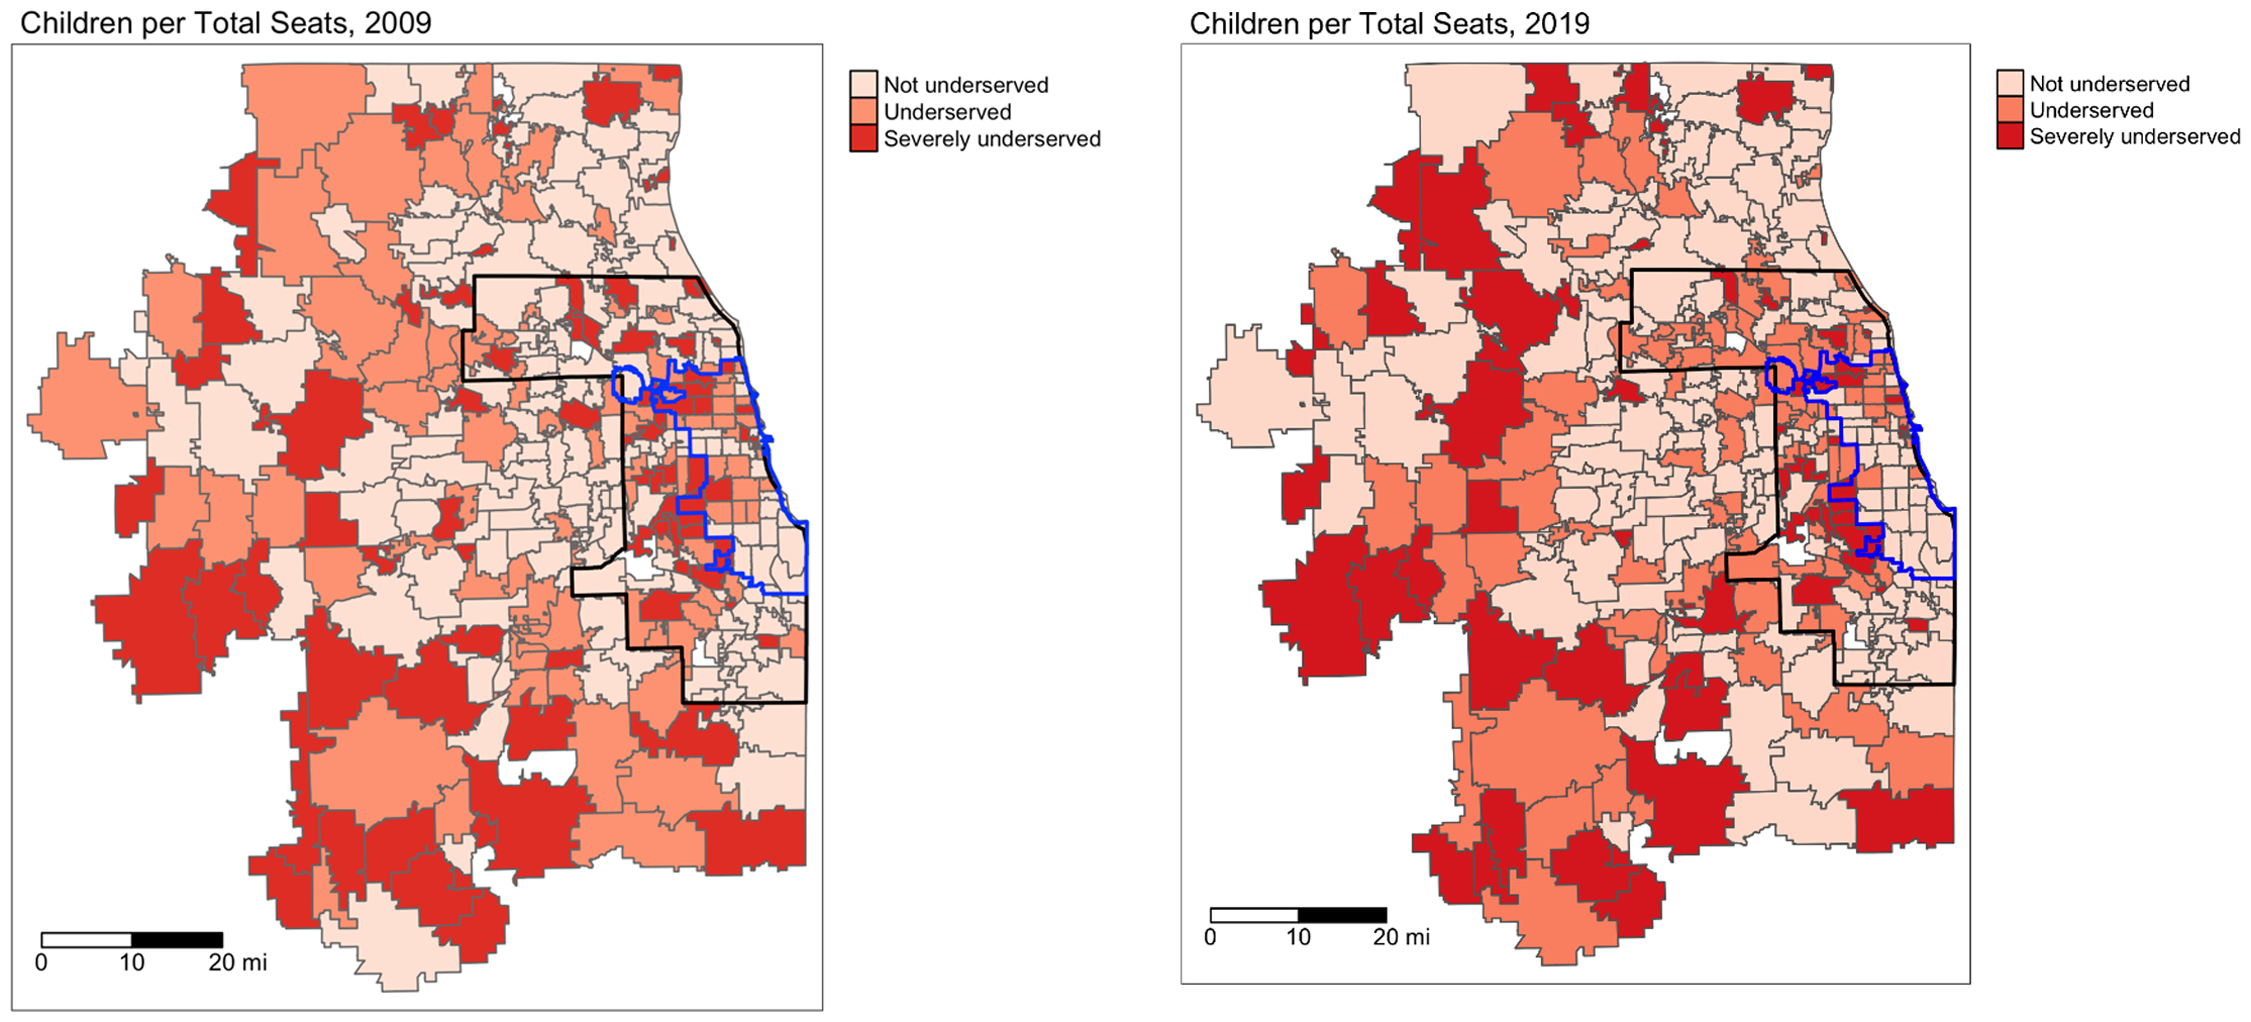
ECE capacity, Chicago MSA, 2009 and 2019
Baseline Descriptive Statistics
Table 1 presents baseline differences across ascending, descending, and stable ZCTAs. In ZCTAs that experienced SES ascent, the baseline percent of White residents was 66.5, which was slightly lower than in ZCTAs that descended (71 percent) and higher than in stable ZCTAs (61.9 percent). ZCTAs that experienced SES descent had a lower proportion of children under 5 years of age compared to those that ascended or remained stable (22.5 vs 28.1 percent). Additionally, descending ZCTAs had the lowest population density, while ascending ZCTAs had the highest. ZCTAs that experienced SES ascent or remained stable had roughly five Pre-K or kindergarten programs at baseline, which was higher than those in descending ZCTAs (2.5). Regarding the expansion of PFA, ZCTAs that ascended had more PFA sites at baseline (3.7) than descending (1.0) and stable ZCTAs (2.7).
Mean Baseline Characteristics by ZCTA Type, 2010.
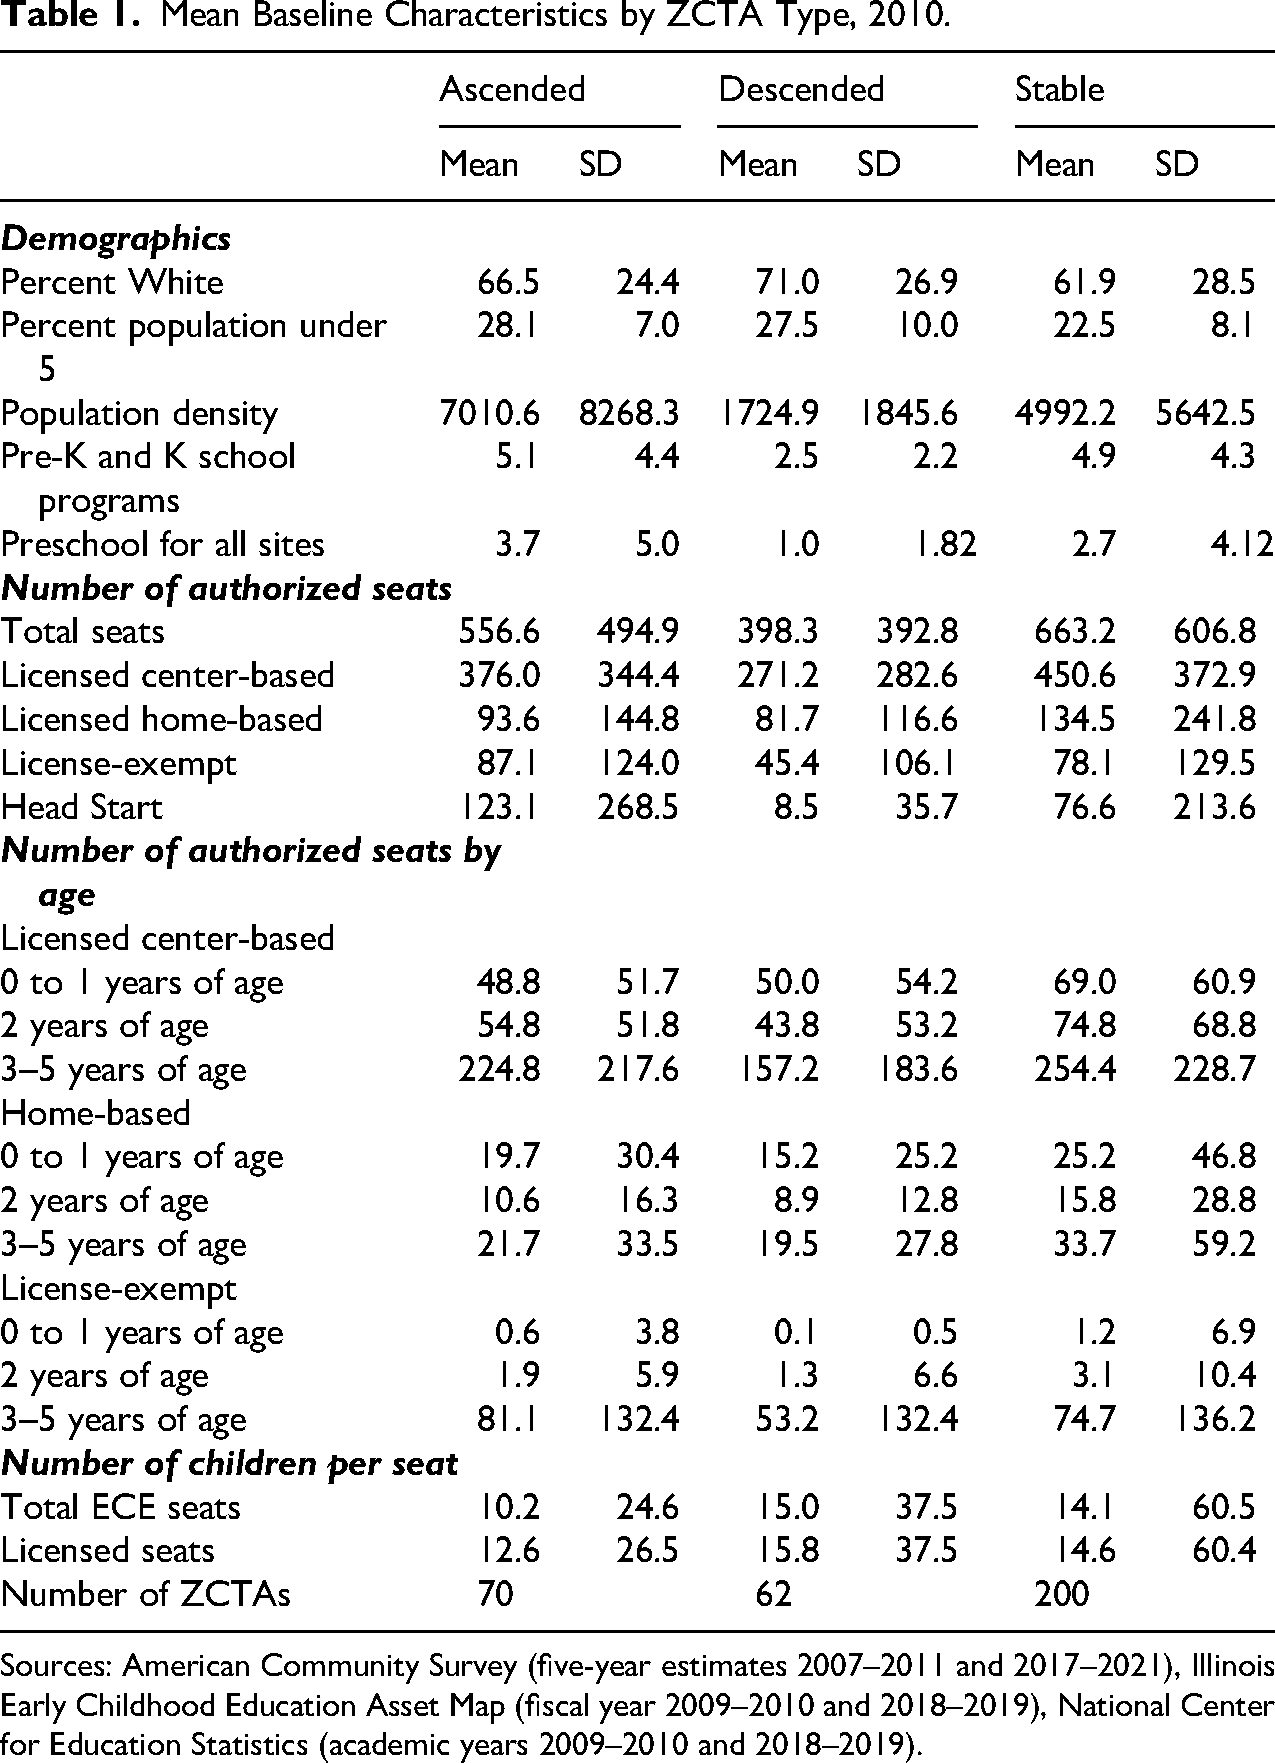
Sources: American Community Survey (five-year estimates 2007–2011 and 2017–2021), Illinois Early Childhood Education Asset Map (fiscal year 2009–2010 and 2018–2019), National Center for Education Statistics (academic years 2009–2010 and 2018–2019).
Stable ZCTAs generally had a higher number of total seats than ZCTAs that experienced SES ascent or descent, including more licensed seats in center- and home-based providers. In contrast, ZCTAs that experienced SES ascent generally had more Head Start seats and slightly more license-exempt seats than ZCTAs that descended or remained stable. In terms of variation by age, stable neighborhoods seem to have more authorized seats across all provider types and age groups, followed by ZCTAs that experienced SES ascent. Ascending ZCTAs have more authorized license-exempt seats for 3–5-year-olds than the other neighborhood types.
Overall, at baseline, all ZCTA types were categorized as underserved by ECE resources, with 10 or more children per seat, on average, although levels of undersupply varied by SES types. ZCTAs that experienced SES ascent had fewer children per seat and fewer children per licensed seat than descending and stable ZCTAs. These results seem to align with the geographic patterns documented above. 6
Regression Results
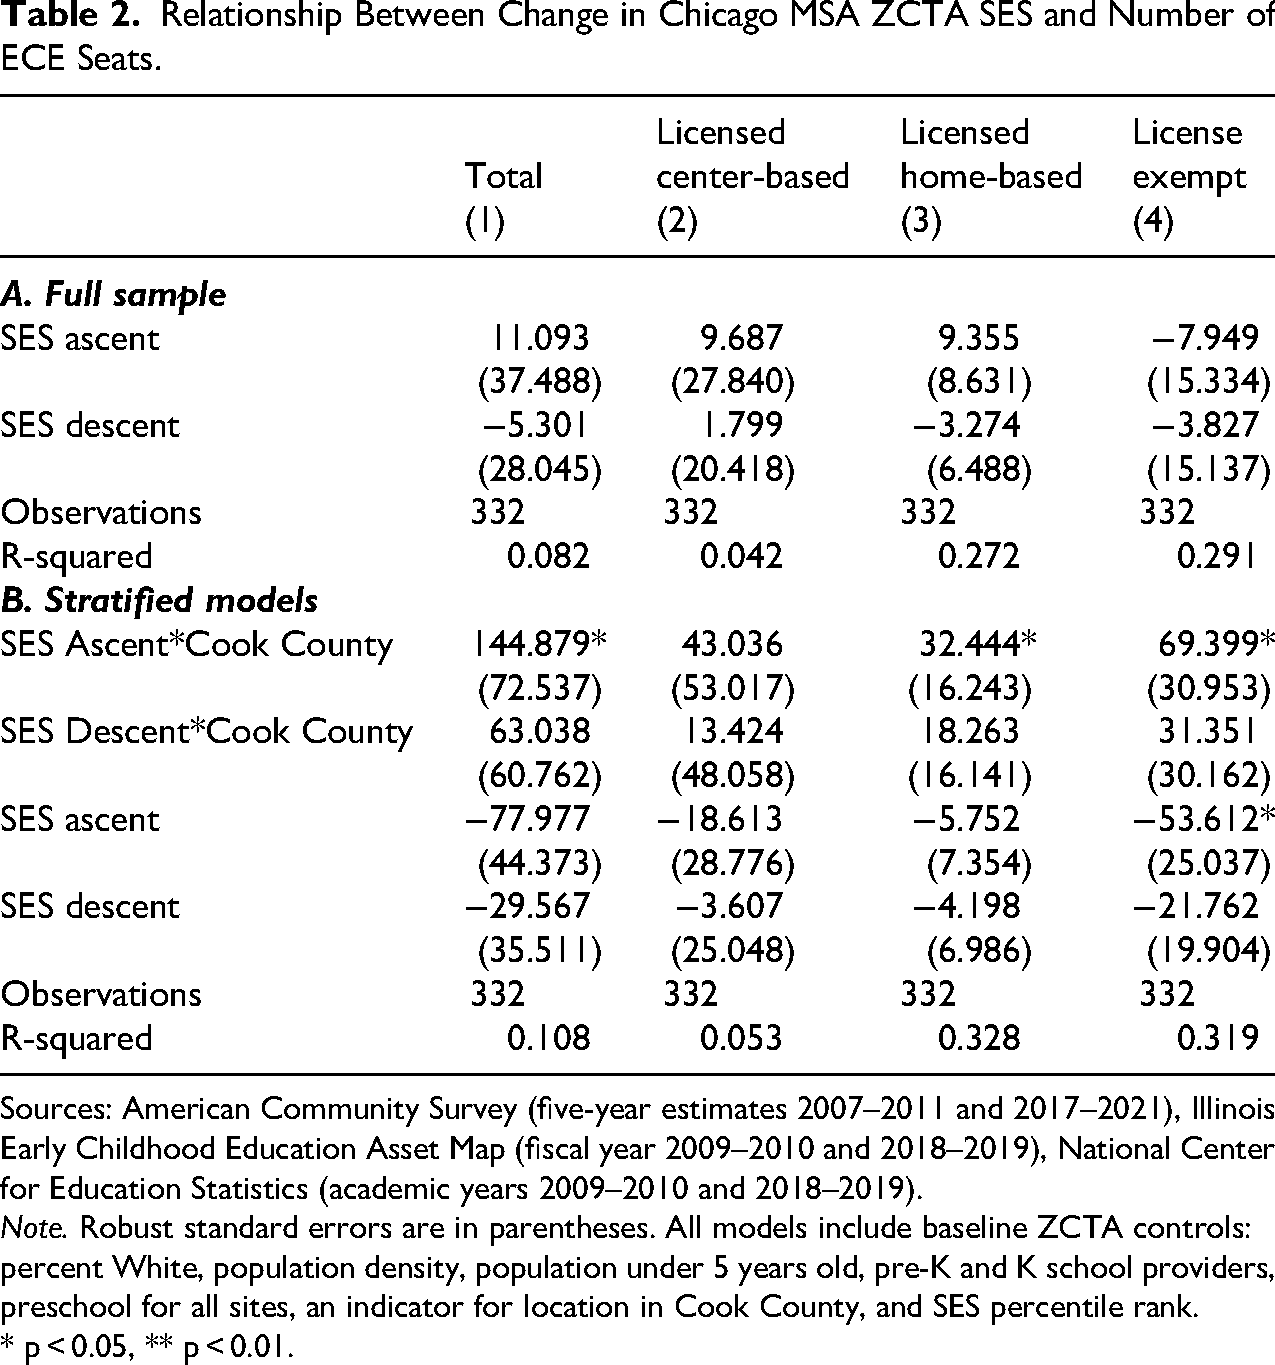
Table 2 (Panel A) presents regression results examining the relationship between SES change (ascent and descent) and ECE seats for all ZCTAs in the Chicago MSA. Overall, we observe little evidence that SES ascent is associated with changes in ECE resources in the MSA. While coefficients associated with SES ascent are positive across all outcome variables, they are not statistically significant at conventional levels, suggesting no differences in ECE resources with stable neighborhoods.
Relationship Between Change in Chicago MSA ZCTA SES and Number of ECE Seats.
Sources: American Community Survey (five-year estimates 2007–2011 and 2017–2021), Illinois Early Childhood Education Asset Map (fiscal year 2009–2010 and 2018–2019), National Center for Education Statistics (academic years 2009–2010 and 2018–2019).
Note. Robust standard errors are in parentheses. All models include baseline ZCTA controls: percent White, population density, population under 5 years old, pre-K and K school providers, preschool for all sites, an indicator for location in Cook County, and SES percentile rank.
* p < 0.05, ** p < 0.01.
These results, however, appear to mask heterogeneity by location within the MSA, as shown in Panel B. ZCTAs that experienced SES ascent in Cook County have about 145 more total seats (Column 1). This represents a 26 percent increase relative to the baseline number of seats in these ZCTAs. We also observe in Column 3 that ZCTAs in Cook County that experienced SES ascent have 32.4 more license home-based seats than stable ZCTAs (36.6 percent increase of the baseline mean). Finally, ZCTAs that experienced SES ascent in Cook County have 69.4 more license-exempt seats than ascending ZCTAs outside of Cook County (Column 4)—a 79 percent increase relative to baseline. We do not observe statistically significant differences in licensed ECE seats (center- or home-based) between ascending ZCTAs in Cook County and those in the rest of the MSA, nor for any ECE types between descending ZCTAs in Cook County and those in the rest of the MSA.
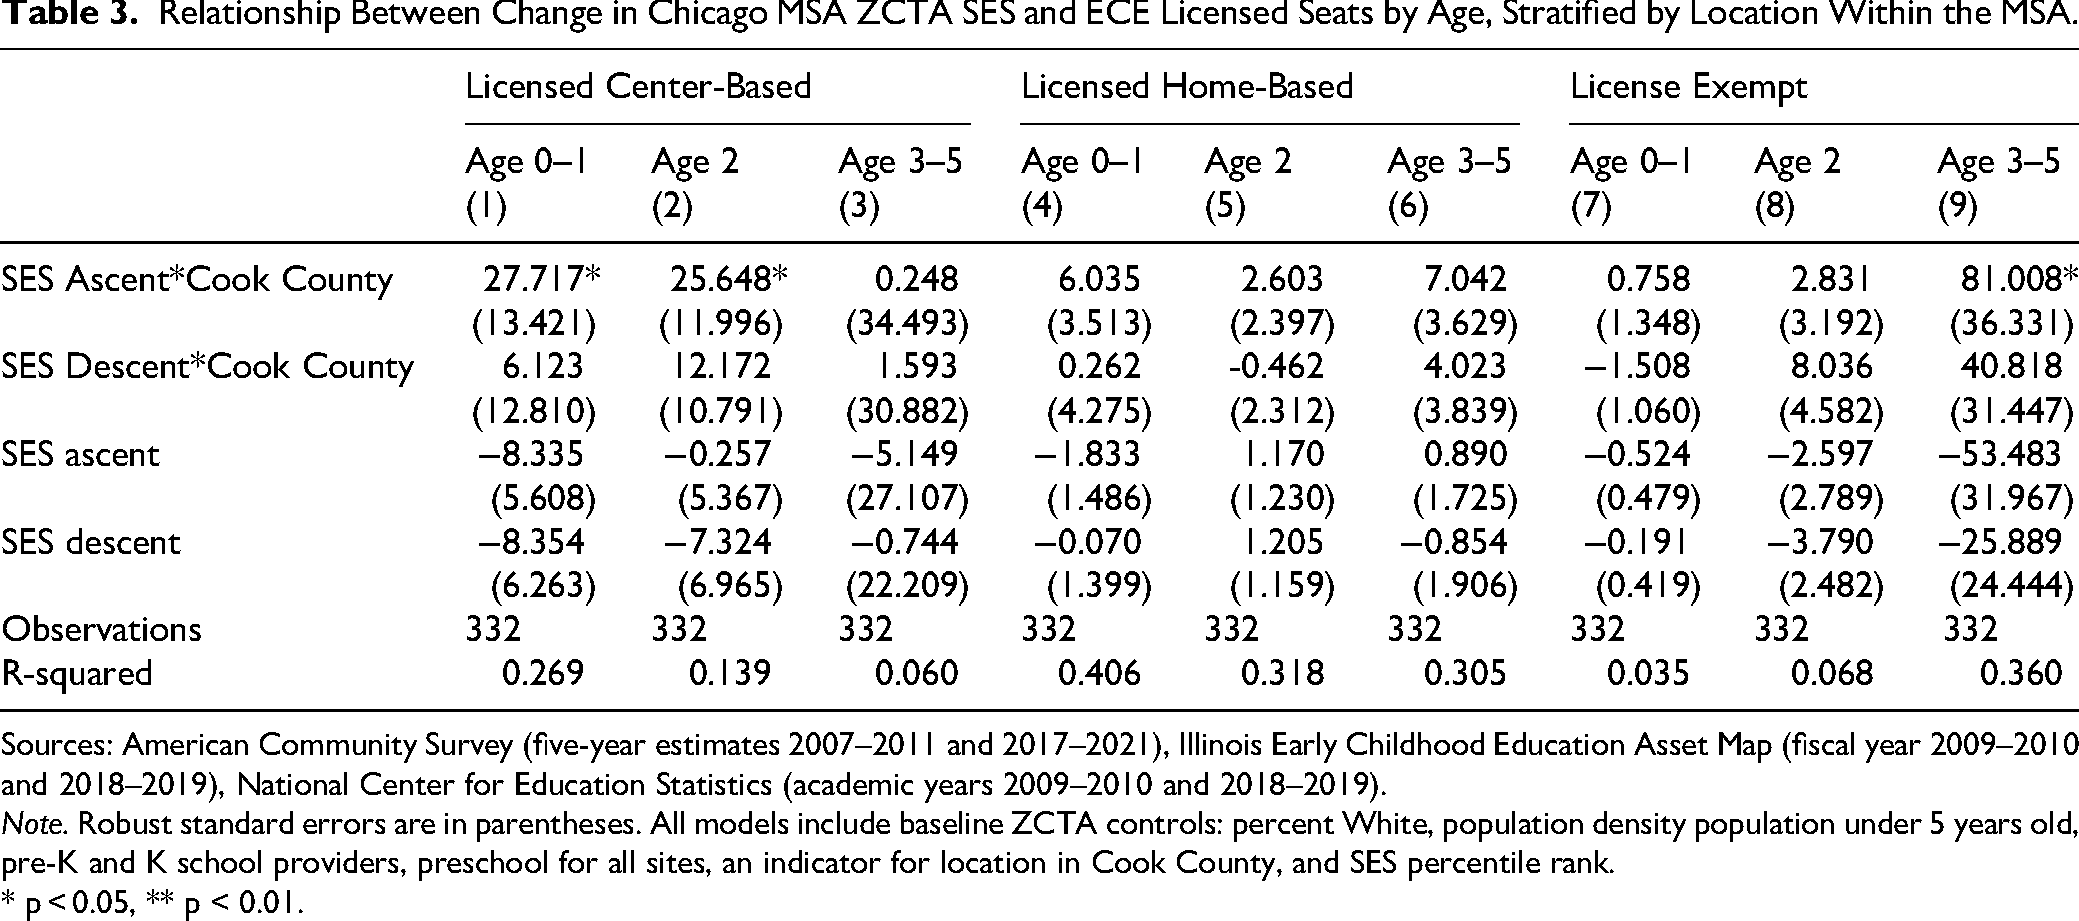
To dig deeper into these changes, we examined heterogeneity in the availability of seats by age (Table 3). As predicted in our conceptual framework given higher SES parents’ preferences for formal care arrangements (Chaudry et al. 2011; Kulic et al. 2017), we see that SES ascent is related to an increase in licensed center-based seats for infants and toddlers, with increases ranging from 56.7 to 34.3 percent relative to the baseline mean in these neighborhoods. We further observe an increase in license exempt seats for preschool-age children in ascending ZCTAs of nearly 100 percent relative to the mean, again, aligning with our earlier predictions. As before, these changes mostly occur in Cook County. We find no statistically significant changes associated with SES descent.
Relationship Between Change in Chicago MSA ZCTA SES and ECE Licensed Seats by Age, Stratified by Location Within the MSA.
Sources: American Community Survey (five-year estimates 2007–2011 and 2017–2021), Illinois Early Childhood Education Asset Map (fiscal year 2009–2010 and 2018–2019), National Center for Education Statistics (academic years 2009–2010 and 2018–2019).
Note. Robust standard errors are in parentheses. All models include baseline ZCTA controls: percent White, population density population under 5 years old, pre-K and K school providers, preschool for all sites, an indicator for location in Cook County, and SES percentile rank.
* p < 0.05, ** p < 0.01.
These patterns are reinforced by changing racial demographics. In supplementary analyses, we interact the ascent and descent variables with the change in the White population. We find that higher shares of White residents in ascending ZCTAs correlate with more seats in home-based providers overall and across all age groups, and with more licensed center-based seats for toddlers (supplemental Tables A4 and A5).
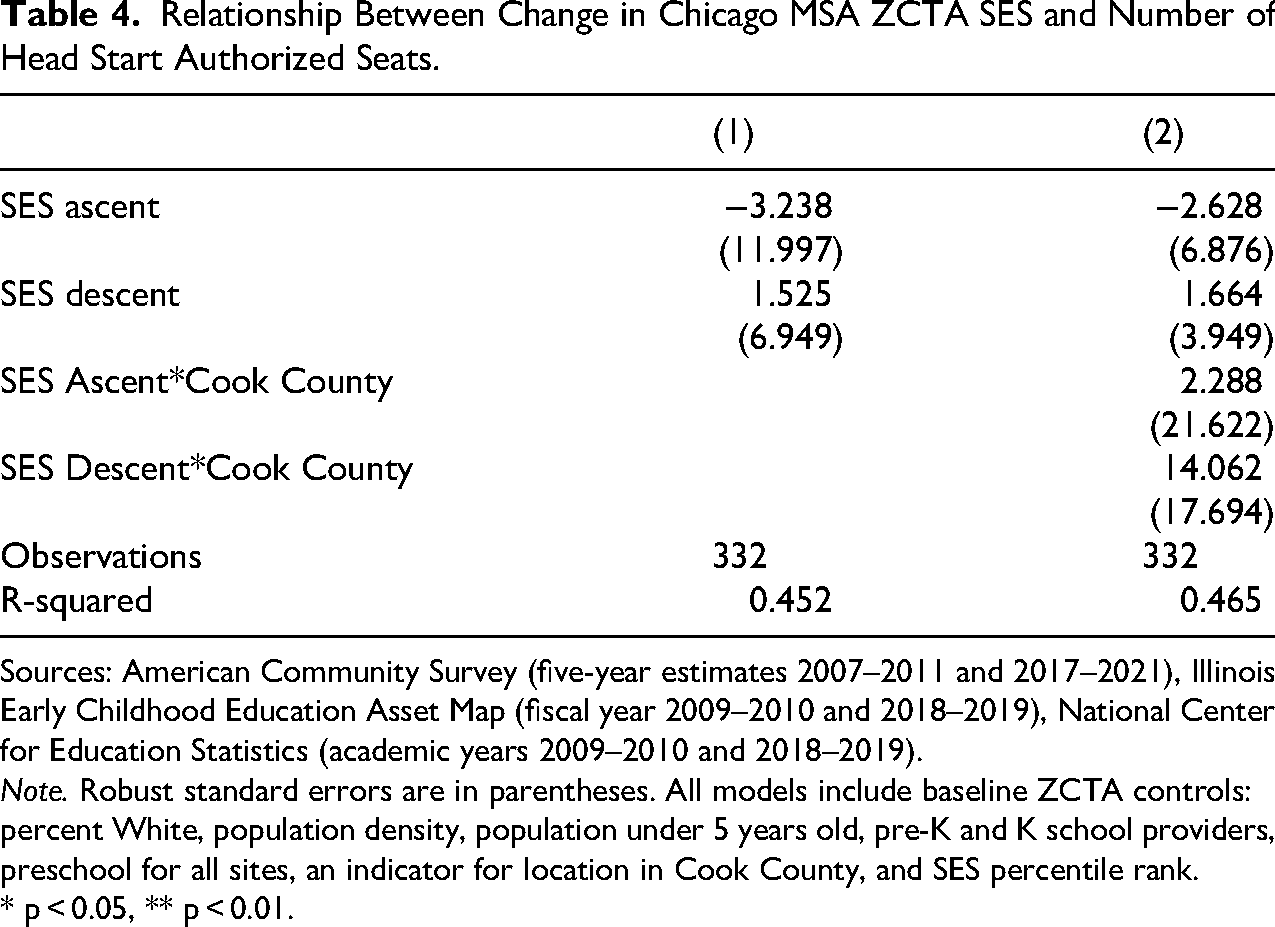
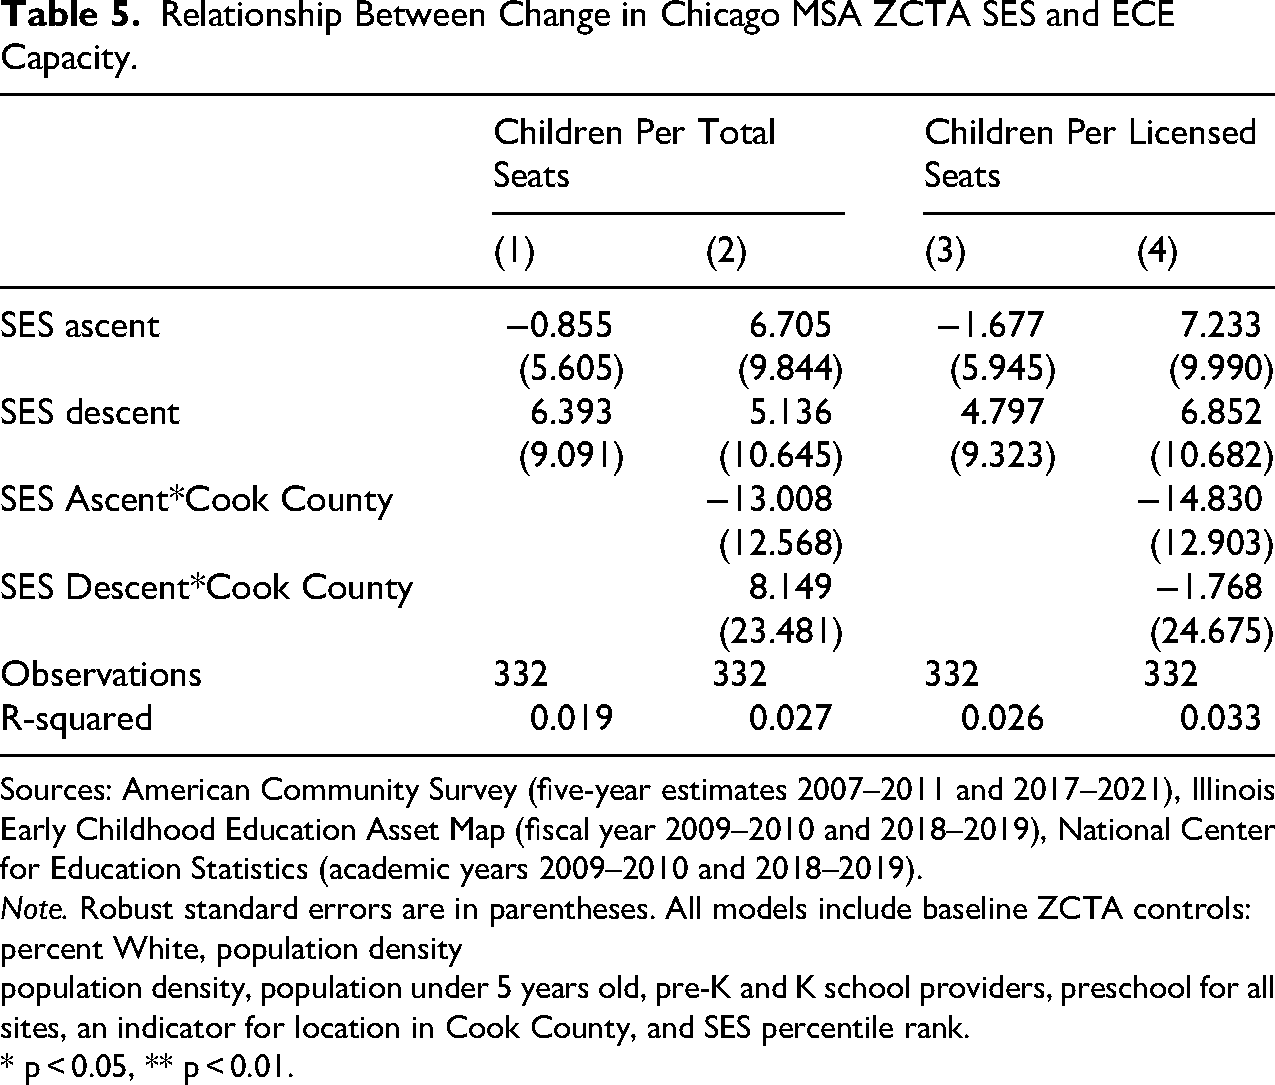
When we examine the association between neighborhood SES change and Head Start seats, we find little evidence of a relationship overall and by location in Cook County (Table 4). This finding aligns with evidence that Head Start programs locate in a variety of neighborhoods and are not necessarily concentrated in low SES areas (McCoy et al. 2015). Similarly, we also do not find evidence that neighborhood SES change is associated with changing ECE capacity (Table 5). While regression coefficients for the interaction between SES ascent and Cook County are negative, they are not statistically significant at conventional levels. These patterns remain when we examine variation by the change in the share of ZCTA White residents. The one exception is that an increase in the share of White residents is associated with more children per licensed seats. This finding suggests that changes in capacity may not be sufficient to meet potential demand for services in neighborhoods experiencing SES ascent and increases in White residents (supplemental Tables A6 and A7).
Relationship Between Change in Chicago MSA ZCTA SES and Number of Head Start Authorized Seats.
Sources: American Community Survey (five-year estimates 2007–2011 and 2017–2021), Illinois Early Childhood Education Asset Map (fiscal year 2009–2010 and 2018–2019), National Center for Education Statistics (academic years 2009–2010 and 2018–2019).
Note. Robust standard errors are in parentheses. All models include baseline ZCTA controls: percent White, population density, population under 5 years old, pre-K and K school providers, preschool for all sites, an indicator for location in Cook County, and SES percentile rank.
* p < 0.05, ** p < 0.01.
Relationship Between Change in Chicago MSA ZCTA SES and ECE Capacity.
Sources: American Community Survey (five-year estimates 2007–2011 and 2017–2021), Illinois Early Childhood Education Asset Map (fiscal year 2009–2010 and 2018–2019), National Center for Education Statistics (academic years 2009–2010 and 2018–2019).
Note. Robust standard errors are in parentheses. All models include baseline ZCTA controls: percent White, population density
population density, population under 5 years old, pre-K and K school providers, preschool for all sites, an indicator for location in Cook County, and SES percentile rank.
* p < 0.05, ** p < 0.01.
Sensitivity Checks
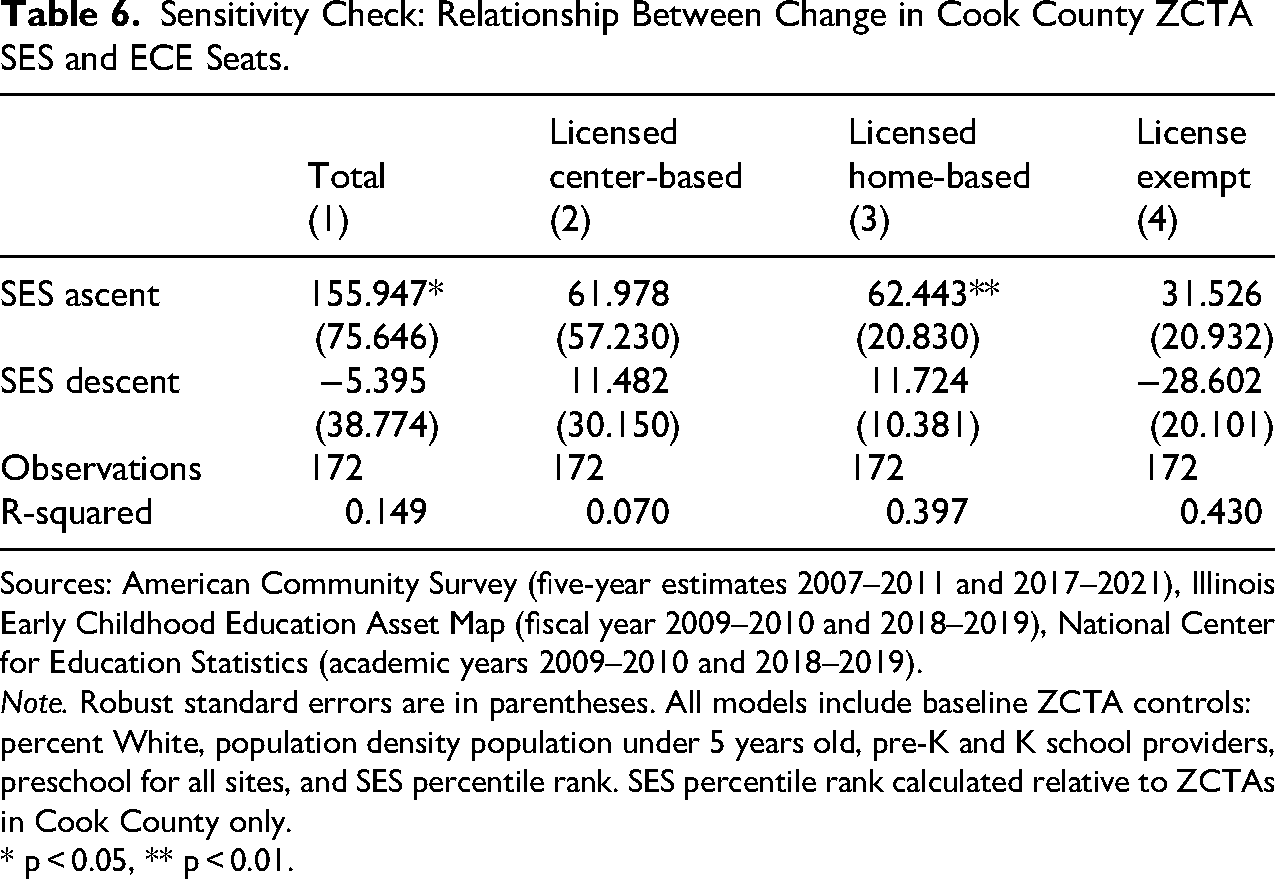
Altogether, our analyses show that SES ascent is linked with more total seats in Cook County compared to the rest of the MSA. To further explore this dimension and test the sensitivity of results, we recalculated our SES change variables for Cook County only and re-estimated our models on this sample. 7
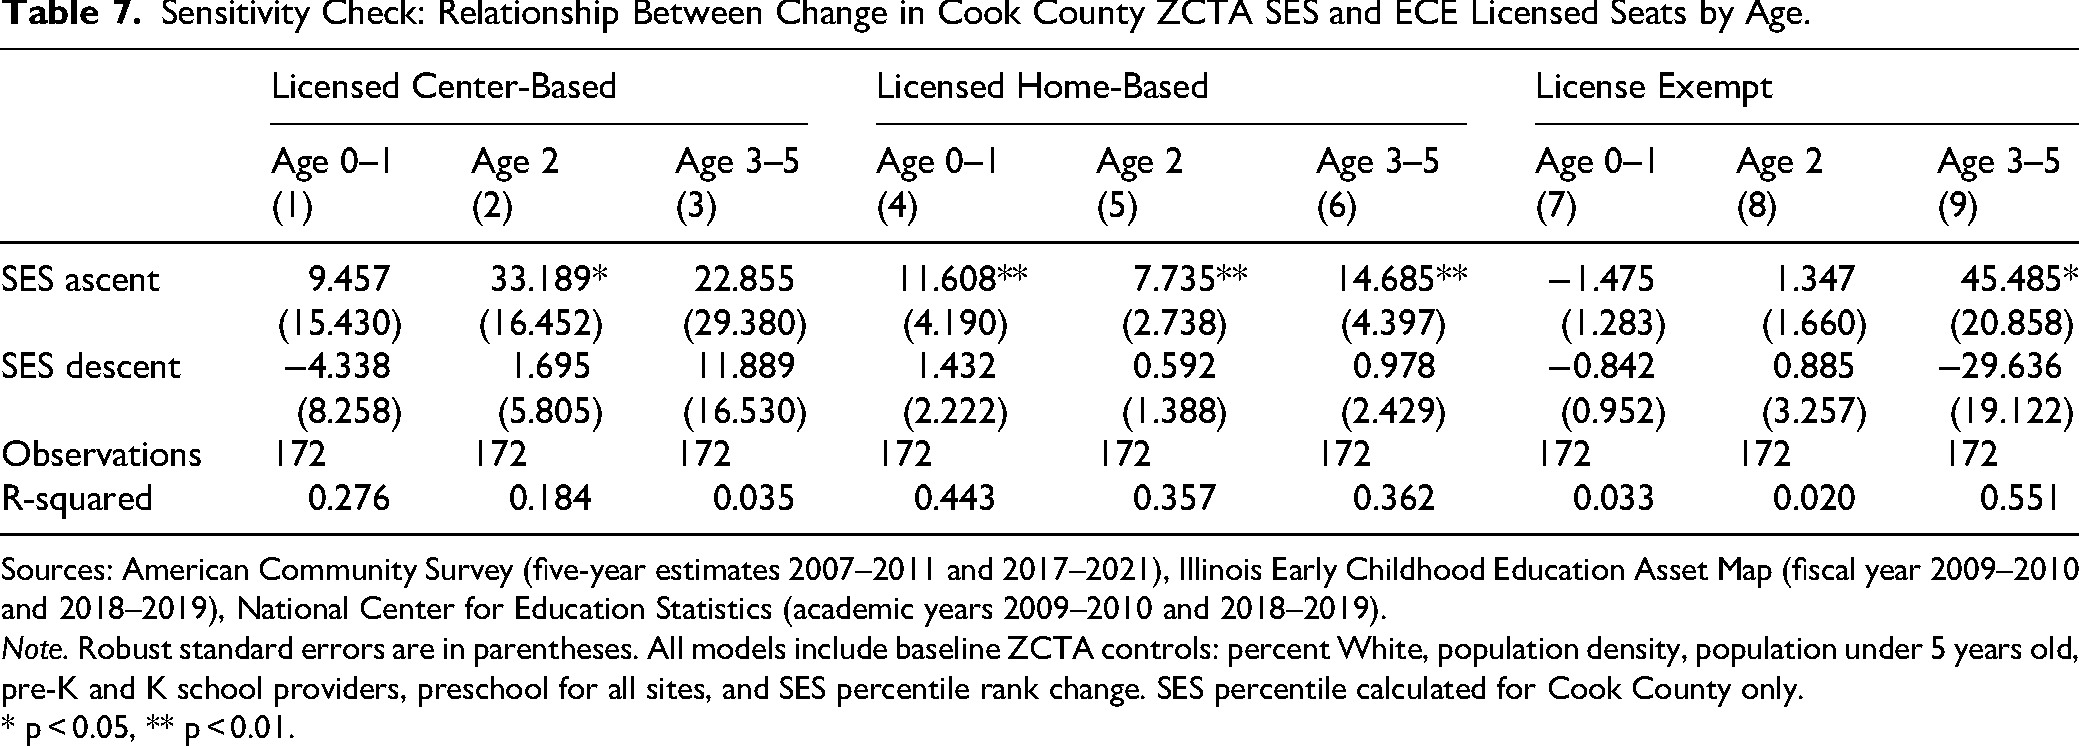
Overall, results confirm that SES ascent is associated with a higher number of ECE seats (Table 6). Specifically, ascending neighborhoods in Cook County have 155.4 more total seats (22 percent change relative to baseline in these neighborhoods) and 62.4 more seats in home-based providers than stable ZCTAs (Columns 1 and 3). Aligned with our main results, we do not observe statistically significant differences between descending and stable ZCTAs. These changes appear to be driven by more licensed center-based providers for toddlers, home-based providers across all age groups, and by license-exempt seats for 3–5-year-olds (Table 7).
Sensitivity Check: Relationship Between Change in Cook County ZCTA SES and ECE Seats.
Sources: American Community Survey (five-year estimates 2007–2011 and 2017–2021), Illinois Early Childhood Education Asset Map (fiscal year 2009–2010 and 2018–2019), National Center for Education Statistics (academic years 2009–2010 and 2018–2019).
Note. Robust standard errors are in parentheses. All models include baseline ZCTA controls: percent White, population density population under 5 years old, pre-K and K school providers, preschool for all sites, and SES percentile rank. SES percentile rank calculated relative to ZCTAs in Cook County only.
* p < 0.05, ** p < 0.01.
Sensitivity Check: Relationship Between Change in Cook County ZCTA SES and ECE Licensed Seats by Age.
Sources: American Community Survey (five-year estimates 2007–2011 and 2017–2021), Illinois Early Childhood Education Asset Map (fiscal year 2009–2010 and 2018–2019), National Center for Education Statistics (academic years 2009–2010 and 2018–2019).
Note. Robust standard errors are in parentheses. All models include baseline ZCTA controls: percent White, population density, population under 5 years old, pre-K and K school providers, preschool for all sites, and SES percentile rank change. SES percentile calculated for Cook County only.
* p < 0.05, ** p < 0.01.
Similar to our findings using MSA data, we do not find an association between SES neighborhood change and Head Start providers and seats. Further, we find no statistically significant differences between SES ascent or descent and stable ZCTAs in the number of children per ECE seats, suggesting that observed changes in seats do not necessarily result in greater capacity (supplemental Table A8).
Finally, we checked the sensitivity of our results to the choice of control variables. Conclusions are similar when we re-estimate all regressions including the change in the control variables from 2009 to 2019 in addition to baseline measures (supplemental Tables A9–A15). We also estimated regressions, replacing the control for the share of White residents with three variables capturing the share of Asian, Hispanic, and Black residents in a ZCTA. We estimated these models with baseline controls, and in separate models we added controls for the change in these variables. Our results are robust to this modification in our main specification (supplemental Tables A16–A29).
Discussion
This study investigates how the landscape of ECE resources across Chicago MSA changed as neighborhoods experienced SES ascent and descent. We find that SES ascent is associated with more ECE seats but only in the urban core of the MSA. Changes in licensed seats are driven by more center-based infant and toddler seats, but SES ascent correlates with more preschool-age license exempt seats. These patterns are clearer when we restrict our analyses to Cook County, where we also find changes in home-based seats across all age groups. In contrast, the ECE landscape in ZCTAs that experienced SES descent does not differ from stable ZCTAs. Taken together, these findings largely align with our predictions that an influx of high-SES parents may relate to more formal care options for their children. Moreover, these patterns persist and are exacerbated as ascending neighborhoods also experience increases in the share of White residents underscoring the interaction of neighborhood SES change with racial dynamics.
We find no association between SES change and the availability of Head Start programs, suggesting that while SES ascent may increase ECE options, it does not necessarily expand access to subsidized care for low-income families. On the one hand, these findings suggest that SES ascent may not be accompanied by reductions in ECE options for families with low incomes. On the other hand, the lack of changes in Head Start availability also occurring in SES descending areas raises questions about whether low-income families in these neighborhoods have adequate access to this safety net program. This finding could suggest that Head Start availability may be sufficient in these areas, that low-SES families in these neighborhoods are opting for public preschool options or other non-Head Start providers, or that they are using federal subsidies to access other types of providers. While research on subsidy use and neighborhood change is limited, prior work has shown subsidy use is higher in more formal settings (Rachidi 2016). Alternatively, lack of Head Start changes may also indicate supply-side constraints for the establishment of these programs in changing neighborhoods that we are unable to uncover. Given limitations in our data, we leave the exploration of these mechanisms and others that explain our null associations for future research.
Finally, while geographic patterns suggest that some ZCTAs became less underserved by ECE resources from 2009 to 2019, our regression analyses show no average change in ECE total or licensed capacity. This aligns with broader evidence of widespread ECE shortages in the United States (Smith and Owens 2023), where many parents face increasing difficulty securing child care, especially post-pandemic, due to a combination of provider closures and declines in the childcare workforce (Khattar and Coffey 2023; Lee and Parolin 2021). In this regard, the patterns displayed in Figure 3 are consistent with existing evidence for the MSA (Malik, Hamm and Schochet 2018).
Neighborhood ascent in urban cores is strongly associated with changes in the racial/ethnic composition of residents, with predominantly White higher-SES populations entering predominantly non-White, specifically Black, neighborhoods (Owens and Candipan 2019). Results from our descriptive mapping suggest that this pattern is evident in Chicago, as well. Given the racial patterning of neighborhood SES ascent, our results should be interpreted in light of these dynamics, with implications for racial equity. Our findings align with prior work showing that gentrification often yields uneven benefits: improvements often accrue to White residents and more advantaged newcomers, while racialized minority residents face diminished access to neighborhood institutions (Gibbons and Barton 2016; Rucks-Ahidiana 2022; Hwang and Ding 2020). While much of this research on the consequences of gentrification focuses on the impacts on older children and adults, our findings suggest that the racialized inequities corresponding with neighborhood ascent may begin much earlier in the life course. The finding that resources for infants and toddlers increase in ascendant neighborhoods underscores how racial stratification intersects with neighborhood change processes to shape opportunity structures from the very start of children's lives.
It is important to note, as well, that the structure of ECE provision in the United States reflects a longstanding tension between public responsibility and private delivery (Kamerman and Gatenio-Gabel 2007; Cohen 1996). Publicly funded systems such as Head Start and state pre-K operate within mixed-delivery frameworks that rely heavily on private providers. Our findings underscore this tension and raise important equity implications. As neighborhoods experience SES ascent, the expansion of privately delivered ECE may enhance options for families with greater resources while doing little to strengthen publicly accountable systems that serve lower-income families. These dynamics highlight how the organization of ECE supply is not politically neutral but rather reflects broader questions about who bears responsibility for ensuring equitable access to early education.
Implications
Our analyses shed light on how SES change varies by location in the Chicago MSA. Specifically, we show that SES ascent is most common in the city of Chicago and surrounding areas within Cook County. These are ZCTAs where the association between SES ascent and ECE resources is clearest. This may be the case because neighborhood ascent in urban areas takes on a certain form, specifically gentrification, which has features that distinguish it from ascent in non-urban neighborhoods. By contrast, non-urban neighborhoods are more likely to start out at a higher SES, remain at a higher SES status, and are more likely to experience shallower improvements and declines, which indicates lower population turnover with regard to resident SES status (Airgood-Obrycki 2019). There may also be differences in the demand for local ECE services between urban and non-urban neighborhoods. If high-SES (or low-SES) parents in ascending suburban neighborhoods commute to city jobs and rely on childcare near their workplaces instead of locally, non-urban neighborhoods may experience fewer changes in ECE resources compared to urban neighborhoods, regardless of whether they are undergoing SES ascent or descent.
Our study has implications for the school and neighborhood change literature, which often overlooks early childhood education. Similar to evidence from K–12 research, which generally finds associations between neighborhood change and K–12 school access and enrollment, neighborhood SES ascent correlates with changes in the ECE landscape. The implication is that the reach of neighborhood change in influencing access to school-based resources extends to the pre-K environment, suggesting that parental school choices may have already been influenced well before the enrollment of their students in the elementary grades. Future work should aim to understand the consequences of these changes for the demographic composition of classrooms, building on our baseline findings. Considering evidence on SES and racial and ethnic segregation in many preschool classrooms (Stockstill 2023; Edara, Hollett and Frankenberg 2025), understanding whether neighborhood change exacerbates (or not) this situation would be an important task for future research. Furthermore, more research is needed to understand the racial implications of changing patterns in ECE access as a consequence of neighborhood change processes. Importantly, while we account for the availability of school-based public pre-K programs, future work should try to understand if changes in the ECE private sector depend on whether high-SES parents in ascending neighborhoods are able to access public school-based options, as well as whether their preferences change when children reach elementary school.
Limitations
First, our analyses use ZCTAs, which have been typically used in ECE research, but may be too large to adequately capture the ECE market in specific neighborhoods. Second, our study only examines changes in the Chicago MSA. The processes and dynamics of neighborhood SES change and the dynamics of the ECE sector may play out differently in other MSAs across the country. Future work with access to national-level data could examine variation across MSAs, as well as analyze whether patterns we observe in this study hold across other regional contexts. Relatedly, while we conducted analyses focused on Cook County as the urban core, it is possible that the changes we document in the county are driven by dynamics specific to the city of Chicago that we are unable to separate. Third, while our study can speak to measures of supply and access to ECE resources within ZCTAs, we do not have detailed measures to examine other important processes. For example, SES change may be associated with variation in quality. While we are able to speak to changes in the number of licensed providers and seats, considered a rough measure of quality (Bassok and Galdo 2016), we lack detailed measures of process quality within ECE classrooms. This is important because process quality measures (e.g., child–teacher interactions) have been linked with positive child outcomes (McCoy et al. 2015). To the extent that SES ascent is not only associated with changes in supply and access but also in quality, it could have important implications for educational equity among young children. Fourth, we do not have information on childcare subsidy use and ECE ascent could also alter which providers accept these subsidies and who uses them. Fifth, we lack measures that allow us to understand the demographic composition of teachers and students across ECE providers and how neighborhood SES ascent affects it. Finally, from a methodological standpoint, our study period is long enough to capture changes in both neighborhood SES and the supply of ECE services, which are likely to lag behind SES ascent. However, if changes in the ECE supply occur over a longer time span than our study period, our results would understate the true magnitude of the associations.
Conclusion
This study contributes to urban and educational research by providing new insights into the complex relationship between neighborhood change and educational resources by focusing on the ECE sector. While our study is descriptive in aims, it establishes baseline findings that can guide future work. Researchers could build on this work by identifying causal mechanisms and assessing the broader implications of these changes for educational equity among young children. As more neighborhoods across the United States experience socio-demographic transformation, understanding the impact of these changes on educational access will become increasingly important for policymakers and practitioners alike.
Supplemental Material
sj-pdf-1-uar-10.1177_10780874261459332 - Supplemental material for The Early Childhood Care and Education Landscape in Ascending Neighborhoods
Supplemental material, sj-pdf-1-uar-10.1177_10780874261459332 for The Early Childhood Care and Education Landscape in Ascending Neighborhoods by Agustina Laurito, Jennifer Candipan and Noli Brazil in Urban Affairs Review
Footnotes
Funding
The authors disclosed receipt of the following financial support for the research, authorship, and/or publication of this article: Agustina Laurito and Noli Brazil received no financial support for this research. Jennifer Candipan is grateful to the Population Studies and training Center at Brown University, which receives funding from the NIH (P2C HD041020), for general support.
Declaration of Conflicting Interests
The authors declared no potential conflicts of interest with respect to the research, authorship, and/or publication of this article.
Data Availability Statement
All data used in this paper are publicly available. A replication package is available from the corresponding author.
Supplemental Material
Supplemental material for this article is available online.
Notes
Author Biographies
References
Supplementary Material
Please find the following supplemental material available below.
For Open Access articles published under a Creative Commons License, all supplemental material carries the same license as the article it is associated with.
For non-Open Access articles published, all supplemental material carries a non-exclusive license, and permission requests for re-use of supplemental material or any part of supplemental material shall be sent directly to the copyright owner as specified in the copyright notice associated with the article.