






Abstract
Introduction
To ensure the efficient use of chemotherapy drugs, chemotherapy wastage is an area that can be investigated. This study aims to quantify current parenteral chemotherapy wastage and estimate parenteral chemotherapy wastage when dose banding is executed, using a chemotherapy wastage calculator in an ambulatory cancer centre. The study also examines the variables that significantly predict the total cost of chemotherapy wastage, investigates the reasons for wastage, and explores opportunities to reduce wastage.
Methods
Data were collected from the pharmacy in National Cancer Centre Singapore over 9 months retrospectively. Chemotherapy wastage is the sum of wastage in the preparation phase and potential wastage in the administration phase. The calculator was created using Microsoft Excel and generated chemotherapy wastage in terms of cost and amount (mg) and analysed the reasons for potential wastage.
Results
The calculator reported a total of 2.22 million mg of chemotherapy wastage generated over 9 months, amounting to $2.05 million (Singapore Dollars, SGD). Regression analysis found that the cost of drug was the only independent variable that significantly predicted the total cost of chemotherapy wastage (P = 0.004). The study also identified low blood count (625 [29.06%]) as the top reason for potential wastage and no-show ($128,715.94 [15.97%]) as the reason that incurred the highest cost of potential wastage.
Conclusion
The pharmacy has generated a considerable amount of chemotherapy wastage over 9 months. Interventions in both the preparation and administration phases are required to reduce chemotherapy wastage. The use of the chemotherapy wastage calculator in pharmacy operations could guide efforts to reduce chemotherapy wastage.
Keywords
Introduction
Rising chemotherapy needs, 1 coupled with increasing chemotherapy drug costs,2–4 prompts the need for more efficient use of chemotherapy drugs to reduce the burden of cancer on patients and healthcare institutions. 5 Chemotherapy wastage can be investigated to address this6–8 and was found to cost an estimated $1.8 billion (United States Dollars, USD) annually in the United States of America (USA) alone. 8 Another study found the cost of chemotherapy wastage to be 17.14% of the total expenditure on drugs in 1 year. 9 The cost savings generated from addressing chemotherapy wastage can be diverted to improve patients’ access to novel chemotherapy drugs and enhance patient care, therefore highlighting the need to reduce chemotherapy wastage. 10
In 2019, NHS England developed a chemotherapy waste calculator to automate the calculation of waste, which largely considers wastage due to patient-related factors that occur during the administration phase such as patient cancellation. 11 There is a need to explore the development of a chemotherapy waste calculator that can account for other reasons for wastage, such as wastage produced during the preparation phase due to improper vial size.8,9,12
Current practices to reduce general drug wastage in pharmacies include limiting drug amounts in stock, collecting unused medications and performing medication reviews with patients. 13 To address chemotherapy wastage, Hatswell et al. have developed a calculator to optimise vial size of parenteral chemotherapy to minimise wastage across a patient population. 14 In addition, specific practices such as vial-sharing and dose banding are often employed. Vial-sharing is defined as the sharing of single-use vials for multiple patients under aseptic conditions 15 and has been demonstrated to minimise chemotherapy wastage.8,9,12 Dose banding refers to a system whereby drug doses are calculated, grouped and rounded to a set of pre-defined doses. 16 Each series of consecutive dose(s) is called a ‘band’, with the dose to which they are rounded towards being the ‘banded dose’. It has been shown to reduce chemotherapy wastage17– 19 and was also introduced by NHS England as a national programme to reduce this wastage. 20
This study focuses on the parenteral chemotherapy wastage generated at the National Cancer Centre Singapore (NCCS), a cancer speciality centre in Singapore. Within the Pharmacy Department, vial-sharing is currently implemented to reduce chemotherapy wastage. There are also existing efforts to quantify chemotherapy wastage. However, the process can be further improved to not only quantify but to also estimate the amount of chemotherapy wastage when an intervention is executed and assess the extent of change in chemotherapy wastage. In this study, the intervention of concern would be dose banding.
Hence, this study aims to quantify current parenteral chemotherapy wastage and estimate parenteral chemotherapy wastage when dose banding is executed, using a chemotherapy wastage calculator in an ambulatory cancer centre. This calculator would account for wastage in the preparation and administration phase. The study also examines the variables that significantly predict the total cost of chemotherapy wastage, investigates the reasons for wastage, and explores opportunities to reduce wastage.
Methodology
Study design
This is a cross-sectional study conducted at NCCS Oncology Pharmacy and quantified chemotherapy wastage between June 2021 and February 2022 (9 months) retrospectively.
Data collection
Data from June 2021 to February 2022 were extracted from the Drug Return Form (Appendix 1), the institution's prescribing system (MOSAIQ®) and drug formulary. A flowchart illustrating the workflow for the data collection and data analysis sections is shown in Figure 1.
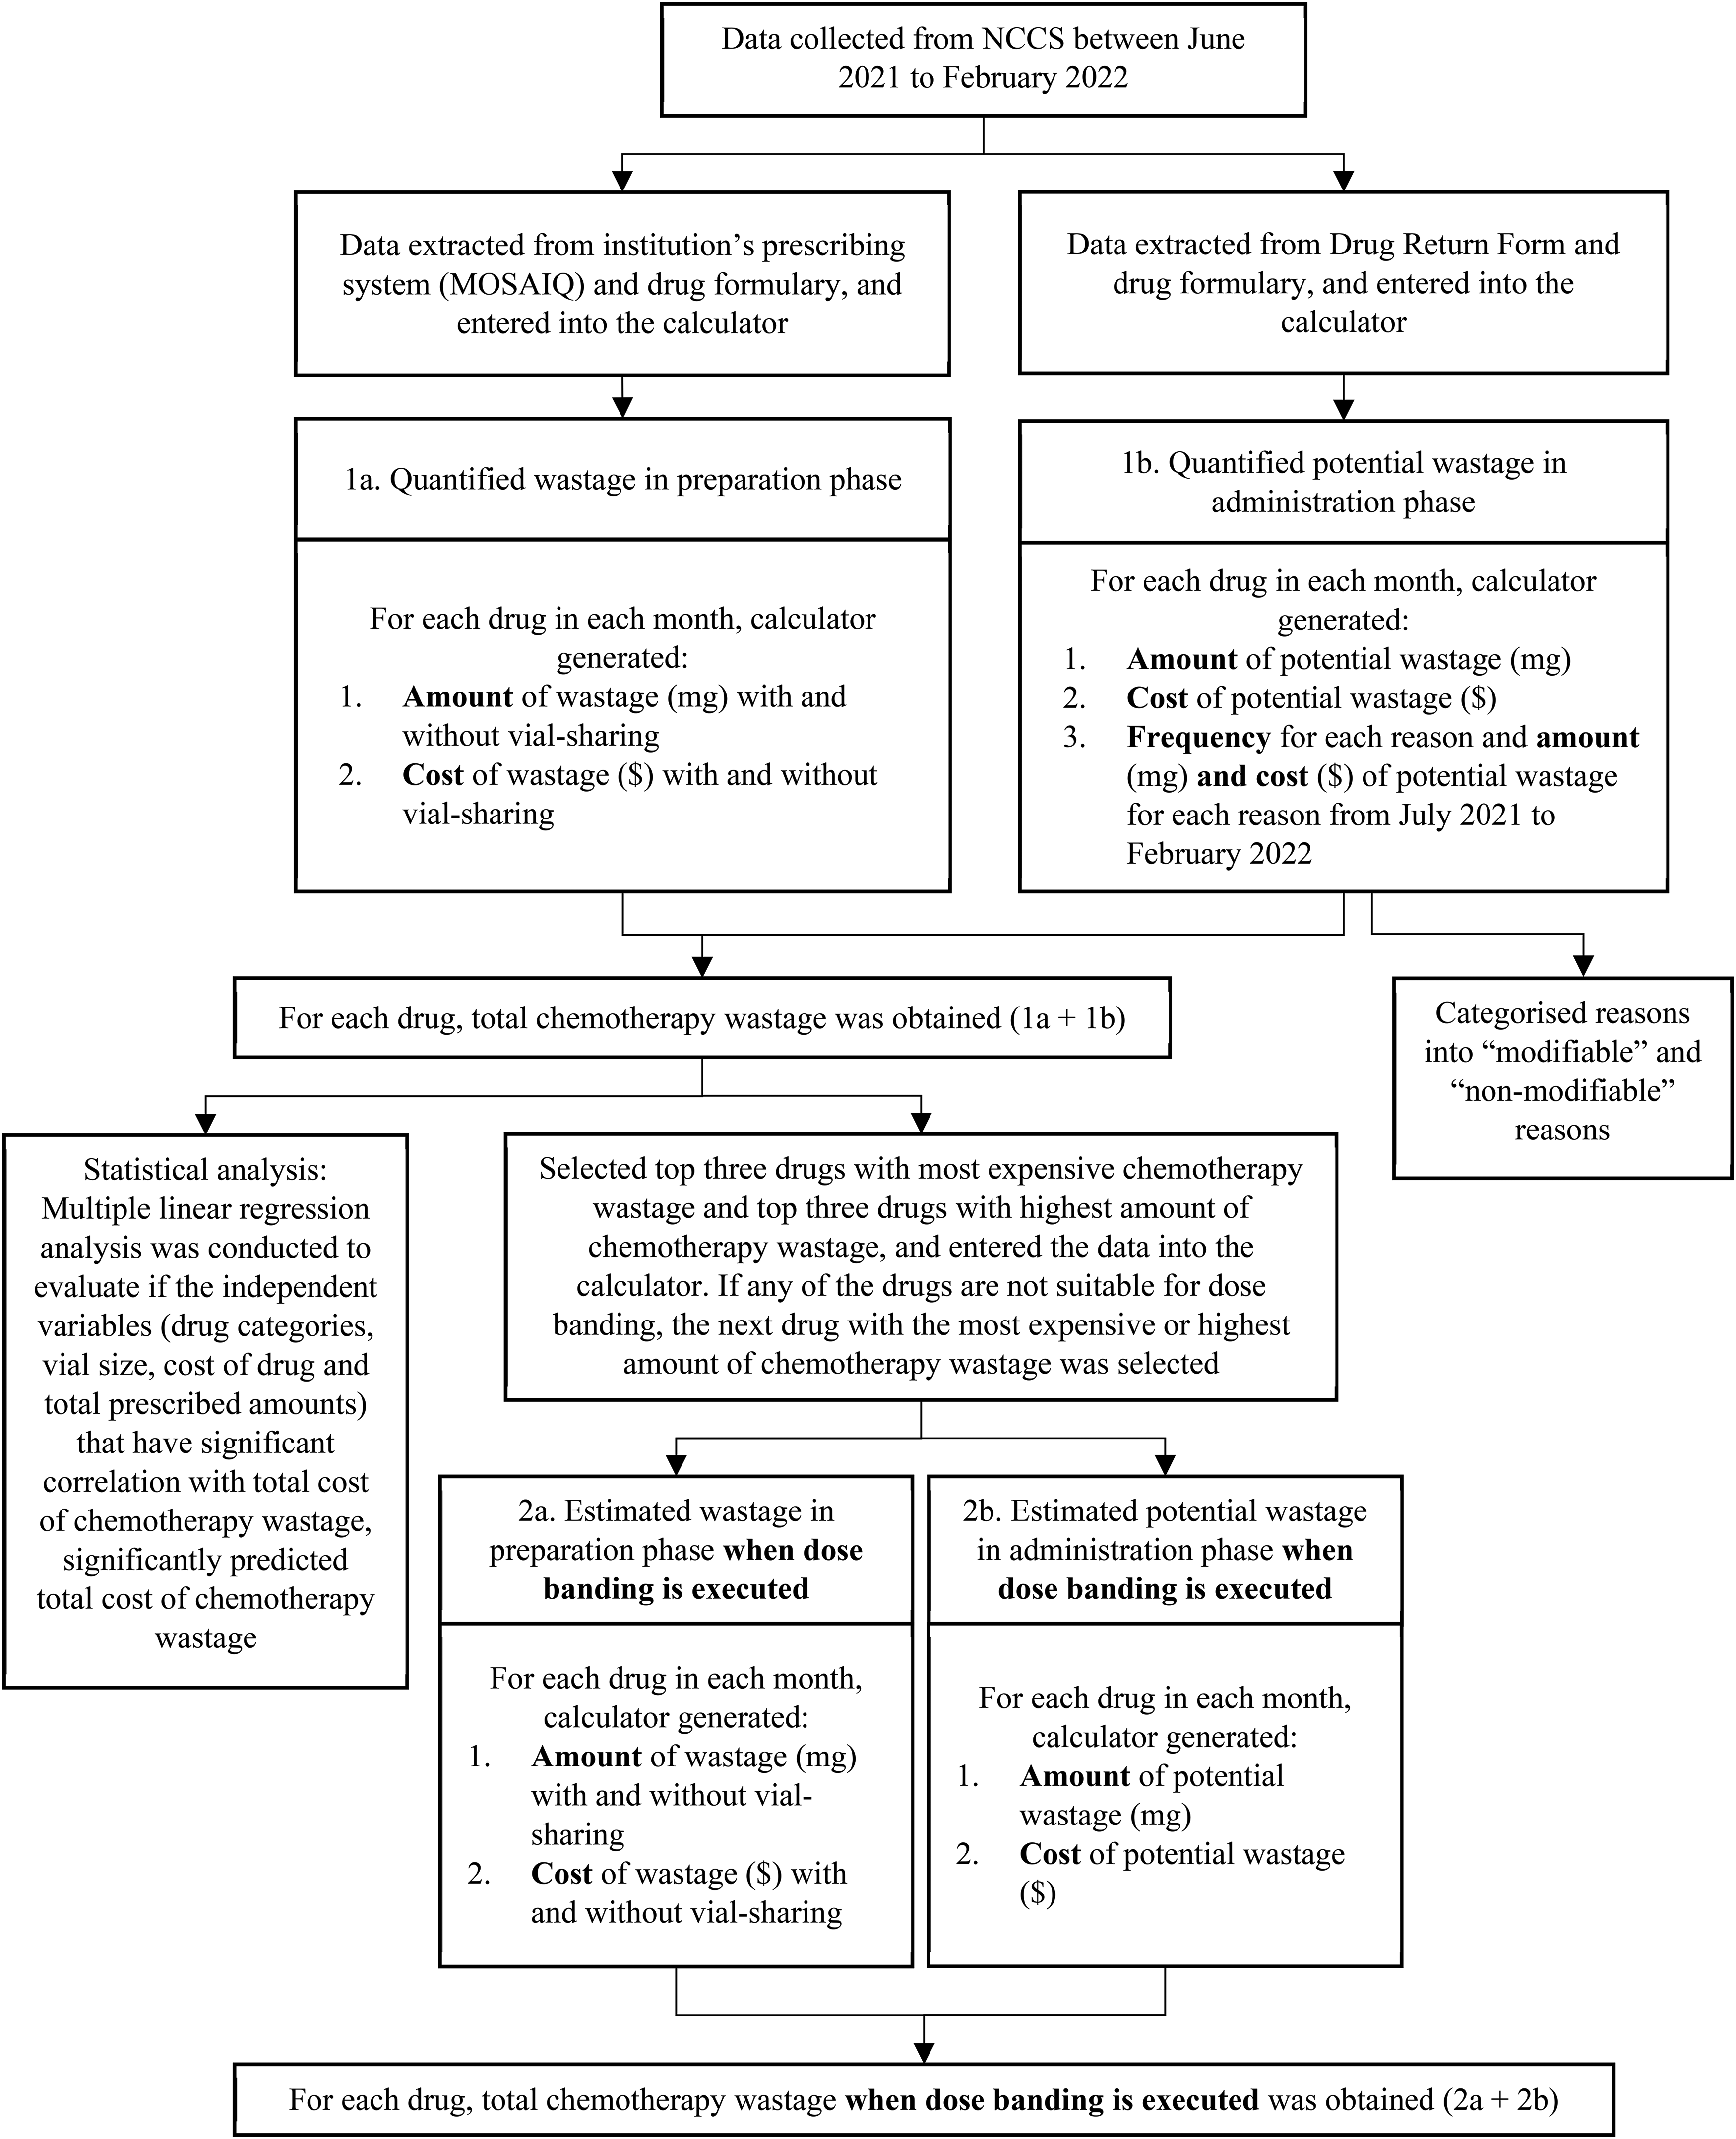
Flowchart illustrating the workflow for data collection and data analysis sections.
The Drug Return Form is recorded by pharmacists working in NCCS and contains the list of drugs that were not successfully administered to its original patient and therefore returned to the pharmacy – i.e. potential wastage (refer to Appendix 2 for definitions). The list of prescribed amounts for each drug, date of administration, vial size and cost of drug per vial were extracted from MOSAIQ® and the drug formulary. Should the institution have multiple vial sizes for each drug, the smallest vial size was used in the calculation. The cost of purchasing the drug was extracted in February 2022 and was assumed to remain unchanged throughout the study period. This study included a total of 35 drugs, according to the drugs returned during the study period.
Data analysis
Descriptive statistics were used to summarise chemotherapy wastage. For nominal data, frequency and proportion were reported.
The chemotherapy wastage calculator was developed using Microsoft 365 Excel Spreadsheet Software during the study period. It contains the Drug Return Form and other functions necessary to input and analyse the collected data (Appendix 3). The calculation methods were cross-checked by two senior pharmacists from NCCS to ensure completeness and accuracy.
The calculator contains two main parts:
Quantifying chemotherapy wastage Estimating chemotherapy wastage, when dose banding is executed.
Statistical analyses were conducted using IBM SPSS Statistics v27.0 on Windows.
Quantifying chemotherapy wastage
The list of prescribed amounts (mg) for each drug, date of administration, vial size and cost of drug were entered into the calculator to generate wastage in the preparation phase in terms of amount (mg) and cost per mg. Wastage with and without vial-sharing was calculated to provide a holistic comparison.
The data from the Drug Return Form, vial size and cost of drug were entered into the calculator to generate potential wastage in the administration phase in terms of amount (mg) and cost per mg.
Summing the wastage in the preparation phase and potential wastage in the administration phase for each drug gives the total chemotherapy wastage. The top three drugs with the most expensive chemotherapy wastage and highest amount (mg) of chemotherapy wastage respectively were selected for dose banding. If any of the drugs are not suitable for dose banding, the next drug with the most expensive or highest amount (mg) of chemotherapy wastage respectively was selected.
Estimating chemotherapy wastage, when dose banding is executed
The calculator estimated wastage in the preparation phase and potential wastage in the administration phase for the top three drugs in both categories in terms of amount (mg) and cost per mg, using dose bands from NHS England's National Dose Banding Tables. 21
Reasons for potential wastage
The calculator calculated the frequency for each reason and the potential wastage for each reason, in terms of amount (mg) and cost ($) from July 2021 to February 2022 based on the Drug Return Form. Reasons for potential wastage in June were excluded in this calculation as they were incomplete. The reasons recorded by the pharmacists in the Drug Return Form were further categorised by the study team member into ‘modifiable’ and ‘non-modifiable’ and sub-categorised by the nature of the reason to streamline opportunities to reduce wastage (Appendix 2).
Regression analysis
The 35 drugs were categorised into either small molecule drugs (n = 21) or biologics (n = 14). Correlation analysis was conducted to evaluate if drug categories (biologics versus small molecule drugs), vial size, cost of drug and total prescribed amounts (mg) are significantly correlated to the total cost of chemotherapy wastage using either Spearman rank correlation. Multiple linear regression analysis was then conducted with the independent variables that has a significant correlation to evaluate if they significantly predicted the total cost of chemotherapy wastage.
Results
Quantifying chemotherapy wastage
Between June 2021 and February 2022 (9 months), the calculator calculated a total of 52,748 chemotherapy preparations prepared and 28.5 million mg of chemotherapy drugs prescribed to patients for 35 drugs (Table 1; see Appendix 4 for supplementary data). The calculator also reported a total of 2.22 million mg of chemotherapy wastage generated during the study period, amounting to $2.05 million. Based on the data, 2.63% of the total available drug in milligrams was wasted in the preparation phase while 5.07% of the total prescribed amount (mg) was potentially wasted in the administration phase (Appendix 4). Vial-sharing helped the pharmacy to save $1.88 million. Approximately 55% of the total cost of chemotherapy wastage was contributed by wastage in the preparation phase.
Total chemotherapy wastage (with or without vial-sharing) for the top few drugs in terms of amount (mg) and cost ($) from June 2021 to February 2022 (9 months).
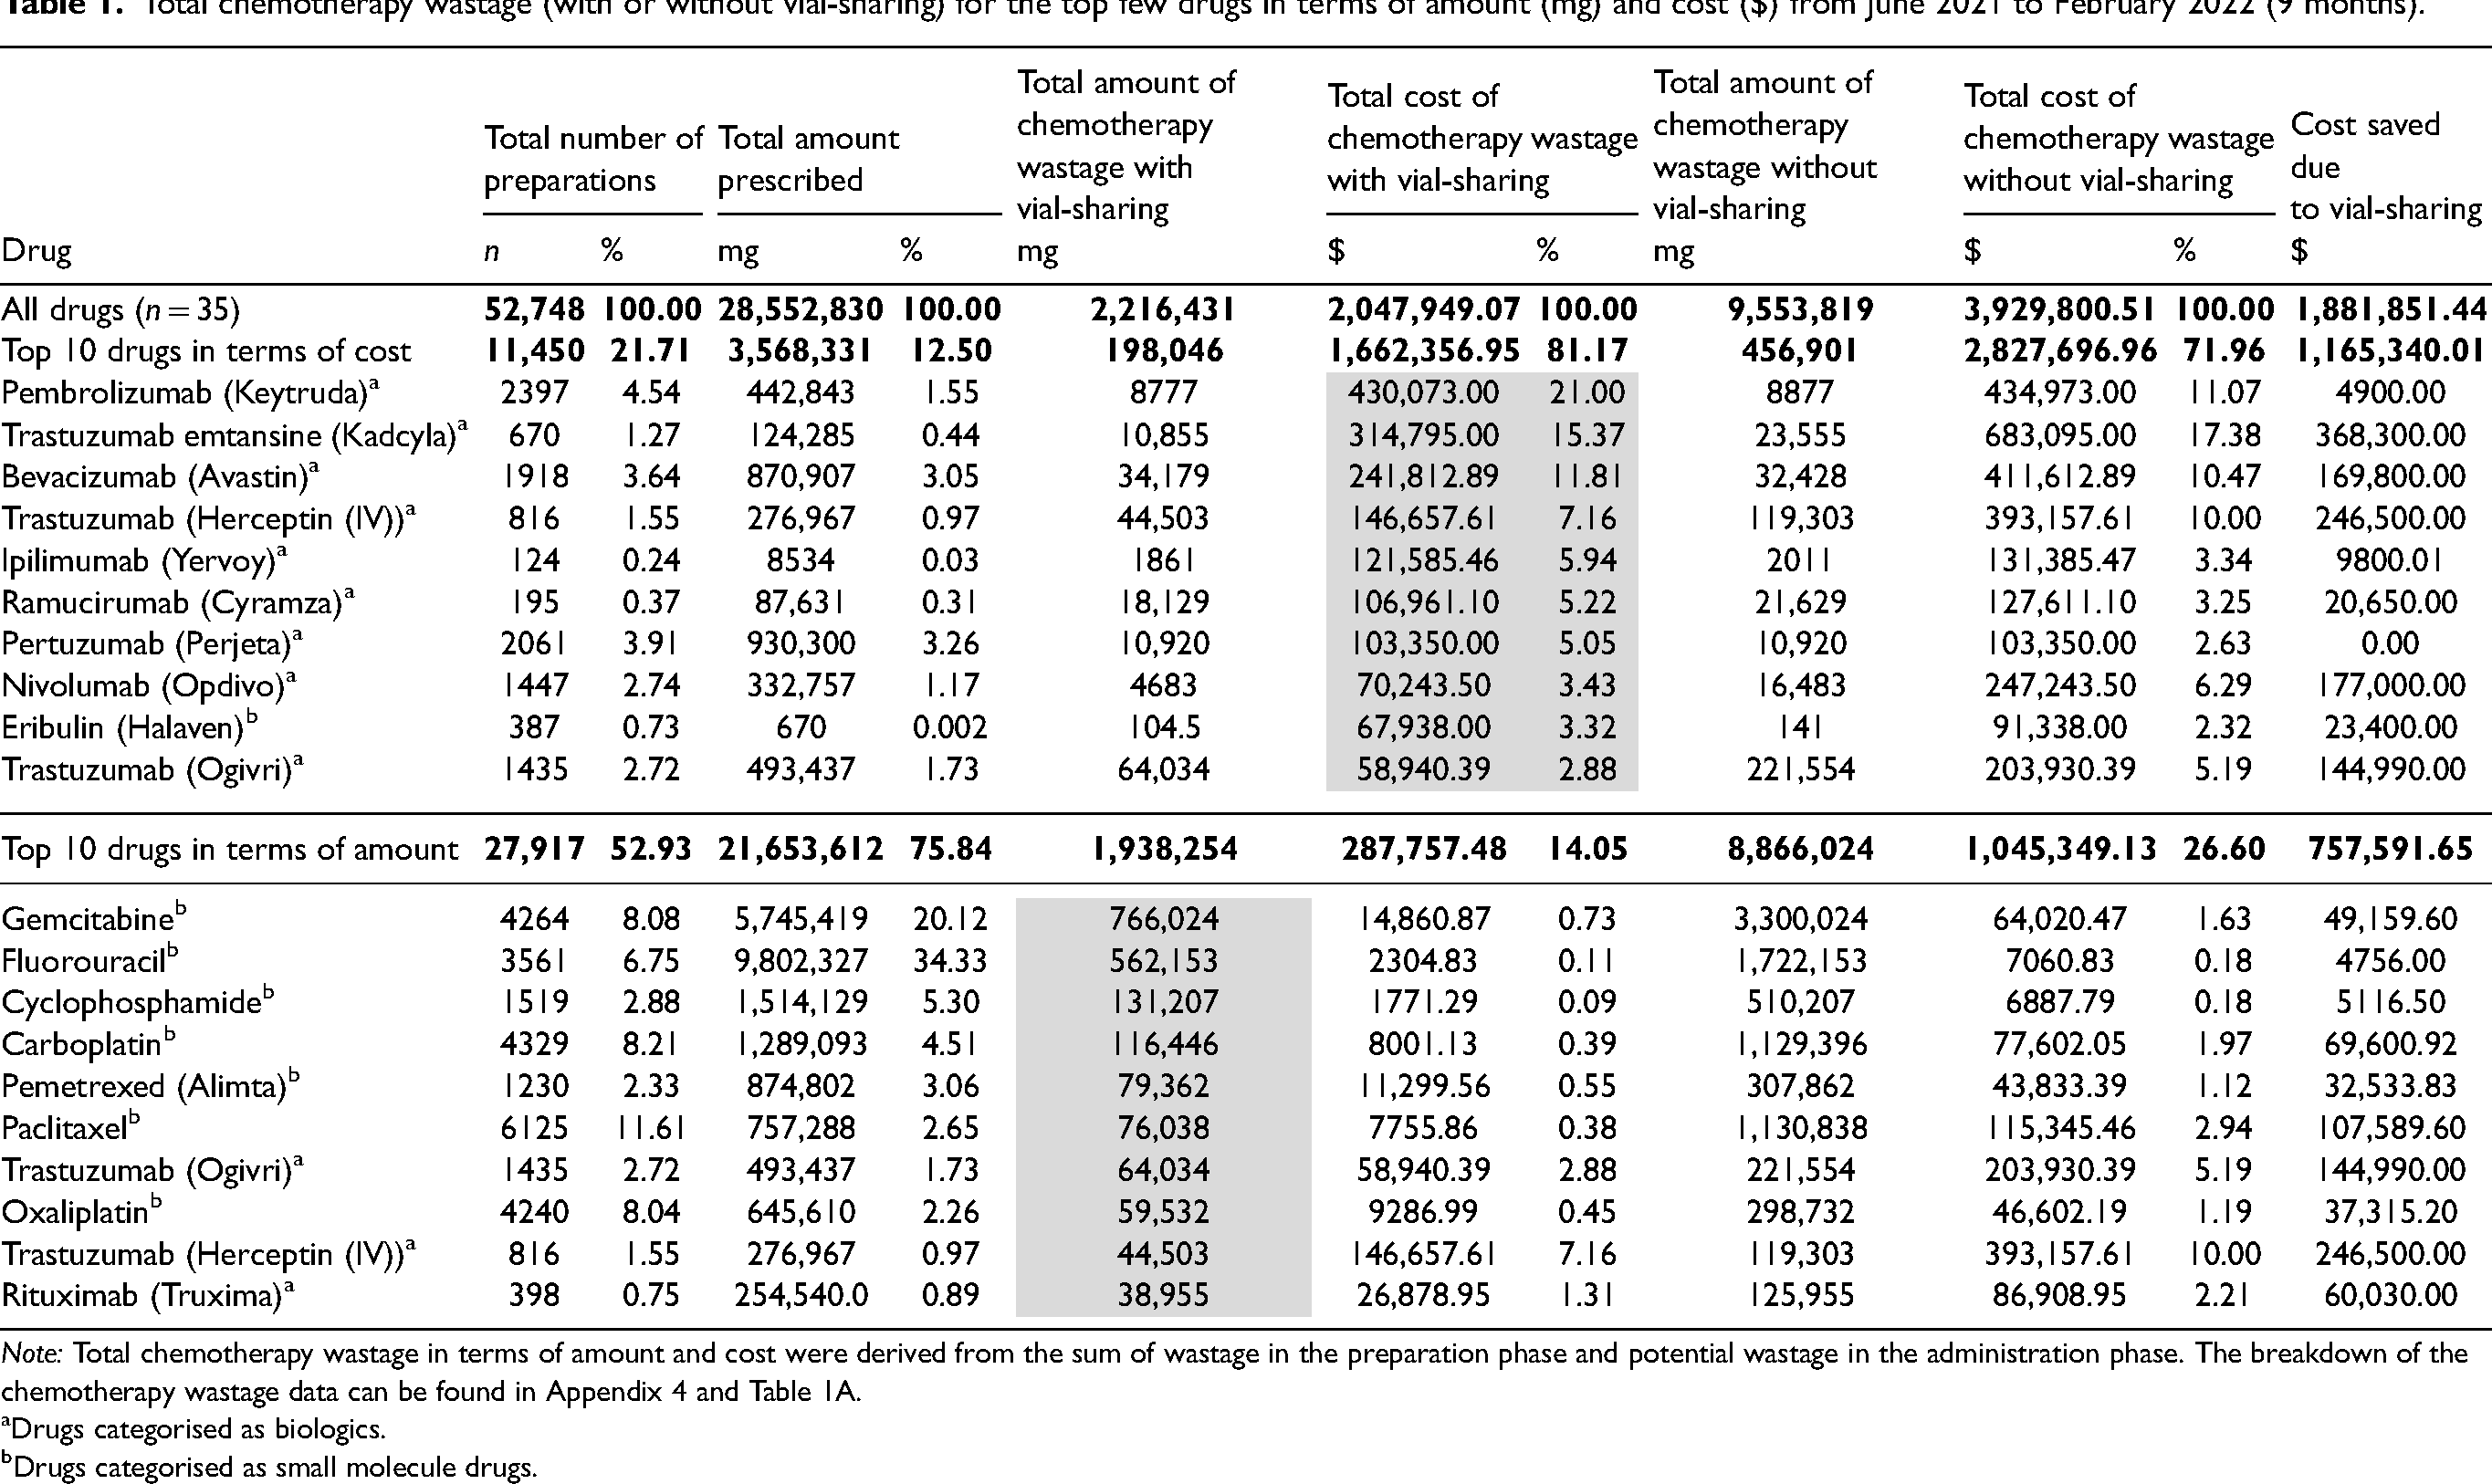
Note: Total chemotherapy wastage in terms of amount and cost were derived from the sum of wastage in the preparation phase and potential wastage in the administration phase. The breakdown of the chemotherapy wastage data can be found in Appendix 4 and Table 1A.
Drugs categorised as biologics.
Drugs categorised as small molecule drugs.
The top three drugs with the most expensive chemotherapy wastage are pembrolizumab (Keytruda) ($430,073.00 [21.00%]), trastuzumab emtansine (Kadcyla) ($314,795.00 [15.37%]) and bevacizumab (Avastin) ($241,812.89 [11.81%]) (Table 1). The top three drugs with the highest amount (mg) of chemotherapy wastage are gemcitabine (766,024 mg [34.56%]), fluorouracil (562,153 mg [25.36%]) and cyclophosphamide (131,207 mg [5.92%]).
Estimating chemotherapy wastage, when dose banding is executed
Although pembrolizumab is the top drug in terms of total cost of chemotherapy wastage, it is deemed not suitable for dose banding as it is often prescribed as a fixed dose of 200 mg in NCCS. Since trastuzumab (Herceptin (IV)) is ranked fourth in terms of total cost of chemotherapy wastage, it was selected for dose banding instead.
Based on the calculator, the total cost of chemotherapy wastage, with vial sharing, for trastuzumab emtansine (Kadcyla), bevacizumab (Avastin) and cyclophosphamide has decreased by 11.52%, 10.04% and 1.01% respectively, after dose banding is executed, while that of for trastuzumab (Herceptin (IV)), gemcitabine and fluorouracil has increased by 4.38%, 6.87% and 8.99% respectively, after dose banding is executed (Figure 2; see Appendix 4 for supplementary data).
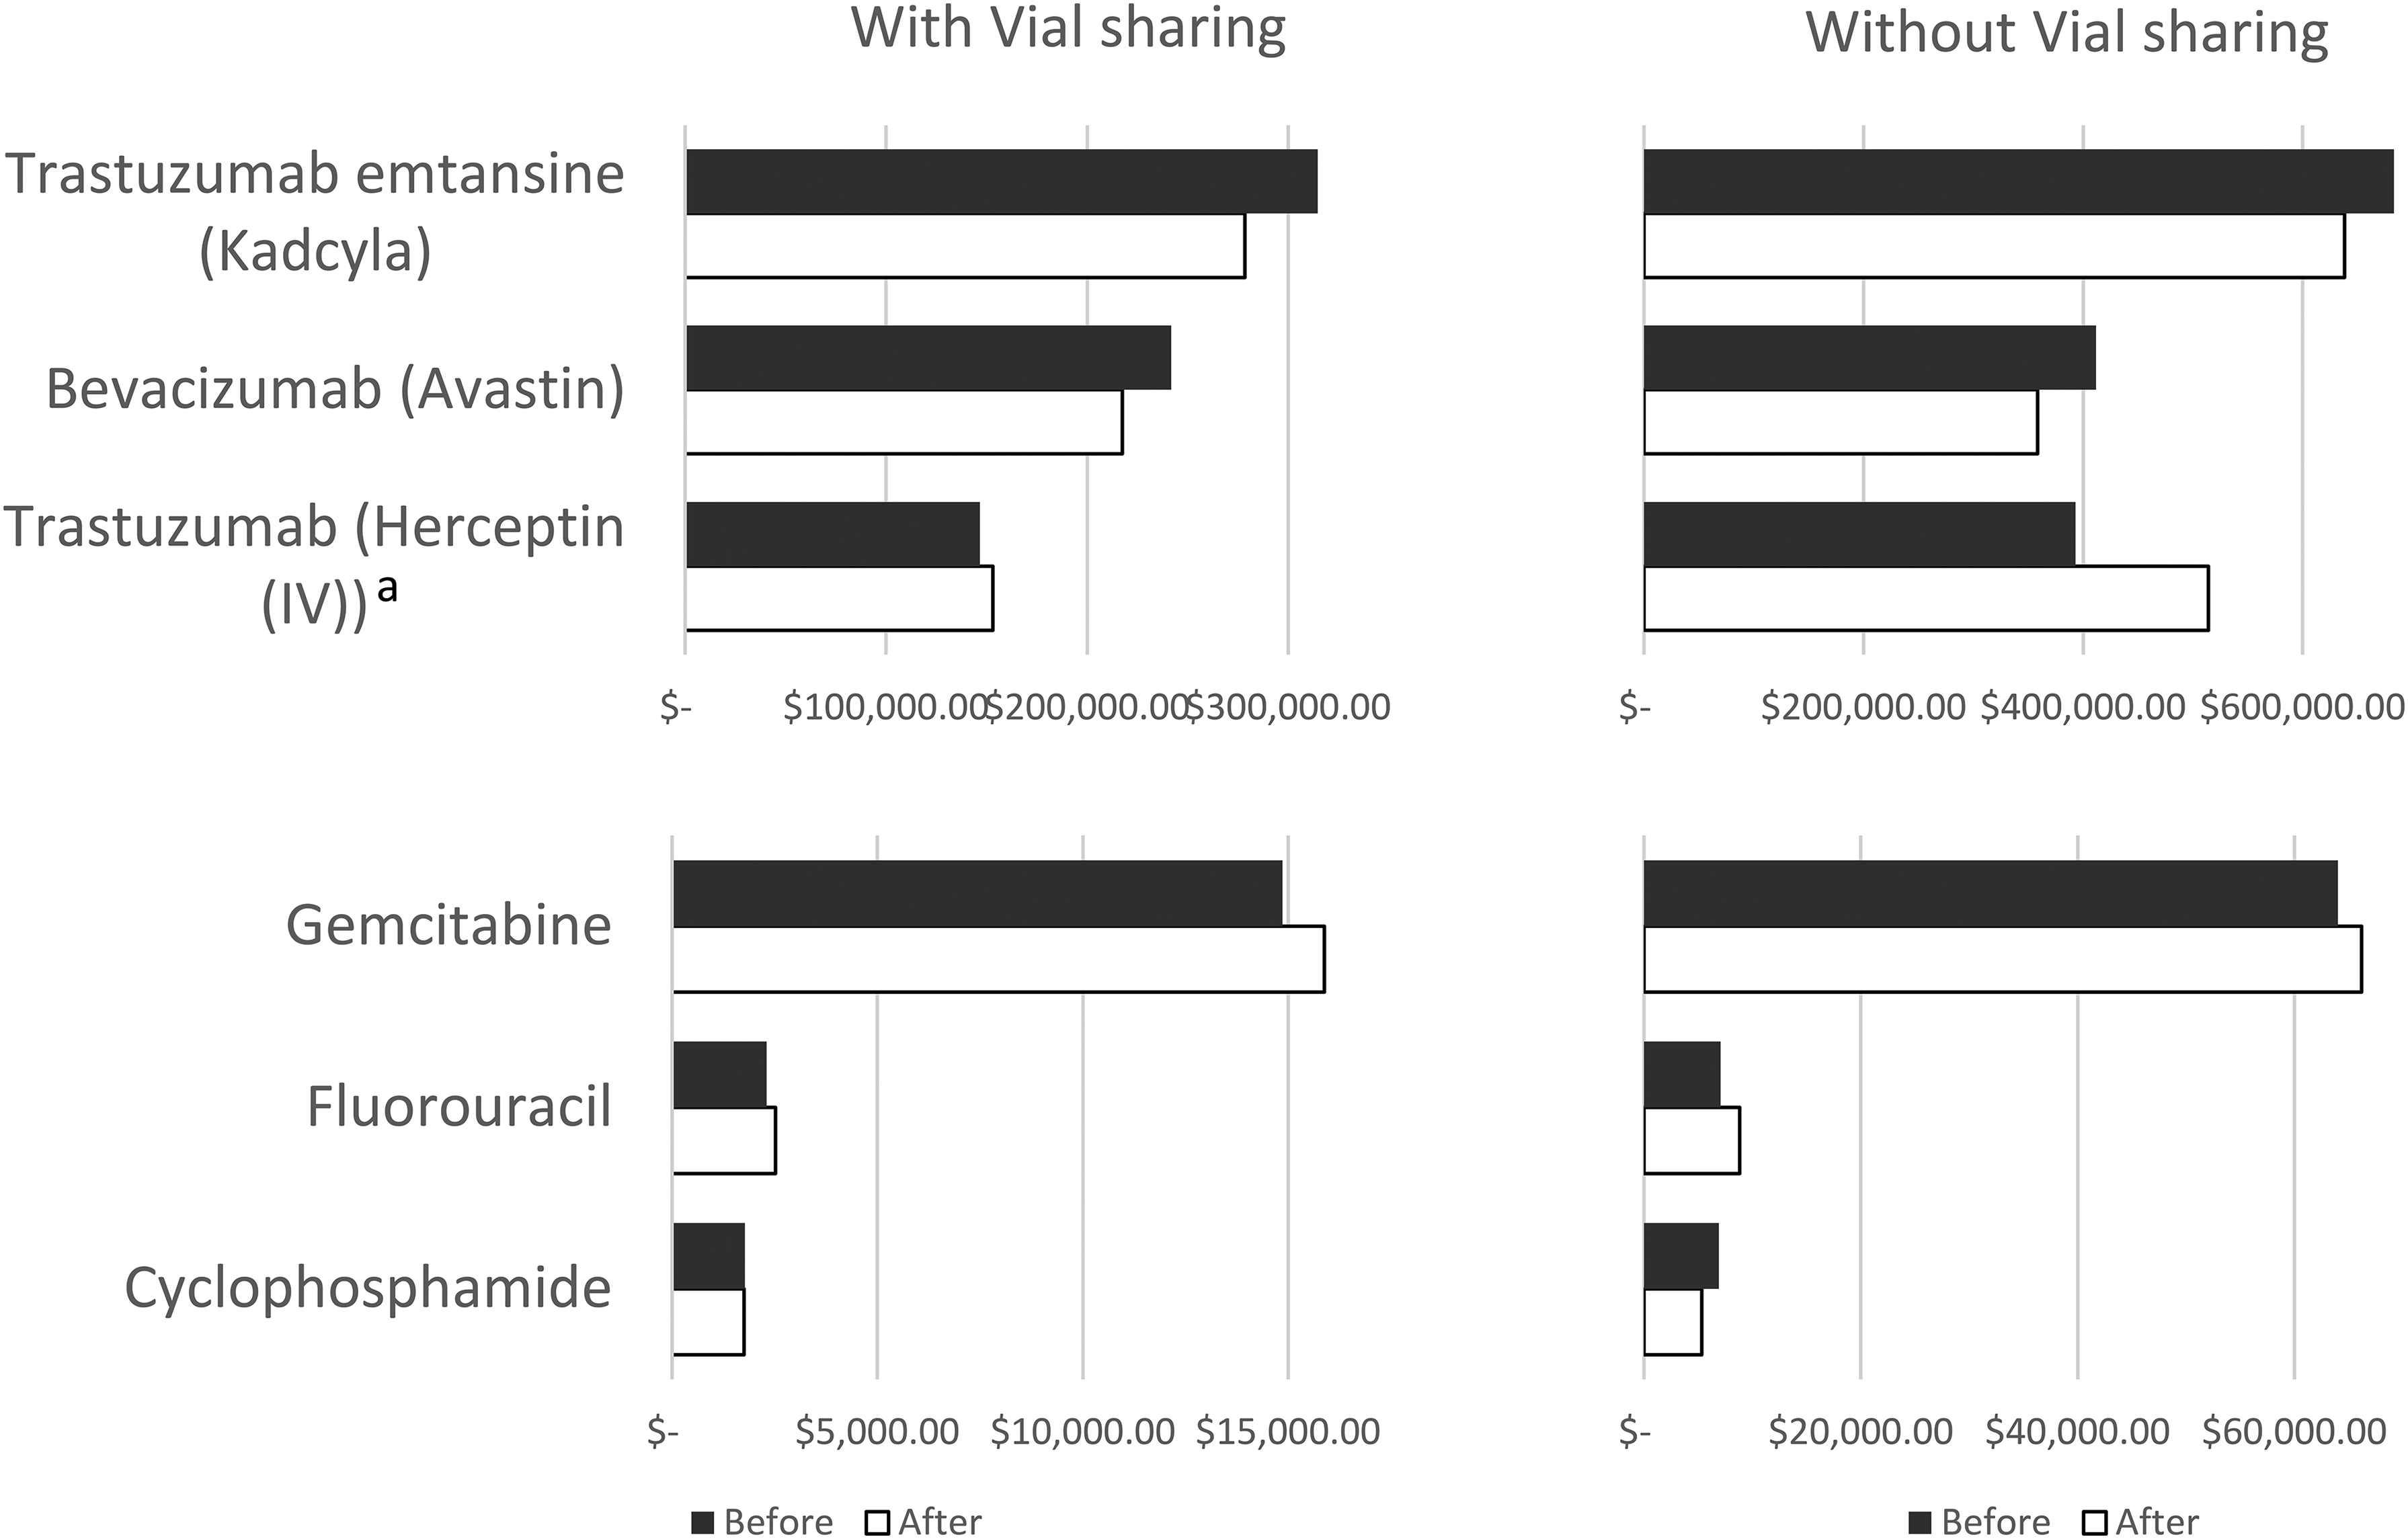
Cost of chemotherapy wastage (with vs. without vial sharing) from June 2021 to February 2022 (9 months), for top three most expensive and top three highest amount (mg) wastage before and after dose banding.
Reasons for potential wastage
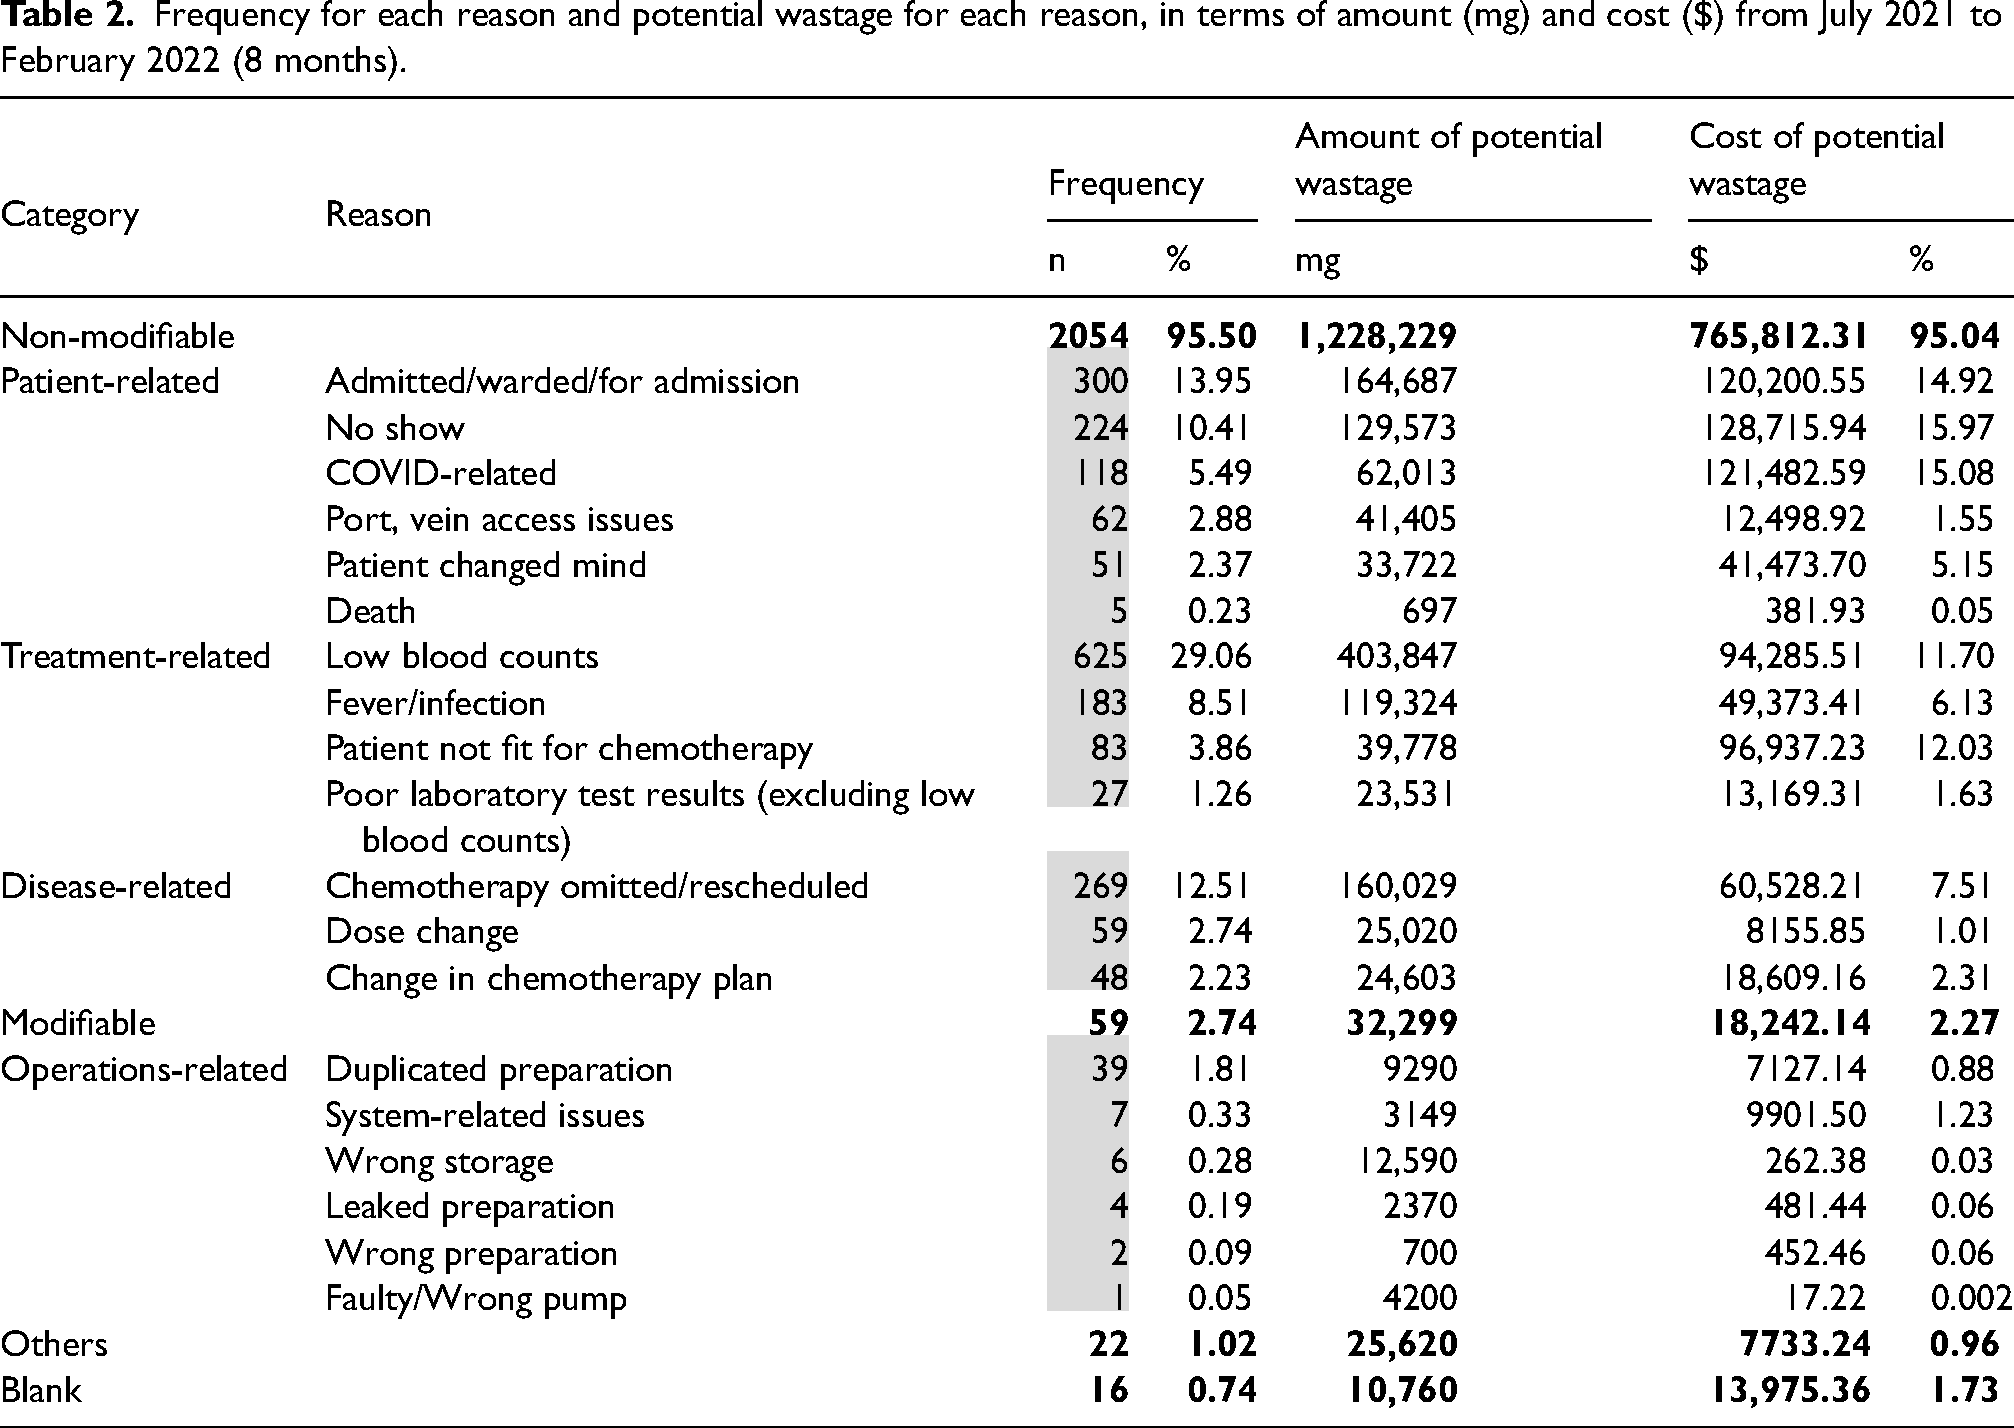
The top reason for potential wastage is low blood count (n = 625 [29.06%]) and the reason that incurred the highest cost of potential wastage is no show ($128,715.94 [15.97%]) (Table 2). Only 2.74% of the preparations were returned due to modifiable reasons. The top three modifiable reasons that incurred the highest cost of potential wastage are system-related issues ($9901.50 [54.28%]), duplicated preparation ($7127.14 [39.07%]) and leaked preparation ($481.44 [2.64%]).
Frequency for each reason and potential wastage for each reason, in terms of amount (mg) and cost ($) from July 2021 to February 2022 (8 months).
Regression analysis
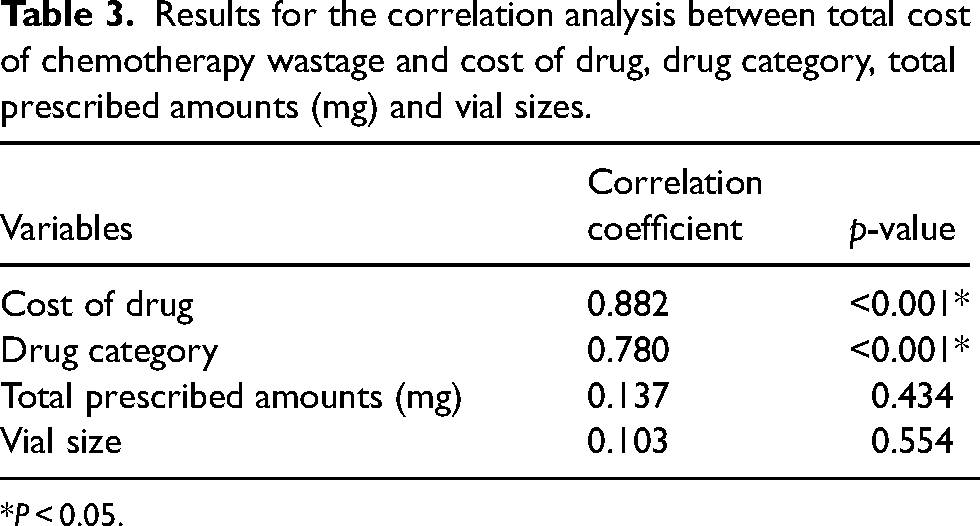
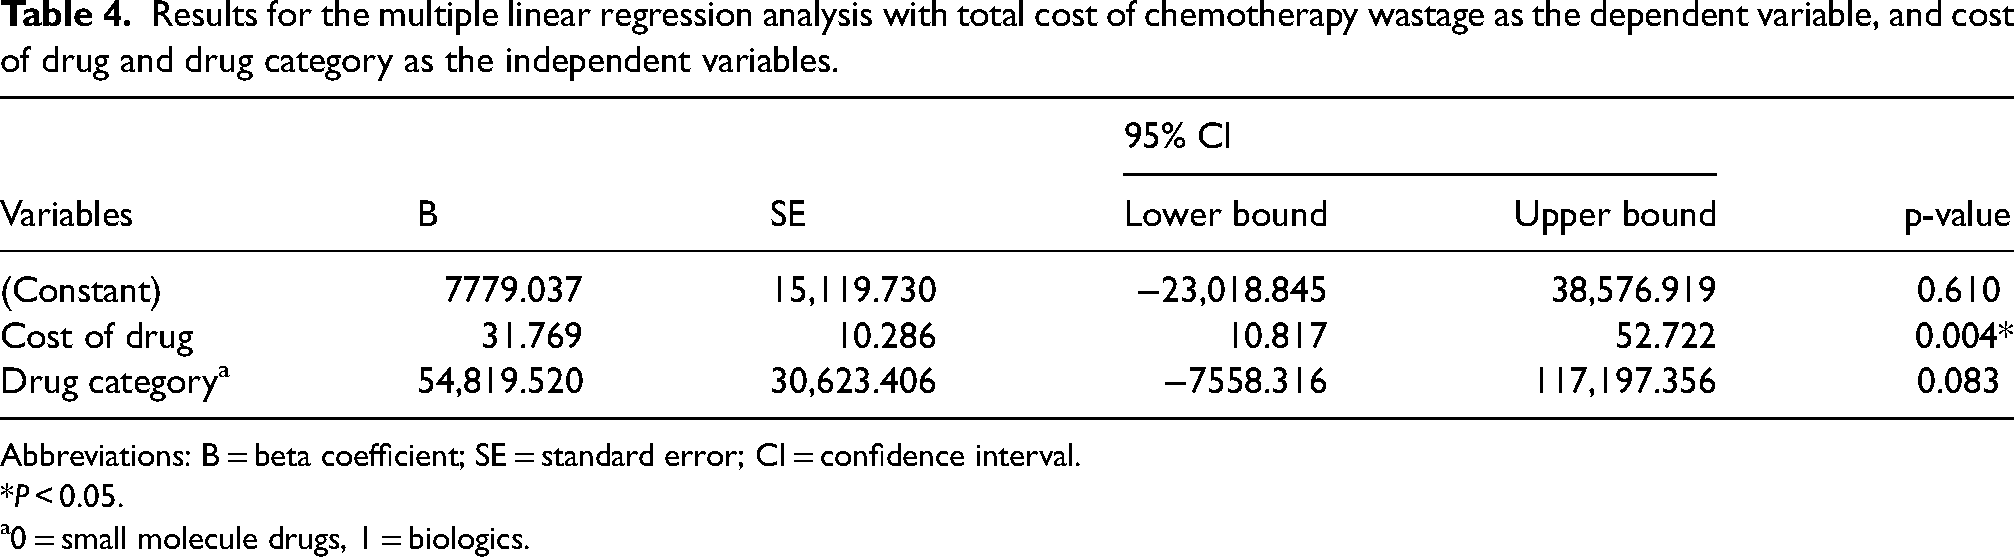
There was a significant positive correlation between drug category (r = 0.780, P < 0.001), cost of drug (r = 0.882, P < 0.001) and total cost of chemotherapy wastage. The other variables reported a non-significant positive correlation (Table 3). Multiple linear regression analysis was conducted with drug category and cost of drug as the independent variables (Table 4). At a significance level of 0.05, the overall regression was found to be statistically significant (R2 = 0.506, P < 0.001). Only cost of drug significantly predicted total cost of chemotherapy wastage (P = 0.004).
Results for the correlation analysis between total cost of chemotherapy wastage and cost of drug, drug category, total prescribed amounts (mg) and vial sizes.
*P < 0.05.
Results for the multiple linear regression analysis with total cost of chemotherapy wastage as the dependent variable, and cost of drug and drug category as the independent variables.
Abbreviations: B = beta coefficient; SE = standard error; CI = confidence interval.
*P < 0.05.
0 = small molecule drugs, 1 = biologics.
Discussion
The calculator reported a total of 2.22 million mg of chemotherapy wastage generated over 9 months, amounting to $2.05 million. Out of six drugs, only three drugs experienced a decrease in total cost of chemotherapy wastage after dose banding is executed. Regression analysis found that cost of drug was the only independent variable that significantly predicted total cost of chemotherapy wastage. Low blood count was identified as the top reason for potential wastage and no show as the reason that incurred the highest cost of potential wastage.
Quantifying chemotherapy wastage
The pharmacy has generated a considerable amount of chemotherapy wastage over 9 months. It was observed that the top few drugs with the most expensive chemotherapy wastage are biologics, while that of the highest amount (mg) of chemotherapy wastage are small molecule drugs. This could be because most biologics tend to be more expensive compared to small molecule drugs, 22 thereby resulting in a more costly chemotherapy wastage. The top few drugs with the highest amount (mg) of chemotherapy wastage were also more frequently prescribed in NCCS, as inferred from the higher total prescribed amounts (mg) and preparation counts. This may increase the opportunities for wastage to occur and was also observed in other studies.23,24
Based on the breakdown of the wastage data in the preparation and administration phase, the cost of chemotherapy wastage in the preparation phase was more than half of the total cost of chemotherapy wastage for 22 drugs. This shows that wastage in the preparation phase is more prominent – even with vial-sharing, improper vial size is still a key contributor to the chemotherapy wastage in NCCS and therefore, should be addressed. Nonetheless, the study has demonstrated substantial cost savings due to vial-sharing, which supports other studies that encourage the use of vial-sharing to reduce chemotherapy wastage.9,12,25
The annual drug expenditure for NCCS in 2021 was approximately $135 million. Thus, it can be deduced that the total chemotherapy wastage generated in NCCS is 2.02% of the annual drug expenditure. This study also showed that 2.63% of the total available drug was wasted in the preparation phase. Other studies that only investigated wastage from the preparation phase reported a chemotherapy wastage of 4.4% 26 and 19.72% of the total available drug, 9 and 8.3% of the total expenditure. 7 Some that only investigated potential wastage from the administration phase reported a chemotherapy wastage of 0.46% 27 and 3.51% of the total expenditure. 28 Chemotherapy wastage in NCCS appears to be generally smaller, considering how chemotherapy wastage in this study encompasses both wastage in the preparation phase and potential wastage in the administration phase. This could be due to differences in the methodology, compounding processes and regulations, and cancer demographics across the abovementioned studies.
The calculated chemotherapy wastage in this study is also not the true chemotherapy wastage generated due to the inclusion of potential wastage in the calculation. Most of the drugs on the Drug Return Form are actually re-processed for other orders. However, this study considers the worst-case scenario where returned drug preparations cannot be re-processed. Should this occur, potential wastage would translate to true wastage. This scenario would apply to compounding facilities which adopt the Good Manufacturing Practices and would be a standard adopted by NCCS by 2025.
Estimating chemotherapy wastage, when dose banding is executed
Dose banding does not always result in a reduction in chemotherapy wastage. The cost of chemotherapy wastage for trastuzumab (Herceptin (IV)), gemcitabine and fluorouracil after dose banding has increased as there is a mismatch in the banded doses and the vial size used. Since the study did not aim to investigate the appropriateness of the dose bands, it can only be concluded that different dose bands may result in different amounts (mg) of chemotherapy wastage. This is highly dependent on the commonly prescribed amounts (mg) and available vial sizes in the institution. With appropriate dose bands, it can potentially reduce chemotherapy wastage.17– 19 The creator of the dose bands should be aware of these and can leverage the calculator to determine the appropriate dose bands.
Exploring opportunities to reduce chemotherapy wastage
Based on reasons for potential wastage
Since approximately half of the total cost of chemotherapy wastage was contributed by potential wastage in the administration phase, the reasons for potential wastage should be addressed. Modifiable reasons that incurred the highest cost of wastage – system-related issues and duplicated preparations, should be focused on. However, the high cost of potential wastage due to system-related issues was largely contributed by one pembrolizumab return that cost $9,800, noting that pembrolizumab is a biologic that is more expensive than most small molecule drugs. Thus, the focus can be placed on reducing duplicated preparations.
Duplicated preparations are mostly caused by misplacement of preparations in the pharmacy. Preparations ready to be administered are currently placed on trolleys, organised by appointment dates and the last two digits of the patient's identification number. To prevent misplacement of the preparations, other than putting up reminders to ensure that the pharmacy staff arranges the preparations neatly, the pharmacy staff can also conduct daily checks to ensure that the preparations prepared are tallies with the prescriptions processed and that preparations are organised in the correct manner. Preparations can also be placed on larger trolleys to reduce the possibility of preparations being misplaced due to insufficient space on the trolleys.
However, the top few reasons with the highest frequency or incurred the highest cost of potential wastage are largely non-modifiable. Moreover, 95.49% of the preparations are returned due to non-modifiable reasons, amounting to $765,812.31. Therefore, changes in the non-pharmacy operations are required to tackle the non-modifiable reasons. Additionally, the practice of preparing orders in advance in the pharmacy may be responsible for the potential wastage caused by non-modifiable reasons. In NCCS, certain drugs with longer stability periods are often prepared one or more days in advance. While preparing orders in advance can reduce waiting time for patients, it is uncertain whether the patient would eventually turn up to receive the preparation. 29 By changing some non-pharmacy operations and increasing the certainty that patients would receive the preparation, potential wastage caused by non-modifiable reasons may be reduced.
For potential wastage caused by poor laboratory test results (including low blood count), the pharmacy can request patients whose appointments are spaced more than one-week apart to come a few days before the scheduled appointment to undergo the necessary laboratory tests. 29 Warr et al. suggested that baseline laboratory test performed up to 7 days prior to the chemotherapy would have detected nearly all significant changes. 30 Currently, some patients are scheduled to take the laboratory tests on the same day as the chemotherapy appointment. By receiving the results earlier, the pharmacy prepares only if the results are suitable, thereby reducing potential wastage.
For non-modifiable reasons that are patient-related such as no show, patient changed mind and COVID-related, and treatment-related reasons such as fever/infection and patient unfit for chemotherapy, an interactive short message service (SMS) can be sent to patients to confirm their appointment before the scheduled appointment. 31 Currently, all patients receive an SMS notification to remind them their chemotherapy appointment. A two-way interactive SMS can be sent one week before the appointment to provide some time for the patients to respond based on their current health condition and availability, thereby allowing the pharmacy to decide if they should prepare in advance. This may reduce potential wastage.
Based on other interventions
Other interventions can also be explored to reduce chemotherapy wastage, especially wastage in the preparation phase. This study has shown that dose banding can potentially reduce chemotherapy wastage, depending on the appropriateness of the dose bands. Dose rounding to the nearest vial size can also be considered if vial-sharing cannot be employed as it has been shown to minimise wastage in the preparation phase.17,32,33
A centralised chemotherapy compounding facility has also been shown to reduce wastage in the preparation phase as it allows for more efficient use of the leftovers in the vials.23,24,34 In NCCS, outpatient and inpatient orders are prepared in two different compounding facilities. A centralised facility can also address the issue of returned preparations caused by patients being admitted as the same preparation can now be used for the original patient, assuming the patient is still fit for chemotherapy.
Also, results from the regression analysis have shown that the most effective way to reduce the total cost of chemotherapy wastage would be to reduce the cost of drug. The institution may therefore make use of biosimilars as a method to reduce the cost of biologics.35– 37
Limitations
As this is a single-centre study, it may lack the external validity needed to produce generalisable results. Also, the cost of chemotherapy wastage is potentially overestimated due to the theoretical nature of the calculated wastage in the preparation phase and the assumption that only the smallest vial size was used. In reality, not all the leftovers are discarded at the end of the day due to the different stability periods. There could also be multiple combinations of the different vial sizes to prepare the drug. However, this is only applicable to a few drugs used in the study such as pembrolizumab (Keytruda) and nivolumab (Opdivo). For most drugs, the vial size used in the calculation is the only vial size in the pharmacy. Additionally, the preparations were assumed to be prepared on the day of administration in the calculation of wastage in the preparation phase, yet this may not be true as the pharmacy tends to prepare at least one day in advance for drugs with longer stability periods.
The chemotherapy wastage calculator is subjected to human errors as data is largely entered by the end users. This may result in a subsequent inaccurate calculation of data. To prevent changes made to any of the formulas used which may further exacerbate the inaccuracy of the calculation in this case, specific parts of the calculator are protected with a password that only designated pharmacy staff have access to.
Conclusion
In conclusion, this study showed that the NCCS Oncology Pharmacy has generated a considerable amount of chemotherapy wastage from June 2021 to February 2022, using a chemotherapy wastage calculator. To reduce chemotherapy wastage, interventions in the preparation and administration phase are required. Dose banding may be useful in reducing chemotherapy wastage, depending on the appropriateness of the dose bands in the institution. The use of the chemotherapy wastage calculator in pharmacy operations could potentially be a time-saving and cost-effective initiative that would guide efforts in reducing chemotherapy wastage.
Supplemental Material
sj-docx-1-opp-10.1177_10781552231178678 - Supplemental material for Quantifying chemotherapy wastage in an ambulatory cancer centre in Singapore
Supplemental material, sj-docx-1-opp-10.1177_10781552231178678 for Quantifying chemotherapy wastage in an ambulatory cancer centre in Singapore by Jun Qi Chan, Jo Lene Leow, Lay Mui Poh, Peter Yap and Lita Chew in Journal of Oncology Pharmacy Practice
Footnotes
Author contribution
Study conception and design: CJQ, LJL, PLM, PY, LC; data collection: CJQ, LJL, PLM; analysis and interpretation of results: CJQ, LJL, PLM; draft manuscript preparation: CJQ, LJL, LC; all authors reviewed the results and approved the final version of the article.
Declaration of conflicting interests
The author(s) declared no potential conflicts of interest with respect to the research, authorship, and/or publication of this article.
Funding
The author(s) received no financial support for the research, authorship, and/or publication of this article.

Supplemental Material
Supplemental material for this article is available online.
References
Supplementary Material
Please find the following supplemental material available below.
For Open Access articles published under a Creative Commons License, all supplemental material carries the same license as the article it is associated with.
For non-Open Access articles published, all supplemental material carries a non-exclusive license, and permission requests for re-use of supplemental material or any part of supplemental material shall be sent directly to the copyright owner as specified in the copyright notice associated with the article.
