
Abstract
Background
Co-morbidity cancer and diabetes mellitus is a complex clinical issue due to the fact that cancer treatments, corticosteroid use, and polypharmacy can greatly interfere with glycemic control and predispose patients to the risk of metabolic complications and adverse drug events.
Objectives
The study is proposed to analyze the glycemic control patterns, examine the treatment-related factors impacting the metabolic variability, and to identify the drug-related problems to facilitate safer and more efficient treatment of the oncology patients with diabetes.
Methods
A prospective observational study design is conducted on 132 diabetic patients with diabetes mellitus who are oncology patients in a tertiary care setting. Descriptive and advanced statistical tests that assessed normality (Jarque-Bera, Lilliefors tests), categorical associations (exact test by Boschloo). Further, the non-parametric group and trend analysis (van der Waerden and Betsch-Ebner tests) are leveraged to gather and analyze the collected demographic, clinical, pharmacological, and biochemical parameters.
Results
The glycemic variables are found to have significant non-normal distribution (p < 0.05). The use of steroids is closely related to hyperglycemia (p = 0.006), whereas polypharmacy is significantly related to drug-related issues (p = 0.002). Mean fasting blood glucose level dropped to 130 mg/dl at discharge after 180 mg/dl at admission and the proportion of patients with good glycemic control increased to 99% as opposed to 65% at the time of admission.
Conclusion
The results indicate that oncology patients having diabetes face a high risk of glycemic labile caused by treatments, especially, corticosteroid exposure and combinations of complicated medications.
Keywords
Introduction
Some of the most common chronic illnesses in the world are cancer and diabetes mellitus, which is observed to co-exist in the same patient, but this has become more frequent because of the aging populations and rise in survival rates. 1 The cancer therapies have shown to severely interfere with glucose metabolism, and the prevalence of various malignancies through diabetes has been linked to breast, colorectal, pancreatic, and liver cancer treatment. Insulin resistance, chronic inflammation, oxidative stress, and altered growth factor signaling are the mechanisms by which the bidirectional interplay between these diseases occurs and facilitate tumor progression and metabolic instability. 2 Clinical practice, Oncology patients with diabetes should be excluded and constantly checked on their glycemic condition to avoid complications that could compromise their ability to tolerate or recover treatments. Nevertheless, regardless of the appreciation of this interaction, management of both conditions at the same time presents a considerable clinical challenge in the normal health care practice. 3
Several clinical trials 4 have examined the glycemic trends of cancer patients through the laboratory values of fasting blood glucose, postprandial levels of glucose, and glycated hemoglobin (HbA1c) as the routine measures of metabolic control. There is also an increasing use of continuous glucose monitoring systems and point-of-care glucometers in hospital settings to identify acute fluctuations in the course of chemotherapy. Along with metabolic surveillance, 5 scientists have investigated the effect of particular cancer interventions, such as corticosteroids, immunotherapy, and targeted therapy, on glucose homeostasis. The most common pharmacological management strategies that is investigated are insulin titration protocols, oral hypoglycemic agents, and combination therapy depending on the stage of cancer and nutritional status of the patient. Although such methods have enhanced the detection and management of dysglycemia, inconsistency in monitoring rates 6 and treatment changes across hospitals still affects patient outcomes and provides reasons to consider standard care pathways.
There has been a lot of interest in the assessment of the use of antidiabetic drugs 7 in the oncology pharmacy practice, especially to patients undergoing multi-drug chemotherapy regimens. The use of antidiabetic classes of metformin, sulfonylureas, DPP-4, and insulin in the setting of cancer treatment has also been studied regarding their safety and efficacy. Classification systems 8 such as Cipolle and Strand have also been used by researchers in identifying and classifying drug-related issues like inappropriate dosing, adverse drug reactions, therapeutic duplication, and drug to drug interactions. The methods of medication review and reconciliation are commonly researched in order to make treatment safer and minimize complications that can be avoided. Despite the proven value of such methods in enhancing medication compliance and error rates, 9 they are still being consistently incorporated into clinical practice in the sphere of oncology, especially in health services with limited resources.
Meanwhile, most of the studies examined steroid-induced hyperglycemia 10 because corticosteroids are commonly leveraged in the field of oncology.It is ofen studied in antiemetic prophylaxis therapy, in the treatment of cerebral edema, and as a component of combination chemotherapy regimens. Clinical studies 11 have demonstrated that glucocorticoids raise hepatic gluconeogenesis, diminish peripheral glucose intake, and destroy pancreatic beta-cell activity, which leads to acute or chronic hyperglycemia. Furthermore, the insulin-based correction programs, sliding-scale and basal-bolus therapy is considered in various observational and intervention research in prevailing approaches. This determines the effectiveness of various intervention modalities in the treatment of steroid-associated glycemic variants. 12 Moreover, some studies in recent times have studied how individual patient factors such as age, the duration of diabetes, nutrition status, and comorbidity influence the severity of hyperglycemia. Even if these improvements are made, the inconsistency in steroid dosage regimes and personal metabolism usually makes it difficult to predict and maintain glycemic changes in cancer patients on time.
Moreover, with the increasing awareness of the presence of metabolic complications 13 in cancer patients, the prevailing studies focusses on the role of multidisciplinary care in the treatment of cancer patients.This is done by introducing oncologists, endocrinologists, and clinical pharmacists to enhance the treatment outcomes. Potential observational research studies 14 are actively used to obtain the actual world information about the glycemic patterns, medication use, and clinical outcome during active cancer treatment. These researches are leveraged to obtain profound information about the efficiency of current monitoring strategies and therapeutic intervention in a wide range of patients. Subsequently, numerous studies 15 concentrated on individual factors like glucose levels or a certain type of drug or drugs instead of giving a general evaluation that considers the personal attributes of the patient, patterns of cancer therapy, and issues related to drugs. Thus, to produce evidence that inform holistic and patient-centered clinical management measures, a systematic assessment of glycemic control and a safety of pharmacotherapy in a real oncological environment is needed. However, the information relating to the interplay between cancer treatment and glucose metabolism is increasingly available, there is a lack of prospective observational research. Most of studies fails inintegrating simultaneous measures of glycemic status, the pharmacotherapy trend of antidiabetic drugs, and drug issues as part of one oncology cohort.
Contribution of the research
To report these limitations, a through systematic examination of patient details, therapeutic protocols, and glycaemic patterns within a tertiary care oncology medical facility is done in this study. Therefore, the study is able to produce empirical evidence that is leveraged to facilitate safer and more efficient pharmacotherapeutic decision-making with the help of the subsequent core contributions given below,
In order to address the limitations associated with a retrospective study, the study incorporated a prospective observational design with a combination of clinical, biochemical and pharmacological data which could help conduct real time evaluation of glycemic variability and response to therapy in diabetic oncological patients. To address the deficiency of strong statistical modeling in earlier studies, the current study used a series of non-parametric and distributional tests to obtain a very clear analysis of non-normative clinical data and determine the significant relationships between the treatment variables and glycemic outcomes. To report the lack of assessment of the issues of drug misuse in the context of oncology, the study created a systematic model, analyzing corticosteroid use, polypharmacy, and comorbidities as a complex in order to make choices regarding therapeutic decisions in cancer patients with diabetes in a safer and personalized manner.
This work is structured in the following way. In this, Section 2 determines the literature review of the study on prevailing in oncology and indicates the gaps in the research. Section 3 delivers study design, data collection criteria as well as statistical framework. In Section 4, the discussion of the experiment and clinical results takes place. Finally, the research conclusions and its reference on future research are summarized in section 5.
Literature survey
A retrospective cohort study by
In a cohort study with a large scale population-based sampling,
A cohort study through the Korean National Health Insurance Service was carried out by
A multicenter retrospective cohort study by
Critical gaps in current research
Prevailingresearches on glycemic control in cancer patients has primarily focused on individual variables like hyperglycemia and specific antidiabetic intervention, or cancer-specific results.These works mostly offers a patient-based and comprehensive insight on metabolic management in cancer treatment. Several studies have utilized retrospective designs thus restricting causal inference and real-time applicability to clinical practice. Moreover, no standardized guidelines of continuous glucose monitoring, active treatment modification and systematic detection of drug-related issues in the oncology environment are present. The interaction between corticosteroid use, polypharmacy, and comorbidities and the glycemic variability in various stages of cancer and treatment cycles are under-reported in current literature. In addition, limited works are offered with regard to individualized intervention plans and integration of multidisciplinary care. The following gaps demonstrate the necessity of a prospective, multifaceted, and data-driven paradigm capable of facilitating early diagnosis, optimal clinical decision-making, and enhanced clinical outcomes of diabetic oncology patients.
Proposed research framework
The proposed research paradigm as presented in Figure 1 is developed as a structured, data-based analysis model to analyze glycemic control dynamics in diabetic cancer patients in a comprehensive manner.
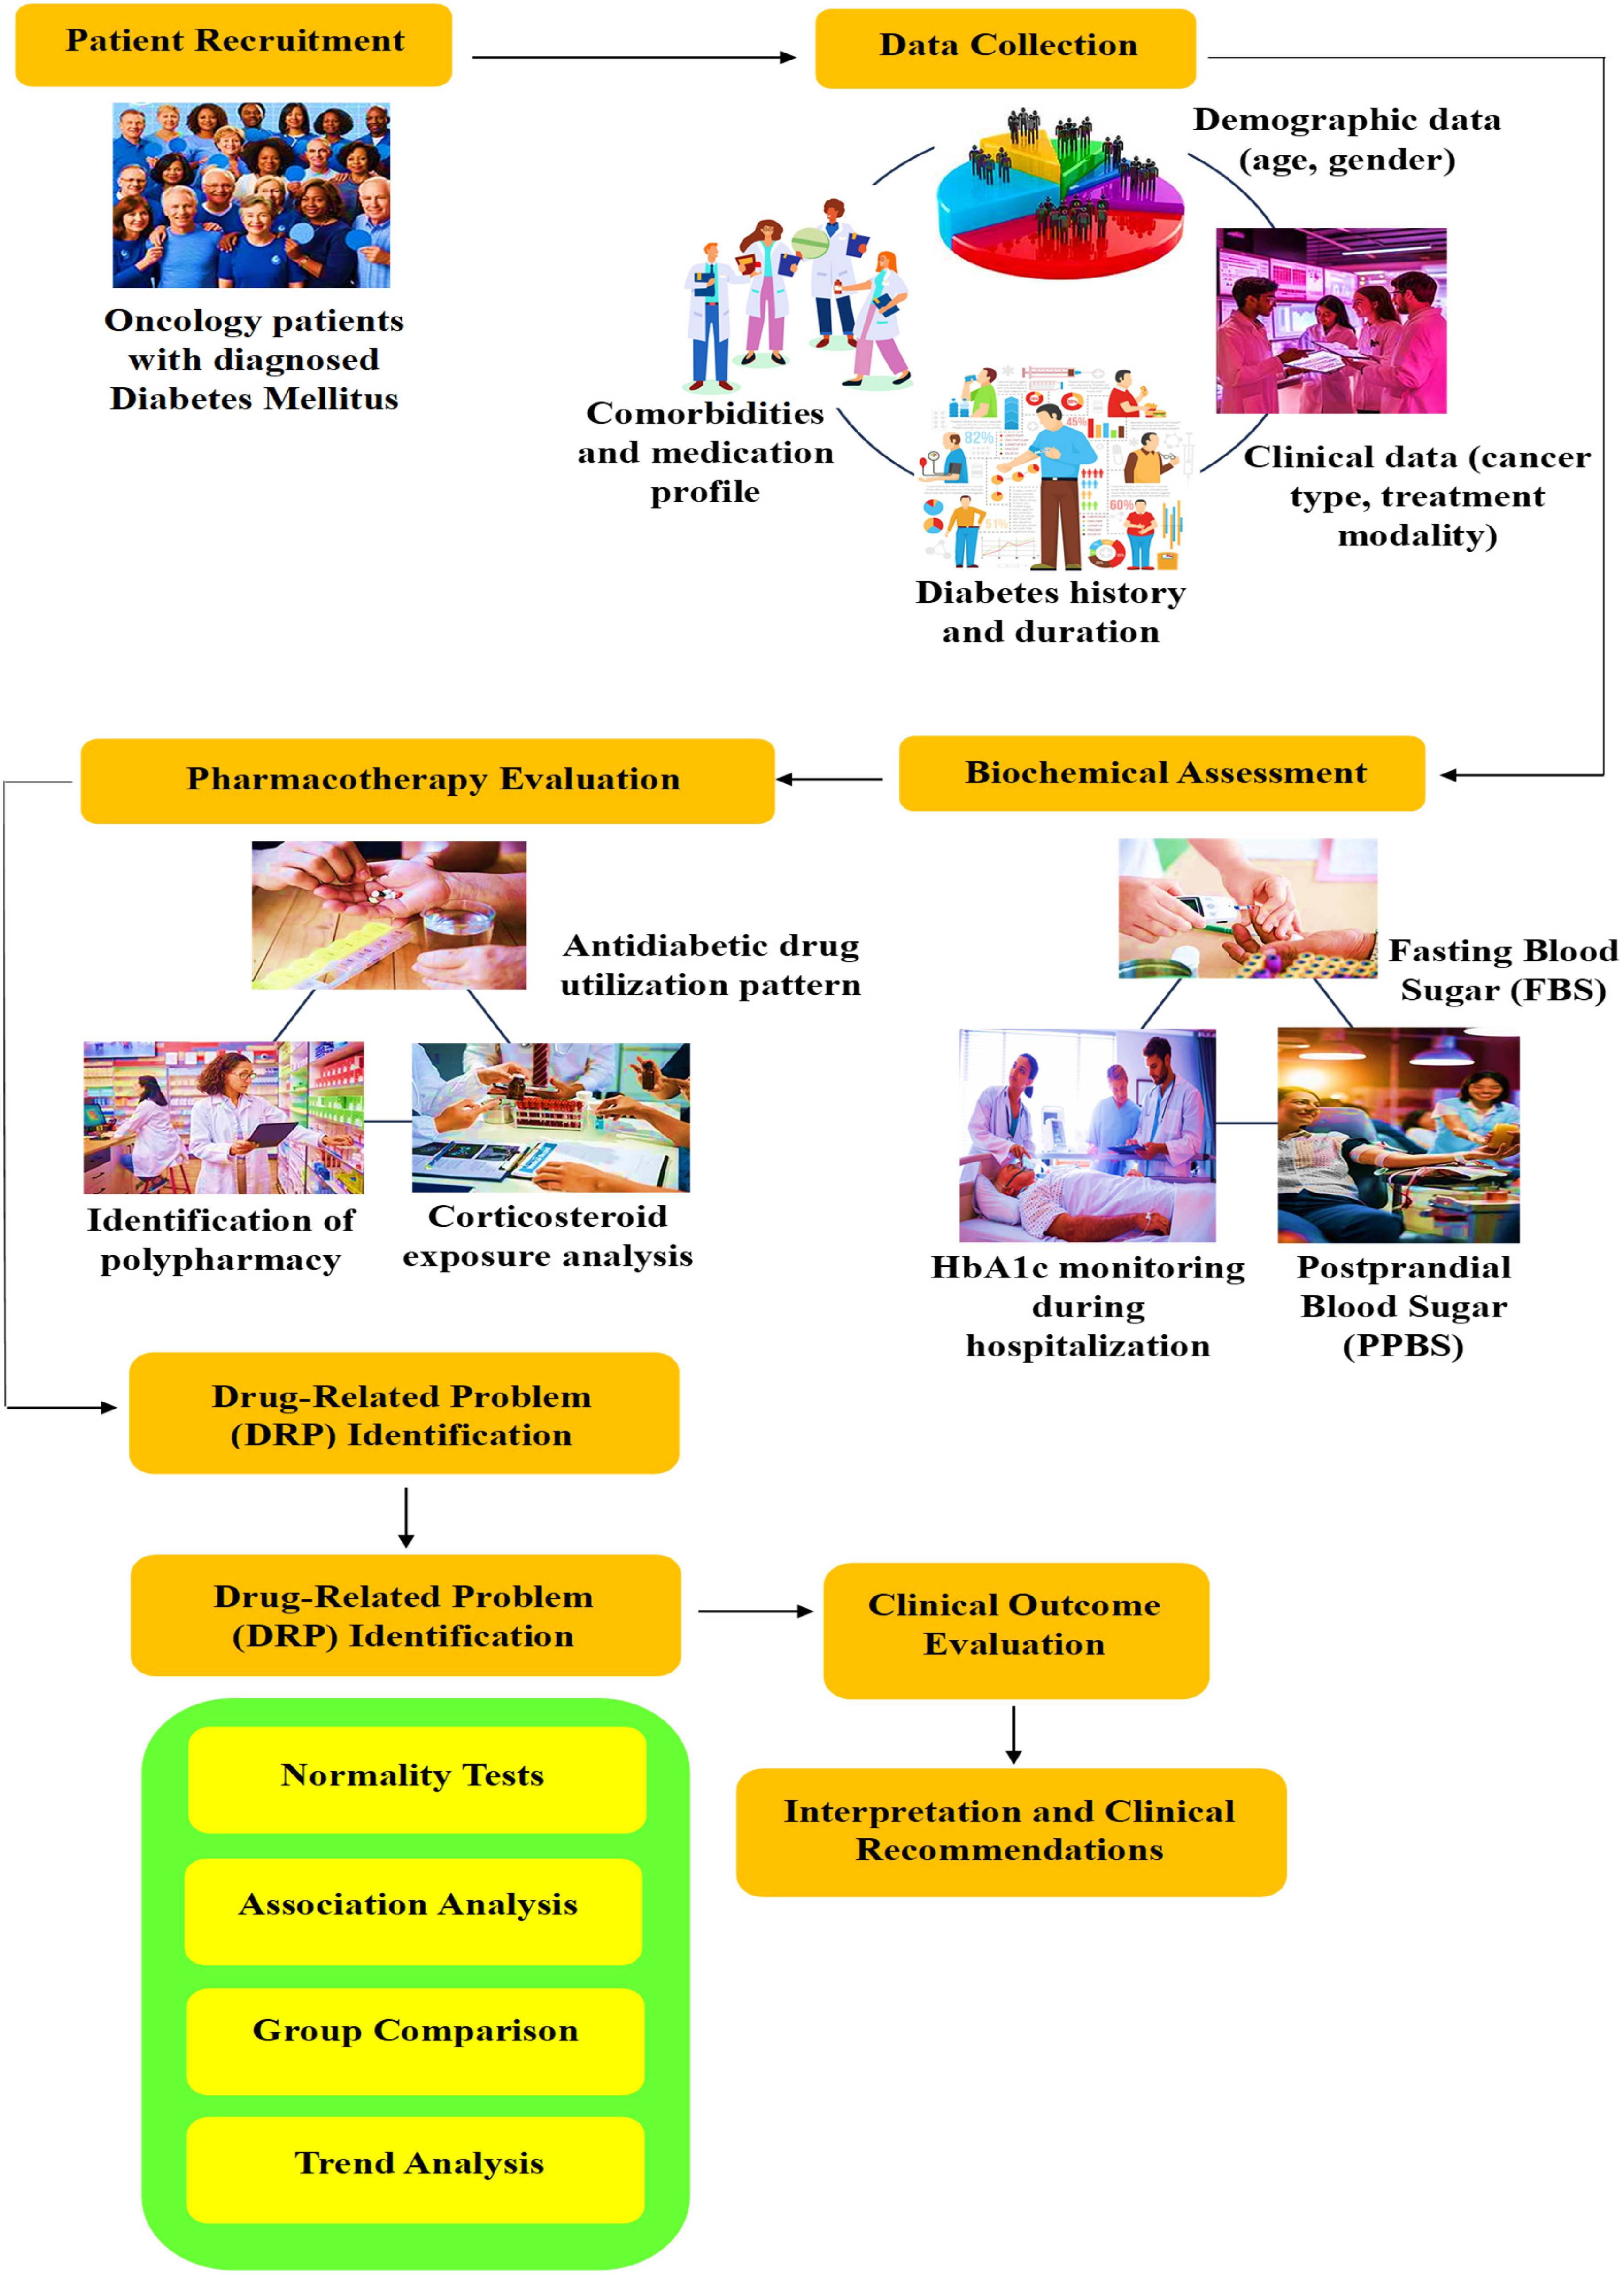
Proposed study workflow for glycemic and pharmacotherapy assessment in diabetic oncology patients.
The perspective of the work is a observational study that is leveraged to combine the clinical, pharmacological, and biochemical parameters. The work categorically covers demographic, cancer history, corticosteroid use, antidiabetic use patterns, and fasting blood sugar and any factor of comorbidity. The framework employs descriptive and advanced inferential statistics, which ensures the methodological innovation and analytical soundness. Test of normality and distributional characteristics of variables are carried out by Jarque-Bra and Lilliefors tests but Boschloo's test is applied to enhance sensitivity in categorical comparisons. Besides, Van der Waerden test is applied to assess variation of a treatment in a non-parametric manner and Betsch and Ebner test are applied to strengthen inferences in a small sample setting. Such a combined model in this research allows determining glycemic variations and issues of drugs with clinically significant relations. Thus, the study paves way for permitting to prefer superior treatment regimens and improved patient outcomes.
Acquisition of data
Initially, the data acquisition process was carried out over a six-month period from July 2025 to December 2025 at Thangam Cancer Center, Namakkal District. The target population of 150 to 200 patients was defined as adequate for attaining statistical representation, and 132 patients were scrutinized during the current stage of the study. The data are collected systematically using standardized clinical proformas and electronic medical records to achieve consistency and completeness. Of interest will be such parameters as demographic features, the type and stage of the cancer, the chemotherapy regime, exposure to corticosteroids and the overall profiles of the antidiabetic therapy including the use of oral drugs and insulin. The baseline and follow-up measurements of the biochemical parameters, fasting blood glucose and HbA1c levels are taken to identify the glycemic tendencies. WHO-ATC/DDD system is used in order to categorize drug use whereas drug related problems classification is recognized by Cipolles classification. Maintenance of data integrity is done by periodical validation checks and ethical compliance is done by informed consent and institutional approval which allow reliable and reproducible clinical data analysis.
Study cohort description
The research sample is a cohort of oncology patients who have diagnosed with Type 2 Diabetes Mellitus (T2DM) and is chosen through the specific inclusion with exclusion criteria to guarantee clinical relevance and homogeneity. The participants are eligible adults between the age group of 18–65 years of age who are actively receiving cancer treatments, with high numbers of eligible respondents (n = 41) in the 31–59 years (n = 41) and greater than 60 years of age (n = 90 years) the most. There is a male dominance in the cohort whereby there are 73 males and 59 females. There are usually multiple comorbid conditions such as hypertension, coronary artery disease, and chronic obstructive pulmonary disease, which are complex clinical presentations in patients. Exclusion criteria are used to put out patients that have reached end-stage organ failure, pregnant and lactating women, and those that lack complete clinical data in order to preserve the quality of the data. In this study, the cohort is predominated by patients with breast and lung cancers with other malignancies hence ensuring that it is diverse. Meanwhile, such a well-defined design of cohort is further leveraged in effective statistical analysis of the glycemic control, response to treatment and other clinical outcomes in cancer.
Research methodology
In this work, the research design is offered in a systematic way which would understand the interactions between the treatment of cancer and glycemic control in a prospective observational research design. An analytical workflow is established with a clear definition of diabetic clinical, pharmacological, and biochemical data to be combined to assess the information. The individual variables in the patients, such as treatment regimens, corticosteroid exposure, and patterns of antidiabetic therapy are observed in combination with metabolic indicators to provide a dynamic variation with the study period. The approach focuses on stratified analysis where patients are classified on the basis of disease characteristics, therapeutic interventions, and comorbidity profiles, which makes them to be assessed to be at risk due to a specific factor. Mathical statistical methods are added to confirm data distribution, evaluate associations, compare subgroup differences, and methodological rigor is guaranteed. Otherwise, standardized classification systems are used when it comes to utilizing the drugs and identifying the drug-related issues, which adds to the increased consistency and reproducibility. This systematic methodology framework helps interpret clinical outcomes with accuracy and optimizes glycemic control in cancer patients on an evidence-based approach.
Meanwhile, the proposed study gives the opportunity of assessing the relationship between cancer treatment and glycemic control in a prospective fashion on an observational design. It uses a straightforward examination way of incorporating clinical, pharmacological, and biochemical information to carry out a comprehensive review. The specific variables that relate to the patient like treatment regimens, exposure to corticosteroids, exposure to antidiabetic therapy patterns are compared with metabolic indicators that can show changes dynamic throughout the study. The strategy concentrates on stratified analysis by grouping of the patients in terms of the characteristics of the disease, treatment measures and comorbidity measures in order to obtain a particular analysis of the risk factors. This is done using sophisticated statistical procedures to demonstrate data distribution, assess associations, and compare subgroup changes to possess a stringent strategy to the approach. This standardized classification systems are applied to the drug utilization and the identification of the drug-related problems to enhance the consistency and reproducibility. This systematic approach reflects the clinical outcomes correctly and to maximise the glycemic control of oncology patients on the basis of evidence.
However, in hospital, glycemic monitoring is performed using a multidisciplinary approach involving participation of oncologists, physicians, clinical pharmacists, nursing personnel, and laboratory staff. Blood glucose level is monitored regularly, and antidiabetic drugs (insulin and OHA) are adjusted based on trends in blood glucose level, level of corticosteroid exposure, nutritional status, and chemotherapy schedules. Drug reviews are undertaken on a regular basis to detect drug-related problem, drug interaction and polypharmacy-related risks. Further, guidance of diet and water management, along with regular metabolic monitoring are also added to ensure glycemic optimization and stabilization during the treatment phase.
Baseline demographic profiling of the study cohort
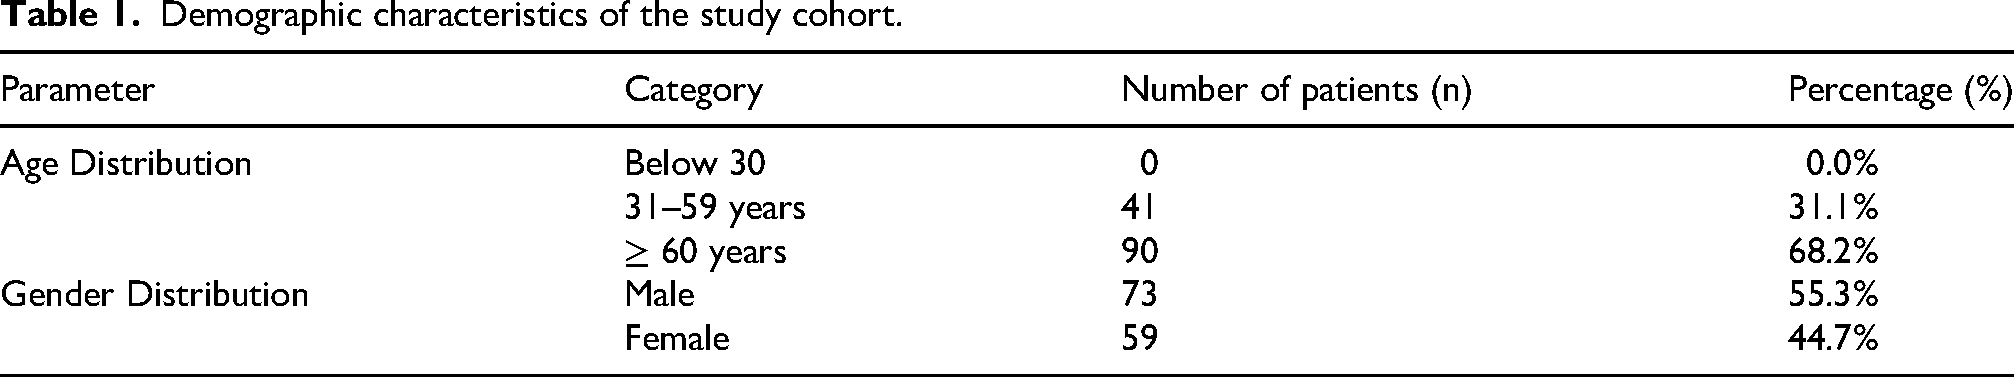
The population structure of the study population (n = 132) at base is researched to find the population distribution based on age and gender. The age group distribution indicates that no patient is below the age of 30 years 41 patients (31.1) are aged between 31 to 59 years and the highest percentage is 90 patients (68.2) are aged above 60 years of age which indicates that combined oncological and diabetic conditions are more prevalent in the elderly. Gender distribution has a slight variation favoring the male gender 73 male (55.3) and 59 female (44.7). The distribution patterns as listed in Table 1 are observed to promote stratified analysis and interpretation of variability between the various subgroups of patients.
Demographic characteristics of the study cohort.
Clinical characterization of diabetes and steroid exposure
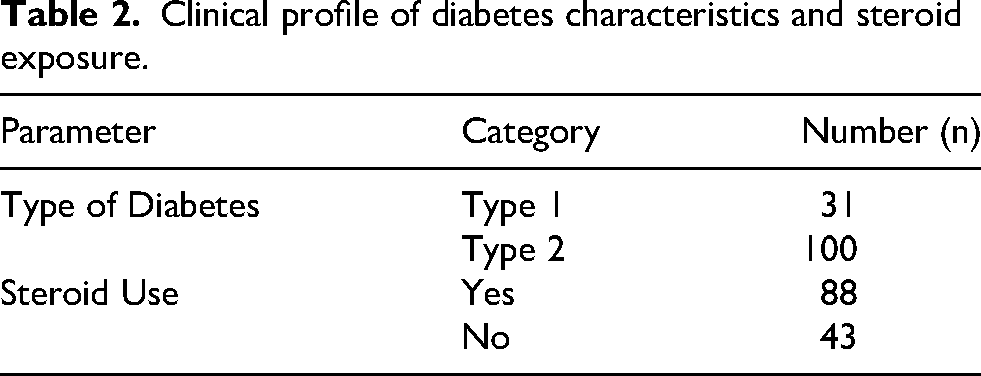
Clinical analysis of the study group is centered on the nature and the duration of diabetes mellitus coupled with the exposure to corticosteroids that are important predictors of the glycemic fluctuations among the oncology patients. Most of the patients who report are Type 2 Diabetes Mellitus patients with 100 cases representing the condition, and few patients (n = 31) display Type 1 diabetes implying that most of the cohort has metabolic dysfunction that is driven by insulin resistance. To put it in terms of disease duration the majority of patients are between 25–5 years, which is then followed by longer duration of over 5 years indicating chronic metabolic adaptation and possible complications. Also, the use of corticosteroids is extremely widespread, 88 patients were exposed to steroids in contrast to 43 patients not exposed to them. Steroids are used regularly as a chemotherapy and supportive care, which causes a substantial impact on glucose metabolism. The joint analysis of the type of diabetes, the time of disease, and exposure to steroids offers a critical piece of information on the metabolic changes, which is described clearly in Table 2. This analysis occurs through the use of treatments and allow the imminent statistical solution analysis of the glycemic control patterns and related risks of the disease.
Clinical profile of diabetes characteristics and steroid exposure.
Glycemic profiling and metabolic outcome analysis
The glycemic profiling module provides a systematic assessment of the fasting blood glucose levels in oncologic patients in order to identify the metabolic condition of the patients undergoing treatments. It has a total of 131 patients that are classified as being under the controlled glycemic status with no patients being classified under the uncontrolled category by the stated clinical thresholds. Although there is such classification, a significant percentage of patients show variations of fasting glucose levels, especially patients receiving corticosteroids, which is transient or therapy-related dysglycemia. The framework is able to capture both the baseline and the treatment-phase glycemic changes and therefore identify trends including sustained hyperglycemia in patients with known diabetes and steroid induced hyperglycemia in patients with no known diabetes. This approach with the traditional clinical observations that the cancer therapies, especially corticosteroids, significantly influence the glucose homeostasis through its mediating effects in terms of increased hepatic gluconeogenesis and insulin resistance. The systematic glycemic evaluation aid in determining the effectiveness of treatment and the recognition of high-risk patients and the optimization of antidiabetic treatments. Finally, it results to the achievement of a more precise metabolic regulation and patient safety in oncology.
Oncological distribution and comorbidity valuation
Meanwhile, the oncology and comorbidity measure provides a detailed description of the percentage of cancer type and chronic diseases in the population of the study. The most common malignancies that follow are breast (n = 38) and lung cancer (n = 26) followed by lymphoma (n = 7), carcinoma prostate (n = 6), and other malignancies including ovary, rectum and urinary bladder. Besides, it is oncologically represented as 27 cases relate to miscellaneous cancers. Comorbidity issues also abound with 125 patients having diabetes mellitus, 68 patients having hypertension and 83 patients having the other disorders including cardiovascular disease, dyslipidemia and respiratory disorders. The comorbidities imply the existence of a complex clinical picture that significantly influences the reaction to the treatment and metabolic stability. The merits of using the multidimensional assessment are to offer the disease burden in a deeper manner, simplify the stratified statistical analysis, and an opportunity to evaluate the interactions of the disease progression. Further, the metabolic disorders and the therapeutic interventions, which enhances the overall strength and the applicability of the research framework.
Statistical evaluation of data
The statistical analysis of the data is conducted in order to conduct systematic analysis of clinical and biochemical variables in the study cohort. Descriptive and inferential statistical techniques are used to evaluate data distribution, discover associations and measure variability among patient subgroups. The leverage of advanced statistical tests is also included to provide robust, accurate, and reliable interpretation of findings of the study.
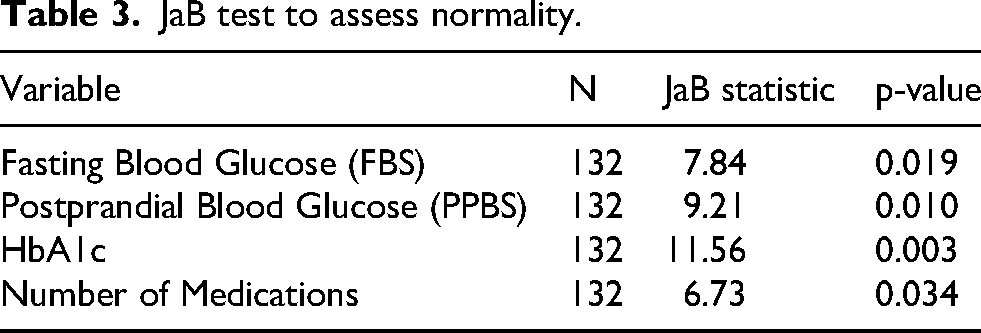
The JaB test in Table 3 showed that the fasting blood glucose, postprandial glucose, HbA1c, and number of medications does not follow normal distribution (p < 0.05). This shows the existence of skew and kurtosis in the metabolic and treatment related variables, hence the application of the non-parametric statistical techniques in the further analysis in the oncology diabetic patient cohort.
JaB test to assess normality.
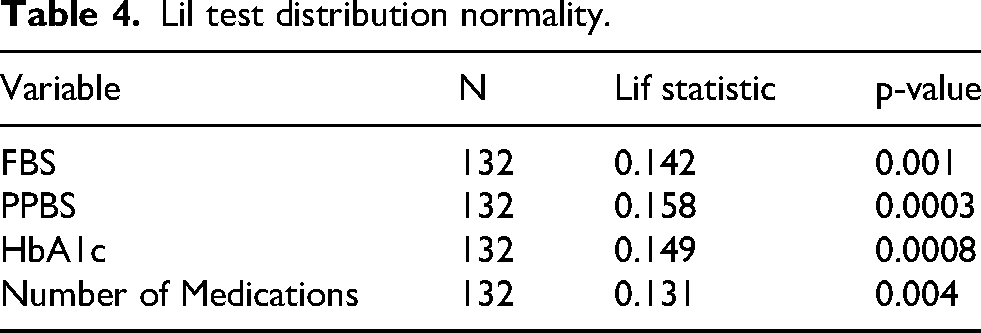
The non-normality of all the assessed variables as resulted in Table 4 confirmed by the Lill test, where the variables FBS, PPBS, HbA1c, and number of medications (p < 0.05) were evaluated. The results support the heterogeneity and variability of the glycemic parameters in oncology patients and support the use of distribution-free statistical tests to guarantee the strength and reliability of the inferential outcomes.
Lil test distribution normality.
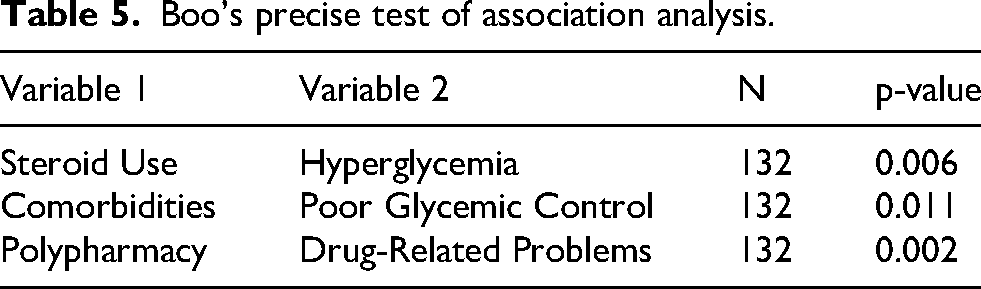
The test conducted by Boschloo in Table 5 showed that there are significant correlations between steroid treatment and hyperglycemia, comorbidity and inadequate glycemic control, polypharmacy and drug-related issues (p < 0.05). The outcomes indicate that corticosteroid therapy and intricate clinical pictures are significant factors leading to the metabolic instability and medication safety issues in diabetic patients with cancer.
Boo's precise test of association analysis.
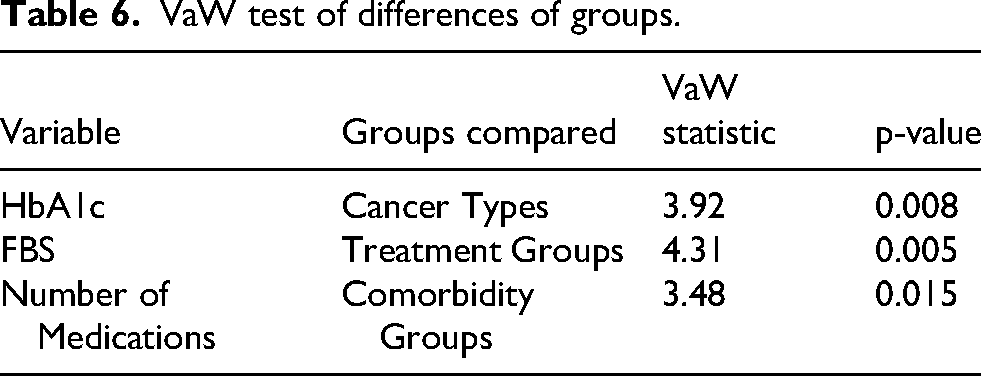
The VaW test results in Table 6 provided statistically significant differences in HbA1c between cancer types, fasting glucose between treatment groups and medication burden among comorbidity groups(p < 0.05). This implies that both the nature of the diseases and the modes of their treatment affect the metabolic results and complexity of pharmacotherapy of the examined population.
VaW test of differences of groups.
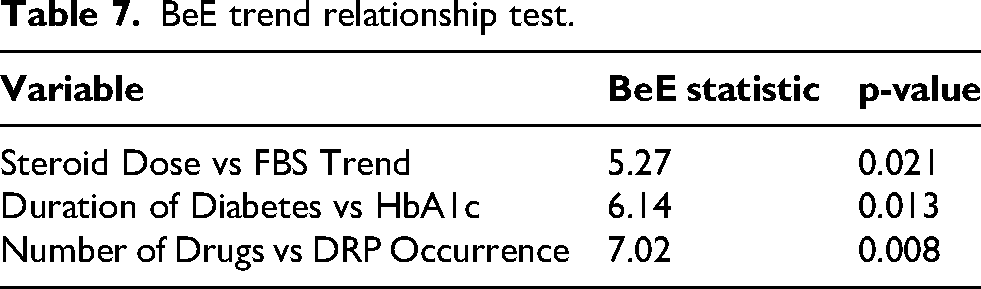
BeE test results in Table 7 have found significant trend associations between dose of steroid and fasting glucose, duration of diabetes and HbA1c values, as well as number of medications and incidence of drug-related problems (p < 0.05). The findings depict the progressively deteriorating glycemic control and medication risk as the therapeutic exposure and disease chronicity increase, where the graphical results are provided below.
BeE trend relationship test.
Duration of Diabetes Mellitus shown in Figure 2 (a) gives a numerical analysis of the 132 oncology patients based on their history with the disease. The data shows that the majority proportion of the study population made up of 67 patients (50.8) was found to have been diagnosed with diabetes between 2 to 5 years. This is then succeeded by 44 (33.3) patients who were too young in the development of the condition and have for less than 2 years been diagnosed with the condition. On the contrary, 21 patients (15.9) with a long-term diagnosis that is more than 5 years comprised the smallest proportion of the cohort. These findings show that more than half of the study population is under mid-range time period of the diabetes progression.Further, the given chart in Figure 2 (b) demonstrates the distribution of 131 oncology patients according to their age category as well as their time with diabetes. In 31–59 years age category, 15 age group patients have diabetes of less than 2 years, 20 patients of 2–5 years, and 6 patients of more than 5 years, making a total of 41 patients. In the Above 60 years cohort where the number of patients is 90, 28 of those patients fall within <2 years category, there are 47 patients with duration of 2–5 years and 15 with a duration of more than 5 years. In general, the 2–5 year period is the most common in both the groups with 67 total patients.
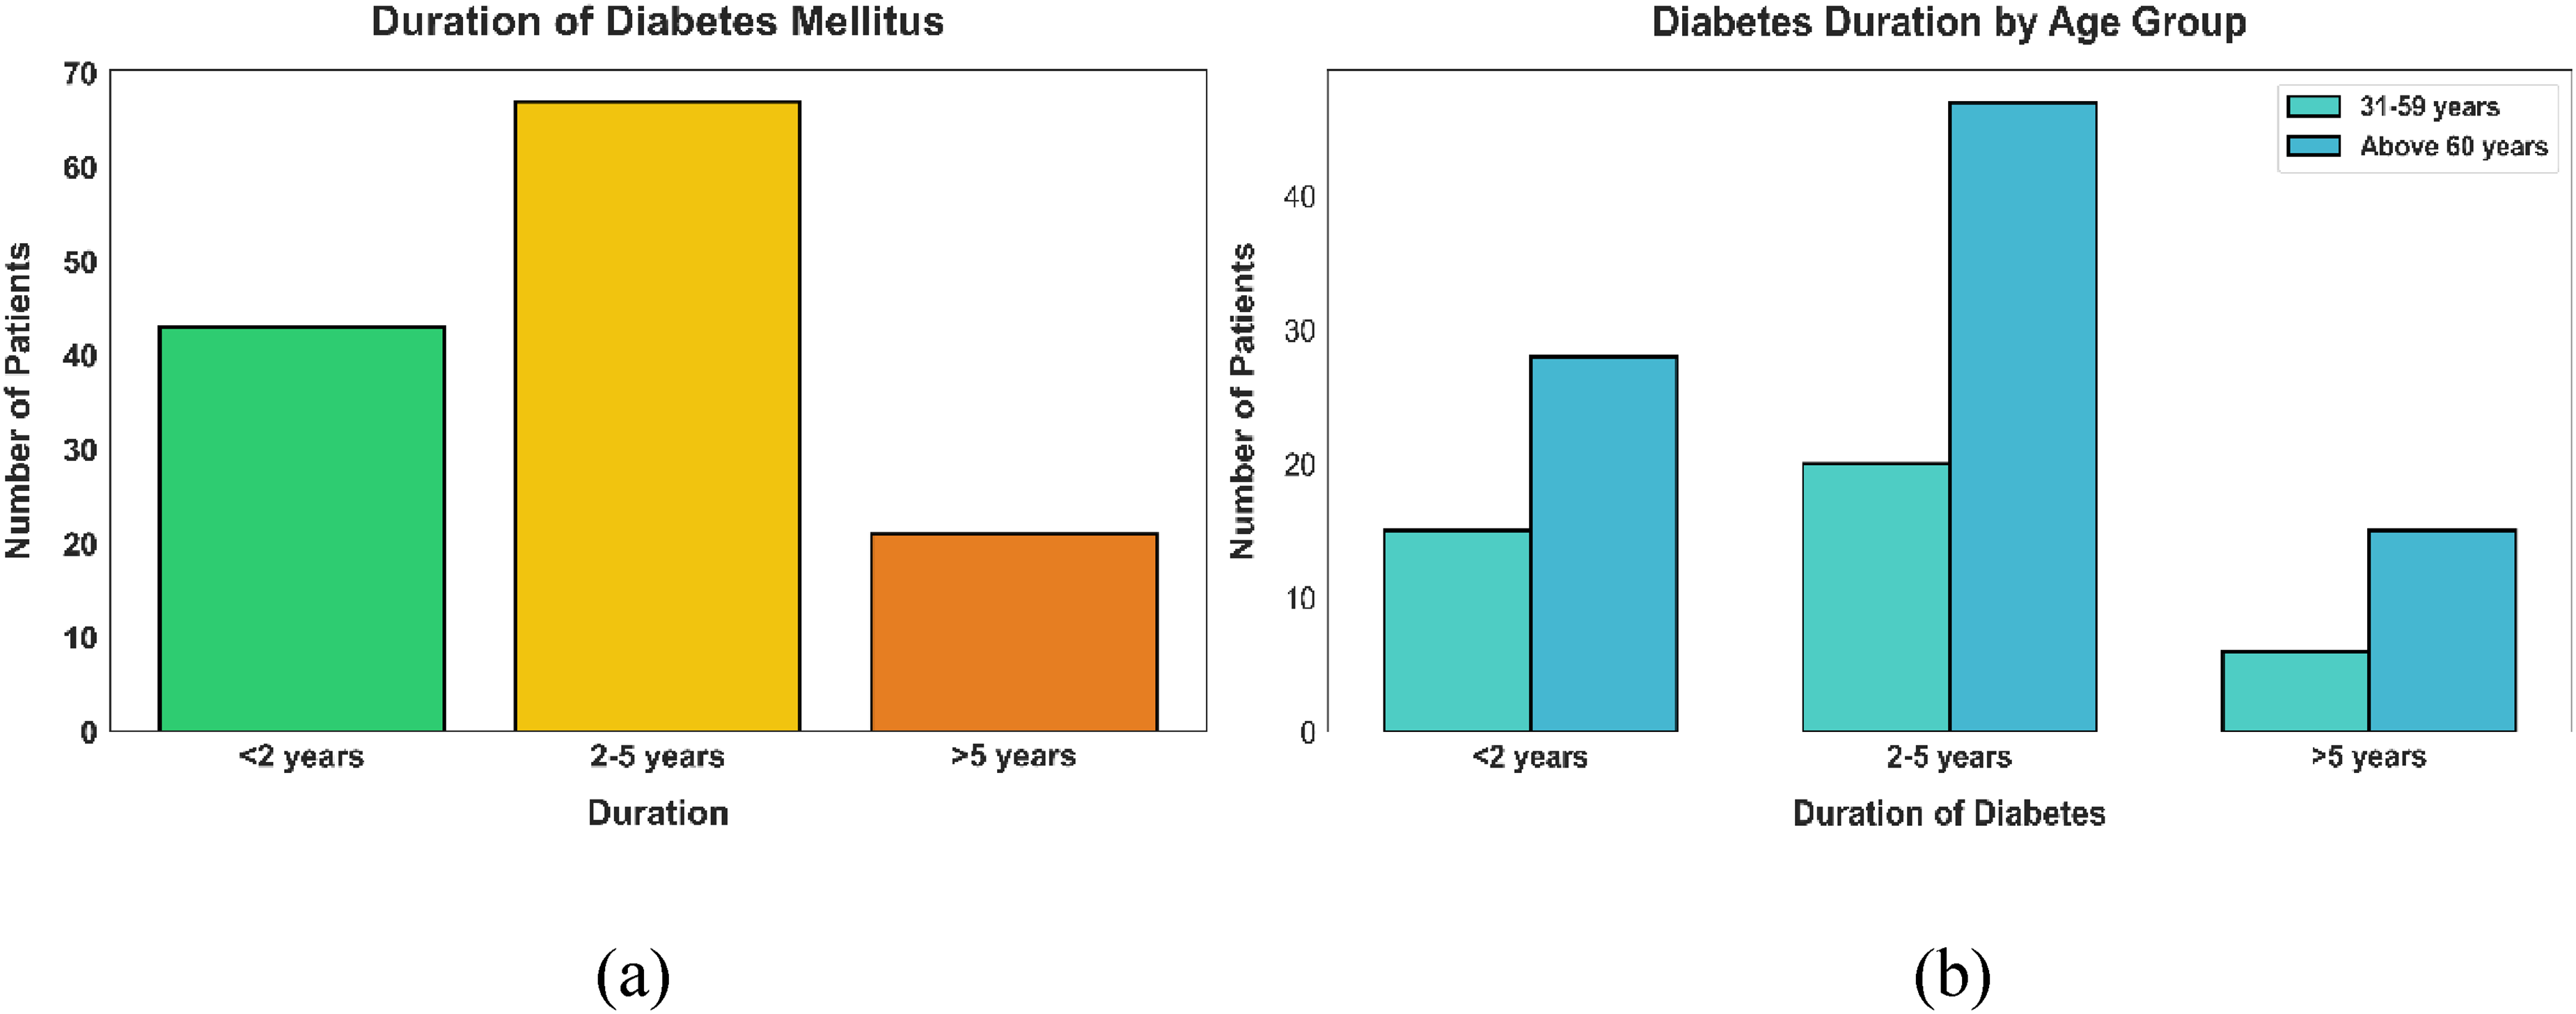
Examination of (a) Diabetes Mellitus duration, and (b) Diabetes duration according to age group.
The chart in Figure 3 is leveraged to demonstrate the clinical distribution of different malignancies in the cohort of the study. The most common diagnosis is breast cancer, that is found in 38 patients, then the lung cancer found in 26 patients. A large number of the population is classified under other group, which is 27 patients. Lower-frequency malignancies involve lymphoma (7 patients), prostate cancer (6 patients) and ovarian cancer (5 patients). The lowest prevalence types which were registered include rectum cancer, and urinary bladder cancer with 3 and 3 patients respectively. Together, it reflects the figures of 115 reported cases with the two most prevalent types of cancer, which are breast and lung, constituting about 55.6 percent of the whole distribution.
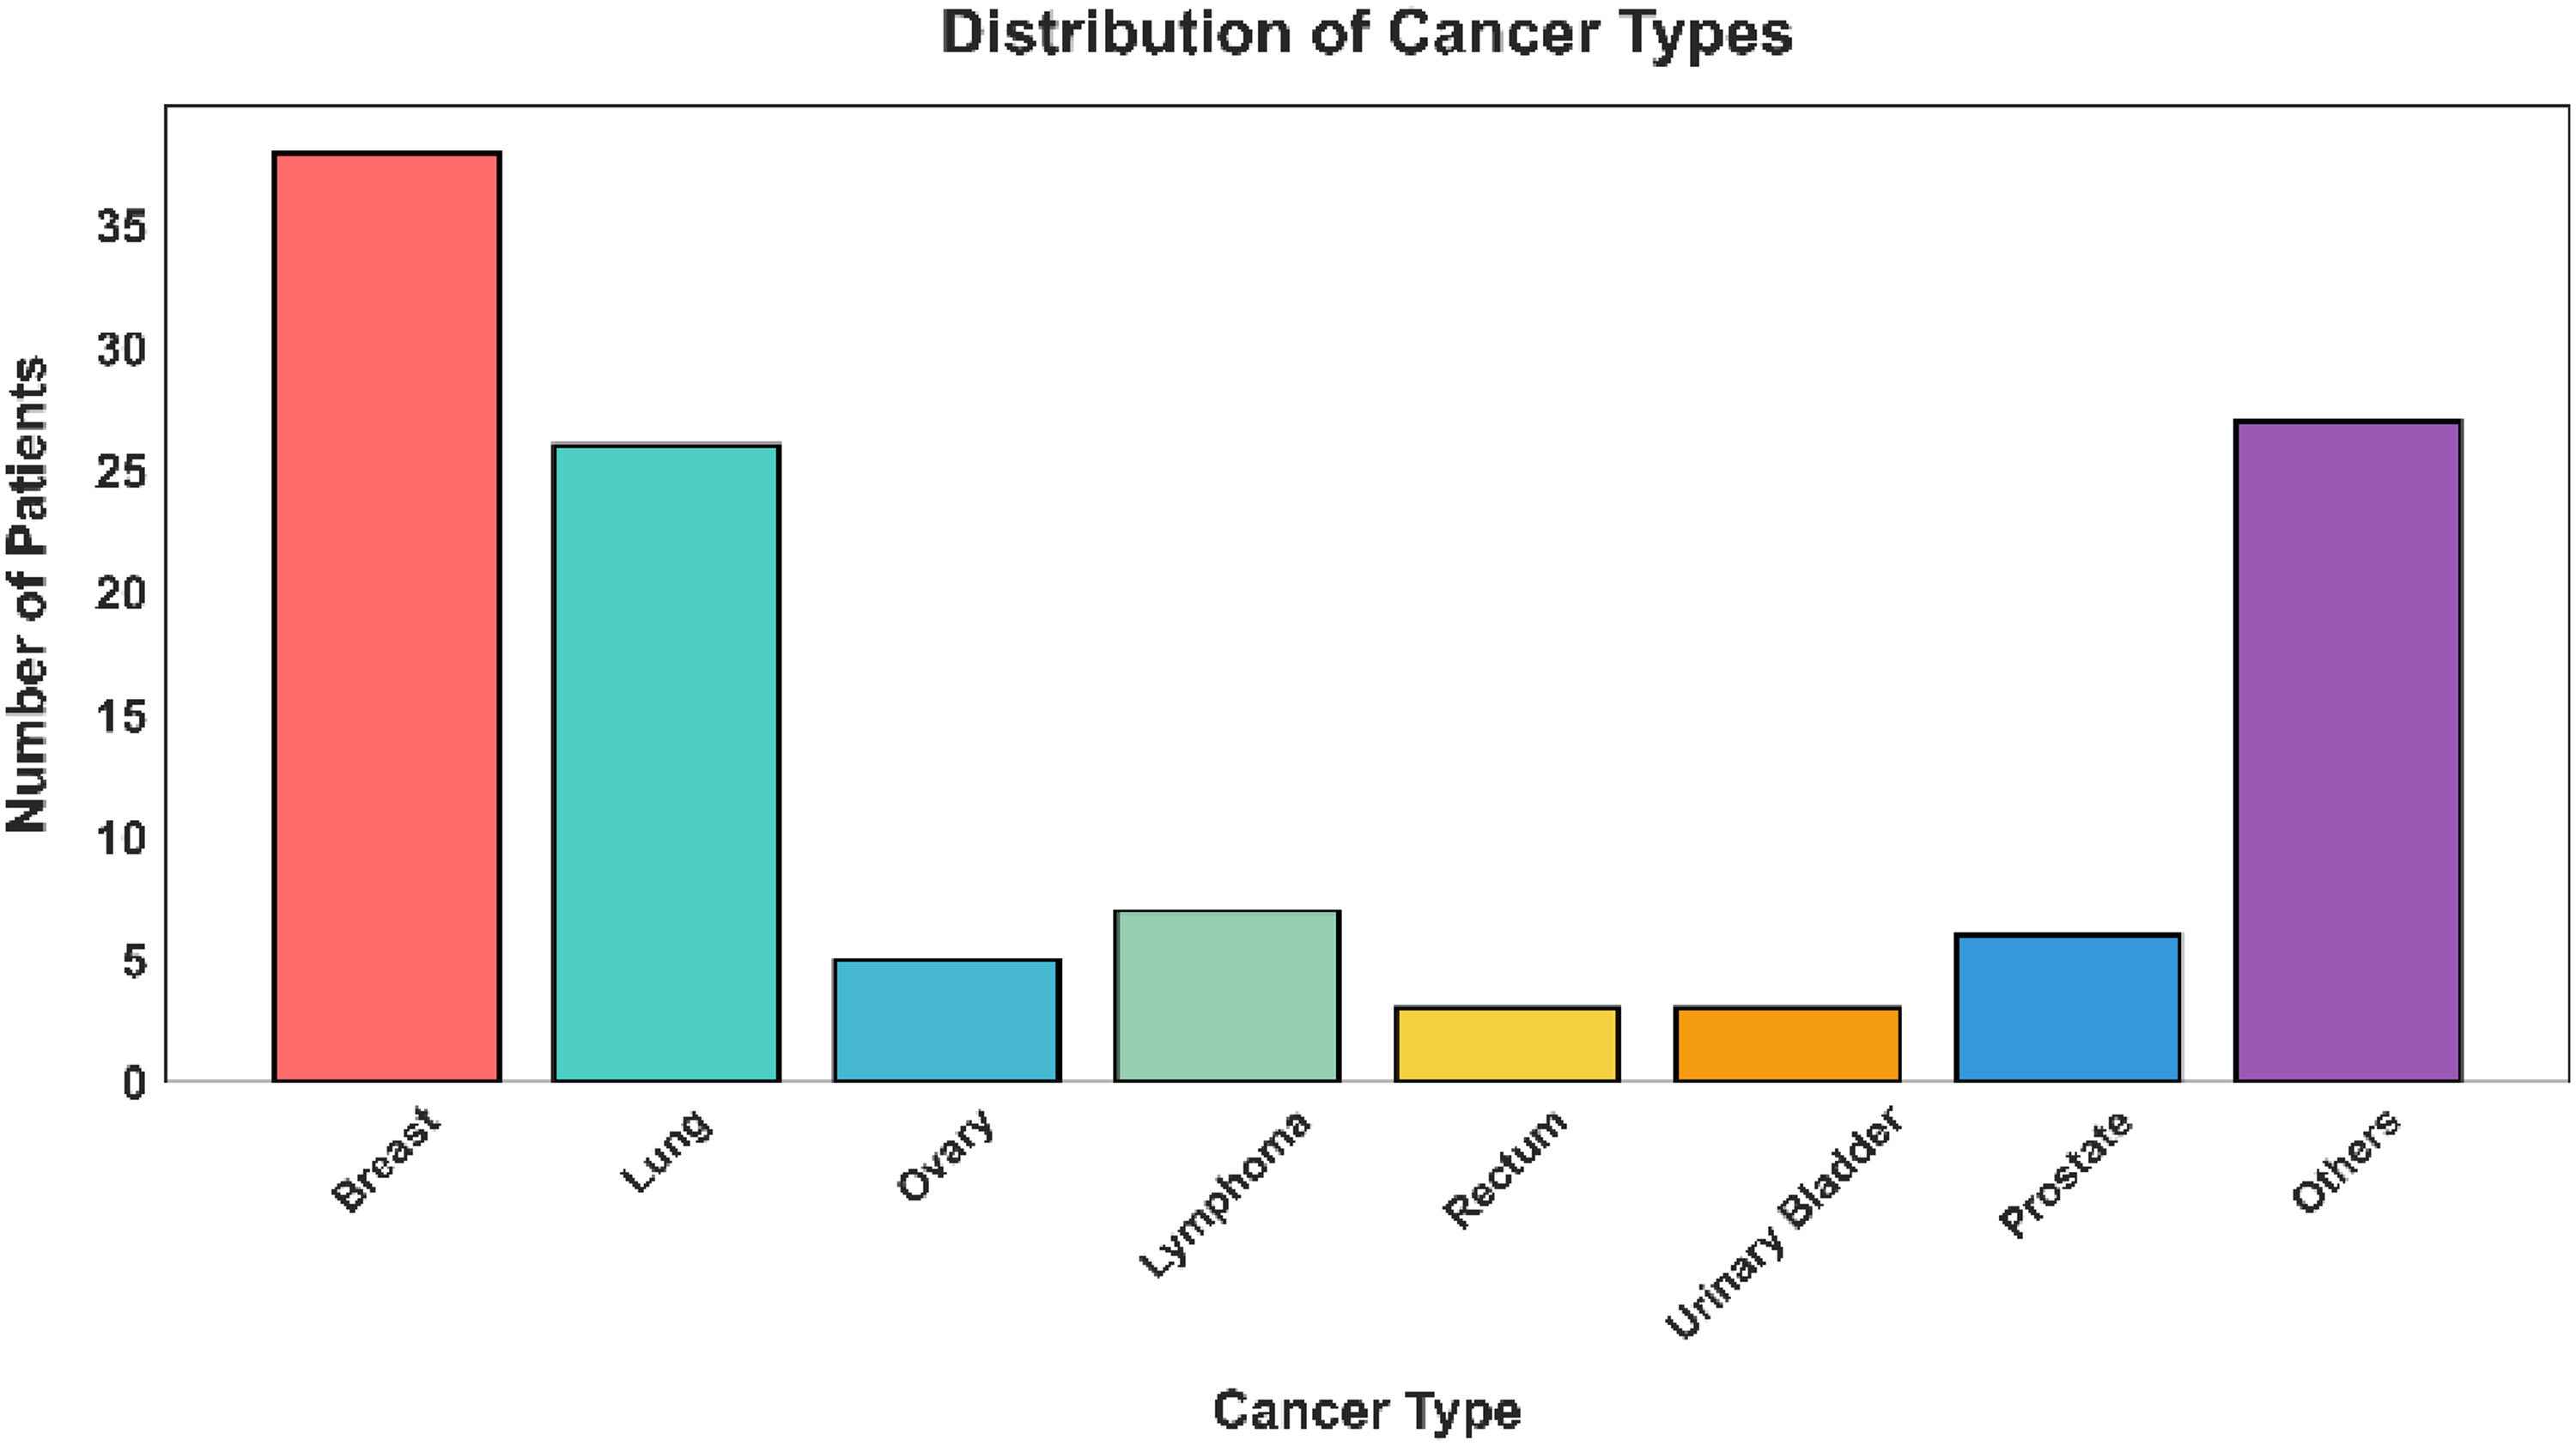
Distribution of cancer types.
Figure 4 (a) indicates the different modes of therapy that were applied among the people that were included in the study with a strong dependence on one modality. The most common treatment is chemotherapy that is given to 124 patients which is about 94 percent of the entire group. Other modalities are greatly underutilized in contrast: 4 patients undergo hormonal therapy, 2 patients undergo radiotherapy and 1 patient undergoes immunotherapy. These data provide evidence that the large percentage of patients in this cohort is treated with chemotherapy, and the total of them is 131 treatments, which are incorporated in the four categories identified. Meanwhile, Figure 4 (b) shows the prevalence of comorbid conditions of the 132 oncology patients of the study. The most popular comorbidity is Diabetes Mellitus that occurs in 125 patients (around 94.7 percent of the cohort). Hypertension is also very important as observed in 68 patients (51.5%), whereas Other Comorbidities- including cardiovascular diseases are observed in 83 patients (62.9%). Such a distribution points out the complex clinical profile; almost two-thirds of the participants have other health issues other than their main cancer diagnosis. Combining the data, the overall burden of multi-morbidity is high as a total number of 276 comorbidity cases are observed when considering these three particular categories.
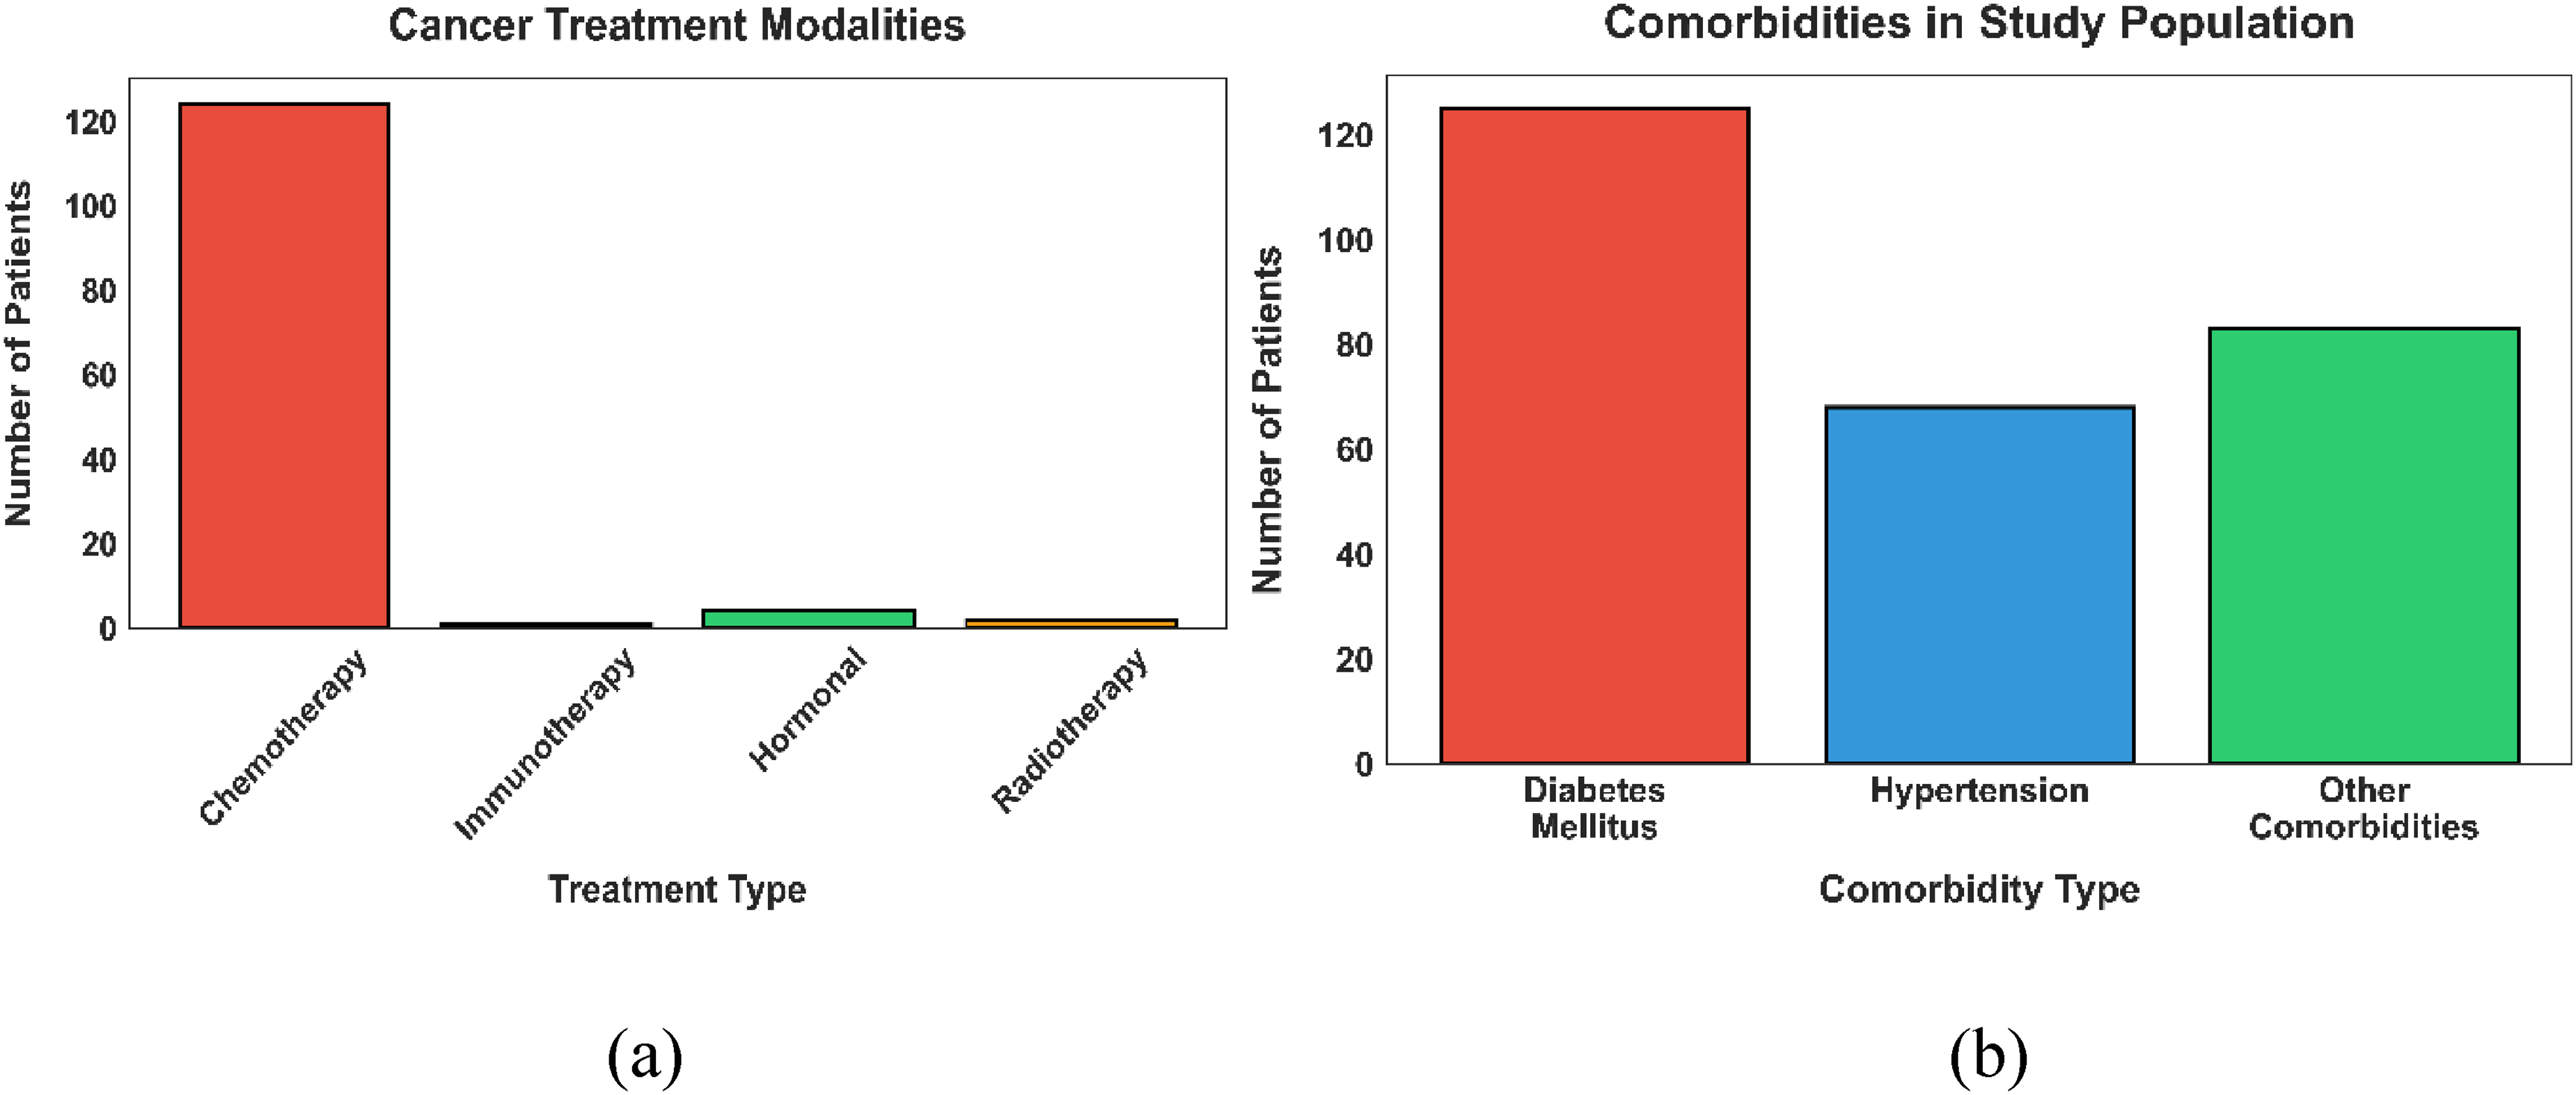
Analysis of (a) Cancer treatment modalities distribution, (b) Comorbidity prevalence among the study population.
The graph in Figure 5 shows the number of the most common malignancies of a population of 132 patients in a study. The burden is the highest with breast cancer where 38 patients are affected (around 36.5 percent of the total represented). This is preceded by the other category with 27 patients (26) and lung cancer with 26 patients (25). Much lower rates are seen with lymphoma (7 patients or 6.7%), and prostate cancer (6 patients or 5.8). The two major identified forms of cancer, breast and lung together constitute 64 patients, or 61.5 of these top five categories.
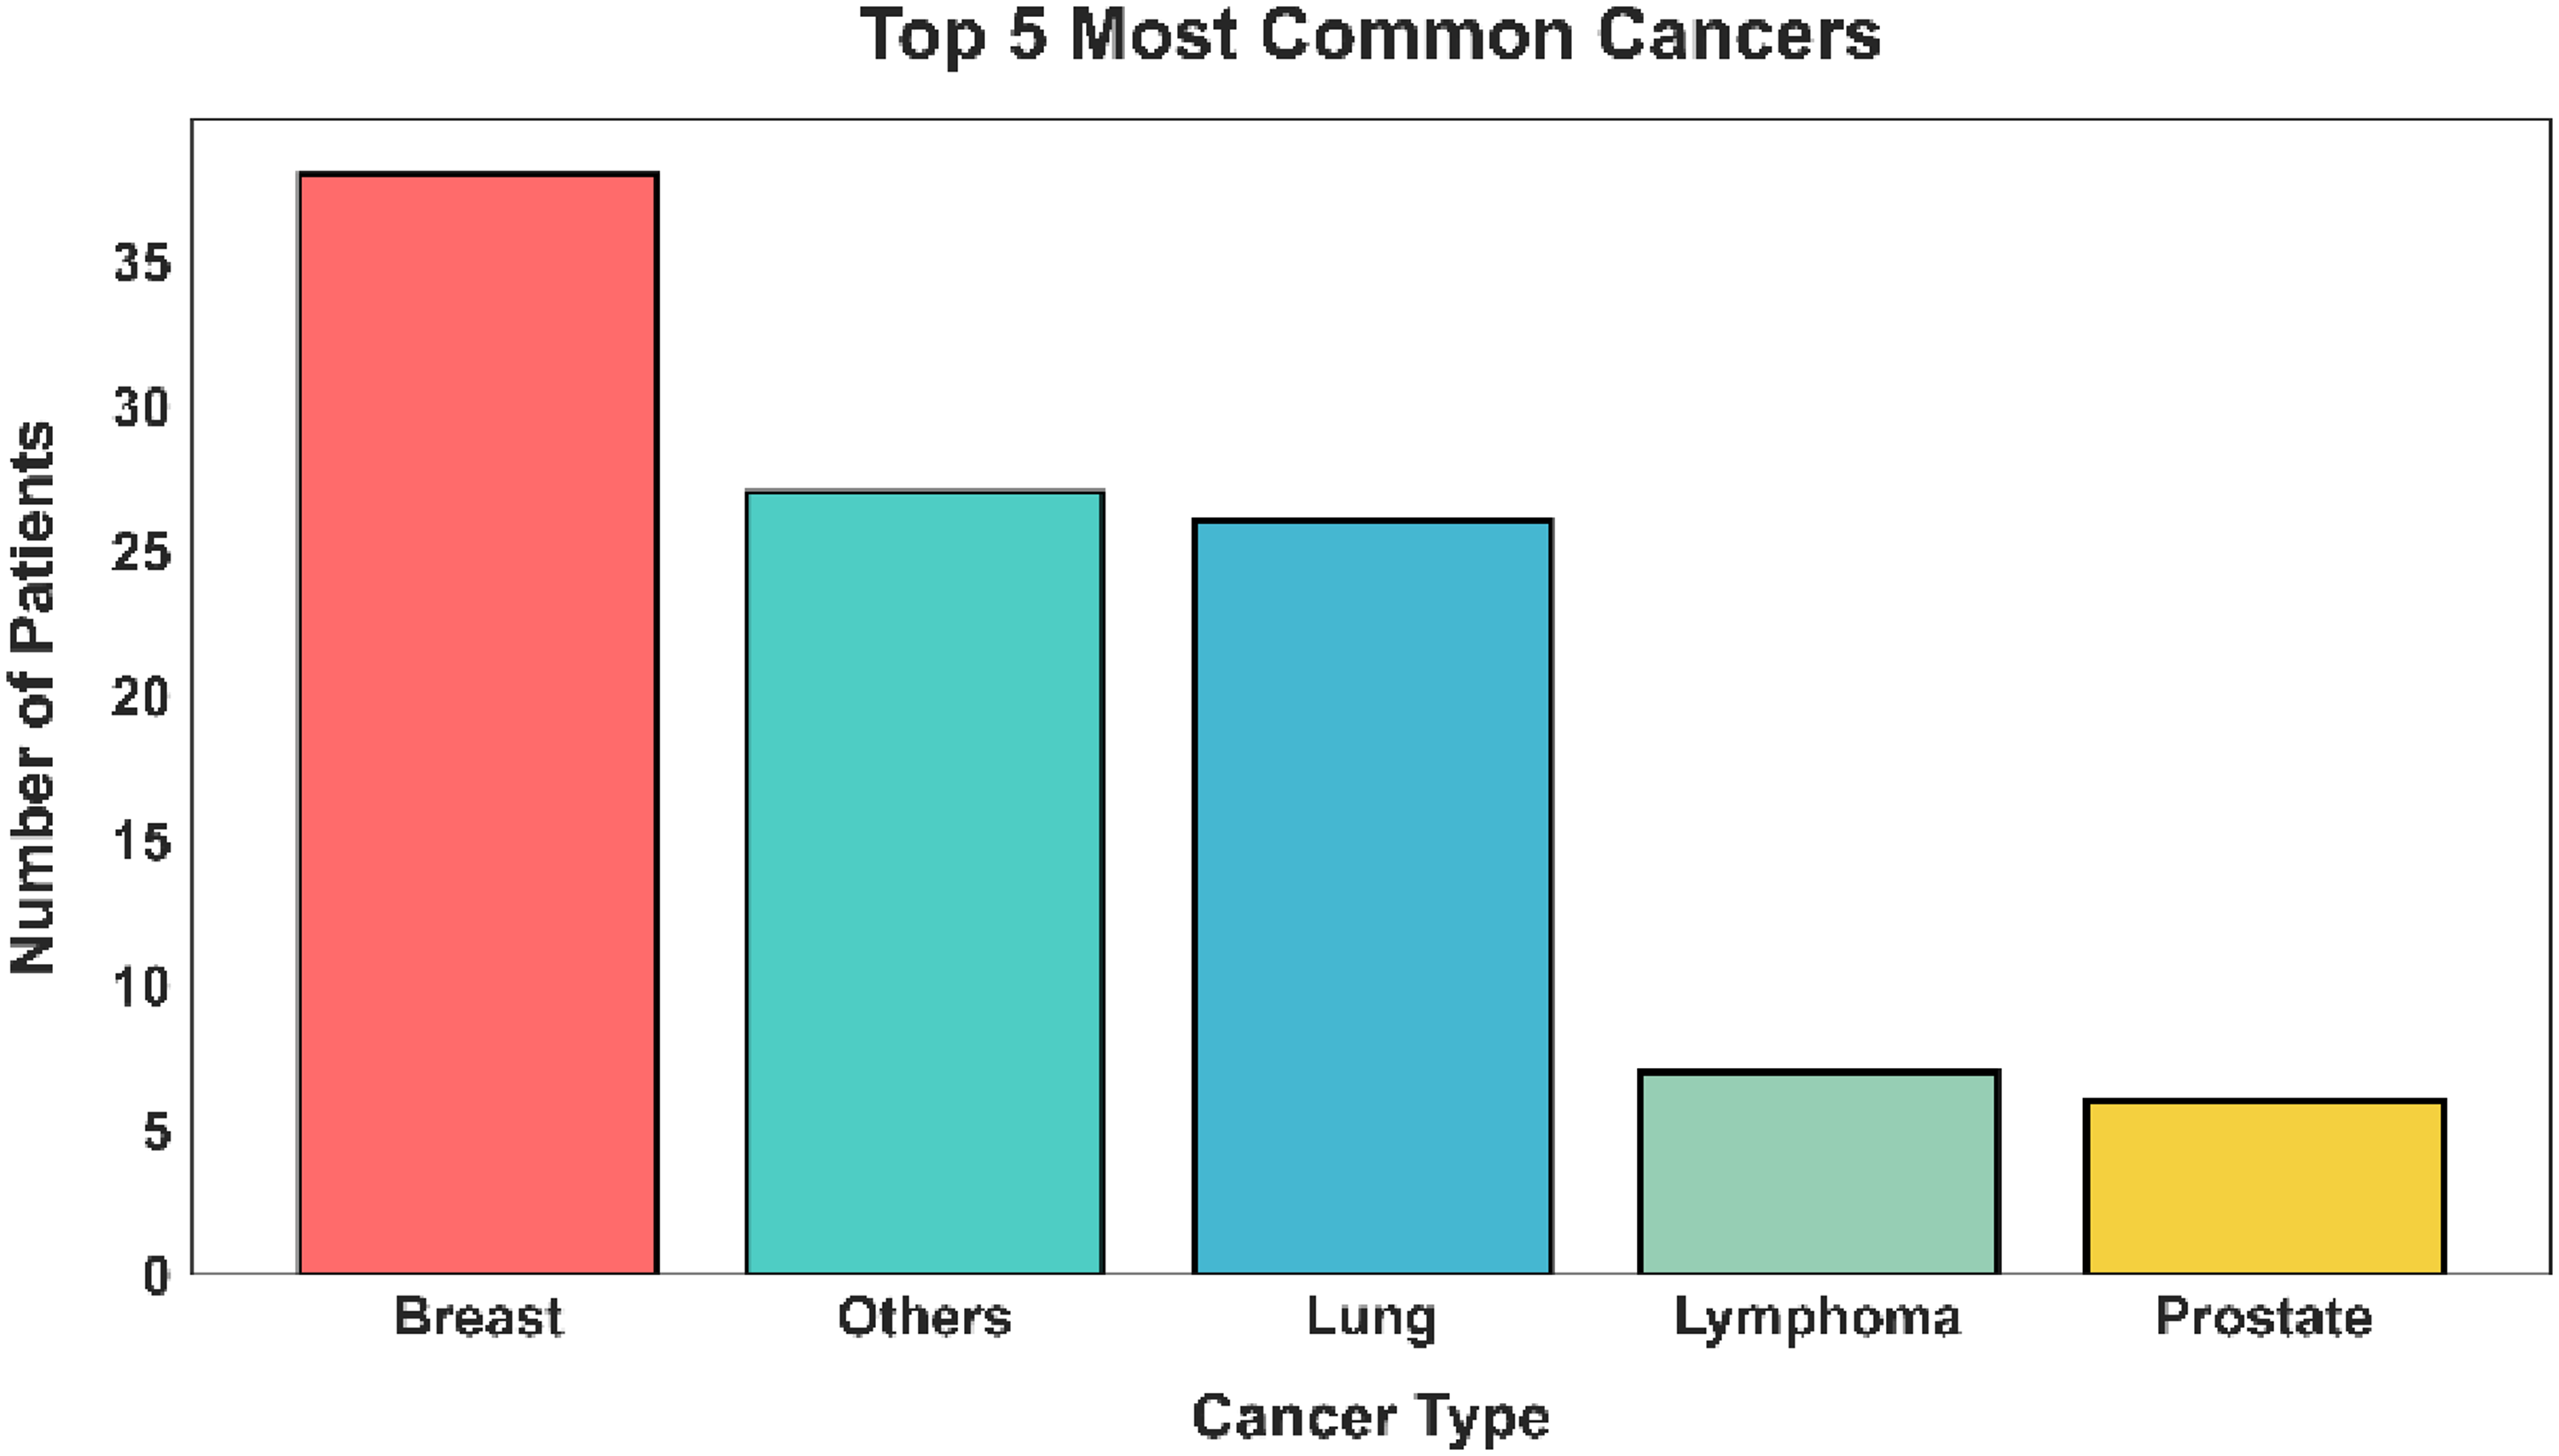
Distributional analysis of most common type of cancer.
The heatmap in Figure 6 is a numerical examination of the Diabetes, Hypertension, and other comorbidities interrelationships in the analysis cohort. The correlation of the self-correlation of the numbers in the matrix is perfect with the diagonal values of 1.0. Hypertension and other comorbidities have the greatest positive relationship of 0.4 suggesting they are more likely to be coexistent. Diabetes correlates with Hypertension (0.3) and with the category others (0.2) moderately and weakly respectively. These coefficients imply that all three categories are overlapping although the correlation between high blood pressure and other metabolic or cardiovascular problems is the most significant.
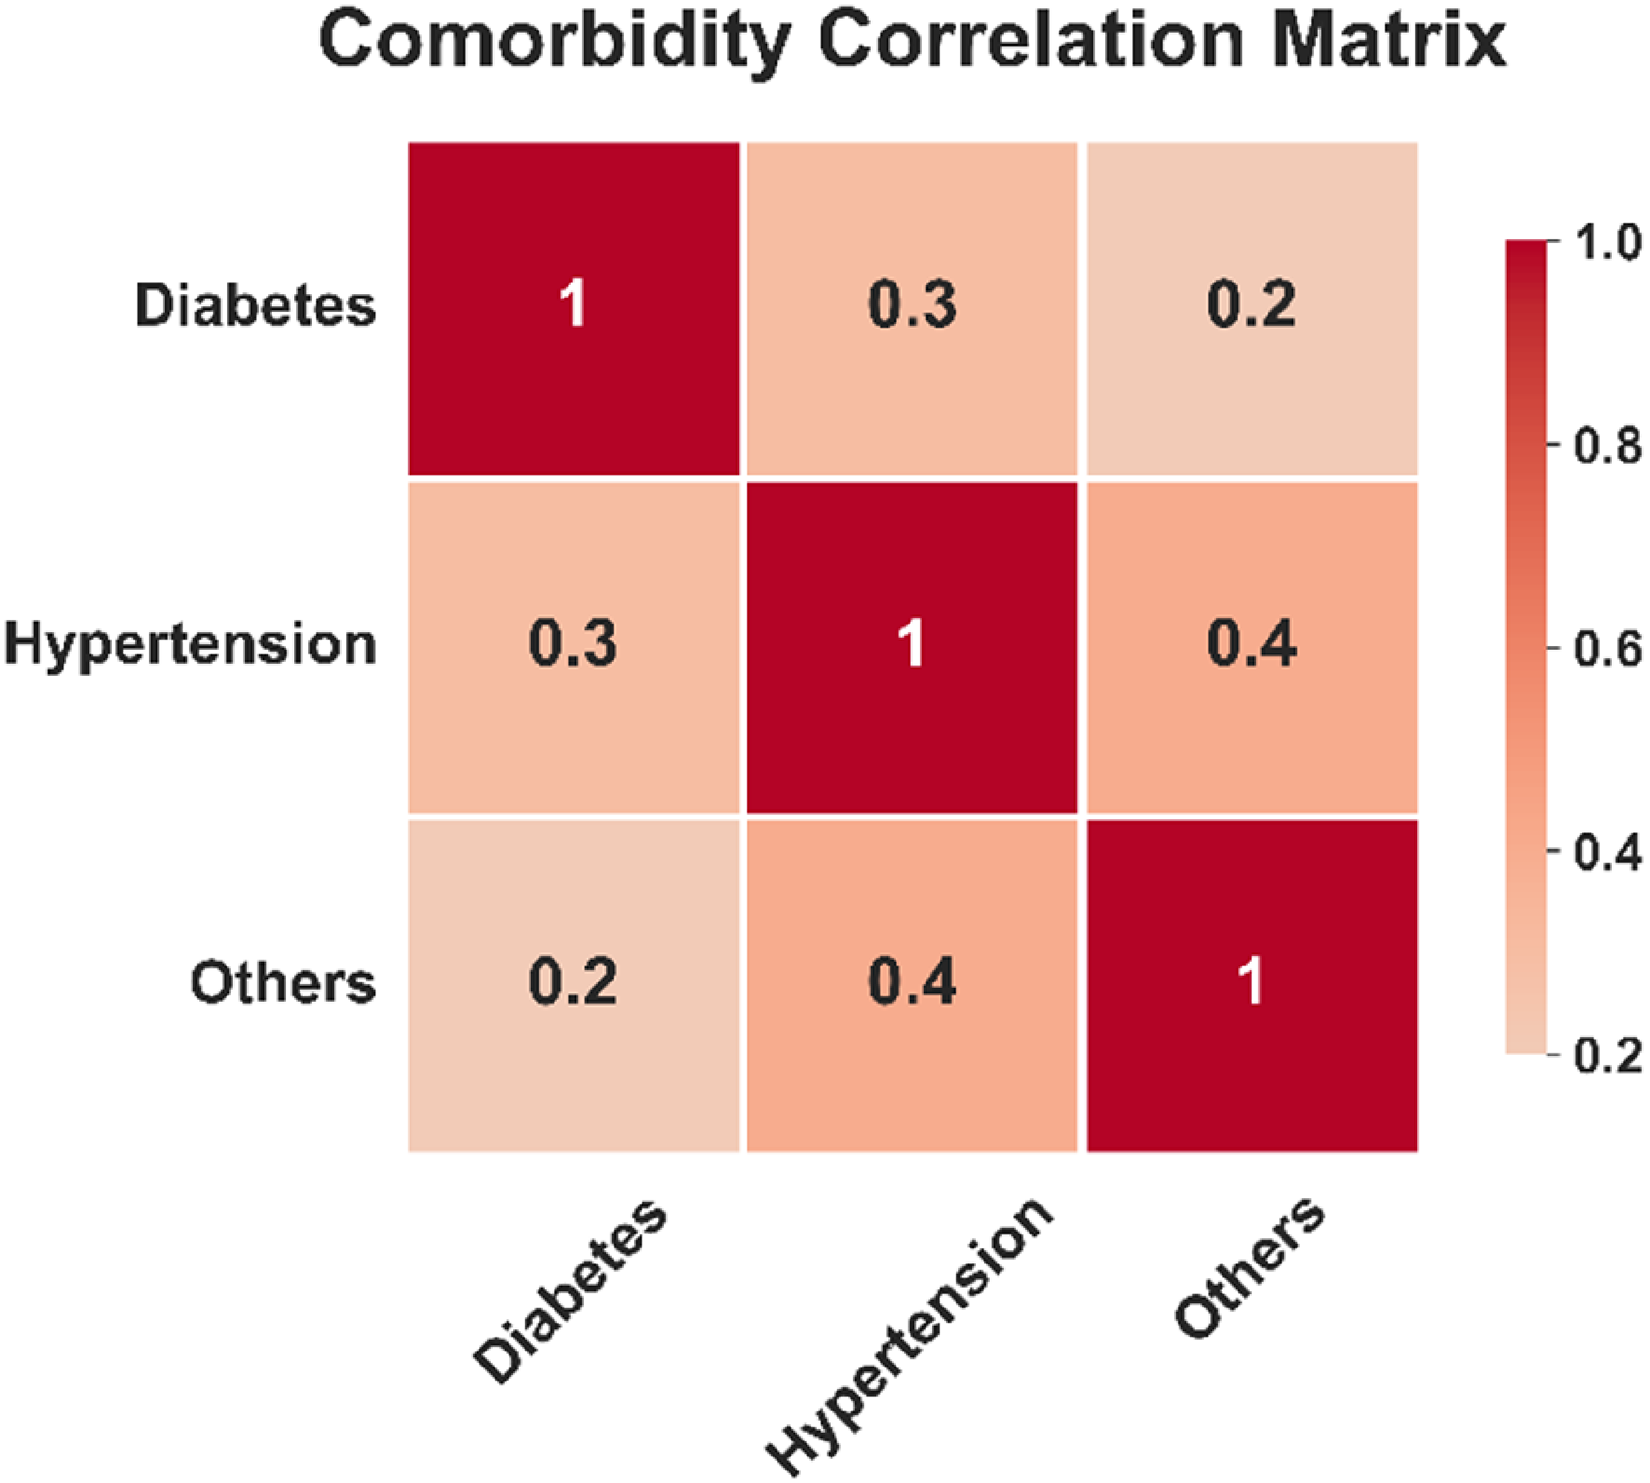
Evaluation of comorbidity correlation matrix.
The graph in Figure 7 (a) shows that the level of Mean Fasting Blood Sugar (FBS) decreases steadily during the clinical stay. The mean FBS is 180 mg/dL at Admission and fell to 150 mg/dL at Hospitalization. At the Discharge phase, the levels had dropped to 130 mg/dL a total of 50 mg/dl reduction of the 180 mg/dl the patient was at the beginning. Further, Figure 7 (b) shows a distinct reduction of mean Postprandial Blood Sugar (PPBS) levels. On the admission, it is 220 mg/dL, and during hospitalization, it is 180 mg/dL. At discharge, the levels dropped further to 160 mg/dL thus a total of 60 mg/dL. This general 27.3% increase is a sign of successful clinical intervention in the post-meal glucose level management during the entire hospitalization time.
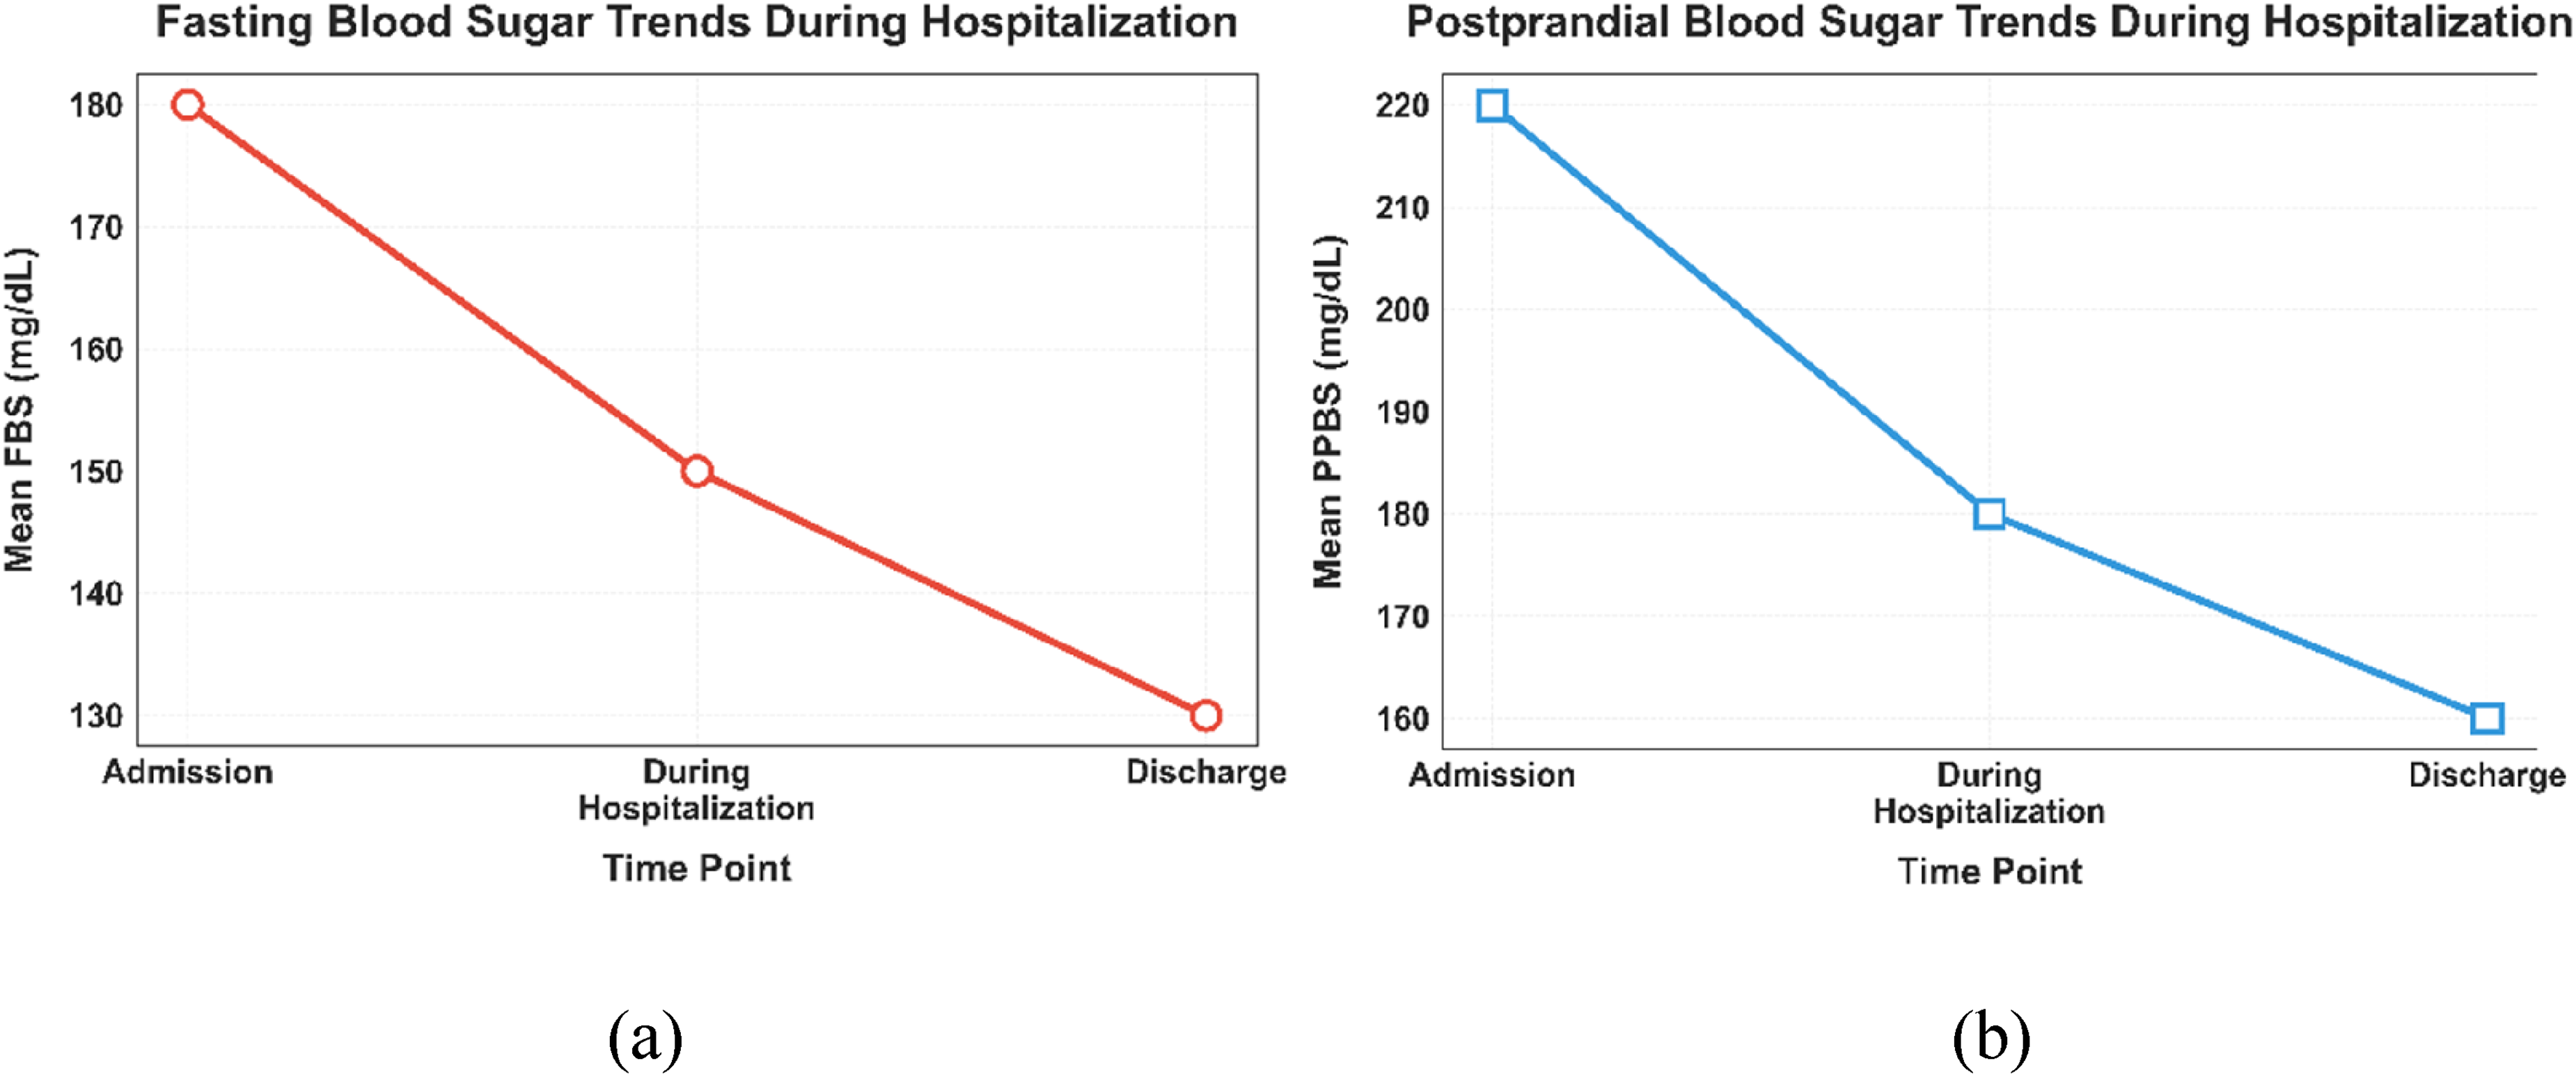
Estimation of (a) Trends in fasting blood sugar level over the hospitalization, and (b) Blood sugar trending in the postprandial period of hospital stay.
The chart in Figure 8 (a) demonstrates the overlaps of comorbidity in a group of 125 patients. The most common one is Diabetes Mellitus (DM) and Hypertension (HTN), seen in 45 patients (36%). DM Only has close one with 40 patients (32%), then DM combined with other conditions has 35 patients (28%). The most uncommon is the presence of the three categories, noted only in 5 patients (4%), which forms the smallest group of demographics.The chart in Figure 8 (b) has shown the frequency of prescription of the five classes of antidiabetic drugs. The most prescribed are metformin and Sulfonylureas with 85 and 60 respective prescriptions respectively. DPP-4 Inhibitors make 45 prescriptions and SGLT2 and Insulin are not so common with 30 and 25 prescriptions, respectively. There were 245 prescriptions in all, and Metformin and Sulfonylureas constituted almost half of the overall utilization pattern.
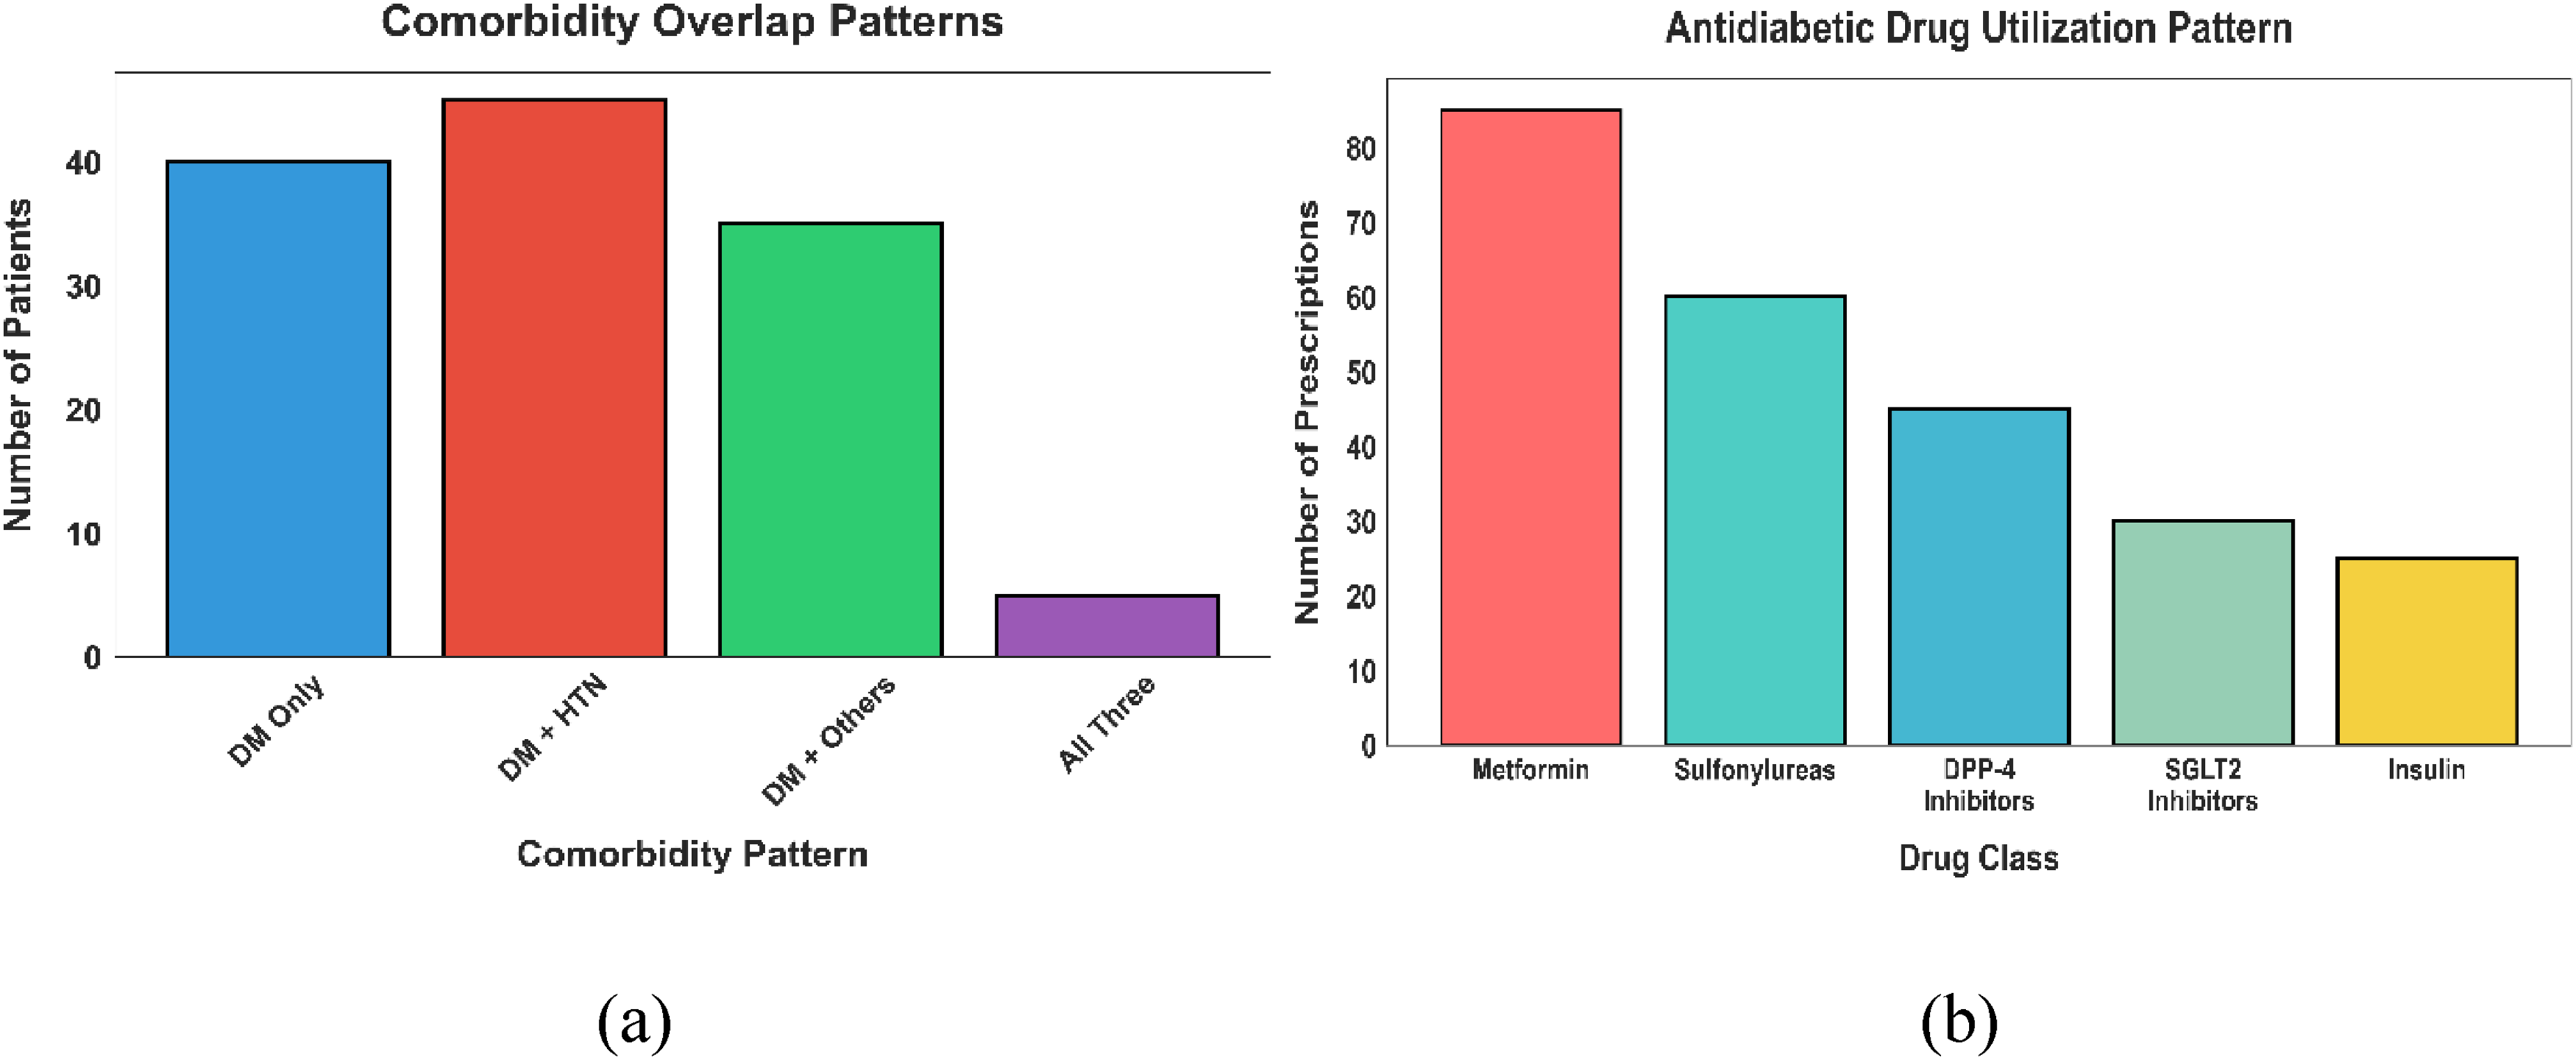
Valuation of (a) Overlapping patterns of comorbidity in the oncology patients, and (b) Pattern of antidiabetic drugs use.
The graph in Figure 9 follows the steady rise in proportion of oncology patients who attain optimal levels of blood sugar all through their stay in the hospital. Only 65% of the cohort had good glycemic control starting on Day 1. This number continued to increase steadily to 75% on Day 3 and 85% on Day 5. The control rate continued to go up to 92 by Day 7 before reaching a high rate of 99 by the time of Discharge. This is a total of 34% improvement between admission and discharge, which shows that the multidisciplinary interventions that are applied during the period of treatment are very effective.
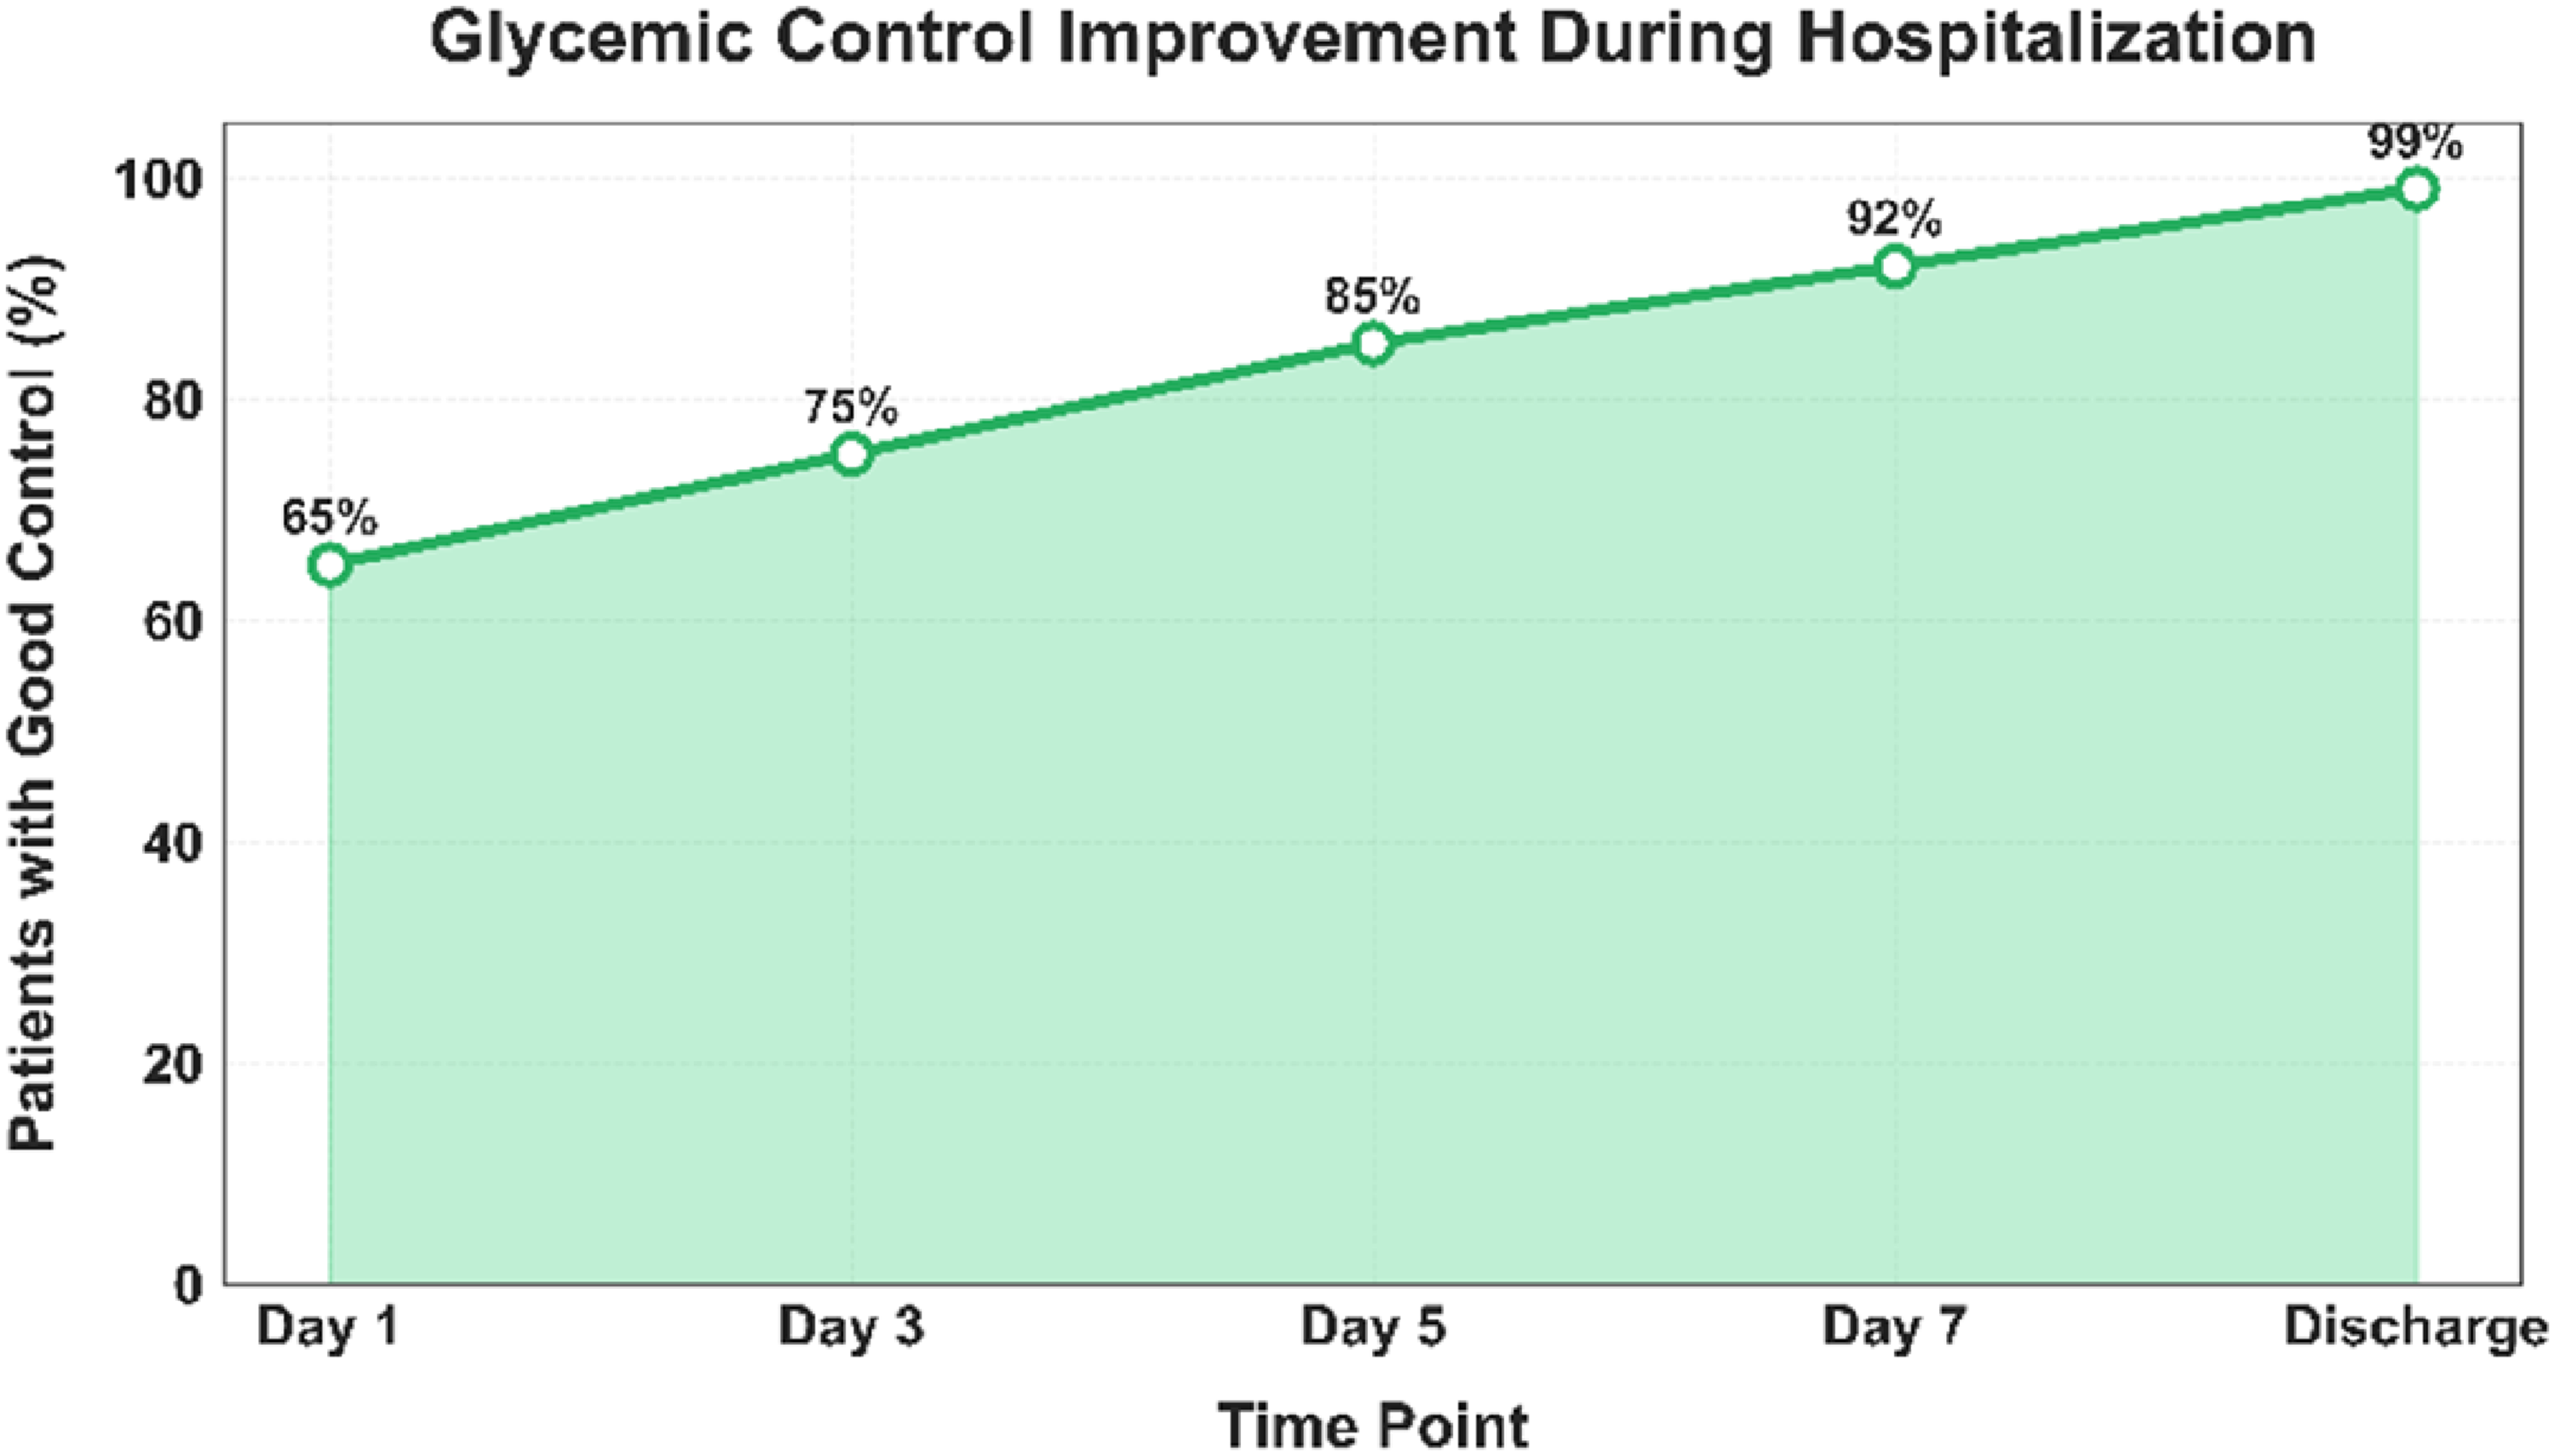
Examination of improvement in glycemic control in the hospital.
Discussion
The research is clinically useful regarding the intricate relationship among cancer treatment, the duration of diabetes, comorbid burden, and the pharmacotherapy patterns in cancer patients. It is evident that the presence of metabolic dysregulation across an extended period of diabetes duration and age is the most prevalent background problem in oncology cases, as demonstrated by the use of a larger number of patients with mid-range length of diabetes and older age. The excessive dependence on chemotherapy and intensive use of corticosteroids also justify the glycemic fluctuation that is observed and emphasize metabolic stress caused by the treatment as a key clinical issue. The close comorbidity of hypertension and other comorbidities is indicative of a multidimensional disease burden that makes it difficult to decide on therapy and high chances of polypharmacy and drug-related issues. The lowering level of fasting and postprandial glucose levels during hospitalization is found, which is possibly due to the fact that the systematic monitoring of this population, pharmacological variations, and multidisciplinary strategies. This can be very effective to obtain metabolic stability. Furthermore, a high rate of metformin and sulfonylureas use demonstrates the adherence to the overall measures of the treatment of diabetes but still, the individual approach is required. In total, these findings demonstrated the necessity of the oncology-endocrine approach in order to minimize the number of complications, maximize the benefits of treatment and patient safety in clinical practice.
Conclusion
From this extensive research, the proposed research has critically evaluated glycemic control, treatment pattern, and medication related safety concerns in the oncology patients with co-morbid diabetes mellitus through prospective approach to include observational methodology. The analysis that included the presentation of demographic characteristics, duration of diabetes therapy, the distribution of cancer types, treatment methods, comorbidity levels, and the pattern of pharmacotherapy provided a comprehensive clinical image of the metabolic control of diabetes in a tertiary care oncology unit. It has been shown during the discussion that exposure to chemotherapy, the use of corticosteroids, and polypharmacy were significant contributors to glycemic variability and complexity of the therapeutic regimen. Monitoring of fasting and postprandial glucose levels during the hospitalization enabled to assess the response to the treatment and it was demonstrated to be the efficiency of the multidisciplinary clinical interventions to stabilize the metabolic parameters. More so, the evaluation of antidiabetic drug use and comorbidity overlap provided a feasible data that indicated the patterns of on-the-job prescribing as well as the burden of comorbidity disease on cancer patients. All these results prove the importance of integrative treatment of cancer and diabetes, regular review of the prescribed drugs, and customization of treatment based on a person to improve the clinical results and reduce the number of complications that can be avoided. Overall, optimal glycemic control is observed to be improved during admission and discharge (65 over 99), average fasting and postprandial glucose levels had reduced by an average of 50 mg/dl and 60 mg/dl respectively during the time span of hospitalization.
Future forecasting of the research
Finally, the proposed statistical research can be further expanded in the future with specific focus on the longitudinal follow-ups of the oncology patients that are acquired with continuous glucose monitoring devices and that are combined with predictive analytics. This will give a predictive of the glycemic variability during different chemotherapy courses. The research would be improved in terms of generalizability in case it is conducted in more centers with larger populations that would be more representative. Moreover, creating the clinical decision-support systems that can combine metabolic, pharmacological and oncological values could help plan the treatment more individually. Further, effectively identifies drug-associated complications earlier in diabetic cancer patients.
Footnotes
Acknowledgements
Not Applicable.
Ethical statement
Ethical approval for the study was obtained from the Institutional Ethics Committee of Thangam Cancer Center, Namakkal District. As the study involved an observational review of hospitalized patient medical records without direct patient intervention, the requirement for obtaining individual informed consent was waived by the Institutional Ethics Committee.
Author contributions
Author 1: S. Anandkumar: He performed the conceptualization, Methodology, Data collection and writing the study.
Author 2: P. Shobana: She analysis the dataset and conceptualization in the study.
Author 3: B.Tharun: He Performed the Analysis the overall concept, writing and editing.
Author 4: M.Vijayasakthi: She analysis the paper and supervisor of this paper.
Author 5: R.Kaviya: She analysis the paper and supervisor of this paper.
Author 6: P.Ajitkumar: He Performed the Analysis the overall concept.
Funding
The authors received no financial support for the research, authorship, and/or publication of this article.
Declaration of conflicting interests
The authors declared no potential conflicts of interest with respect to the research, authorship, and/or publication of this article.
Data sharing statement
The corresponding author is not permitted to share the data.